transmission & distribution - microsoft · 1. transmission base ... fleege direct and schedules...
TRANSCRIPT

Direct Testimony and Schedules Christopher E. Fleege
Before the Minnesota Public Utilities Commission
State of Minnesota
In the Matter of the Application of Minnesota Power for Authority to Increase Rates for Electric Utility
Service in Minnesota
Docket No. E015/GR-16-664
Exhibit ______
TRANSMISSION & DISTRIBUTION
November 2, 2016
Table of Contents
Page
i Docket No. E015/GR-16-664
Fleege Direct and Schedules
I. INTRODUCTION ............................................................................................................. 1
II. TESTIMONY OVERVIEW .............................................................................................. 3
III. TRANSMISSION AND DISTRIBUTION OVERVIEW ................................................. 3
A. Transmission Function Overview .......................................................................... 4
B. Distribution Function Overview ............................................................................ 8
IV. POWER DELIVERY CAPITAL INVESTMENTS .......................................................... 9
A. Transmission Capital Investments ......................................................................... 9
1. Transmission Base ................................................................................... 14
2. Reliability Requirement ........................................................................... 15
a. Badoura 115 kV Transmission Project ........................................ 15
b. Savanna 115 kV Transmission Project ........................................ 18
c. Deer River 115 kV Transmission Project .................................... 21
d. Straight River 115 kV Transmission Project ............................... 26
e. NERC Required Projects ............................................................. 28
f. North Shore Loop ........................................................................ 35
3. New Business or Customer Need ............................................................ 40
a. Nashwauk 230 kV/115 kV Transmission Facility Projects ......... 40
b. 39 Line 115 kV Transmission Facility Project ............................ 45
c. Canisteo 115kV Transmission Facility Project ............................ 51
4. Regional Expansion Projects ................................................................... 54
a. Bemidji – Grand Rapids 230 kV Transmission Project ............... 54
b. Monticello – Fargo 345 kV Transmission Facility Project .......... 57
B. Distribution Capital Investments ......................................................................... 59
1. Distribution Infrastructure ....................................................................... 62
2. Advanced Metering Infrastructure and Technologies .............................. 64
3. Customer Service CIS/CC&B Capital Project ......................................... 66
V. POWER DELIVERY O&M EXPENSE BUDGETS ...................................................... 68
A. Transmission O&M Expense Budget .................................................................. 69
B. Distribution O&M Expense Budget..................................................................... 70
C. Vegetation Management ...................................................................................... 70
D. Storm Restoration ................................................................................................ 72

Table of Contents (cont’d)
Page
ii Docket No. E015/GR-16-664
Fleege Direct and Schedules
VI. OTHER COMPLIANCE REQUIREMENTS ................................................................. 74
A. FERC Return on Equity ....................................................................................... 74
B. MISO Participation .............................................................................................. 76
VII. COST CONTAINMENT EFFORTS ............................................................................... 77
VIII. CONCLUSION ................................................................................................................ 81

1 Docket No. E015/GR-16-664
Fleege Direct and Schedules
I. INTRODUCTION 1
Q. Please state your name and business address. 2
A. My name is Christopher E. Fleege, P.E. My business address is 30 West Superior 3
Street Duluth, MN 55802. 4
5
Q. By whom and in what capacity are you employed? 6
A. I work for ALLETE, Inc., doing business as Minnesota Power (“Minnesota Power” or 7
the “Company”). My current position is Minnesota Power Vice President, 8
Transmission and Distribution. I also provide executive leadership for Customer 9
Service Operations which includes the Minnesota Power: Call Center, Credit & 10
Collections, and the Customer Care & Billing (“CC&B”) Systems. 11
12
Q. Please summarize your educational and professional background. 13
A. I graduated from the University of North Dakota with a degree in civil engineering. I 14
have also earned a Master of Business Administration from the University of 15
Minnesota–Duluth. I joined Minnesota Power in 1991 as a Civil Engineer and 16
became a Supervising Engineer in 1998. In 1999, I was promoted to Manager of 17
Engineering Services and led the corporate engineering department until accepting 18
full responsibility for the Rapids Energy Center-UPM steam facility operation in 19
Grand Rapids, Minnesota in 2004. I was promoted to General Manager of 20
Renewable Operations in 2006 and was responsible for Minnesota Power’s 21
hydroelectric power, co-generation, and wind operations, including construction of 22
the Taconite Ridge Energy Center. I was promoted to President of Superior Water, 23
Light & Power (“SWL&P”) in August of 2008, and to my current position in April 24
2010. I am a licensed professional engineer in Minnesota. 25
26
Q. What are your job responsibilities for Minnesota Power as they relate to this 27
proceeding? 28
A. In my current position, I provide the leadership and direction for day-to-day activities 29
of groups responsible for the power delivery, or transmission and distribution, 30
(“T&D”) systems and our customer service operations at Minnesota Power. In 31

2 Docket No. E015/GR-16-664
Fleege Direct and Schedules
addition, I am responsible for the development and integration of strategic and 1
operational plans that fulfill Minnesota Power’s business strategies and regulatory 2
requirements as they relate to power delivery. I am responsible for ensuring that we 3
operate and maintain our transmission and distribution systems to optimize Minnesota 4
Power’s system’s capability, performance, and reliability. I am also responsible for 5
ensuring we provide our customers with safe, reliable, and cost-effective products and 6
services. 7
8
Q. Have you sponsored any other comments or testimony before regulatory 9
commissions? 10
A. Yes. I have testified on behalf of ALLETE before the Federal Energy Regulatory 11
Commission (“FERC”) in Docket No. ER11-134-000 concerning ALLETE’s request 12
for: (1) 100 percent construction work in progress (“100% CWIP Recovery”); and 13
(2) recovery of abandoned plant costs (“Abandoned Plant Recovery”) for two 14
CapX2020 projects in which ALLETE was a participant. Specifically, ALLETE 15
requested, and FERC granted, 100% CWIP Recovery and Abandoned Plant Recovery 16
for the: (1) 68-mile, Bemidji, Minnesota to Grand Rapids, Minnesota 230 kV Project 17
(“Bemidji Project”); and (2) 250-mile, Fargo, North Dakota to Monticello, Minnesota 18
345 kV Project (“Fargo Project”).1 I also provided testimony on behalf of ALLETE 19
before FERC in Docket No. ER16-118-000 concerning ALLETE’s request for 100% 20
CWIP Recovery for the Great Northern Transmission Line (“GNTL”), a 224-mile, 21
500 kV transmission line between a point on the Minnesota-Manitoba border, 22
northwest of Roseau, Minnesota, and Minnesota Power’s existing Blackberry 23
Substation near Grand Rapids, Minnesota. 2 24
25
1 See ALLETE, Inc., 133 F.E.R.C. ¶ 61,270 (2010). The Fargo Project includes both the Fargo, North Dakota to
St. Cloud, Minnesota 345 kV Transmission Project (Docket No. E002,ET2/TL-09-1056) and the St. Cloud, Minnesota to Monticello, Minnesota 345 kV Transmission Project (Docket No. ET2,E002/TL-09-246).
2 See Midcontinent Indep. Sys. Operator & ALLETE, Inc., 153 F.E.R.C. ¶ 61,296 (2015).

3 Docket No. E015/GR-16-664
Fleege Direct and Schedules
II. TESTIMONY OVERVIEW 1
Q. Please summarize your testimony in this proceeding. 2
A. I provide testimony on the Company’s power delivery systems, including capital 3
investment and operations and maintenance (“O&M”) expenditures. My testimony 4
includes information that supports Minnesota Power’s prudent investment in local 5
and regional capital projects and maintenance of our power delivery systems. I am 6
also providing testimony on compliance items related to the FERC return on equity 7
(“ROE”) dockets and the benefits of the Company’s participation in the Midcontinent 8
Independent System Operator, Inc. (“MISO”). Finally, I provide testimony on the 9
Company’s cost containment efforts as they relate to the transmission, distribution, 10
and customer service departments. 11
12
Q. Are you sponsoring any exhibits in this proceeding? 13
A. Yes. I am sponsoring the following exhibits: 14
Exhibit ___ (CEF), Schedule 1 – Transmission Capital Investment Table 15
Exhibit ___ (CEF), Schedule 2 – North Shore Loop Transmission System 16
Exhibit ___ (CEF), Schedule 3 – Bemidji Project Cost Summary 17
Exhibit ___ (CEF), Schedule 4 – Storm Restoration Cost Information 18
Exhibit ___ (CEF), Schedule 5 – Wholesale Transmission Revenues and 19
Expenses 20
Exhibit ___ (CEF), Schedule 6 – Summary of Cost Control Efforts Related to 21
Power Delivery and Customer Service 22
Exhibit ___ (CEF), Schedule 7 – Service Center Map 23
24
III. TRANSMISSION AND DISTRIBUTION OVERVIEW 25
Q. What are the responsibilities of Minnesota Power’s Transmission and 26
Distribution Department? 27
A. The Transmission and Distribution Department is responsible for the maintenance, 28
management, and construction of Minnesota Power’s power delivery systems so that 29
energy is safely and reliably transmitted from generating resources (both Company-30
owned and third-party owned) to the distribution systems serving our customers. It is 31

4 Docket No. E015/GR-16-664
Fleege Direct and Schedules
also responsible for the residential and small commercial customer experience from 1
meter to billing. 2
3
Minnesota Power owns and operates an integrated transmission system that has 4
facilities primarily in Minnesota and portions in North Dakota. Minnesota Power 5
also operates a distribution system in northeastern Minnesota. The Transmission and 6
Distribution Department is focused on ensuring that the integrated power delivery 7
system is safe, reliable, and cost-effective. 8
9
Q. Are there any other groups that are within your responsibilities? 10
A. Although the Communications Infrastructure (“CI”) and Support Services groups 11
report directly to the Chief Operating Officer for Minnesota Power, all the 12
responsibility for the groups’ capital and O&M budgets are managed through the 13
Transmission and Distribution Department’s budgeting, approval process, and 14
controls. Both groups are almost entirely co-located within the Transmission and 15
Distribution Department. The CI group builds, operates, and maintains the 16
Company’s CI and systems, including Computer Networks, Voice Over Internet 17
Phones (“VOIP”), Mobile Radio System, Synchronous Optical Network (“SONET”), 18
Microwave System, and Energy Management System, including the Supervisory 19
Control and Data Acquisition System (“SCADA”). The Support Services group 20
includes: Fleet, Stores, Facility Management, Vegetation Management, and 21
Purchasing. The Support Services group provides centralized strategic sourcing and 22
other supply chain efficiencies. These services are critical to T&D operations and 23
work closely with my leadership team in the implementation of efficiency 24
improvements and cost containment efforts that I discuss later in my testimony. 25
26
A. Transmission Function Overview 27
Q. Please describe the areas within the transmission function and their key 28
functions. 29
A. There are five (5) different areas entirely within the transmission function. These 30
areas are: 31

5 Docket No. E015/GR-16-664
Fleege Direct and Schedules
(1) Power delivery, relay, and transmission structural engineering, responsible for 1
substation field engineering, construction support for capital projects, and 2
developing reliability-centered maintenance programs to ensure the health and 3
reliability of Company transmission assets; 4
(2) System performance and planning, responsible for life-cycle planning, 5
transmission system planning and budgeting, and addressing wholesale 6
customer transmission service concerns; 7
(3) Tech systems, responsible for providing Company field personnel to self-8
perform construction, maintenance, and emergency repairs for transmission 9
assets; 10
(4) Project management organization (“PMO”) and transmission business 11
support, responsible for managing capital projects, programs, and portfolios 12
through the life-cycle of a project, including all phases of capital project 13
construction and negotiated transmission service-related contracts with 14
generators, transmission owners, and other distribution utilities; and 15
(5) System operations, responsible for transmission operations for Minnesota 16
Power and SWL&P. 17
18
Q. What are the primary transmission capital investments that have contributed to 19
Minnesota Power’s need for a rate case? 20
A. It has been seven years since Minnesota Power filed its last rate case. Minnesota 21
Power has made significant capital investments over that time. These capital 22
investments include: (1) investments in transmission projects for which recovery of 23
some costs have been sought under Minnesota Power’s Transmission Cost Recovery 24
Rider (“TCR”); and (2) investments in small- to medium-sized incremental 25
transmission projects for system reliability, new business or customers, and 26
increasing requirements for transmission base projects. 27
28
Q. Please describe Minnesota Power’s transmission assets. 29
A. Minnesota Power is a vertically-integrated electric utility that owns and operates 30
electric transmission facilities in portions of Minnesota and North Dakota. SWL&P, 31

6 Docket No. E015/GR-16-664
Fleege Direct and Schedules
a Minnesota Power subsidiary, provides electric service to its retail customers and 1
owns transmission facilities in Wisconsin. Together, Minnesota Power and SWL&P 2
respectively own an integrated transmission system comprised of approximately 3
2,921 miles of alternating-current (“AC”) transmission facilities operating at voltages 4
between 115 kilovolts (“kV”) and 500 kV, and approximately 177 transmission and 5
distribution substations (the “Transmission System”). Minnesota Power and SWL&P 6
are transmission-owning members of MISO. The integrated Transmission System 7
has been under the functional control of MISO since it began operations in February 8
2002. Service on the Minnesota Power and SWL&P Transmission System is open 9
access, and transmission service reservations can be requested and approved under 10
the terms of the MISO Tariff. 11
12
Minnesota Power also owns and operates a high-voltage direct-current (“HVDC”) 13
system that has a nominal rating of 550 megawatts (“MW”) at 250 kV. The 465-mile 14
DC line connects the converter terminals in Center, North Dakota and Duluth, 15
Minnesota. Minnesota Power acquired 100 percent ownership of the HVDC system 16
in January 2010. It is used primarily to transmit wind energy from Center, North 17
Dakota to Duluth, Minnesota.3 18
19
Q. Please describe the drivers of Minnesota Power’s transmission investments. 20
A. It is imperative that the Company maintain and improve the reliability of our 21
Transmission System. To achieve this, we are continually studying our Transmission 22
System to identify projects that are necessary to comply with mandatory reliability 23
standards set by the North American Electric Reliability Corporation (“NERC”) and 24
FERC. 25
26
Many of our transmission facilities were placed in service during the 1960s and 1970s 27
and are reaching the end of their useful life. Over the next years, we will continue to 28
3 See In the Matter of Minn. Power’s Petition to Purchase Square Butte Cooperative’s Transmission Assets and
for Restructuring Power Purchase Agreements from Milton R. Young Unit 2 Generating Station, ORDER
GRANTING PETITION WITH CONDITIONS, Docket No. E015/PA-09-526 (Dec. 21, 2009).
7 Docket No. E015/GR-16-664
Fleege Direct and Schedules
examine our existing facilities and make the necessary upgrades to ensure reliability 1
is not jeopardized. As we upgrade these aging assets, we will do so with an eye 2
towards modernization by installing facilities that allow operators to monitor and 3
respond quickly to maintenance needs and outages on the Transmission System. 4
5
Q. Have any recent events resulted in changes in the way the Company evaluates its 6
transmission assets? 7
A. Yes. Minnesota Power has identified a number of local transmission upgrades that 8
will be required as the Company transitions our generation fleet to meet the 9
EnergyForward generation targets that will impact our smaller coal generating 10
stations. 11
12
In addition, the nation’s generation mix is anticipated to undergo unprecedented 13
changes in response to the U.S. Environmental Protection Agency’s (“EPA”) Clean 14
Power Plan and other market forces. Minnesota Power will continue to work with 15
other utilities in the region and with MISO to identify and develop the necessary 16
transmission improvements. Our proactive investment in the Transmission System 17
will provide our customers access to least-cost and diverse generation resources. 18
19
Finally, Minnesota Power has undertaken additional evaluations related to 20
Transmission System security. The decision to undertake this evaluation was a result 21
of a 2013 sniper attack in California that knocked out 17 large transformers that 22
powered Silicon Valley. 23
24
Q. Can you describe the customers served by the Transmission System? 25
A. The Transmission System serves the following two customer groups: (1) retail native 26
loads; and (2) the loads of other investor-owned utilities, cooperatives, and municipal 27
load-serving entities, or wholesale customers. The wholesale customers comprise 28
approximately 16.5 percent of the total demand on the Minnesota Power 29
Transmission System, with the remaining demand comprised of retail native load 30
customers. From a transmission planning and transmission service perspective, our 31

8 Docket No. E015/GR-16-664
Fleege Direct and Schedules
retail customers and the wholesale customers require the same level of service, and as 1
a result, the system is planned to serve the needs of each type of customer equally. 2
3
Q. Please describe MISO and its role with respect to the Transmission System. 4
A. The Company is a transmission-owning member of MISO. This means that while 5
Minnesota Power owns and maintains transmission assets, MISO operates the 6
combined system, in conjunction with the transmission systems of the other 50 7
transmission owners. Furthermore, MISO establishes: (1) the process and rules for 8
wholesale customers to access the Transmission System on a non-discriminatory 9
basis; (2) the annual transmission planning process for expanding or upgrading the 10
regional transmission system, which includes the Transmission System (i.e., MISO 11
Transmission Expansion Plan (“MTEP”)); and (3) the policies and procedures that 12
provide for the allocation of costs incurred to construct certain transmission upgrades 13
and the distribution of revenues associated with those costs. 14
15
B. Distribution Function Overview 16
Q. Please describe the Minnesota Power distribution system. 17
A. The distribution system includes substation, transformers, wires, poles, metering, and 18
other equipment involved in delivering energy products and services to our electric 19
customers. Minnesota Power’s distribution system is comprised of over 5,800 miles 20
of distribution lines, 201 distribution substations, and approximately 125,000 poles 21
owned by Minnesota Power along with another approximately 25,000 poles used by 22
Minnesota Power but owned by others (“Distribution System”). These assets serve 23
approximately 145,000 electric customers across northeastern and central Minnesota. 24
The region spans over 26,000 square miles from International Falls in the north to 25
Royalton in the south and from Duluth in the east to as far west as the Long Prairie 26
and Park Rapids communities. The customer areas are geographically separated by 27
long distances. 28
29

9 Docket No. E015/GR-16-664
Fleege Direct and Schedules
Q. Describe the distribution function objectives. 1
A. The distribution function is responsible for the safe and reliable delivery of energy 2
from the Transmission System to our customers. There have been recent examples 3
that demonstrate the critical services and mission that the distribution function plays 4
in providing and restoring service to customers. Hurricane Sandy and the following 5
tropical storm caused approximately 8.5 million customers in the mid-Atlantic and 6
Northeast to lose power. Through mutual aid agreements, we sent our distribution 7
crews to the impacted areas to restore service for over three weeks in 2012. Closer to 8
home, we have dispatched our crews to assist Xcel Energy dozens of times over the 9
past six years, during storm events in the Twin Cities and in southern Wisconsin. In 10
July 2016, we requested mutual aid from as far away as Missouri to address 11
widespread outages experienced by approximately 46,000 Minnesota Power 12
customers as a result of the worst storm to affect the Company’s power delivery 13
system in the Duluth area for at least 15 years. 14
15
Q. Please describe the organization and responsibilities of the distribution function. 16
A. The distribution function is structured around the following key groups: Operations, 17
Engineering, Business Operations, and Planning and Performance. 18
19
Minnesota Power serves customers by making prudent investments in the Distribution 20
System to add capacity, maintain and improve reliability, and replace assets as 21
necessary to maintain safe system performance. We also perform routine 22
maintenance activities on the Distribution System, which lowers the cost of operation 23
over the long term and helps mitigate reliability issues. 24
25
IV. POWER DELIVERY CAPITAL INVESTMENTS 26
A. Transmission Capital Investments 27
Q. What is the purpose of this section of your testimony? 28
A. In this section, I outline the historic capital investments made to the Transmission 29
System and discuss the key capital projects being placed in service prior to the end of 30
the 2017 test year. Cost estimates, unless otherwise noted, do not include allowance 31

10 Docket No. E015/GR-16-664
Fleege Direct and Schedules
for funds used during construction (“AFUDC”) or indirect project costs, including 1
internal Minnesota Power overheads and labor allocations. Final and adjusted costs, 2
unless otherwise noted, include AFUDC and all project internal costs. All costs, 3
actuals, budgets, or forecasts are Total Company, 4 unless otherwise noted. 4
Additionally, for projects with original cost estimates provided to the Minnesota 5
Public Utilities Commission (“Commission”) in either a Route Permit or Certificate 6
of Need (“CoN”) proceeding, I provide final costs that have been adjusted, using the 7
Handy-Whitman Index, to the dollars (year) in which we provided the original 8
estimate. 9
10
Q. What type of capital investments are made by transmission? 11
A. Minnesota Power’s capital investments fall into two types. The first are large capital 12
projects that are often multi-year projects. These projects are capital-intensive and 13
are aimed at improving the Transmission System, upgrading existing facilities to meet 14
NERC compliance requirements and to accommodate new generation, replacing 15
aging facilities, and making improvements to communication infrastructure and 16
physical security. 17
18
The second are smaller capital projects done over a shorter period of time. These 19
smaller projects make up a majority of the total number of projects that the 20
transmission function completes each year. However, these smaller projects make up 21
only a minor part of our overall capital budget. 22
23
Both of these capital project categories require investments in transmission line 24
components, such as poles, conductors, switches, relays, and land rights for 25
transmission line easements. They also include investments in substation 26
components, such as transformers, capacitor banks, circuit breakers, remote terminals, 27
and real property. 28
29
4 “Total Company” refers to total Minnesota Power regulated, without Minnesota Power’s non-regulated
entities.

11 Docket No. E015/GR-16-664
Fleege Direct and Schedules
Q. Since the last Minnesota Power rate review was filed, what were the 1
transmission function’s key strategic goals driving the Company’s capital 2
investments? 3
A. The transmission function is focused on maintaining the reliability and resiliency of 4
the Transmission System. Since 2010, the Company’s planned capital investments 5
have been attributed to major regional expansion and reliability projects, such as the 6
CapX2020 group of projects5 and other regional reliability projects. The CapX2020 7
projects are 230 kV and 345 kV transmission line projects that provide necessary 8
upgrades to the regional transmission system to support local reliability, regional 9
reliability, and renewable generation outlet. Prior to the CapX2020 projects, there 10
had not been a major upgrade to the upper Midwest’s electric transmission grid in 11
nearly 40 years. These CapX2020 regional expansion projects were developed and 12
vetted through the MISO MTEP regional transmission planning processes. Our 13
investments in regional reliability projects are discussed in more detail later in my 14
testimony. 15
16
The Company also serves a disproportionately-higher percentage of industrial 17
customers, when compared to other Minnesota utilities. These industrial customers 18
have historically operated at a high capacity factor. These larger industrial customers 19
are in the competitive mining and forest product industries. These customers are 20
often interconnected at transmission voltages and, therefore, fall under the NERC 21
operating and reliability requirements. Over the past five years, the Company has 22
been actively supporting a significant number of customer interconnection requests 23
from these larger industrial and wholesale customers. 24
25
Q. What is the regulatory overlay with respect to system reliability? 26
A. Maintaining Transmission System reliability involves compliance with NERC 27
reliability standards. In 2007, FERC granted NERC the legal authority to enforce 28
reliability standards on all transmission owners. There are now over 100 mandatory 29
5 Minnesota Power participated in the Bemidji Project and the Fargo Project. There are two other 345 kV
transmission projects in the CapX2020 group of projects in which Minnesota Power did not participate.

12 Docket No. E015/GR-16-664
Fleege Direct and Schedules
reliability standards and over 1,000 sub-requirements, and NERC is actively engaged 1
in assessing penalties, both monetary and non-monetary for noncompliance. To 2
comply with NERC reliability standards, we continuously study the system because 3
changes in load growth, generation mix, and existing transmission infrastructure can 4
occur each year. These changes can impact whether upgrades are needed to maintain 5
NERC compliance. 6
7
Q. How does the transmission function categorize its capital investments? 8
A. Based on the drivers that I discussed above, our capital projects fall into capital 9
categories depending on the main purpose of the project. These groupings are: 10
11
(1) Transmission Base: This category is primarily for managing the health and 12
performance of transmission assets. The main goal is to ensure that critical 13
assets, including transmission lines, substations, and other related assets, meet 14
reliability and capacity requirements, while minimizing life-cycle costs. 15
16
(2) Reliability Requirement: These are projects that are constructed to ensure that 17
the Transmission System is compliant with all NERC reliability standards. 18
Any entity found non-compliant may be subject to fines of up to $1 million 19
per day per violation. 20
21
(3) New Business or Customer Need: This category includes projects that we are 22
required to construct under the FERC Open Access Transmission Tariff 23
(“OATT”) to accommodate the interconnection requests from generators, 24
transmission lines, and new load. Investments are often sizeable and 25
significant to serve these retail and wholesale customers. Investments are 26
often also planned to support local reliability needs. 27
28
(4) Regional Expansion: This category includes major high-voltage transmission 29
line projects developed through the regional planning process and seeks to 30
serve multiple needs, including regional and local reliability and renewable 31

13 Docket No. E015/GR-16-664
Fleege Direct and Schedules
energy outlet. These are multi-year initiatives and the types of projects for 1
which we seek a CoN and/or Route Permit from the Commission. 2
3
(5) Other: This category includes transmission facilities that are primarily 4
generator outlet lines and interconnection facilities. This includes other sole-5
use non-network transmission facilities specific to individual customers’ 6
interconnections. 7
8
Many of Minnesota Power’s capital projects serve multiple purposes, but for 9
budgeting purposes we classify the capital project according to the purpose that 10
initiated its development. Minnesota Power (Total Company) capital investments in 11
these projects from 2010 to 2015 (actual), 2016 (forecast), and 2017 (test year 12
budget) are provided in Exhibit ___ (CEF), Schedule 1 to my Direct Testimony. 13
14
Q. Are some of the projects for which Minnesota Power seeks base rate recovery in 15
this case previously included in the Company’s TCR? 16
A. Yes. Minnesota Power’s proposal for transferring TCR costs to base rates is 17
discussed in the Direct Testimony of Company witness Herbert Minke. For projects 18
that are eligible for TCR recovery and are placed in service between December 31, 19
2016, and December 31, 2017, Minnesota Power will include those in a subsequent 20
TCR filing and requests that they not be moved into base rates, at this time. 21
22
Q. If Mr. Minke is discussing the proposal for transferring rider costs, what is the 23
purpose of your testimony with respect to transmission project cost recovery? 24
A. I am providing testimony to explain costs that were incurred to construct these 25
projects. While the Commission allowed us to recover, within the TCR Rider, our 26
share of the costs identified in the Commission-approved CoNs, the Commission has 27
not allowed us to recover, within the rider, costs for construction in excess of those 28
amounts and other internal labor expenses. To the extent all, or portions of, 29
transmission project costs were not previously approved for recovery in the TCR, the 30
Company is now seeking recovery of those amounts in this rate review and is 31

14 Docket No. E015/GR-16-664
Fleege Direct and Schedules
providing justification for those additional costs. I am also providing cost 1
information for major transmission capital projects that are not TCR-eligible. 2
Overall, I support base rate recovery of transmission projects placed in service by 3
December 31, 2017, and not previously included in Minnesota Power’s base rates. 4
5
1. Transmission Base 6
Q. What types of projects are included in transmission base? 7
A. These projects are typically smaller capital projects done over a shorter period of 8
time. These smaller projects make up a majority of the total number of projects that 9
the transmission function completes each year. Transmission Base projects have 10
traditionally made up only a modest portion of our overall capital budget. Some 11
examples of these smaller projects include replacement of one or two structures or 12
cross-arms due to age, condition, or damage. These types of capital projects require 13
investments in transmission line components, such as poles, conductors, switches, 14
relays, and land rights for transmission line easements. They also include 15
investments in substation components such as transformers, capacitor banks, circuit 16
breakers, remote terminals, communication fiber systems, and real property. 17
18
This past year, we needed to replace a number of large transformers that are reaching 19
end-of-life. We are also in the process of replacing two damaged HVDC converter 20
transformers at the Square Butte Substation facility near Center, North Dakota that 21
are just over 38 years old. For the last seven years, we have had an on-going program 22
for replacement of our circuit breakers, investing approximately $1 million per year. 23
24
Q. Why were the 2013 actual investments in transmission base higher than other 25
historic years? 26
A. Investments in 2013 included almost $11.0 million dollars in investments in the 27
HVDC upgrades, which included new bushing replacements for the converter 28
transformers and replacement for poly-chlorinated biphenyl capacitor banks at the 29
facility. Additional work included the separation of the Square Butte HVDC facility 30
from the Minnkota Power Cooperative facility. A new control center was added and 31

15 Docket No. E015/GR-16-664
Fleege Direct and Schedules
the control wiring was migrated into the Minnesota Power HVDC system. These 1
large capital project investments are often coordinated on a five-year outage cycle 2
with the Minnkota Power Cooperative Milton R Young facility in Center, North 3
Dakota. 4
5
Q. Are there any major capital investments driving the 2016 forecast or the 2017 6
budget? 7
A. Included in the 2016 forecast were transmission projects that are necessary to support 8
the idling and eventual closure of Minnesota Power’s North Shore coal-fired 9
generation. These projects included those discussed and referenced as the “North 10
Shore Loop” in my testimony. There were also a significant number of transformers 11
that experienced “short circuit” faults and required unplanned replacement in 2016. 12
The 2017 budget has a number of reliability projects driving the T&D budgets for the 13
next number of years. For example, the Company has budgeted $4.4 million dollars 14
for the 15 Line 115 kV transmission line replacement. This is a three-year project 15
that will require many of the current structures to be replaced and the entire line to be 16
reconductored. However, the most significant capital project for 2016 and 2017 is the 17
GNTL, which will begin construction in late 2016 or early 2017. 18
19
2. Reliability Requirement 20
a. Badoura 115 kV Transmission Project 21
Q. Please describe the Badoura 115 kV Transmission Project (“Badoura Project”). 22
A. The Badoura Project was certified by the Commission in 2006 in Docket No. 23
ET2,E015/TL-05-867, under the biennial transmission planning process established in 24
Minn. Stat. § 216B.2425 and Minn. R. ch. 7848. This effort was a joint project 25
between Minnesota Power and Great River Energy with ownership divided by 26
segments. 27
28
The Badoura Project consists of approximately 63 miles of overhead 115 kV 29
transmission line and associated substation modifications between the endpoints of 30
Pequot Lakes, Pine River, Badoura, Hackensack, and Park Rapids. The project 31

16 Docket No. E015/GR-16-664
Fleege Direct and Schedules
connects the Pequot Lakes Substation, located northeast of Pequot Lakes, a new Pine 1
River Substation, located southwest of Pine River, the Badoura Substation, the Birch 2
Lake Substation, located east of Hackensack, and the Long Lake Substation, located 3
east of Park Rapids, all in Minnesota. 4
5
Q. What segments of the Badoura Project does Minnesota Power own? 6
A. Minnesota Power owns two transmission segments, the Pequot Lakes Substation to 7
Pine River Substation 9-mile, 115 kV transmission line and the Pine River Substation 8
to Badoura Substation 21-mile, 115 kV transmission line. Minnesota Power also 9
owns the Pequot Lakes Substation, the Badoura Substation, and the new Pine River 10
115kV/34.5 kV Substation. 11
12
Q. Why was the Badoura Project needed? 13
A. Load growth in the Park Rapids area has resulted in a considerable increase in 14
electrical use in the region. The historic transmission and distribution systems were 15
not adequate to support voltage within acceptable levels based on projected load 16
growth rates without the addition of the Badoura Project. Minnesota Power’s and 17
Great River Energy’s customers in the Park Rapids and surrounding area now benefit 18
from the addition of the 115 kV transmission line and associated substation upgrades. 19
20
Q. What was the initial estimate for the total Badoura Project? 21
A. The total Badoura Project was estimated to cost between $36.3 million and $42.3 22
million in 2007 dollars, without AFUDC or internal costs. 23
24
Q. What is Minnesota Power’s share of the total Badoura Project cost estimate? 25
A. Minnesota Power’s share of the total project cost was estimated to come in at or 26
below $22 million, in 2007 dollars. In 2008, Minnesota Power updated its cost 27
estimate to $23.35 million (Docket No. E015/M-08-1176), in 2009 dollars, to include 28
price increases in structural steel and transformer prices for the Pine River Substation 29
($350,000 increase), a revised layout for the Badoura Substation (from a single bus 30
design with a tie breaker to a ring bus design) ($1.0 million increase), and an increase 31
17 Docket No. E015/GR-16-664
Fleege Direct and Schedules
in commodity prices related to structural steel and transformers ($1.0 million 1
increase). These cost increases were partially offset by a decrease in the amount 2
spent on preconstruction activities ($1.0 million reduction). 3
4
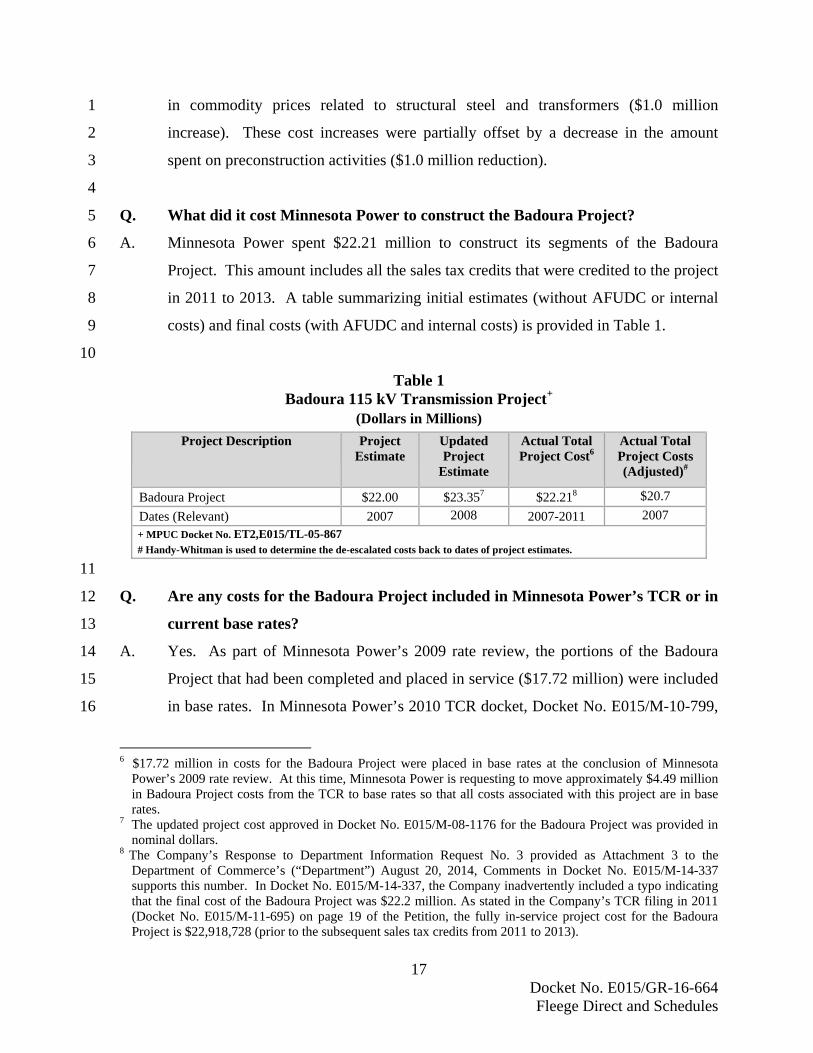
Q. What did it cost Minnesota Power to construct the Badoura Project? 5
A. Minnesota Power spent $22.21 million to construct its segments of the Badoura 6
Project. This amount includes all the sales tax credits that were credited to the project 7
in 2011 to 2013. A table summarizing initial estimates (without AFUDC or internal 8
costs) and final costs (with AFUDC and internal costs) is provided in Table 1. 9
10
Table 1 Badoura 115 kV Transmission Project+
(Dollars in Millions)
Project Description
Project Estimate
Updated Project
Estimate
Actual Total Project Cost6
Actual Total Project Costs (Adjusted)#
Badoura Project $22.00 $23.357 $22.218 $20.7
Dates (Relevant) 2007 2008 2007-2011 2007
+ MPUC Docket No. ET2,E015/TL-05-867
# Handy-Whitman is used to determine the de-escalated costs back to dates of project estimates.
11
Q. Are any costs for the Badoura Project included in Minnesota Power’s TCR or in 12
current base rates? 13
A. Yes. As part of Minnesota Power’s 2009 rate review, the portions of the Badoura 14
Project that had been completed and placed in service ($17.72 million) were included 15
in base rates. In Minnesota Power’s 2010 TCR docket, Docket No. E015/M-10-799, 16
6 $17.72 million in costs for the Badoura Project were placed in base rates at the conclusion of Minnesota
Power’s 2009 rate review. At this time, Minnesota Power is requesting to move approximately $4.49 million in Badoura Project costs from the TCR to base rates so that all costs associated with this project are in base rates.
7 The updated project cost approved in Docket No. E015/M-08-1176 for the Badoura Project was provided in nominal dollars.
8 The Company’s Response to Department Information Request No. 3 provided as Attachment 3 to the Department of Commerce’s (“Department”) August 20, 2014, Comments in Docket No. E015/M-14-337 supports this number. In Docket No. E015/M-14-337, the Company inadvertently included a typo indicating that the final cost of the Badoura Project was $22.2 million. As stated in the Company’s TCR filing in 2011 (Docket No. E015/M-11-695) on page 19 of the Petition, the fully in-service project cost for the Badoura Project is $22,918,728 (prior to the subsequent sales tax credits from 2011 to 2013).
18 Docket No. E015/GR-16-664
Fleege Direct and Schedules
the Commission approved inclusion of on-going expenses related to the three 1
remaining portions of the Badoura Project, excluding internal capitalized costs. 2
3
Q. When was the Badoura Project placed in service? 4
A. The first portion of the Badoura Project was placed in service in 2009. The three 5
remaining project segments were placed in service in 2011. 6
7
Q. Did Minnesota Power prudently incur the costs it spent to complete the Badoura 8
Project? 9
A. Yes. The costs incurred by the Company to complete the Badoura Project were 10
prudently and reasonably incurred to complete this necessary project, and the 11
majority were previously approved for cost recovery. In this Docket, Minnesota 12
Power requests that the Badoura Project costs currently being collected in the TCR, as 13
well as all internal labor and costs that were previously excluded for cost recovery 14
through the TCR, be included in Minnesota Power base rates and recovered in full. 15
16
b. Savanna 115 kV Transmission Project 17
Q. Please describe the Savanna 115 kV Transmission Project (“Savanna Project”). 18
A. The Savanna Project was approved by the Commission in Docket Nos. 19
ET2,E015/CN-10-973 and ET2,E015/TL-10-1307. This project was a joint project 20
between Minnesota Power and Great River Energy with ownership divided by 21
segments. Minnesota Power is the sole owner of the new Savanna 115 kV Switching 22
Station near Floodwood, Minnesota, and the upgrades to the Minnesota Power 9 Line, 23
between the Savanna Switching Station and the Floodwood Tap (“9 Line Tap 24
Upgrades”). 25
26
Q. When was the Savanna Project placed in service? 27
A. The Savanna Switching Station and two related 115 kV line extension projects were 28
placed in service in 2013. The 9 Line Tap Upgrades could not be constructed until 29
Great River Energy completed construction of its main segment of the project, a new 30

19 Docket No. E015/GR-16-664
Fleege Direct and Schedules
Savanna – Cromwell 115 kV Line. The 9 Line Tap Upgrades will be completed and 1
in-service prior to the end of 2016. 2
3
Q. What was the initial estimate for the total Savanna Project? 4
A. The Savanna Project was estimated to cost $29 million, in 2010 dollars. 5
6
Q. What is Minnesota Power’s share of the total Savanna Project cost estimate? 7
A. Minnesota Power’s share of the total project cost was estimated to come in at or 8
below $4.1 million, in 2010 dollars, without AFUDC or internal costs. 9
10
Q. What did it cost Minnesota Power to construct the Savanna Project? 11
A. Minnesota Power spent $5.08 million, in nominal dollars, to construct its segments of 12
the Savanna Project between the years 2012 and budgeted 2016. Using the Handy-13
Whitman Indices to account for inflation, the Savanna Project costs are equivalent to 14
$4.72 million in 2010 dollars, approximately $0.62 million above the original 15
estimate of $4.10 million in 2010 dollars. The original estimate and final costs are 16
summarized in Table 2. 17
18
Table 29 Savanna 115 kV Transmission Project+
(Dollars in Millions)
Project Description
CoN Project
Estimate
Route Permit Project
Estimate
Actual Total Project Cost
Actual Total Project Costs (Adjusted)#
Savanna Project $4.10 N/A $5.08 $4.72
Dates (Relevant) 2010 2012-2016 2010 # Handy-Whitman is used to determine the de-escalated costs back to dates of project estimates.
+ MPUC Docket No. ET2,E015/CN-10-973 and ET2,E015/TL-10-1307
19
Q. What contributed to the variance? 20
A. Following acquisition of the CoN and Route Permit for the Savanna Project, and 21
during the engineering phase of the project, the Company identified that it would 22
9 Actual Total Project Cost includes the amount forecasted to be spent in 2016.

20 Docket No. E015/GR-16-664
Fleege Direct and Schedules
incur additional switching station costs. Specifically, the initial estimate provided in 1
the application inadvertently excluded labor costs. 2
3
However, the primary reasons for the cost increase can be attributed to the 4
development of a more detailed estimate for the switching station and unanticipated 5
magnitude of geographical challenges associated with the switching station site. 6
7
Q. Please explain how challenges encountered during construction of the Savanna 8
Project contributed to additional costs. 9
A. Construction of the switching station was found to be more challenging than 10
originally anticipated. Prior to development of the Savanna Project, the Floodwood 11
area was served by a single 115 kV line. The Savanna Switching Station was 12
constructed and interconnected to this 115 kV line. With no redundant connection at 13
the time, construction of the switching station had to be staged so as to minimize 14
interruption to the Floodwood-area customers served from the single 115 kV line. 15
This resulted in several intermediate steps and a need for live line work that are not 16
typical for new construction and are more expensive. 17
18
The construction of the Savanna – Cromwell 115 kV Line by Great River Energy – 19
which could not be completed until the Savanna Switching Station was constructed – 20
has alleviated these concerns in the Floodwood area for the foreseeable future. In 21
addition to the complexity of construction at the switching station site, the site itself 22
was found to be much wetter than anticipated. This led to site access and 23
development costs in excess of what would be typical for a site with less extensive 24
wetland characteristics. 25
26
Q. Can you provide a breakdown of the cost increases for the Savanna Project? 27
A. Yes. The quantifiable cost increases associated with the Savanna Project construction 28
are summarized in Table 3. The original estimate did not include AFUDC or 29
overheads that get assigned to every completed project. I have identified these 30

21 Docket No. E015/GR-16-664
Fleege Direct and Schedules
quantifiable amounts, which are included in the forecasted cost of $5.08 million, in 1
this table. 2
3
Table 3 Savanna Cost Summary
Cost Driver Estimated Cost
Impact
Construction in wet conditions (matting) $87,000
Labor costs not included in estimate $500,000
Equipment not included in estimate $81,000
Project indirect charges (AFUDC, Company overheads) $316,000
4
Q. Were any costs for the Savanna Project included in Minnesota Power’s TCR? 5
A. Yes. Minnesota Power included $4.31 million (with AFUDC), the amount spent 6
through 2014, in its TCR. This amount was spent to complete three of the four 7
projects for which Minnesota Power was responsible. After de-escalating to 2010 8
dollars, this amount was under the CoN estimate. 9
10
Q. Did Minnesota Power prudently incur the costs it spent to complete the Savanna 11
Project? 12
A. Yes. The costs incurred by the Company to complete the Savanna Project were 13
prudently and reasonably incurred to complete this necessary project. 14
15
Q. What does the Company request the Commission do with the costs for the 16
Savanna Project? 17
A. Minnesota Power requests that the Commission allow the Company to recover the 18
Savanna Project costs in base rates. 19
20
c. Deer River 115 kV Transmission Project 21
Q. What is the Deer River 115 kV Transmission Project (“Deer River Project”)? 22
A. The Deer River Project includes: 23

22 Docket No. E015/GR-16-664
Fleege Direct and Schedules
Construction of a new 1-mile 115 kV transmission line from an existing 115 1
kV transmission line north of US Highway 2 and terminating at an existing 2
transmission line outside the Enbridge Deer River electrical substation; 3
Construction of a new 0.3-mile double-circuit 230 kV transmission line 4
between the existing 230 kV transmission line south of US Highway 2 and the 5
proposed Zemple Substation; 6
Removal of Minnesota Power’s existing Deer River 115 kV/23 kV Substation 7
and replacement with a new Minnesota Power Zemple 230 kV/115 kV/23 kV 8
Substation in the same location; and 9
Removal of an existing 7.5-mile 115 kV transmission line. 10
11
Q. Was a CoN obtained for the Deer River Project? 12
A. No, because the Deer River Project did not meet the statutory threshold criterion 13
requirements for the CoN as set forth in Minn. Stat. § 216B.243 and Minn. R. ch. 14
7849; therefore, a CoN was not required (or petitioned) for the Deer River Project. 15
However, Minnesota Power obtained a Route Permit for the Deer River Project from 16
the Commission in Docket No. E015/TL-13-68. 17
18
Q. Why was the Deer River Project needed? 19
A. Prior to construction of the Deer River Project, the Deer River area was served by a 20
single 7.5-mile-long, 115 kV line (“Deer River Tap”). The Deer River Tap was a 21
direct extension from a larger 30-mile 115 kV line connecting the Boswell Substation 22
and the Nashwauk Substation (“28 Line”). The Deer River Project was necessary to 23
address several issues with this configuration. 24
25
Q. What issues did the Deer River Project address? 26
A. There were four specific issues the project addressed: (1) limited capacity on the Deer 27
River Tap to serve multiple load-serving substations, including the Great River 28
Energy Cohasset Substation, the Minnesota Power Deer River 115/23 kV Substation, 29
the Great River Energy Deer River 115 kV/69 kV Substation, and three additional 30
substations that serve a single Enbridge pumping station facility (“Enbridge Deer 31

23 Docket No. E015/GR-16-664
Fleege Direct and Schedules
River Pump Station”); (2) limited capacity on the Deer River Tap to support a 1
planned expansion resulting in a significant increase in load requirements at the 2
Enbridge Deer River Pump Station; (3) difficulty associated with maintenance or 3
upgrade of the Deer River Tap due to the single-source arrangement of the system in 4
the Deer River area and outage restrictions associated with the Enbridge Deer River 5
Pump Station (in most cases, maintenance or upgrades would have to be done, at least 6
in part, while the line was energized in order to minimize disruption to customers in 7
the Deer River area); and (4) the number of load-serving taps and the total amount of 8
load served from the larger Boswell – Nashwauk 115 kV Line, which exceeded 9
Minnesota Power’s criteria of three total taps or 30 MW of total load. 10
11
As an alternative to rebuilding the Deer River tap and terminating it at the Boswell 12
Substation, the Zemple 230 kV/115 kV Substation provides significantly improved 13
reliability, redundancy, constructability, and long-term load-serving capability for the 14
Deer River area. Customers in the Deer River area are no longer subject to outages 15
anywhere along the 30-mile Boswell – Nashwauk 115 kV Line, and customers served 16
from the Boswell – Nashwauk 115 kV Line are no longer subject to outages on the 17
Deer River Tap. The parallel development of a 115 kV line between Great River 18
Energy’s Deer River 115 kV/69 kV Substation and the Enbridge Deer River Pump 19
Station further enhanced Minnesota Power’s ability to build the Zemple Substation 20
and operate and maintain the transmission system in the Deer River area for the 21
foreseeable future. 22
23
Q. What was Minnesota Power’s cost estimate for the Deer River Project at the 24
time the Route Permit was obtained? 25
A. Minnesota Power estimated the Deer River Project would cost $13.82 million 26
(without AFUDC and indirect overheads), in 2013 dollars. 27
28
Q. What is the current estimate for the total cost of the Deer River Project? 29
A. While the project has not yet been completed, Minnesota Power’s current estimate for 30
the complete Deer River Project is $16.65 million in nominal dollars, including actual 31
24 Docket No. E015/GR-16-664
Fleege Direct and Schedules
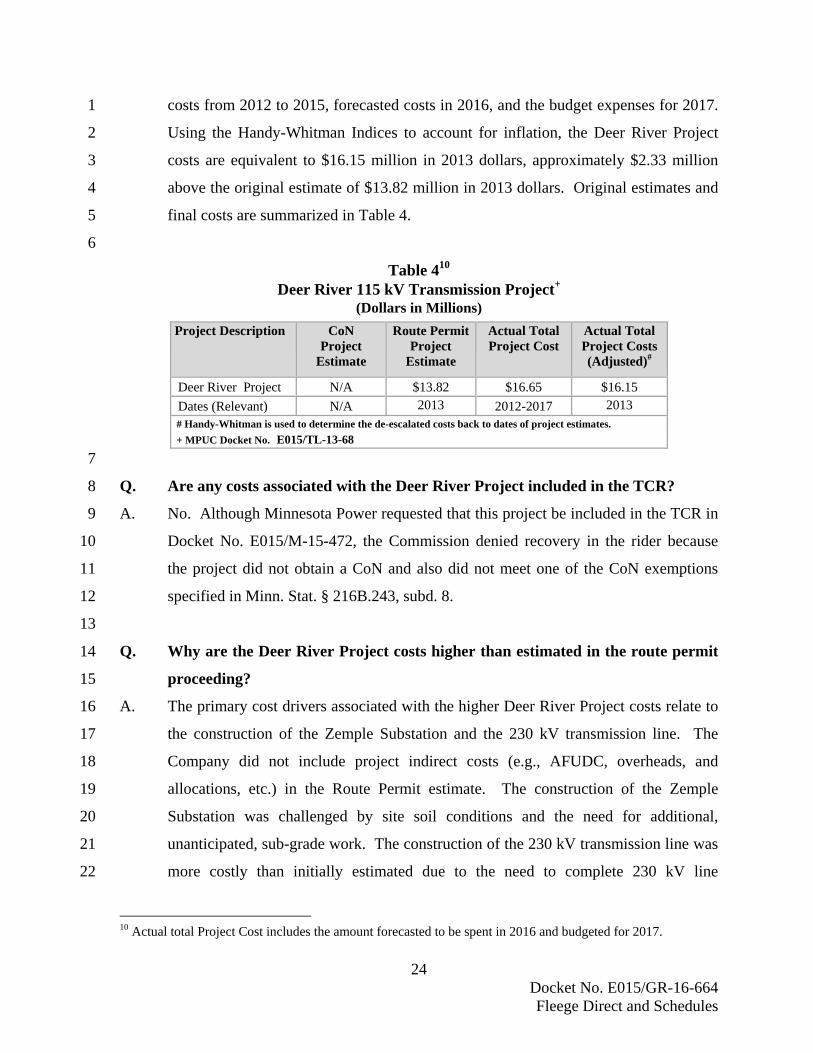
costs from 2012 to 2015, forecasted costs in 2016, and the budget expenses for 2017. 1
Using the Handy-Whitman Indices to account for inflation, the Deer River Project 2
costs are equivalent to $16.15 million in 2013 dollars, approximately $2.33 million 3
above the original estimate of $13.82 million in 2013 dollars. Original estimates and 4
final costs are summarized in Table 4. 5
6
Table 410 Deer River 115 kV Transmission Project+
(Dollars in Millions)
Project Description
CoN Project
Estimate
Route Permit Project
Estimate
Actual Total Project Cost
Actual Total Project Costs (Adjusted)#
Deer River Project N/A $13.82 $16.65 $16.15
Dates (Relevant) N/A 2013 2012-2017 2013 # Handy-Whitman is used to determine the de-escalated costs back to dates of project estimates.
+ MPUC Docket No. E015/TL-13-68
7
Q. Are any costs associated with the Deer River Project included in the TCR? 8
A. No. Although Minnesota Power requested that this project be included in the TCR in 9
Docket No. E015/M-15-472, the Commission denied recovery in the rider because 10
the project did not obtain a CoN and also did not meet one of the CoN exemptions 11
specified in Minn. Stat. § 216B.243, subd. 8. 12
13
Q. Why are the Deer River Project costs higher than estimated in the route permit 14
proceeding? 15
A. The primary cost drivers associated with the higher Deer River Project costs relate to 16
the construction of the Zemple Substation and the 230 kV transmission line. The 17
Company did not include project indirect costs (e.g., AFUDC, overheads, and 18
allocations, etc.) in the Route Permit estimate. The construction of the Zemple 19
Substation was challenged by site soil conditions and the need for additional, 20
unanticipated, sub-grade work. The construction of the 230 kV transmission line was 21
more costly than initially estimated due to the need to complete 230 kV line 22
10 Actual total Project Cost includes the amount forecasted to be spent in 2016 and budgeted for 2017.

25 Docket No. E015/GR-16-664
Fleege Direct and Schedules
construction while the existing transmission lines were energized; the estimate did not 1
consider this more complicated work condition. Also, easement acquisition costs 2
were higher than initial estimates. Construction of the 230 kV line also required 3
substantial matting during construction to protect existing pipeline infrastructure in 4
the area. Costs for the removal of the 7.5 miles of 115 kV transmission line were also 5
higher than anticipated due to access point concerns, county road crossing costs, and 6
the need to mat over existing pipelines in the easement. These costs are summarized 7
in Table 5. 8
9
Table 5 10 Deer River Project Cost Summary 11
Cost Driver Estimated
Cost Impact
Access considerations and matting for 115 kV line removal $390,000
Electrical equipment enclosure for Zemple Substation $500,000
Hot-work, matting, and redesign of 230 kV line due to substation layout change
$400,000
Substation sub-grade correction $300,000
Minnesota Power project cost indirect (overheads & AFUDC) $700,000 12
Q. Did Minnesota Power prudently incur the costs it spent to complete the Deer 13
River Project? 14
A. Yes. The costs incurred by the Company to complete the Deer River Project were 15
prudently and reasonably incurred to complete this necessary project. Although final 16
construction costs for the Deer River Project are higher than the original estimate, the 17
Company mitigated costs by completing construction of the 115 kV transmission line 18
more cost-efficiently than originally estimated. 19
20
Q. What does the Company request the Commission do with the costs for the Deer 21
River Project? 22
A. Minnesota Power requests that the Commission allow the Company to recover the 23
Deer River Project costs of $16.65 million (with AFUDC and Company indirect 24
overheads and allocations) in base rates. 25

26 Docket No. E015/GR-16-664
Fleege Direct and Schedules
1
d. Straight River 115 kV Transmission Project 2
Q. What is the Straight River 115 kV Transmission Project (“Straight River 3
Project”)? 4
A. The Straight River Project includes the construction of the new Straight River 5
115 kV/34.5 kV Substation, a 115 kV transmission line tap to serve the Straight River 6
Substation from the new Great River Energy Hubbard – Blueberry 115 kV Line, and 7
a new 34.5 kV distribution feeder from Straight River to the existing Minnesota 8
Pipeline Park Rapids Pumping Station, all located in Hubbard County, Minnesota. 9
The Straight River Project is part of a larger collaborate project undertaken by Great 10
River Energy and Minnesota Power known as the “Menahga Area 115 kV Project.” 11
Great River Energy and Minnesota Power were granted a CoN and Route Permit for 12
the Menahga Area 115 kV Project from the Commission in Docket Nos. 13
ET2,E015/CN-14-787 and ET2,E015/TL-14-797, respectively. 14
15
Q. Why was the Straight River Project needed? 16
A. As a component of the larger Menahga Area 115 kV Project, the Straight River 17
Project contributes to the resolution of two parallel load-serving needs. The Menahga 18
Area 115 kV Project was designed to resolve load-serving issues, including 19
transformer and feeder capacity limitations, on the 34.5 kV distribution system used 20
jointly by Minnesota Power and Great River Energy to serve customers in the areas 21
between the Hubbard and Verndale substations. Communities in the geographical 22
area that benefits from the project include Menahga, Nimrod, Sebeka, Verndale, and 23
the areas between. In particular, the Straight River Project moves a substantial 24
industrial load (a pipeline pumping station) onto an independent source, improving 25
power quality for the customers served from the Hubbard – Verndale 34.5 kV system 26
and contributing to the alleviation of capacity constraints on the system. The second 27
load-serving need satisfied by the Menahga Area 115 kV Project involved the 28
extension of electric service by Great River Energy and Todd-Wadena Electric 29
Cooperative to a new Koch Pipeline pumping station near Sebeka, Minnesota. 30
31

27 Docket No. E015/GR-16-664
Fleege Direct and Schedules
Q. What was Minnesota Power’s cost estimate for the Straight River Project at the 1
time the combined CoN and Route Permit was obtained? 2
A. Minnesota Power estimated the Straight River Project would cost $2.81 million, in 3
2014 dollars. Unlike earlier projects, the Straight River Project estimate included all 4
the AFUDC and Company overheads in the CoN and Route Permit estimate. 5
6
Q. Are any Straight River Project costs included in the TCR? 7
A. No. 8
9
Q. What was the final cost of the Straight River Project? 10
A. While the Project has not yet been completed, it will be placed in service in 2016. 11
Minnesota Power’s current estimate for the Straight River Project is $2.51 million 12
dollars. This project is expected to be completed below the project estimate provided 13
in the CoN. The CoN cost estimate and expected final cost for the Straight River 14
Project are summarized in Table 6. 15
16
Table 611 Straight River 115 kV Transmission Project+
(Dollars in Millions)
Project Description
CoN Project
Estimate
Route Permit Project
Estimate
Actual Total Project Cost (Nominal)
Straight River Project $2.81 $2.81 $2.51
Dates (Relevant) 2014 2014 2014-2016
+ MPUC Docket No. E015/CN-14-787 and E015/TL-14-797
17
Q. Why are the actual costs for the Straight River Project expected to be less than 18
the estimates in the CoN? 19
A. Contract labor and materials were less than anticipated on the substation. In addition, 20
the 57L tap line construction, from Great River Energy, had lower contract labor and 21
material costs than anticipated. These are summarized in Table 7. 22
23
11 Actual Total Project Cost includes the amount forecasted to be spent in 2016.

28 Docket No. E015/GR-16-664
Fleege Direct and Schedules
Table 7 1 Straight River Project Cost Summary 2
Cost Driver Estimated Cost
Impact
Lower contract labor and materials expenses for substation ($200,000)
Lower contract labor and materials expenses for line construction
($100,000)
3
Q. Did Minnesota Power prudently incur the costs it spent to complete the Straight 4
River Project? 5
A. Yes. The costs incurred by the Company to complete the Straight River Project were 6
prudently and reasonably incurred to complete this necessary project. 7
8
Q. What does the Company request the Commission do with the costs for the 9
Straight River Project? 10
A. Minnesota Power requests that the Commission allow the Company to recover the 11
Straight River Project costs in base rates. 12
13
e. NERC Required Projects 14
Q. What are the “NERC Required Projects” as defined in this part of your 15
testimony? 16
A. These are transmission upgrade projects made in response to NERC’s October 7, 17
2010, Recommendation to Industry for Consideration of Actual Field Conditions in 18
Determination of Facility Ratings (“NERC Recommendation”). 19
20
Q. What is a NERC recommendation? 21
A. NERC’s role includes discovering, identifying, and providing information that is 22
critical to ensuring the reliability of the bulk power system in North America. To 23
effectively disseminate this information, NERC utilizes e-mail-based “alerts” 24
designed to provide concise, actionable information to the electricity industry. NERC 25
alerts are divided into three levels: 26
Industry Advisory – Purely informational and intended to alert registered 27
entities to issues or potential problems. A response to NERC is not necessary. 28

29 Docket No. E015/GR-16-664
Fleege Direct and Schedules
Recommendation to Industry – Recommended specific action be taken by 1
registered entities. Requires a response from recipients as defined in the alert. 2
Essential Action – Identify actions deemed to be essential to bulk power 3
system reliability. Requires NERC Board of Trustees approval prior to 4
issuance. Essential actions also require recipients to respond as defined in the 5
alert. 6
7
Q. Why did NERC issue the October 7, 2010, NERC Recommendation? 8
A. According to the information provided in the NERC Recommendation, it was issued 9
because NERC and its regional entities had become aware of discrepancies between 10
design and actual field conditions of transmission facilities. NERC believed that 11
these deficiencies were significant and widespread, with the potential to result in 12
facility ratings that were inconsistent with actual field conditions. All recipients of 13
the NERC Recommendation were required to respond. 14
15
Q. Did NERC identify how it became aware of these potential issues? 16
A. Information in the NERC Recommendation indicates that the issues were identified 17
from the root cause analysis for a transmission owner’s conductor-to-ground fault 18
caused by a vegetation contact with a transmission line. Subsequent evaluation of the 19
condition of the line indicated that the conductor-to-ground clearance of the line was 20
less than expected. In response, the transmission owner contracted with a company 21
that uses Light Detection and Ranging (“LiDAR”) and Power Line Systems –22
Computer Aided Design and Drafting (“PLS-CADD”) technologies to survey and 23
model additional of its transmission lines. 24
25
Using these technologies, the transmission owner identified a large number of 26
additional previously-undetected instances in which the conductor-to-ground 27
clearance of a transmission line was less than expected. Because transmission line 28
ratings are most often limited by conductor-to-ground clearance, the identified 29
clearance discrepancies resulted in the need to adjust the facility ratings of many of 30

30 Docket No. E015/GR-16-664
Fleege Direct and Schedules
the transmission owner’s transmission lines until modifications could be implemented 1
to restore the necessary conductor-to-ground clearance. 2
3
Q. What is the result of needing to modify conductor ratings like that transmission 4
owner was required to do? 5
A. Derating (reducing the operational capacity of) a transmission line has the effect of 6
operationally limiting the conductor’s ability to transmit electricity. 7
8
Q. What process did Minnesota Power undertake to complete the assessment 9
required by the NERC Recommendation? 10
A. Minnesota Power was required to review the current facility ratings methodology for 11
all transmission lines to verify that the methodology used to determine facility ratings 12
is based on actual field conditions. Transmission line facility ratings depend on many 13
limiting factors, including transmission facility placement, tower height, 14
topographical profiles, and maintaining adequate conductor clearances (i.e., 15
conductor-to-ground, conductor-to-conductor) under a variety of ambient weather and 16
loading conditions. 17
18
The Company had to describe plans to complete an assessment of our transmission 19
facilities to verify whether the actual field conditions conform to the entity’s design 20
tolerances in accordance with its facility ratings methodology and to describe how 21
and when all transmission lines will be assessed. All transmission owners were 22
required to provide this information to NERC. 23
24
Within six months of the date of the NERC Recommendation, each registered entity 25
was to have identified and reported to the applicable reliability coordinators and 26
regional entities all transmission facilities where an entity determined that the actual 27
field conditions were different than the design condition of the facilities and what 28
those differences were. Each registered entity was to correct any issues identified in 29
its assessment no later than October 7, 2012. 30
31

31 Docket No. E015/GR-16-664
Fleege Direct and Schedules
Q. Did NERC make any modifications to this deadline? 1
A. Based on feedback from the registered entities, NERC reconsidered the complexity of 2
this task and modified the timeline for identification of facilities for which actual field 3
conditions may impact line ratings and necessitate mitigation. Discrepancies for the 4
highest-priority facilities with regard to bulk power system reliability were to be 5
identified and reported to the applicable regional entity no later than December 31, 6
2011, medium-priority facilities were to be reported no later than December 31, 2012, 7
lowest-priority facilities were to be reported no later than December 31, 2013. Any 8
discrepancies identified in the course of the evaluation were to be mitigated within 9
one year. Due to the volume of discrepancies identified on Minnesota Power’s 10
transmission lines, Minnesota Power subsequently requested, and was granted 11
extensions, for its medium-priority and low-priority facilities to June 30, 2014, and 12
December 31, 2016, respectively. 13
14
Q. Does this mean Minnesota Power was not adequately maintaining its 15
Transmission System? 16
A. No. This is more reflective of the age of Minnesota Power’s Transmission System. 17
While the transmission facilities were well-designed and well-built, with many 18
serving customers beyond the depreciated lives, eventually additional maintenance is 19
necessary. 20
21
Q. Describe the process Minnesota Power undertook to prioritize and complete 22
these upgrades in response to the NERC requirement. 23
A. Minnesota Power’s assessment plan for the NERC Recommendation involved 24
evaluating each of its transmission lines as follows: 25
(1) Transmission lines built or upgraded in the five years immediately prior to the 26
date of the original NERC Recommendation were reported to the regional 27
entity on July 15, 2011, and excluded from the assessment. 28
29
(2) The rest of Minnesota Power’s transmission lines were analyzed using new 30
PLS-CADD models developed from aerial LiDAR surveys acquired 31
32 Docket No. E015/GR-16-664
Fleege Direct and Schedules
specifically for the NERC Recommendation assessment. The PLS-CADD 1
models were used to identify ratings discrepancies and, when required, to 2
develop mitigation measures. 3
4
Q. What kinds of upgrades were made to Minnesota Power’s transmission lines to 5
comply with the NERC requirement? 6
A. Broadly speaking, all identified discrepancies were either addressed by derating of the 7
facility or through some sort of physical modification of the transmission line or the 8
surrounding environment. 9
10
Minnesota Power used line derating where possible, and 157 potential discrepancies 11
on 7 medium priority lines were mitigated without requiring physical construction. 12
Physical mitigation was required for 239 actual discrepancies on 18 medium priority 13
(230 kV and +\- 250 kV HVDC) lines. This generally consisted of installing a 14
transmission structure to increase conductor-to-ground clearances. In some instances, 15
other mitigation methods, such as burying or lowering a distribution line or removing 16
an object in the right-of-way, were also utilized. 17
18
Minnesota Power used line derating on 761 of the total 1,689 low priority (115 kV, 19
138 kV, and 161 kV) spans of interest and did not require physical construction. In 20
our July 15, 2016, update to the Midwest Reliability Organization (“MRO”), 21
Minnesota Power reported that 815 of the remaining 928 discrepancies had been 22
physically mitigated. The vast majority of discrepancies were mitigated by installing 23
or replacing transmission structures to increase conductor-to-ground clearances. 24
25
Q. Were any of these NERC Required Project costs included in any of Minnesota 26
Power’s retail rate riders? 27
A. No. 28
29

33 Docket No. E015/GR-16-664
Fleege Direct and Schedules
Q. When were the NERC Required Projects completed? 1
A. Minnesota Power successfully completed the mitigation of all discrepancies on its 2
medium-priority lines on June 24, 2014. While mitigation of discrepancies on low-3
priority lines is ongoing, 815 of the 928 total discrepancies requiring physical 4
mitigation had been mitigated prior to July 15, 2016. Construction on the remaining 5
discrepancies will continue through the rest of 2016, with mitigation of all 6
discrepancies on low priority facilities anticipated to be complete by December 31, 7
2016. 8
9
Q. What are the total estimated costs of this effort for the NERC Required 10
Projects? 11
A. The total cost was originally estimated at between $75 and $85 million dollars. This 12
was based on an estimated mitigation cost per discrepancy. Specific information for 13
the transmission lines became available as our consultant completed the flights and 14
was able to process the data and model the transmission lines. The Company refined 15
its estimate to $68.6 million through December 31, 2016. However, the Company 16
has been able to take advantage of construction and access efficiencies as it has 17
worked through the physical modifications. The Company anticipates that final 18
project costs may come in below the $10.25 million amount originally forecasted to 19
be spent in 2016, and below the overall forecasted project total of $68.63 million. 20
21
Q. Is Minnesota Power proposing to include costs associated with the NERC 22
Required Projects in base rates? 23
A. Yes, Minnesota Power is proposing to include all costs associated with the projects in 24
service by December 31, 2016, in base rates. 25
26
Q. What steps did Minnesota Power take to control costs associated with the NERC 27
Required Projects? 28
A. Minnesota Power worked to control costs associated with the NERC Required 29
Projects by streamlining its assessment of transmission lines, by requesting deadline 30

34 Docket No. E015/GR-16-664
Fleege Direct and Schedules
extensions from the MRO, and through various construction and contracting 1
considerations. 2
3
Part of Minnesota Power’s assessment plan included identifying a minimum-required 4
rating for each of its transmission lines. Analysis was conducted to identify the 5
anticipated power flow on each transmission facility under a variety of limiting 6
conditions, and a minimum required rating was recommended to provide sufficient 7
capability for all evaluated scenarios. This allowed for the targeted ratings of many 8
of Minnesota Power’s transmission lines to be reduced while retaining a reasonable 9
degree of confidence that sufficient capacity would be available barring a significant 10
change in circumstances. Reducing the targeted ratings of these transmission lines 11
significantly decreased the overall cost of the NERC Required Projects by limiting 12
physical construction. 13
14
Given the accuracy of the LiDAR-based PLS-CADD line models developed in 15
response to the NERC Recommendation, smaller design margins could be applied to 16
the required clearances when performing the necessary evaluation. This reduction in 17
clearance margins through the use of more accurate LiDAR-based models resulted in 18
a higher degree of certainty in the identification of these discrepancies and fewer 19
overall discrepancies than what would have been identified using traditional methods, 20
leading to a further reduction in the total number of limiting spans requiring field 21
mitigation. 22
23
Q. How did requesting deadline extensions control costs? 24
A. The total number of discrepancies identified on Minnesota Power’s transmission 25
lines, coupled with outage limitations and a need for seasonal construction in the vast 26
wetland areas of northern Minnesota, made meeting the deadlines mandated by the 27
NERC Recommendation very challenging. Rather than paying a premium for 28
transmission service in an attempt to meet the NERC Recommendation deadlines, 29
Minnesota Power twice submitted extension requests to the MRO to allow 30
construction to continue on a more reasonable and cost-effective timeline. 31

35 Docket No. E015/GR-16-664
Fleege Direct and Schedules
1
Q. Did Minnesota Power prudently incur the costs it spent to complete the NERC 2
Reliability Projects 3
A. Yes. The costs incurred by the Company to complete the NERC Reliability Projects 4
were prudently and reasonably incurred to complete this necessary project. 5
6
Q. What does the Company request the Commission do with the costs for the 7
NERC Reliability Projects? 8
A. Minnesota Power requests that the Commission allow the Company to recover the 9
NERC Reliability Projects cost in base rates. 10
11
f. North Shore Loop 12
Q. Are there any other large transmission projects that will go into service in 2016 13
and 2017 that you would like to discuss? 14
A. Yes. Several projects associated with a multi-year transmission plan for the North 15
Shore Loop (“North Shore Loop Plan”) will be placed in service in 2016 and 2017. 16
Work on additional North Shore Loop Plan projects is expected to continue through 17
at least 2020. 18
19
Q. What is the North Shore Loop? 20
A. The North Shore Loop refers to an approximately 140-mile portion of 115 kV and 21
138 kV transmission lines in the northeastern Minnesota transmission system. The 22
North Shore Loop extends approximately 70 miles along the North Shore of Lake 23
Superior from east Duluth to the Taconite Harbor Energy Center near Schroeder, then 24
turns west and extends approximately another 70 miles, to the Laskin Energy Center 25
near Hoyt Lakes. The North Shore Loop is used by Minnesota Power and Great 26
River Energy to serve customers along the North Shore of Lake Superior and in the 27
Hoyt Lakes area. A figure showing the system is provided in Exhibit ___ (CEF), 28
Schedule 2. 29
30

36 Docket No. E015/GR-16-664
Fleege Direct and Schedules
Q. What generating assets support the North Shore Loop? 1
A. The Laskin Energy Center, Taconite Harbor Energy Center, and Silver Bay 2
generating assets provide important sources of power and voltage support to maintain 3
system reliability along the North Shore Loop. The two generators at Laskin Energy 4
Center and the two generators at Taconite Harbor Energy Center are owned by 5
Minnesota Power, while the two generators at Silver Bay are owned by Silver Bay 6
Power Company, a subsidiary of Cliffs Natural Resources Inc. 7
8
Q. Why are significant transmission improvements in this area necessary? 9
A. All seven of the coal-fired generators at these stations have been or will be converted 10
to peaking operation, idled, or retired over a span of approximately five years for 11
various reasons. In 2015, the two generators at Laskin Energy Center were converted 12
from coal-fired baseload generators to natural gas peaking units. Also in 2015, 13
Minnesota Power retired one of the generators at Taconite Harbor. 12 With 14
Commission approval in the 2015 Integrated Resource Plan, Minnesota Power idled 15
the other two units in the fall of 2016 with all coal-fired operations to cease at the 16
facility by 2020.13 In June 2016, Silver Bay Power Company idled one of the Silver 17
Bay generators and has stated its intention to idle the second unit by the end of 2019. 18
This transition away from local coal-fired baseload generation in the North Shore 19
Loop has necessitated an evaluation of the transmission system in the area to ensure 20
that it may be operated reliably and with sufficient load-serving capacity without the 21
power and voltage support previously provided by the generators. While this 22
evaluation is presently ongoing, it has already resulted in the identification of several 23
necessary transmission improvements, which collectively comprise the first few years 24
of the multi-year North Shore Loop Plan.14 25
26
12 See In the Matter of Minn. Power’s 2013-2027 Integrated Res. Plan, Docket No. E015/RP-13-53, ORDER
APPROVING RESOURCE PLAN, REQUIRING FILINGS, AND SETTING DATE FOR NEXT RESOURCE PLAN at 7 (Nov. 12, 2013). (Order Point 3).
13 See In the Matter of Minn. Power’s 2016-2030 Integrated Res. Plan, Docket No. E015/RP-15-690, ORDER
APPROVING RESOURCE PLAN WITH MODIFICATION at 14 (July 18, 2016) (Order Point 3). 14 See id. at Order Point 4.
37 Docket No. E015/GR-16-664
Fleege Direct and Schedules
Q. Are there any new industrial loads proposed for the area? 1
A. Yes. The Polymet non-ferrous mining operation made progress on its facility in 2016 2
and Minnesota Power anticipates Polymet will have operations in service three to five 3
years into the future. The establishment of the Polymet facility would create an 4
electric demand similar to a small taconite mine near Hoyt Lakes. In mid-2016, 5
Louisiana Pacific announced its intention to evaluate the Laskin Energy Park as a 6
potential site for a new siding manufacturing plant to be in service by 2018. While 7
these additions are not certain, to ensure that the North Shore Loop can support these 8
additional loads during and after the transition away from baseload generators in the 9
area, Minnesota Power is also considering the impact of these potential industrial 10
loads as part of evaluating the North Shore Loop and developing the North Shore 11
Loop Plan. 12
13
Q. Is the North Shore Loop Plan only necessary because of these two facilities? 14
A. No. The need for the North Shore Loop Plan is driven by a complex combination of 15
the transition away from local coal-fired generators, the need to maintain reliable 16
electric service to existing residential, commercial, and heavy industrial customers, 17
the need to provide electric service to new industrial loads, and the age and condition 18
of the existing transmission assets in the area. Any transmission improvements in the 19
North Shore Loop Plan that are only necessary because of the development of the 20
Louisiana Pacific and Polymet industrial facilities will not be constructed unless the 21
industrial customers move forward with their development plans. 22
23
Q. Will the cost of those transmission improvements that will only move forward if 24
the customers complete their developments be charged to those customers? 25
A. No. Reliability improvements to the transmission system that are networked are 26
designed to provide benefits to all customers and therefore are recovered through the 27
MISO Attachment O, of which Minnesota Power retail customers pay their 28
proportionate share. The most significant of the many inter-related drivers for 29
transmission upgrades in the North Shore Loop is not new industrial customer 30
development, but the transition away from baseload coal generators in the area, which 31

38 Docket No. E015/GR-16-664
Fleege Direct and Schedules
has impacts on the local reliability of the local transmission system that must be 1
mitigated. Minnesota Power will be working closely with Great River Energy and 2
coordinating through the existing MISO transmission planning process to ensure that 3
the most cost-effective solutions are identified and implemented to ensure a safe and 4
reliable transmission system is maintained as the generators in the North Shore Loop 5
are idled or retired. With regard to new large industrial customer development in the 6
area, it is important to note that transmission improvements to enable reliable electric 7
service for these customers would be significantly less if the local North Shore Loop 8
generation remained online. 9
10
Q. Please explain what the North Shore Loop Plan entails. 11
A. The latter parts of the North Shore Loop Plan are still under development while 12
Minnesota Power continues its evaluation of the reliability impacts of the transition of 13
the North Shore Loop transmission system and waits on decisions from Louisiana 14
Pacific and Polymet. Presently, the North Shore Loop Plan consists of several 15
projects throughout and adjacent to the North Shore Loop transmission system that 16
are necessary to preserve reliable electric service for the area by mitigating 17
transmission line and transformer overloads, unacceptably low voltage, and voltage 18
stability concerns. A variety of different types of transmission improvements have 19
been recommended for the 2016 and 2017 timeframe, including a large power 20
transformer addition for load-serving capacity and voltage support, reconfiguration of 21
an existing substation for increased reliability, capacitor bank additions for voltage 22
support, asset replacement and modernization due to age and condition and to 23
eliminate single points of failure, and the development of a new switching station for 24
increased reliability and voltage support. 25
26
Q. Does Minnesota Power need a CoN under Minnesota Statutes section 216B.243 27
and/or a Route Permit under Minnesota Statues section 216E? 28
A. For the planned and potential projects that have been identified through the North 29
Shore Loop evaluation completed to date, Minnesota Power does not anticipate that 30
these projects will require a CoN. While there is one new transmission line 31

39 Docket No. E015/GR-16-664
Fleege Direct and Schedules
potentially needed in the 2018 to 2019 timeframe, the new 115 kV line is less than 10 1
miles in length and does not cross state lines. A CoN, therefore, is not required. It is 2
likely that the Route Permit for that line will be obtained through the local permitting 3
authority as allowed under Minn. Stat. § 216E.05. 4
5
All other potential transmission line upgrades presently identified in the North Shore 6
Loop Plan would take place on existing rights-of-way at existing or lesser voltage and 7
therefore not require a CoN or a Route Permit. Since evaluation of the overall North 8
Shore Loop is still ongoing, additional projects potentially requiring a CoN or Route 9
Permit from the State of Minnesota may be identified as the overall North Shore Loop 10
Plan is finalized for the years 2018 to 2020 and beyond. 11
12
Q. What North Shore Loop Plan costs have been included in this rate case? 13
A. Approximately $20.27 million in nominal dollars is estimated to be spent on the 14
North Shore Plan between the years 2015-2017.15 Minnesota Power requests that 15
these costs be included in base rates. These costs will be incurred to add a second 16
230 kV/115 kV transformer at an existing substation in the Forbes area, reconfigure 17
an existing 230 kV substation in the Virginia area, add a capacitor bank in the Babbitt 18
area, standardize and modernize a legacy 138 kV system by converting it to 115 kV, 19
add a switching station and several capacitor banks in the Silver Bay area, and 20
modernize a 115 kV breaker at an existing substation. 21
22
Q. Will Great River Energy or its cooperatives served by lines in the North Shore 23
Loop be providing any cost support for the projects included in the North Shore 24
Loop Plan? 25
A. Minnesota Power does not presently anticipate that Great River Energy will directly 26
contribute cost support for any of the North Shore Loop Plan projects, because all the 27
transmission assets involved are owned by Minnesota Power. However, Great River 28
15 The forecast total amount for the North Shore Plan shown on Exhibit ___(CEF), Schedule 1 reflects credits
received by Minnesota Power during the 2010 to 2013 period for work performed on North Shore Loop assets prior to 2010.

40 Docket No. E015/GR-16-664
Fleege Direct and Schedules
Energy compensates Minnesota Power for the use of transmission assets – including 1
new assets – through the Joint Pricing Zone (“JPZ”), as described elsewhere in my 2
testimony. Through the JPZ, the cost of Minnesota Power’s North Shore Loop Plan 3
investments will be shared appropriately by Great River Energy. 4
5
Q. What does the Company request the Commission do with the costs for the 6
projects included in the North Shore Loop Plan? 7
A. Minnesota Power requests that the Commission allow the Company to recover North 8
Shore Loop Plan project costs totaling $20.08 million for the costs expended through 9
2017 in base rates, consistent with the Commission’s July 18, 2016, Order (Order 10
Point 4) (Docket No. E015/RP-15-690). 11
12
3. New Business or Customer Need 13
a. Nashwauk 230 kV/115 kV Transmission Facility Projects 14
Q. What are the Nashwauk 230kV/115 kV Transmission Facility Projects 15
(“Nashwauk Transmission Projects”)? 16
A. The Nashwauk Transmission Projects include four 230 kV transmission lines, two 17
new substations, and modifications to the existing Blackberry Substation, all in Itasca 18
County near Nashwauk, Minnesota. Minnesota Power and Nashwauk Public Utilities 19
obtained a Route Permit from the Commission in Docket No. E280/TL-09-512. The 20
Nashwauk Transmission Projects were divided into two stages, with the first phase 21
consisting of construction of approximately 21 miles of new 230 kV transmission 22
lines (three out of the four proposed lines) connecting the existing Boswell and 23
Shannon substations to the new Calumet and McCarthy Lake substations. One of the 24
new 230 kV lines was also designed to support a new Great River Energy 115 kV line 25
on common structures. The first stage of the Nashwauk Transmission Projects was 26
placed in service in April 2013. The second stage, if needed, would consist of 27
construction of a new Blackberry – McCarthy Lake 230 kV line, as well as the 28
associated modifications at the two substations. 29
30

41 Docket No. E015/GR-16-664
Fleege Direct and Schedules
Q. Why were the Nashwauk Transmission Projects needed? 1
A. The Nashwauk Transmission Projects are networked 230 kV lines that support system 2
reliability for a large area of northern Minnesota, including Grand Rapids, Nashwauk, 3
Hibbing, and all the areas between. While a primary purpose of the project was to 4
supply reliable electric power to our wholesale customer, Nashwauk Public Utilities, 5
and to the proposed Essar Steel Minnesota LLC (“Essar”) iron mining operation, the 6
transmission facilities were designed to provide networked transmission connections 7
to the taconite mine and plant sites while maintaining adequate reliability in the 8
surrounding transmission system. As such, they also provide benefit for the 9
surrounding area, including as a critical outlet for power generated at Minnesota 10
Power’s Boswell Energy Center and in support of reliable delivery to Minnesota 11
Power and Great River Energy’s customers in the Grand Rapids, Nashwauk, and 12
Hibbing areas, and all the areas between. 13
14
Q. Have the Nashwauk Transmission Projects provided improved reliability for 15
other customers? 16
A. Yes. The first stage of the Nashwauk Transmission Projects, which was placed in 17
service in April 2013, has continuously supported the reliable operation of the 18
transmission system since its construction, while also providing a ready source of 19
electricity to support development of a taconite mine and processing plant at the site. 20
The second phase of the Nashwauk Transmission Projects was not constructed, and 21
will not be constructed, unless it becomes needed to support transmission system 22
reliability in conjunction with potential ultimate load levels (in excess of 300 MW) at 23
the mine and processing plant site. 24
25
Q. What was Minnesota Power’s cost estimate for the Nashwauk Transmission 26
Projects at the time it obtained its Route Permit? 27
A. Minnesota Power estimated the first phase of the Nashwauk Transmission Projects 28
would cost $27.78 million in 2009 dollars, excluding transformers and low-side 29
equipment not owned by Minnesota Power. 30
31

42 Docket No. E015/GR-16-664
Fleege Direct and Schedules
Q. What did it cost Minnesota Power to construct the Nashwauk Transmission 1
Projects? 2
A. Minnesota Power spent $31.14 million, in nominal dollars, to construct the first phase 3
of the Nashwauk Transmission Projects between the years 2011 and 2013. The 4
Company received and applied sales tax credits through 2015 actuals and 2016 5
forecast total project costs. Using the Handy-Whitman Indices to account for 6
inflation, the costs associated with the first stage of the Nashwauk Transmission 7
Projects are equivalent to $30.01 million in 2009 dollars, approximately $2.23 million 8
above the original estimate of $27.78 million in 2009 dollars and $3.36 million 9
dollars above the nominal costs. The cost estimate and actual nominal cost for the 10
Nashwauk Transmission Projects to date are summarized in Table 8. The actual total 11
project cost accounts for the funding received by the Nashwauk Public Utilities 12
Commission provided toward the first phase of the project. 13
14
Table 8 Nashwauk 230 kV / 115 kV Transmission Facility Projects+
(Dollars in Millions)
Project Description
CoN Project
Estimate
Route Permit Project
Estimate
Actual Total Project Cost
Actual Total Project Costs (Adjusted)#
Nashwauk Project N/A $27.78 $31.14 $30.01
Dates (Relevant) N/A 2009 2010-2016 2009 # Handy-Whitman is used to determine the de-escalated costs back to dates of project estimates.
+ MPUC Docket No. E280/TL-09-512
15
Q. Why were final costs of the Nashwauk Transmission Projects higher than 16
estimates provided in the route permit proceeding? 17
A. The primary reasons for the cost increase can be attributed to the fact that the 18
Company did not include project indirect costs (AFUDC, overheads, and allocations, 19
etc.) in the original route permit estimates. In addition, easement acquisition 20
difficulties, including navigating previously-not-applicable Lessard Sams Outdoor 21
Heritage Council operating procedures and the 94 Line removal, the volume of 22
matting required to construct in challenging conditions (approximately 22,000 mats 23
and additional restoration), and the need for optical ground wire that had not been 24

43 Docket No. E015/GR-16-664
Fleege Direct and Schedules
included in the initial estimate. Additionally, the overall project schedule resulted in 1
a substantial amount of overheads that were not included in the initial estimate. 2
These quantified costs to account for the $3.36 million dollars are summarized in 3
Table 9. 4
5
Table 9 6 Nashwauk Transmission Project Cost Summary 7
Cost Driver Estimated Cost
Impact
Easement acquisition and permitting $224,000
Optical Ground Wire $335,500
Matting, vegetation clearing, and restoration $700,000
Minnesota Power indirect & overheads (AFUDC) $2,100,000 8
Q. Why were five miles of the Nashwauk Transmission Projects constructed as 230 9
kV/115 kV double-circuit? 10
A. When the Nashwauk Transmission Projects were originally permitted, all 230 kV line 11
segments were permitted as single circuit facilities. As the project was being 12
engineered, Great River Energy expressed a need to build a 115 kV line to a 13
cooperative distribution substation located near one of the proposed 230 kV 14
transmission line routes. To accommodate the Great River Energy need, a minor 15
alteration was filed to allow for a section of 230 kV line to be double circuited with 16
the Great River Energy 115 kV Line. Continued transmission system planning and 17
construction collaboration with area transmission owners benefits all customers 18
served in northern Minnesota. 19
20
Q. Did Great River Energy provide funding to Minnesota Power for this 21
modification? 22
A. Yes. Great River Energy paid Minnesota Power approximately $3.5 million for this 23
additional work. This Great River Energy credit was included as a contribution in aid 24
of construction to reduce the total project cost and is reflected in the final project 25
costs noted in Table 8. 26
27

44 Docket No. E015/GR-16-664
Fleege Direct and Schedules
Q. What steps did Minnesota Power take to limit risk and control costs associated 1
with construction of the Nashwauk Transmission Projects? 2
A. The Nashwauk Transmission Projects construction risk exposure was managed by the 3
Company requiring that Essar provide acceptable security guarantees (e.g., letter of 4
credit, acceptable corporate parent guarantee, etc.) to Minnesota Power as we 5
achieved key project milestones or construction “gates.” Essar was required to meet 6
the security agreement terms prior to the Company proceeding with project 7
construction. This allowed the Company to stop progress at logical points if the 8
customer did not meet their contractual obligations. Minnesota Power has been able 9
to use security guarantee funds to cover revenue requirements and electrical service 10
obligations related to the project. 11
12
As another measure of risk mitigation, Minnesota Power was very deliberate in 13
designing elements and selecting equipment and materials for the substations and 14
transmission lines that were capable of being absorbed and readily “repurposed” back 15
into the Company’s system for other projects or maintenance if Essar were to breach 16
the terms of the agreement prior to the facilities being placed into service. Though 17
this was not the ideal approach to executing a project, it was the most prudent 18
approach to minimize risk to the Company and our customers while still complying 19
with the Company’s obligation to provide open transmission access for 20
interconnecting customers such as the Nashwauk Public Utilities Commission. 21
22
Q. Did Minnesota Power prudently incur the costs it spent to complete the 23
Nashwauk Transmission Projects? 24
A. Yes. The costs incurred by the Company to complete the Nashwauk Transmission 25
Projects were prudently and reasonably incurred to complete this necessary project. 26
In the event the additional phases are required, Minnesota Power will track and report 27
to the Commission on the costs it incurs while completing construction. The first 28
phase facilities are in service and provide wholesale transmission service to the City 29
of Nashwauk, and provide improved reliability for the broader region. 30
31

45 Docket No. E015/GR-16-664
Fleege Direct and Schedules
Q. Why should the Minnesota Power retail customers pay for the in-service 1
Nashwauk Transmission Projects? 2
A. The Nashwauk Transmission Projects were designed to provide safe, reliable, and 3
cost-effective transmission service to a new customer with a significant electric load. 4
Although the project was prompted by the Nashwauk Public Utilities Commission’s 5
service to a single customer, the size of the load and the phased nature of the potential 6
growth, required the Company to design the service at transmission voltages. This 7
transmission solution also provided the opportunity for the Company to improve the 8
overall reliability for all customers across the area. 9
10
The presence of wholesale customers on the Minnesota Power Transmission System 11
provides benefits for our retail customers. Wholesale customers must pay 12
transmission costs under MISO Attachment O, thereby reducing transmission costs 13
for our retail customers. 14
15
Q. What does the Company request the Commission do with the costs for the 16
Nashwauk Transmission Projects? 17
A. Minnesota Power requests that the Commission allow the Company to recover the 18
Nashwauk Transmission Projects cost in base rates. 19
20
b. 39 Line 115 kV Transmission Facility Project 21
Q. What is the 39 Line 115 kV Transmission Facility Project (“39 Line Project”)? 22
A. The 39 Line Project is a 2.9-mile, 115 kV transmission line in St. Louis County near 23
Eveleth, Minnesota, that obtained a Route Permit from the Commission in Docket 24
No. E015/TL-12-1123. 25
26
Q. Was a CoN obtained for the 39 Line Project? 27
A. No. Because the 39 Line Project did not meet any of the requirements for the CoN 28
outlined in Minn. Stat. § 216B.243, a CoN was not obtained for the 39 Line Project. 29
30
46 Docket No. E015/GR-16-664
Fleege Direct and Schedules
Q. Why was the 39 Line Project needed? 1
A. The 39 Line Project was needed to allow for the removal of an existing segment of 2
115 kV line located on mining property by re-establishing the 115 kV connection 3
between the Virginia area and the Hoyt Lakes area that would have been lost by 4
removal of the existing line. The existing line was located in an area to be mined by 5
United Taconite. The 39 Line Project allowed 1.9 miles of existing 115 kV 6
transmission line to be relocated without compromising the reliability of the 7
surrounding transmission system for customers in the Virginia, Eveleth, and Hoyt 8
Lakes areas. 9
10
Q. Why should Minnesota Power customers pay for this project? 11
A. The 39 Line Project preserved the quality and reliable operation of the transmission 12
system in the area. Although the relocation was prompted by United Taconite, 13
exercising their easement rights to require the Company to relocate our transmission 14
facilities, the project was necessary and benefits customers in the entire East Range 15
area, including Virginia, Eveleth, Hoyt Lakes, and all areas between. 16
17
Q. What were the land rights Minnesota Power held for the 39 Line right-of-way 18
that needed to be relocated? 19
A. When the segment of 39 Line designated for removal was constructed in 1990, 20
Minnesota Power was only able to obtain a license with removal requirements from 21
Eveleth Taconite (United Taconite’s predecessor) instead of a customary permanent 22
easement that Minnesota Power obtains for the vast majority of its transmission 23
facilities. That license allowed Minnesota Power’s transmission line to be routed on 24
United Taconite’s land but required that, in the event the license agreement expired or 25
was terminated or a notice of relocation was provided by United Taconite, Minnesota 26
Power would relocate the transmission line within two years. United Taconite 27
notified Minnesota Power in December 2011 by issuing a Notice to Relocate and 28
Elevate Electric Transmission Line, as required by the license agreement. 29
30

47 Docket No. E015/GR-16-664
Fleege Direct and Schedules
Although easements are preferred for transmission facilities, given the varying 1
mining lands in northern Minnesota, the varying rates at which mining has progressed 2
in the area, and the encumbrance placed on potential mining lands by the construction 3
of transmission lines, licenses have been and continue to be a reasonable approach to 4
transmission land rights on mining lands. 5
6
Q. Are you aware of other public or private infrastructure that has been required 7
to move or relocate due to easements associated with mining? 8
A. Yes. The Minnesota Department of Transportation (“MnDOT”) had similar land 9
right and relocation terms with a predecessor of Cliffs Natural Resources Inc. when 10
they built U.S. Highway 53 between Eveleth and Virginia, Minnesota in 1960. The 11
final relocation project Environmental Impact Statement (“EIS”) issued in September 12
of 2015 cited the justification for the relocation as the legal right the mining company 13
had to terminate the easement and request that MnDOT relocate the highway to 14
facilitate the mining operation. The total capital construction costs for the project 15
were estimated to cost between $180 and $240 million dollars. 16
17
Q. Why is the MnDOT experience relevant to Minnesota Power’s experience with 18
the 39 Line? 19
A. The MnDOT experience demonstrates that even the State of Minnesota was unable to 20
obtain more permanent land rights for a major highway through mineral lands in this 21
area. Both the State of Minnesota and Minnesota Power had to relocate infrastructure 22
to ensure that the mineral interests of the state could be mined. 23
24
Q. Did Minnesota Power consider any alternatives to relocation that could have 25
accommodated United Taconites mining plans? 26
A. Yes. Minnesota Power first evaluated the possibility of not replacing the segment, 27
but determined that the reliability of the system serving customers in and around area 28
communities, including Hoyt Lakes, Eveleth, and Virginia, Minnesota would be 29
degraded. Minnesota Power concluded that reconfiguring the segment and re-30

48 Docket No. E015/GR-16-664
Fleege Direct and Schedules
establishing the transmission connection was the necessary solution for maintaining 1
appropriate system reliability. 2
3
Q. When was the 39 Line Project energized? 4
A. The 39 Line Project was placed in service on May 1, 2014. 5
6
Q. What was Minnesota Power’s cost estimate for the 39 Line Project at the time it 7
obtained its Route Permit? 8
A. Minnesota Power estimated the 39 Line Project would cost $2 million, in 2012 9
dollars. 10
11
Q. What was the final cost of the 39 Line Project? 12
A. Minnesota Power spent $5.77 million, in nominal dollars, to construct the 39 Line 13
Project between the years 2012 and 2015. Using the Handy-Whitman Indices to 14
account for inflation, the 39 Line Project costs are equivalent to $5.60 million in 2012 15
dollars, approximately $3.60 million above the original estimate of $2.0 million in 16
2012 dollars. The cost estimate and the actual total cost for the 39 Line Project are 17
summarized in Table 10. 18
19 Table 10
39 Line 115 kV Transmission Facility Project+ (Dollars in Millions)
Project Description
CoN Project
Estimate
Route Permit Project
Estimate
Actual Total Project Cost
Actual Total Project Costs (Adjusted)#
39 Line Project N/A $2.00 $5.77 $5.60
Dates (Relevant) N/A 2012 2012-2015 2012 # Handy-Whitman is used to determine the de-escalated costs back to dates of project estimates.
+ MPUC Docket No. E015/TL-12-112316
20
16 Actual Total Project Cost includes the amount forecasted to be spent in 2016.

49 Docket No. E015/GR-16-664
Fleege Direct and Schedules
Q. Why were final costs of the 39 Line Project higher than estimates provided in the 1
Route Permit proceeding? 2
A. The primary drivers for the cost increase are construction difficulties associated with 3
geographical features, unanticipated subterranean conditions, and a construction 4
schedule that had to be accelerated in light of a route permit process that took longer 5
than the six months anticipated under Minn. Stat. § 216E.03, subd. 7 for the 6
alternative permitting process.17 7
8
Q. What challenges were encountered during construction? 9
A. First, the estimate included in the Route Permit application did not account for the 10
more densely spaced structures necessary to follow the curves of the road followed by 11
the permitted route. Additionally, the estimate did not include additional funds 12
necessary to complete vegetation removal. The project also required a 13
reconfiguration of the transmission system in the area, merging two 115 kV 14
transmission line facilities into one “three-terminal” facility, that required 15
modifications of the relaying and communications systems at the substation 16
endpoints. This equipment and labor was not included in the initial estimate. As 17
construction was starting, Minnesota Power was informed of an existing wetland 18
bank that United Taconite had designated with the state, which was crossed by the 19
permitted route. This wetland bank required additional permitting and engineering 20
constraints not previously identified. Additionally, the U.S. Army Corps of 21
Engineers increased Minnesota Power’s wetland mitigation ratio from what was 22
originally used, requiring additional wetland mitigation. 23
24
During construction, an undocumented municipal waterline was discovered in the 25
transmission line route. Because accurate records were not available to identify the 26
location of this waterline prior to construction, it was damaged during construction. 27
In addition to repairing the damaged pipeline, Minnesota Power did a significant 28
17 The Route Permit Application was filed on October 10, 2012. The Commission’s Route Permit was issued
on January 13, 2014. The Company’s first plan and profile compliance filing was filed on January 15, 2014, demonstrating the urgency of the project’s construction progress.
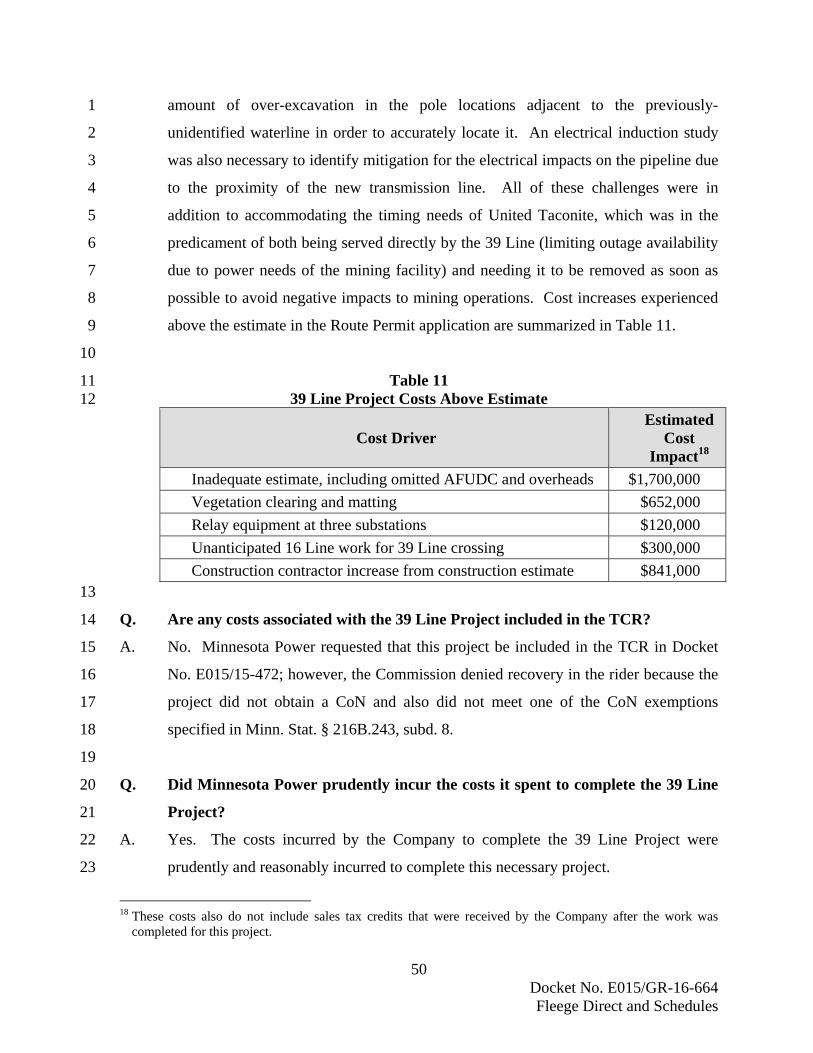
50 Docket No. E015/GR-16-664
Fleege Direct and Schedules
amount of over-excavation in the pole locations adjacent to the previously-1
unidentified waterline in order to accurately locate it. An electrical induction study 2
was also necessary to identify mitigation for the electrical impacts on the pipeline due 3
to the proximity of the new transmission line. All of these challenges were in 4
addition to accommodating the timing needs of United Taconite, which was in the 5
predicament of both being served directly by the 39 Line (limiting outage availability 6
due to power needs of the mining facility) and needing it to be removed as soon as 7
possible to avoid negative impacts to mining operations. Cost increases experienced 8
above the estimate in the Route Permit application are summarized in Table 11. 9
10
Table 11 11 39 Line Project Costs Above Estimate 12
Cost Driver Estimated
Cost Impact18
Inadequate estimate, including omitted AFUDC and overheads $1,700,000
Vegetation clearing and matting $652,000
Relay equipment at three substations $120,000
Unanticipated 16 Line work for 39 Line crossing $300,000
Construction contractor increase from construction estimate $841,000 13
Q. Are any costs associated with the 39 Line Project included in the TCR? 14
A. No. Minnesota Power requested that this project be included in the TCR in Docket 15
No. E015/15-472; however, the Commission denied recovery in the rider because the 16
project did not obtain a CoN and also did not meet one of the CoN exemptions 17
specified in Minn. Stat. § 216B.243, subd. 8. 18
19
Q. Did Minnesota Power prudently incur the costs it spent to complete the 39 Line 20
Project? 21
A. Yes. The costs incurred by the Company to complete the 39 Line Project were 22
prudently and reasonably incurred to complete this necessary project. 23
18 These costs also do not include sales tax credits that were received by the Company after the work was
completed for this project.
51 Docket No. E015/GR-16-664
Fleege Direct and Schedules
1
Q. What does the Company request the Commission do with the costs for the 39 2
Line Project? 3
A. Minnesota Power requests that the Commission allow the Company to recover the 4
39 Line Project costs in base rates. 5
6
c. Canisteo 115kV Transmission Facility Project 7
Q. What is the Canisteo 115 kV Transmission Facility Project (“Canisteo Project”)? 8
A. The Canisteo Project includes the construction of two new 5-mile, 115 kV lines 9
extending from an existing Minnesota Power 115 kV Line (“28 Line”) to a new 10
Canisteo 115/14 kV Substation in Itasca County, Minnesota near the cities of 11
Coleraine and Bovey. 12
13
Q. Was a CoN obtained for the Canisteo Project? 14
A. No, because the Canisteo Project did not meet any of the requirements for the CoN 15
outlined in Minn. Stat. § 216B.243, a CoN was not obtained for the Canisteo Project. 16
However, Minnesota Power obtained a Route Permit for the Canisteo Project from 17
the Commission in Docket No. E015/TL-13-805. 18
19
Q. Why was the Canisteo Project needed? 20
A. The Canisteo Project was needed to supply reliable electric power to a new 21
Magnetation iron ore concentrate plant and maintain adequate reliability of the 22
surrounding transmission system. Specifically, the Canisteo Project was designed to 23
provide networked transmission connections to the new Canisteo Substation (the 24
primary source of power for the Magnetation plant) while reducing outage exposure 25
for all customers served from the 30-mile 28 Line. 26
27
Q. What was Minnesota Power’s cost estimate for the Canisteo Project at the time 28
it obtained its Route Permit? 29
A. Minnesota Power estimated the Canisteo Project would cost $6.2 million, in 2013 30
dollars. 31

52 Docket No. E015/GR-16-664
Fleege Direct and Schedules
1
Q. What was the final cost of the Canisteo Project? 2
A. Minnesota Power spent $13.12 million, in nominal dollars, to construct the Canisteo 3
Project between the years 2013 and 2015. Using the Handy-Whitman Indices to 4
account for inflation, the Canisteo Project costs are equivalent to $12.90 million in 5
2013 dollars, approximately $6.7 million above the original estimate of $6.2 million 6
in 2013 dollars. The Canisteo Project cost estimate and actual total project cost are 7
summarized in Table 12. 8
9
Table 12Canisteo 115kV Transmission Facility Project+
(Dollars in Millions)
Project Description
CoN Project
Estimate
Route Permit Project
Estimate
Actual Total Project Cost
Actual Total Project Costs (Adjusted)#
Canisteo Project N/A $6.20 $13.12 $12.90
Dates (Relevant) N/A 2013 2013-2015 2013
# Handy-Whitman is used to determine the de-escalated costs back to dates of project estimates.
+ MPUC Docket No. E015/TL-13-805
10
Q. Why were final costs of the Canisteo Project higher than estimates provided in 11
the Route Permit proceeding? 12
A. The cost increases for the Canisteo Project were driven primarily by the fact that the 13
Route Permit estimate was not revised to reflect the scope of the final route permit, 14
which included construction of two 115 kV lines verses a single line. This oversight 15
accounted for $2.3 million dollars of additional expense when compared to the 16
original Route Permit estimate. Costs also increased due to (1) the need for extensive 17
vegetation clearing and use of matting (both purchased and placed), and right-of-way 18
restoration after matting removal, and (2) the construction contractors’ increase over 19
the original preliminary construction estimate. The construction contractors’ cost 20
increase and the extensive use of matting were driven by the challenges of 21
construction in northern Minnesota wetland conditions. The changes were in turn 22
driven by a project schedule that required construction to commence in late summer 23
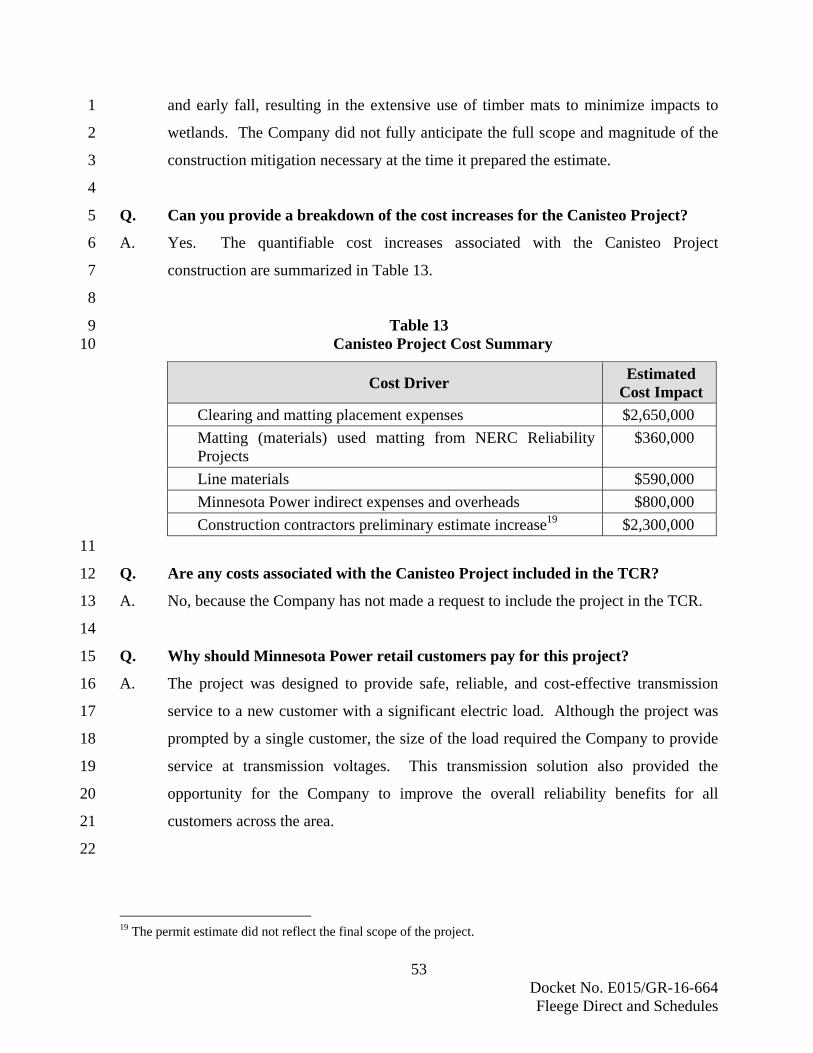
53 Docket No. E015/GR-16-664
Fleege Direct and Schedules
and early fall, resulting in the extensive use of timber mats to minimize impacts to 1
wetlands. The Company did not fully anticipate the full scope and magnitude of the 2
construction mitigation necessary at the time it prepared the estimate. 3
4
Q. Can you provide a breakdown of the cost increases for the Canisteo Project? 5
A. Yes. The quantifiable cost increases associated with the Canisteo Project 6
construction are summarized in Table 13. 7
8
Table 13 9 Canisteo Project Cost Summary 10
Cost Driver Estimated
Cost Impact
Clearing and matting placement expenses $2,650,000
Matting (materials) used matting from NERC Reliability Projects
$360,000
Line materials $590,000
Minnesota Power indirect expenses and overheads $800,000
Construction contractors preliminary estimate increase19 $2,300,000 11
Q. Are any costs associated with the Canisteo Project included in the TCR? 12
A. No, because the Company has not made a request to include the project in the TCR. 13
14
Q. Why should Minnesota Power retail customers pay for this project? 15
A. The project was designed to provide safe, reliable, and cost-effective transmission 16
service to a new customer with a significant electric load. Although the project was 17
prompted by a single customer, the size of the load required the Company to provide 18
service at transmission voltages. This transmission solution also provided the 19
opportunity for the Company to improve the overall reliability benefits for all 20
customers across the area. 21
22
19 The permit estimate did not reflect the final scope of the project.

54 Docket No. E015/GR-16-664
Fleege Direct and Schedules
Q. Did Minnesota Power prudently incur the costs it spent to complete the Canisteo 1
Project? 2
A. Yes. The costs incurred by the Company to complete the Canisteo Project were 3
prudently and reasonably incurred to complete this necessary project. 4
5
Q. What does the Company request the Commission do with the costs for the 6
Canisteo Project? 7
A. Minnesota Power requests that the Commission allow the Company to recover the 8
Canisteo Project costs in base rates. 9
10
4. Regional Expansion Projects 11
a. Bemidji – Grand Rapids 230 kV Transmission Project 12
Q. What is the Bemidji Project? 13
A. The single-circuit, 230 kV Project is approximately 70 miles in length and connects 14
the Wilton Substation, near Bemidji, Minnesota, and the Boswell Substation, in 15
Grand Rapids, Minnesota. The Bemidji Project was approved by the Commission in 16
Docket Nos. E017,E015,ET6/CN-07-1222 and E017,E015,ET6/TL-07-1327. It was 17
energized and placed in service in 2012 to improve reliability for the Red River 18
Valley, Bemidji, Grand Rapids, and north central Minnesota. 19
20
Q. Was a provisional cost cap set for the Bemidji Project? 21
A. In its Order in Docket No. E017/M-13-103, the Commission found the cost cap for 22
current TCR recovery related to the Bemidji Project to be $74 million. This equates 23
to a cost cap of $6.882 million for Minnesota Power’s ownership interest of 9.3 24
percent in the Bemidji Project. 25
26
Q. What was Minnesota Power’s final cost for the Bemidji Project? 27
A. Minnesota Power’s final cost for the Bemidji Project was $10.88 million. The cost 28
estimate and the actual cost for the Bemidji Project are summarized in Table 14. 29

55 Docket No. E015/GR-16-664
Fleege Direct and Schedules
1 Table 14
Bemidji-Grand Rapids 230 kV Transmission Facility Project+ (Dollars in Millions)
Project Description
CoN Project
Estimate^
Route Permit Project
Estimate
Actual Total Project Cost (Nominal)^
Bemidji – Grand Rapids $6.88 N/A $10.88
Dates (Relevant) N/A20 2013 2012 + MPUC Docket No. E017,E015,ET6/CN-07-1222 and E017,E015,ET6/TL-07-1327 ^ MN Power Portion of the Project
2
Q. What costs have been included in Minnesota Power’s TCR for the Bemidji 3
Project? 4
A. In our TCR, Minnesota Power has only sought recovery of revenue requirements 5
related to the first $6.882 million. 6
7
Q. Is Minnesota Power seeking recovery of the additional $3.99 million in the rate 8
case? 9
A. Yes. Minnesota Power is requesting that the Commission approve, and the test year 10
include, the additional project costs above the CoN estimate for the Bemidji Project 11
as these costs were prudently and reasonably incurred. 12
13
Q. Are you aware of other CapX2020 partners that have successfully recovered 14
expenses that totaled above the CoN estimate for the Bemidji Project? 15
A. Yes. It is my understanding that Xcel Energy has been recovering those amounts that 16
were identified as above their respective CoN estimates since its 2012 rate case 17
(Docket No. E002/GR-12-961). Minnesota Power is requesting similar treatment for 18
its investment in this project. 19
20
20 The cost cap for the Bemidji Project was set by the Commission in nominal dollars. This limited Minnesota
Power to recovering up to the first $6.882 million it invested in the Bemidji Project, over the life of the project, through the TCR.
56 Docket No. E015/GR-16-664
Fleege Direct and Schedules
Q. Why did the costs for the Bemidji Project increase from those estimates 1
approved by the Commission? 2
A. Xcel Energy included an extensive reconciliation of the Bemidji Project costs to the 3
estimates included in the Bemidji Project CoN in its August 31, 2012, Reply 4
Comments in Docket No. E002/M-12-50. A copy of the relevant portions of those 5
Reply Comments are included as Exhibit ____ (CEF), Schedule 3. While that 6
reconciliation was prepared when the project was approximately 98 percent complete, 7
the main drivers were unchanged upon completion. Those drivers were: 8
Winter Construction: The Bemidji Project incurred $15.4 million (Total Project) 9
to purchase, install, and remove additional wetland protection mats due to warm 10
winter temperatures during 2011 to 2012, which was $9.6 million (Total Project) 11
more than originally estimated. During normal winters, wetlands in the area 12
freeze so that construction with typical protective measures can continue. The 13
2011 to 2012 winter was one of the warmest on record and the wetlands in the 14
project area did not freeze sufficiently to support construction equipment. 15
Continuing construction was more cost effective than waiting until spring but 16
required additional equipment to protect the wetland areas against damage from 17
heavy traffic and use of construction equipment. To protect the landscape, the 18
Bemidji Project purchased, installed, and removed an additional 20,000 mats. 19
Permitting, Right-of-Way, and Legal: Permitting, right-of-way, and legal 20
expenses were always anticipated as part of the Bemidji Project, but they were not 21
expressly quantified in the CoN. Total Bemidji Project permitting, right-of-way, 22
and legal costs were $26.90 million (Total Project). 23
Associated Facilities: Several additional associated facilities were identified as 24
being needed for the project to be reliably interconnected to substations and the 25
underlying transmission system. This added an additional $2.6 million (Total 26
Project) to the project. 27
Other Route-Related Costs: Portions of the Bemidji Project parallel the Great 28
Lakes Gas Transmission pipeline along U.S. Highway 2, which required the 29
installation of special equipment to mitigate the induction of electrical currents 30
across pipeline facilities. Without the equipment, the effectiveness of the 31
57 Docket No. E015/GR-16-664
Fleege Direct and Schedules
pipeline’s corrosion system would be reduced. The Bemidji Project incurred 1
approximately $1.9 million (Total Project) for this pipeline induction mitigation. 2
Tree clearing and road restoration costs also increased approximately $1.0 million 3
(Total Project) based on the final route running through areas where the trees 4
were larger and more dense than anticipated. 5
6
Q. Did Minnesota Power prudently incur the costs it spent to complete the Bemidji 7
Project? 8
A. Yes. The costs incurred by the Company to complete the Bemidji Project were 9
prudently and reasonably incurred to complete this necessary project. 10
11
Q. What does the Company request the Commission do with the costs for the 12
Bemidji Project? 13
A. Minnesota Power requests that the Commission allow the Company to recover the 14
Bemidji Project costs in base rates. 15
16
b. Monticello – Fargo 345 kV Transmission Facility Project 17
Q. What is the Fargo Project? 18
A. The Fargo Project consists of a 238-mile, 345 kV transmission line (built on double-19
circuit-capable structures) from Monticello, Minnesota, to a new Bison Substation 20
west of Fargo, North Dakota. Minnesota Power holds a 14.7 percent ownership 21
interest in the Fargo Project. The Fargo Project is one of the CapX2020 projects. 22
23
Q. What was the estimated cost of the Fargo Project when approved by the 24
Commission? 25
A. In 2009, the May 22, 2009, Commission Order approved the Fargo Project at a cost 26
between $500 million and $640 million (Docket No. ET2,E002,et al./CN-06-1115). 27
That Order also identified the potential for lower-voltage upgrades estimated to cost 28
between $75 million and $100 million. Both estimates were in 2007 dollars. 29
30
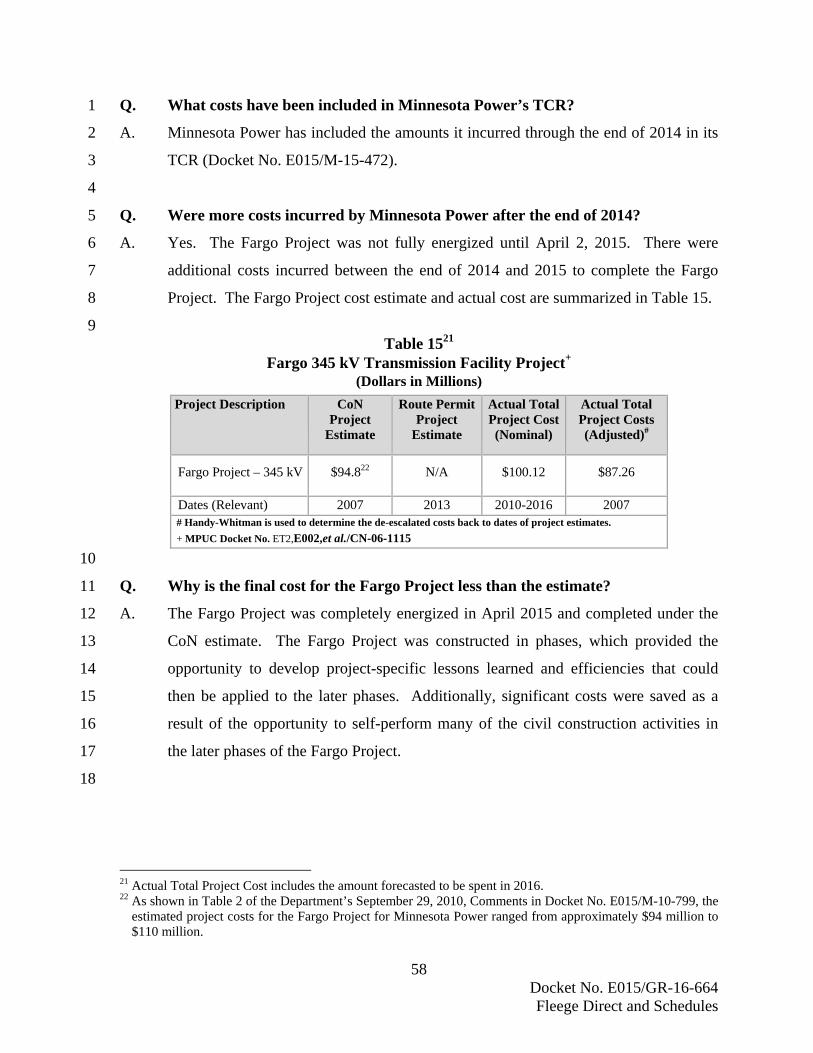
58 Docket No. E015/GR-16-664
Fleege Direct and Schedules
Q. What costs have been included in Minnesota Power’s TCR? 1
A. Minnesota Power has included the amounts it incurred through the end of 2014 in its 2
TCR (Docket No. E015/M-15-472). 3
4
Q. Were more costs incurred by Minnesota Power after the end of 2014? 5
A. Yes. The Fargo Project was not fully energized until April 2, 2015. There were 6
additional costs incurred between the end of 2014 and 2015 to complete the Fargo 7
Project. The Fargo Project cost estimate and actual cost are summarized in Table 15. 8
9 Table 1521
Fargo 345 kV Transmission Facility Project+ (Dollars in Millions)
Project Description
CoN Project
Estimate
Route Permit Project
Estimate
Actual Total Project Cost(Nominal)
Actual Total Project Costs (Adjusted)#
Fargo Project – 345 kV $94.822 N/A $100.12 $87.26
Dates (Relevant) 2007 2013 2010-2016 2007 # Handy-Whitman is used to determine the de-escalated costs back to dates of project estimates.
+ MPUC Docket No. ET2,E002,et al./CN-06-1115
10
Q. Why is the final cost for the Fargo Project less than the estimate? 11
A. The Fargo Project was completely energized in April 2015 and completed under the 12
CoN estimate. The Fargo Project was constructed in phases, which provided the 13
opportunity to develop project-specific lessons learned and efficiencies that could 14
then be applied to the later phases. Additionally, significant costs were saved as a 15
result of the opportunity to self-perform many of the civil construction activities in 16
the later phases of the Fargo Project. 17
18
21 Actual Total Project Cost includes the amount forecasted to be spent in 2016. 22 As shown in Table 2 of the Department’s September 29, 2010, Comments in Docket No. E015/M-10-799, the
estimated project costs for the Fargo Project for Minnesota Power ranged from approximately $94 million to $110 million.

59 Docket No. E015/GR-16-664
Fleege Direct and Schedules
Q. Did Minnesota Power prudently incur the costs it spent to complete the Fargo 1
Project? 2
A. Yes. The costs incurred by the Company to complete the Fargo Project were 3
prudently and reasonably incurred to complete this necessary project. 4
5
Q. What does the Company request the Commission do with the costs for the Fargo 6
Project? 7
A. Minnesota Power requests that the Commission allow the Company to recover the 8
Fargo Project costs in base rates. 9
10
Q. What is the Company’s overall request with respect to the transmission capital 11
included in this proceeding? 12
A. Minnesota Power requests that the Commission find that costs incurred for 13
transmission capital investments were reasonable and prudent. While some project 14
cost estimates were lower than final costs, some project cost estimates were higher 15
than final costs. These transmission projects were all necessary and costs were 16
prudently incurred. 17
18
B. Distribution Capital Investments 19
Q. How do you determine your distribution function capital investment plan? 20
A. We determine our capital investment plan to ensure we meet customer, community, 21
and system needs. Larger projects, generally greater than $50,000, are budgeted 22
individually and considered specific “discrete projects.” Smaller projects, and those 23
taking place year after year, are considered “routine projects.” While the sub-projects 24
that comprise the routine projects are given individual work order numbers, their 25
aggregate costs are combined for budgeting purposes. 26
27
Specific capital projects are identified through a rigorous planning process that results 28
in short- and long-term investment plans including those targeted to address customer 29
needs and maintain system reliability. The distribution function has a well-defined 30
process for identifying, ranking, and budgeting electric line and distribution 31

60 Docket No. E015/GR-16-664
Fleege Direct and Schedules
substation projects. A key step in the process is the identification of potential 1
problems or risks on the system, including those that threaten reliability and 2
regulatory compliance. We identify these potential problems or risks to the system by 3
reviewing system performance to ensure we consider reliability and load data to 4
assess feeder and substation performance. We then conduct contingency analyses to 5
identify the reliability impacts for certain system component failure to identify the 6
highest risk areas. 7
8
In the capital budgeting process, potential solutions or mitigations of these risks are 9
identified as projects and are screened and evaluated against each other based on their 10
costs, how effectively they address certain risks, and the severity of the risk. After 11
the ranking is completed, business leadership reviews the list, the level of risk 12
associated with the various projects, as well as available capital funding to determine 13
which projects will be implemented. 14
15
Q. What is the process for budgeting the routine projects you described above? 16
A. The distribution function evaluates the historic capital investments in routine projects 17
as the initial step in developing the next year’s routine projects. We also look to 18
economic trends, projected customer additions, current and forecasted labor costs, 19
and any changes to trends in material costs. In addition, the Company completes an 20
annual evaluation of the actual completed construction costs for distribution service 21
extension and uses this information in the budgeting process. 22
23
Other routine blanket projects are identified and budgeted to meet projected needs for 24
line relocations due to road realignments, smaller capacity projects, street lighting, 25
reliability programs, fleet purchases, and tools. Funding levels for these routine 26
projects are based primarily on recent historical expenditure trends, with additional 27
insight as available from local or community resources. 28
29

61 Docket No. E015/GR-16-664
Fleege Direct and Schedules
Q. Please describe the components for the Minnesota Power distribution function 1
capital investment. 2
A. Table 16 provides a summary of the distribution function capital investment plan. As 3
shown, the distribution capital investment plan is comprised of distribution base, 4
substation/capacity, and fleet and equipment. 5
6
Table 16 Distribution Capital Invested
2010-2017 (Dollars in Millions) Actual & Budget invested in the respective year
2010 Actual
2011 Actual
2012 Actual
2013 Actual
2014 Actual
2015 Actual
2016 Forecast
2017 Budget
$22.54 $21.90 $23.40 $28.30 $21.40 $25.00 $29.10 $33.30
7
Q. How do the distribution function capital investment projects undertaken in 2010 8
and 2011 compare to those undertaken in 2012 and 2013? 9
A. In 2012, Minnesota Power increased its distribution capital spending to begin the 10
replacement of a paper insulated lead cable (“PILC”) underground distribution cable 11
network system (“PILC System”) which serves downtown Duluth and the Canal Park 12
district of Duluth. The existing PILCs are approximately 80 to 90 years old and have 13
recently demonstrated a significantly higher frequency of faulting, resulting in 14
unplanned customer outages. The Company has increased its replacement activities 15
of this aged infrastructure since 2012 and will continue beyond the 2017 test year. 16
The distribution function capital investment committed to this project is in the range 17
of $1.00 million to $2.00 million per year, from 2012 forward. Additionally, the 18
advanced metering infrastructure and technologies (“AMI”) meter replacement 19
program, while initiated in 2010, increased capital investment in 2012 through 2014, 20
with a significant investment amount made in 2013 to increase meter deployments 21
and the supporting communications infrastructure. 22
23
Q. How do the 2016 forecast and 2017 budget compare to Minnesota Power’s 24
historic distribution capital investments? 25
A. Minnesota Power’s distribution function capital investments for 2016 are higher than 26
historic investments because of three new or refurbished 115 kV-to-distribution-27

62 Docket No. E015/GR-16-664
Fleege Direct and Schedules
voltage substations (Hat Trick, 15th Avenue West, and Canosia). It is not typical to 1
have that many new 115 kV-to-distribution-voltage substations in one year for 2
Minnesota Power. The 2017 budget, while other distribution capital investments 3
return to levels more similar to historic investments, includes an increased amount for 4
the purchase of fleet vehicles and equipment for the Meter Data Management 5
(“MDM”) project. The cost of fleet vehicles was previously accounted for entirely in 6
O&M as the fleet vehicles were leased. As discussed later in my testimony, 7
Minnesota Power is undertaking a transition to fleet vehicle ownership as a cost 8
containment measure. 9
10
Q. Are there other distribution capital investment initiatives that Minnesota Power 11
is seeking to include in base rates? 12
A. Yes. Minnesota Power has invested $13.2 million dollars in AMI since its last rate 13
review. Minnesota Power has included $3.5 million dollars in the 2017 test year for 14
meter and AMI purchases. This is one dimension of the key investments in 15
technology and data infrastructure necessary to establish the distribution platform 16
needed to enhance the customer experience and enable the smart grid modernization. 17
Minnesota Power also invested $17.38 million in a new CC&B system that went into 18
service in 2015. 19
20
The other future capital investments will include costs associated with the MDM 21
which will be an extension of our CC&B system. 22
23
1. Distribution Infrastructure 24
Q. Please provide some examples of other distribution capital investments the 25
Company is currently undertaking. 26
A. Minnesota Power is currently undertaking two modernization projects that are 27
necessary to ensure the reliability of the Distribution System. One is the replacement 28
of PILCs that provide distribution service in downtown Duluth. Another is the 15th 29
Avenue West Substation Modernization project in west Duluth. 30
31
63 Docket No. E015/GR-16-664
Fleege Direct and Schedules
Q. What is the PILC project? 1
A. In 2012, Minnesota Power began experiencing failures on its PILC System. The five 2
PILC circuits were constructed in the early 1920s to 1930s and operated reliably until 3
2012. Completion of the root cause analysis concluded that the loss of mineral oil in 4
the insulating paper of the PILCs is the underlying driver of the issues Minnesota 5
Power is now experiencing. 6
7
A six-year plan was developed in 2012, with work beginning in 2013, for the removal 8
and replacement of approximately seven miles of PILCs in the Minnesota Power 9
Distribution System in the City of Duluth. The ducts and manholes requiring 10
replacement are primarily in two-lane downtown streets and will require close 11
coordination with the City of Duluth. The 2016 forecast and the 2017 test year 12
budget each include approximately $2 million for the PILC project. Work will 13
continue on PILC replacement for several years after the test year. 14
15
Q. What is the 15th Avenue West Substation Modernization project? 16
A. The 15th Avenue West Substation is the largest single load-serving distribution 17
substation in the Duluth area by total load, and serves one of Minnesota Power’s most 18
high-profile load pockets: downtown and central Duluth. The 15th Avenue West 19
Substation Modernization project was designed to rebuild and modernize the existing 20
15th Avenue West Substation, including new 14 kV switchgear on adjacent property, 21
one new 115 kV/14 kV transformer, replacement of three 115 kV breakers and other 22
115 kV equipment, and miscellaneous site improvements. Many of these assets 23
within the substation are nearing the end of their useful life. 24
25
Construction of the 15th Avenue West Substation Modernization project is expected 26
to begin in 2016 and continue in stages through 2018. The overall cost of the project, 27
spread over these years, is estimated to cost approximately $8.5 million. The 15th 28
Avenue West Substation Modernization project will ensure a continuous and reliable 29
power supply for the downtown and central Duluth area in the most cost-effective and 30
least-environmentally-impactful manner possible. 31
64 Docket No. E015/GR-16-664
Fleege Direct and Schedules
2. Advanced Metering Infrastructure and Technologies 1
Q. What is AMI? 2
A. AMI is a two-way communication between utilities and customers that provides an 3
integrated system of smart meters, communications networks, and data management. 4
5
In 2007, Minnesota Power began evaluating the technology requirements for 6
deployment of a Critical Peak Pricing rate project and evaluated both specific 7
technological solutions as well as AMI technology solutions to support this potential 8
rate design offering for customers. Minnesota Power determined that investment in 9
AMI technology could meet both the needs of the Critical Peak Pricing program and 10
help to transition to a next generation technology required to overcome some of the 11
operating and emerging obsolescence challenges associated with the Automated 12
Meter Reading (“AMR”) technology. 13
14
In early 2009, Minnesota Power took the initiative to apply for funding a pilot project 15
as part of the Department of Energy (“DOE”) American Recovery and Reinvestment 16
Act (“ARRA”) Smart Grid Investment Grant (“SGIG”). The scope of the pilot 17
project included deployment of AMI meters and Smart Grid technologies and 18
infrastructure that Minnesota Power had been actively evaluating to address the 19
obsolescence and operational challenges associated with the current AMR meter 20
population. The Minnesota Power SGIG proposal was one of the projects selected by 21
the DOE in 2010 and received a matching grant of approximately $1.55 million 22
dollars toward the total project cost of $3.1 million dollars. The project was 23
implemented over four years from 2010 to 2014. The scope of this pilot project 24
included: deployment of more than 8,000 AMI meter devices and system 25
infrastructure, establishment of a “limited” meter data warehouse, upgrade of the dual 26
fuel system, automation of two distribution feeders located in Duluth, and 27
incorporation of a consumer behavior study, in which the interim report was 28
completed in March 2014, with the final report completed in August 2016. 29
30

65 Docket No. E015/GR-16-664
Fleege Direct and Schedules
Q. How is Minnesota Power’s AMI being used? 1
A. Since 2011, the Outage Management System (“OMS”) has been integrated with the 2
Company’s AMI system. This integration provides real-time messages from the AMI 3
system when the power goes out at the customer service and when the power is 4
restored to a customer service. The AMI-OMS integration also allows service 5
dispatchers to “ping” individual customer meters to verify power restoral and service 6
status manually. This feature is integrated into the current OMS screens utilized by 7
the dispatchers. 8
9
Overall, where the AMI system is deployed, it allows efficient metering access and 10
enhanced communication and situational awareness between Minnesota Power and its 11
customers. With the meters acting as “smart nodes” on each premise, a multitude of 12
benefits can be derived, including: efficient deployment of advanced time-based 13
customer rate offerings, outage notifications, and notification of service issues (such 14
as low/high voltage and tamper warnings), improved load control, and more frequent 15
customer usage data, and potentially the ability to more quickly reconnect customers 16
who may have been involuntarily disconnected due to non-payment. The expansion 17
of Minnesota Power’s AMI capabilities lays the groundwork for further Smart Grid 18
initiatives and improvements to the customer experience. 19
20
Q. How has the AMI system directly benefited customers? 21
A. Since the AMI system installation was initiated, there have been many customer 22
benefits realized. One of the most critical improvements is the read rate improvement 23
versus the AMR system, which has resulted in fewer estimated bills sent to 24
customers. The deployment of the AMI system has also led to cost savings that I 25
discuss later in my testimony. 26
27
Another critical benefit has been the ability for the AMI system to detect an over-28
temperature or “hot socket” condition prior to a potential catastrophic failure at a 29
meter socket. Minnesota Power began tracking these alarms since 2012 and has had 30
66 Docket No. E015/GR-16-664
Fleege Direct and Schedules
82 unique hazard alarms, 58 of which were conditions that required further action to 1
remediate a hazard. 2
3
Q. Are there other potential benefits for customers from the AMI system? 4
A. Yes. As Company witness Ms. Tina Koecher discusses in more detail, the Company 5
is proposing to implement a pilot to reduce customer reconnection charges. This will 6
be a significant customer benefit when Minnesota Power has the ability to reconnect 7
customers remotely following the disconnect process. This will allow Minnesota 8
Power to perform this traditionally manual task at a much lower cost and within a 9
shorter time frame in a safer manner for employees as they are not exposed to 10
electrical hazards in the process. These are just a few of the benefits that AMI has 11
provided or can provide for customers. 12
13
3. Customer Service CIS/CC&B Capital Project 14
Q. Please describe the Customer Information System Project (“CIS Project”). 15
A. Minnesota Power implemented a new customer information system (“CIS”) in May 16
2015. This system is CC&B from Oracle. The Company upgraded a vintage 1994 17
mainframe green screen system that served Minnesota Power and its customers well 18
for twenty years. The CIS Project’s scope of functionality included billing, rates, 19
service requests, payments, credit and collections, meter reads, and customer account 20
maintenance. The CC&B system went live with the majority of required 21
functionality in May 2015. Credit & collections functionality was started in CC&B in 22
mid-June, 2015. 23
24
The new CIS allows Minnesota Power to greatly enhance and improve its current 25
communication with customers while establishing industry best practices. For 26
example, a second phase to the system will feature an on-line portal for customers so 27
that they will have increased options to not only transact with Minnesota Power over 28
the phone, but also on-line, and provide customer self-service functionality. 29
30

67 Docket No. E015/GR-16-664
Fleege Direct and Schedules
Q. Did the old CIS system create operational inefficiencies? 1
A. The old CIS system had difficulty integrating with other systems and applications. 2
As the CIS was developed so many years ago, programs to communicate with 3
external systems were not part of the application as you would see with systems 4
today. Developing and maintaining interface processes was very time consuming and 5
labor intensive. The new CC&B system has these integration components as out-of-6
the-box functionality and are much easier to create and maintain. 7
8
Q. What was the total capital cost to implement the CIS Project? 9
A. The total capital cost to implement the CIS Project was $19.01 million (ALLETE).23 10
11
Q. What was Minnesota Power’s capital cost to implement the CIS Project? 12
A. Minnesota Power’s capital addition to implement the CIS Project was $17.38 million 13
(Total Company). The capital incurred to implement the CIS is summarized in 14
Table 17. 15
16
Table 17 17 CIS – CC&B Capital
2010-2017 (Dollars in Millions) Actual & Budget invested in the respective year
Description 2010
Actual 2011
Actual 2012
Actual 2013
Actual 2014
Actual 2015
Actual 2016
Forecast 2017
Budget CIS** Replacement $0.27 $7.75 $7.79 $1.57 **Cash flow includes the credit from SWL&P for their portion of the project.
18
Q. When was the CIS Project placed in service? 19
A. The CIS Project was placed in service in May 2015. 20
21
23 The “ALLETE” naming convention includes all of ALLETE, Inc.’s subsidiaries, including its regulated and
non-utility energy focused businesses.

68 Docket No. E015/GR-16-664
Fleege Direct and Schedules
Q. What are Minnesota Power’s incremental O&M costs to operate & maintain the 1
CC&B system that are included in the 2017 test year? 2
A. Three IT employees were hired for the CIS Project and now provide ongoing support 3
for CC&B. Costs of these employees are included in the 2017 test year. Software 4
maintenance for CC&B is also in the 2017 test year budget. These expenses are 5
offset by the removal of costs for the mainframe infrastructure used by the old CIS. 6
In 2014, mainframe-related actual costs totaled $0.604 million dollars per year. The 7
associated savings are also incorporated into the O&M budget for the 2017 test year. 8
9
V. POWER DELIVERY O&M EXPENSE BUDGETS 10
Q. Are O&M expense budgets developed annually by each function? 11
A. Yes. Both the transmission function and the distribution function develop annual 12
budgets and track their individual actual expenditures. Additionally, the Vegetation 13
Management budget, although it is developed by the distribution function, is inclusive 14
of vegetation management for both the transmission and the distribution functions. 15
The overall Transmission and Distribution Department O&M expense budgets are 16
provided in Table 18. 17
18
Table 18 19 Transmission and Distribution O&M Expense
2011-2017 Actuals & Budget (Dollars in Millions)
Description 2011 Actual
2012 Actual
2013 Actual
2014 Actual
2015 Actual
2016 Forecast
2017 Budget
Transmission $15.80 $16.28 $15.50 $16.78 $18.02 $20.28 $22.64
Distribution^ $20.20 $18.50 $18.67 $20.88 $19.88 $20.75 $21.64 Vegetation
Management $4.47 $3.55 $4.80 $4.21 $4.52 $5.25 $5.85
Storm Restoration
++,** N/A $1.2 $1.06 $1.16 $2.02 $0.70** $0.88
++ Estimated Storm & Trouble Restoration Expense. ** Estimated Storm & Trouble Restoration Expense (Jan.-Aug.) for 2016 is $4.19 million dollars. ^ The Vegetation Management and Storm Restoration line items are included in the Distribution total.
20

69 Docket No. E015/GR-16-664
Fleege Direct and Schedules
A. Transmission O&M Expense Budget 1
Q. What is included in the Transmission O&M expense budget? 2
A. The Transmission O&M budget includes expenses associated with the operation and 3
maintenance of our transmission system. This includes internal labor, contract and 4
consulting services, fleet, materials, and other expense categories. 5
6
Q. What is the Company’s Transmission O&M budget for the 2017 test year? 7
A. We have budgeted $22.64 million dollars for Transmission O&M in 2017, which is 8
an increase of $4.62 million from 2015 actual expenses. 9
10
Q. What is driving the increase in the Transmission O&M expense budget? 11
A. While we are anticipating increases in all categories of Transmission O&M expenses, 12
the primary drivers are contract services, consulting, and labor expenses to both merit 13
and currently-delayed hiring, fleet, and the IT/Lease expenses. Overall, these 14
increases result from increased Transmission System needs. 15
16
The greatest contribution to the increase in the Lease and IT expense category is a 17
result of the increase in the SWL&P Transmission Asset Lease Agreement (“TALA”) 18
expense. In 2015, Minnesota Power paid SWL&P $1.302 million dollars. This 19
expense is forecasted to increase to approximately $1.800 million dollars in 2017. 20
This payment has been trending upward since 2010 as a result of SWL&P’s 21
investments in transmission infrastructure. The TALA defines the methodology for 22
calculating the Minnesota Power expense for leasing the SWL&P transmission 23
system. 24
25
We are expecting an increase of $1.39 million in contract and consulting service 26
expenses from 2015 actuals to the 2017 budget. This is primarily due to $0.80 27
million related to increased JPZ expenses to be paid to Great River Energy. 28
29
We are expecting an increase of $0.64 million in internal labor costs from 2015 30
actuals to the 2017 budget largely due to market salary adjustments. Some of these 31

70 Docket No. E015/GR-16-664
Fleege Direct and Schedules
increases are due to staffing to meet additional NERC regulatory programs and 1
compliance. 2
3
Historic low fuel prices and Company salvage credits resulted in a lower net 4
operating expense for Minnesota Power fleet operations in 2015. The budgeted 5
amount of $1.16 million dollars in 2017 is more consistent with historic spending. 6
The fleet and strategic sourcing team continue to reduce costs. These efforts are 7
outlined in the cost control section of my testimony. 8
9
B. Distribution O&M Expense Budget 10
Q. What is included in the Distribution O&M expense budget? 11
A. The Distribution O&M budget includes expenses associated with the operation and 12
maintenance of our distribution system. This includes internal labor, contract 13
services, fleet, materials, and other expense categories. 14
15
Q. What is the Company’s Distribution O&M budget for the 2017 test year? 16
A. We have budgeted $21.64 million dollars for Distribution O&M in 2017, which is an 17
increase of $1.76 million from 2015 actual expenses. 18
19
Q. How does the 2017 budget compare to prior years? 20
A. The 2017 Distribution O&M expense budget is similar to the 2011, 2014, and 2015 21
actuals and the 2016 forecast. 22
23
C. Vegetation Management 24
Q. What is included in the Vegetation Management O&M expense budget? 25
A. The Vegetation Management O&M budget includes expenses associated with the 26
pruning, removal, mowing, and application of herbicide to trees and tall-growing 27
brush adjacent to Minnesota Power’s rights-of-ways to limit preventable vegetation-28
related interruptions. The Company has historically operated on a routine 29
maintenance cycle ranging between five years and six years for the distribution 30
facilities and on a seven-year cycle for transmission facilities. This generally means 31

71 Docket No. E015/GR-16-664
Fleege Direct and Schedules
that vegetation around our electric facilities will be maintained on a routine rotating 1
cycle by circuit. It also includes what is referred to as “hot spotting,” where specific 2
areas or trees are addressed outside of the normal vegetation cycle on an “as needed” 3
basis to address specific concerns (“danger trees” or “trees on wire”) identified by 4
customers or company employees. 5
6
Q. What is the Company’s Vegetation Management O&M budget for the 2017 test 7
year? 8
A. We have budgeted $5.85 million dollars for Vegetation Management O&M in 2017, 9
which is an increase of $1.3 million from 2015 actual expenses due to the need to 10
increase our vegetation management efforts to maintain the reliability and operation 11
of our Transmission System and Distribution System. 12
13
Q. Has Minnesota Power accrued any lessons learned based on its six-year 14
vegetation maintenance cycle? 15
A. Minnesota Power implemented an expense savings initiative in 2011 that focused on 16
establishing longer-term strategic sourcing contracts with fewer vegetation 17
management contractors. This initiative resulted in Minnesota Power securing more 18
competitive pricing through bidding the entire Minnesota Power vegetation 19
distribution maintenance cycle for all 330 circuits over a six-year contract term. 20
These were firm price bids for each of the 330 specific circuits. 21
22
The Company and the contractors have both acknowledged that the six-year term was 23
likely too long. It was difficult for the parties to fully anticipate the challenges 24
associated with changing priorities when responding to unplanned storm events. 25
Minnesota Power has identified the need for more flexibility to address particular 26
circuits requiring action sooner than others based on environmental factors related to 27
weather (i.e., variable growing seasons, micro-climate conditions impacted by 28
moisture, temperatures, and vegetation types). These factors have shaped and 29
influenced Minnesota Power to determine that future contract terms should not 30
exceed three years for future vegetation management bid packages. Minnesota Power 31

72 Docket No. E015/GR-16-664
Fleege Direct and Schedules
acknowledges that the five-year maintenance cycle is an industry best practice goal 1
and is incorporating additional funding necessary to achieve that objective 2
incrementally over the next five years. Minnesota Power will revise our future SRSQ 3
reports to list our circuits that fall outside of the suggested five-year cycle as outlined 4
in the Commission’s Order issued April 7, 2006, in Docket No. E015/M-05-554. 5
6
Q. Are other factors contributing to the increase in the vegetation management 7
expense budget in 2016 and 2017 as compared to the 2015 actuals? 8
A. Minnesota Power is completing the final two years of the six-year contract and both 9
the 2016 and the 2017 budgets reflect some of the more difficult and complex 10
distribution circuits that are physically more challenging and expensive to access and 11
also include longer circuit miles. The 2016 and 2017 years also reflect the higher 12
expenses due to shorter contract terms. The 2017 budget includes the expenses 13
necessary to transition the distribution vegetative cycle over the next five years from 14
a six-year to five-year cycle. This objective can be achieved along with maintaining 15
the seven-year vegetation cycle for transmission facilities by maintaining the current 16
budget levels included in the 2017 test year over the next four years (2018 through 17
2022). 18
19
D. Storm Restoration 20
Q. Are there any new O&M categories that Minnesota Power is seeking to include 21
in its O&M expense budget? 22
A. Yes. For the first time, Minnesota Power is seeking to include Storm Restoration in 23
its O&M expense budget. I note that the amounts included in the Storm Response 24
line of Table 18 are amounts that were included in 2011 to 2015 distribution actuals 25
and included in the 2016 forecast and the 2017 budget. In addition, these are not 26
amounts budgeted for storm response, but are amounts budgeted for overtime. Only 27
the storm response amount noted in 2015 includes additional incremental O&M costs 28
beyond internal overtime labor. 29
30

73 Docket No. E015/GR-16-664
Fleege Direct and Schedules
Q. How has Minnesota Power historically handled storm response from a financial 1
perspective? 2
A. Minnesota Power has not historically budgeted for storm response. In prior years, the 3
historic response to “trouble” events (which includes storm response overtime) has 4
almost exclusively been addressed by the Minnesota Power line workers who are all 5
budgeted in the distribution function responsibility cost center (“RC” or “RC 190”). 6
This had been the Company’s operating experience for the past 15 years. Minnesota 7
Power has successfully restored service to customers following other significant 8
storm events and had not needed to request mutual assistance from other utility 9
partners for over 15 years prior to July 12, 2015. 10
11
Q. How much did the Duluth/North Gull Lake Storm on July 21, 2016, cost the 12
Company? 13
A. We are still waiting to receive final billings from some of our mutual aid partners 14
who assisted in the July storm restoration effort. However, our latest estimate is 15
approximately $5.7 million (Total Company) dollars in total costs (combined 16
Company capital and associated O&M). Although the July 2016 storm work order 17
reconciliation and final accounting adjustments are still pending, we are estimating 18
the incremental O&M component to be approximately $2.929 million dollars. Given 19
the increase in storm restoration costs in recent years, in 2016, the Company filed a 20
petition for deferred accounting treatment related to storm response (Docket No. 21
E015/M-16-648) in an effort to recover costs incurred to restore the Minnesota Power 22
Transmission System and Distribution System after the July 2016 storm. 23
24
Q. How did Minnesota Power estimate a historic “storm & trouble” restoration 25
amount for use in this rate case? 26
A. The methodology that Minnesota Power is using to determine the total annual amount 27
of incremental O&M storm restoration expense is detailed in Exhibit ___ (CEF), 28
Schedule 4. The information provided in Exhibit __ (CEF), Schedule 4 provides the 29
actual overtime expense that RC 190 line workers worked from 2010 to 2015. 30
31

74 Docket No. E015/GR-16-664
Fleege Direct and Schedules
Based on this, we believe that it is prudent to establish a “storm and trouble” response 1
budget as part of this rate review. This budget would include storm expenses, 2
including the smaller weather-related events that are currently handled by overtime 3
from RC 190. 4
5
Q. What is the annual funding amount that Minnesota Power is proposing for 6
establishing the storm restoration budget? 7
A. Minnesota Power is requesting authority to establish a “storm and trouble” restoration 8
budget amount total of $2.474 million dollars per year. Minnesota Power has already 9
budgeted in 2017, in the RC 190, $0.876 million dollars for O&M Overtime Labor 10
Expense that would become part of the new storm budget. The net impact would be 11
an additional increase of $1.598 million dollars of O&M expenses (per year) to be 12
added into the distribution function. The methodology that Minnesota Power used to 13
determine the total annual amount of incremental O&M storm restoration expense of 14
$2.474 million dollars is detailed in Exhibit __ (CEF), Schedule 4. The requested 15
amount is calculated by averaging the last three years of incremental O&M (2014, 16
2015, and 2016 estimated). The incremental amount required to establish a “storm 17
and trouble” restoration budget amount has not been included in the 2016 forecast or 18
2017 test year budget in this rate case given the timing of when this issue arose in 19
2016 for the Company. The Company will provide and incorporate the additional 20
amount in its Rebuttal Testimony updates in this rate review. 21
22
VI. OTHER COMPLIANCE REQUIREMENTS 23
A. FERC Return on Equity 24
Q. Please explain the relevance of the pending FERC proceedings in FERC dockets 25
El14-12-000 and El15-45-000. 26
A. In November 2013, a group of customers filed a complaint at FERC against MISO 27
transmission owners, including the Minnesota Power system (Docket No. EL14-12-28
000). The complaint argued for a reduction in the ROE in transmission formula rates 29
in the MISO region from 12.38 percent to 9.15 percent, a prohibition on capital 30
structures in excess of 50 percent equity, and the removal of ROE incentive adders. 31
75 Docket No. E015/GR-16-664
Fleege Direct and Schedules
1
FERC initiated hearing procedures regarding the appropriate ROE to be used in 2
MISO transmission owner formula rates and established a November 12, 2013, 3
refund effective date. Hearings were held during August 2015. An Administrative 4
Law Judge (“ALJ”) initial decision of 10.32 percent was issued and a FERC Order 5
was issued on September 28, 2016, confirming that 10.32 percent was the appropriate 6
ROE for the MISO transmission owners. 7
8
A separate group of customers filed an additional complaint in February 2015 9
proposing to reduce the MISO region ROE to 8.67 percent (Docket No. EL15-8-000). 10
FERC has established a refund effective date of February 12, 2015 for this second 11
complaint and has initiated hearing procedures. Hearings were held in February 12
2016, and an initial ALJ decision of 9.7 percent was issued June 30, 2016. FERC 13
estimated it would issue an order at the end of May 2017. 14
15
Q. Have the MISO transmission owners filed any requests? 16
A. In November 2014, the MISO transmission owners filed a request for FERC approval 17
of a 50 basis point ROE incentive adder for participation in the MISO Regional 18
Transmission Organization (“RTO”). In January 2015, FERC approved the request, 19
effective January 6, 2015, and subject to the outcome of the ROE complaints. This 20
incentive adder will be added to the ROE ordered by FERC in the outstanding 21
complaints, with the limitation that the final ROE, including the incentive adder, 22
cannot exceed the upper limit of the range of reasonableness to be established in the 23
ROE complaints. The FERC Order approved an ROE of 10.32 percent, less than the 24
previously-authorized ROE of 12.38 percent. A reduction in the ROE used in 25
transmission formula rates will result in decreased wholesale transmission revenues, 26
net of third-party transmission expenses, thereby reducing the resulting revenue credit 27
to Minnesota customers. 28
29

76 Docket No. E015/GR-16-664
Fleege Direct and Schedules
Q. What ROE was assumed for purposes of this case? 1
A. The 2017 test year budget for wholesale transmission revenue and third-party 2
transmission expense was prepared based on the currently-authorized FERC ROE of 3
12.38 percent. However, the Company was accruing for the anticipated reduction in 4
revenues and expenses based on the recommendation of the ALJ (10.32 percent),24 5
which is the same ROE FERC ordered in September 2016. Therefore, no adjustments 6
need to be made to the 2017 test year budget based on this FERC order. 7
8
B. MISO Participation 9
Q. Please describe the 2017 Minnesota Power system third-party transmission 10
expenses and revenue. 11
A. There are several types of third-party costs. These are Minnesota Power transmission 12
costs necessary to serve Minnesota Power Transmission System loads, including 13
Minnesota Power retail native loads in Minnesota, pursuant to rate schedules accepted 14
for filing by FERC. The Minnesota Power transmission system is part of the regional 15
transmission system planned by MISO. 16
17
Q. Does Minnesota Power have any compliance items related to its participation in 18
MISO? 19
A. Yes. In Docket Nos. E999/AA-09-961 and E999/AA-10-884, the Commission 20
required all utilities to continue to show benefits of participation in MISO in their rate 21
proceedings. 22
23
Q. What are the benefits of Minnesota Power’s participation in MISO? 24
A Minnesota Power participates in the MISO Day-Ahead, Real-Time, and Ancillary 25
Services Market. Minnesota Power’s generation is dispatched in response to MISO 26
market price signals. This has allowed Minnesota Power to use its generation 27
resources to meet customer needs when Minnesota Power generation is the lowest-28
cost resource and to reduce its generation and purchase energy in the wholesale 29
24 This recommendation does not include the 50 basis point adder that Minnesota Power is allowed to earn in
addition to this 10.32 percent ROE.
77 Docket No. E015/GR-16-664
Fleege Direct and Schedules
market when market energy is the lowest-cost resource. As a result, the MISO 1
market structure has allowed Minnesota Power to continue to make extensive use of 2
the wholesale power market to secure low-cost energy for its customers. 3
4
Other benefits of the MISO market include increased purchase options, more 5
transparent pricing, and the ability to purchase only the amount of energy needed 6
each hour rather than buying energy blocks provided by a traditional bilateral market. 7
MISO also performs certain NERC compliance responsibilities on behalf of all 8
transmission owners, in lieu of each transmission owner having to complete these 9
responsibilities. All of these benefits have provided savings for our retail customers. 10
The benefits of MISO have more than offset the additional cost incurred to implement 11
the market. In addition, the MISO market allows Minnesota Power and other MISO 12
members access to an expansive footprint consisting of a diverse set of generation 13
and transmission resources, which, when coupled with appropriate rules and an 14
independent market monitoring function, fosters a robust wholesale energy market. 15
16
Q. What are the 2017 test year wholesale transmission revenues? 17
A. As shown in Exhibit ___ (CEF), Schedule 5 to my Direct Testimony, the total 18
Minnesota Power system 2017 test-year wholesale net revenues are estimated to be 19
$1.44 million dollars, an increase from ($4.29) million dollars in 2015 (an expense). 20
The negative values in 2015 and 2016 reflect Minnesota Power’s accrual to account 21
for the potential refunds to wholesale customers resulting from the FERC ROE 22
complaints. 23
24
VII. COST CONTAINMENT EFFORTS 25
Q. What cost containment efforts has the Transmission and Distribution 26
Department undertaken since the Company’s last rate review? 27
A. All groups within the Transmission and Distribution Department routinely work to 28
identify ways in which we can complete our jobs more efficiently, and cost 29
containment is inherent in that analysis. In addition to headcount reductions 30
discussed by Company witness Ms. Nicole Johnson in her Direct Testimony and 31

78 Docket No. E015/GR-16-664
Fleege Direct and Schedules
reductions identified by Company witness Mr. Steven Morris in his Direct 1
Testimony, the Transmission and Distribution Department has undertaken several 2
other cost containment efforts consistent with Order Point 15 in our last rate case 3
(Docket No. E015/GR-09-1151). These efforts are in the areas of the CC&B savings 4
I mentioned earlier in my testimony, fleet costs, service center consolidations, 5
electronic payment processing convenience fees for customers, and meter operations. 6
These are summarized in Exhibit ___ (CEF), Schedule 6 to my Direct Testimony. 7
Cost savings that have been identified by the Transmission and Distribution 8
Department are reflected in our 2017 O&M budgets. 9
10
Q. What actions has the Transmission and Distribution Department taken with 11
respect to fleet costs? 12
A. Minnesota Power has worked closely with our fleet operations and purchasing teams 13
to evaluate the savings potential between leasing our fleet vehicles and purchasing 14
them. As noted in my earlier testimony, Minnesota Power will begin transitioning to 15
purchasing fleet vehicles over the next seven years, and away from our historic 16
practice of using operating leases. We have included an additional capital category 17
beginning in the budget year 2017 for $5.4 million dollars. This will provide a Net 18
Present Value (“NPV”) savings to our operations and ultimately for customers of $3.0 19
million dollars and an annual benefit of $0.158 million dollars per year (over 30 20
years). The first year savings is estimated to be approximately $19,000. The savings 21
anticipated for 2017 have been incorporated into the fleet budget. 22
23
Q. Are there other actions that fleet operations has taken to reduce expenses for 24
customers? 25
A. Fleet operations has initiated a series of initiatives to reduce the operating cost, which 26
ultimately translates into reduced costs for our customers. These initiatives are listed 27
as “Fleet Costs” in Exhibit ___ (CEF), Schedule 6 to my Direct Testimony. 28
29

79 Docket No. E015/GR-16-664
Fleege Direct and Schedules
Q. Please explain how the closure of service centers will result in cost reductions for 1
the Company. 2
A. Minnesota Power initiated and completed an evaluation of the Minnesota Power 3
service center locations in late 2014. The study was completed in May of 2015 with 4
recommendations for a phased repositioning. Phase 1 recommended closure of three 5
of the existing service centers (Nisswa, Aurora, and Chisholm). The locations are 6
identified in Exhibit ___ (CEF), Schedule 7 to my Direct Testimony. The service 7
center employees were notified in July 2015 that their new reporting locations would 8
be effective on October 1, 2015. The closure of these three service centers was 9
justified on the net O&M savings and avoided capital investments. The savings 10
analysis factored in the potential inefficiencies with planned capital work and 11
possible customer impacts to service quality. 12
13
The Company anticipated that the service center consolidation would also support 14
implementing a more robust crew scheduling at the remaining service centers and the 15
deployment of technology to mitigate some of the potential customer service quality 16
concerns. The service center closure plan did not result in worker reductions. The 17
goal was to take the smaller staffed service centers and combine them so that a larger 18
number of employees were consolidated at the remaining service center facilities. 19
This provides more opportunity for straight-time coverage during the week and a 20
larger number of line workers to draw on for “trouble” call out coverage. The 21
closures result in $2.2 million in avoided capital costs. The O&M savings are 22
estimated at between $36,000 and $90,000 dollars per year. 23
24
Minnesota Power will continue to serve the communities’ and customers’ energy 25
needs but under a new delivery model that improves our efficiency and effectiveness. 26
27
Q. What cost savings have been achieved through the Company’s AMI 28
deployment? 29
A. First, in deploying the AMI system, the Company identified, in 2012, the opportunity 30
to save $0.28 million by purchasing AMI meters for load research instead of those 31

80 Docket No. E015/GR-16-664
Fleege Direct and Schedules
purchased in earlier stages of the project. Second, the use of the AMI system resulted 1
in a $0.15 million annual savings for the Company’s Dual Fuel program. The AMI 2
platform reduced the required annual capital by $0.15 million associated with 3
expensive disconnect switches that were no longer needed. The AMI also provided 4
an annual O&M savings of $0.05 million per year because of simplified asset 5
management requirements. 6
7
Q. What has the Company done with respect to electronic payment processing 8
convenience fees for customers? 9
A. Starting in July of 2012, Minnesota Power renegotiated our payment processing 10
agreement with our payment processing vendor for customers electronically paying 11
their monthly bills. Prior to 2012, if a customer paid their monthly bill electronically, 12
they were charged a $3.50 per-transaction convenience fee. As part of this 13
renegotiation, Minnesota Power was able to reduce this fee to $2.95 per transaction. 14
We began tracking and quantifying cost savings in 2013 and have determined that 15
this renegotiated agreement results in a savings of $50,000 to $60,000 per year for our 16
customers. The Company has proposed a new program to allow customers to pay 17
their monthly bills by debit or credit card without the individual per-transaction fee, 18
as discussed in more detail by Company witness Ms. Tina Koecher. 19
20
Q. Are there other cost savings measures that have been undertaken by the 21
Transmission and Distribution Department that are not quantified in your 22
testimony? 23
A. Yes. As discussed by Company witness Mr. Morris, each department within the 24
Company is continuously monitoring its operations to identify ways in which cost 25
containment measures may be initiated or ways we can more efficiently serve our 26
customers. For example, the T&D leaders initiated a review of the number and 27
justification for determining which employees should be authorized for “take home” 28
or “call out” vehicles. This resulted in T&D reducing the number of essential “take 29
home” vehicles by over 30 in August 2015. We also implemented a vehicle idling 30
policy with all power delivery employees in May 2015, encouraging employees to 31

81 Docket No. E015/GR-16-664
Fleege Direct and Schedules
turn off their vehicles upon arriving at their work sites (except under extreme weather 1
conditions) in an effort to save fuel and reduce emissions. In alignment with our 2
idling policy, our fleet group took action to ensure that all “warning strobe and hazard 3
lights” on all line trucks and other fleet vehicle classes could be operated by battery 4
without the risk of running the battery down while parked along a road side. These 5
two actions resulted in noticeable saving in fuel consumption. 6
7
We are also piloting the use of iPads for our substation inspections and are observing 8
efficiency gains and savings associated with improved record keeping and more 9
timely identification of maintenance and corrective work as well as higher employee 10
satisfaction. We also committed to IT that this group of employees would only use 11
one mobile device. The iPad is for emails, entering time, completing expense reports, 12
etc. The iPad also eliminates the need for a laptop. 13
14
Q. Are there any broader cost containment efforts that the Transmission and 15
Distribution Department has initiated? 16
A. Yes. In conjunction with the ALLETE Human Resources team, the Transmission and 17
Distribution Department has initiated a lean Six Sigma “green-belt” training program. 18
Six Sigma is a set of techniques and tools for process improvement. While we are 19
just beginning this initiative, it further supports our efforts for continuous 20
improvement of our business practices. At this time, we have graduated over a dozen 21
champions and green belts in the Transmission and Distribution Department. 22
23
VIII. CONCLUSION 24
Q. Does this conclude your Direct Testimony? 25
A. Yes. 26
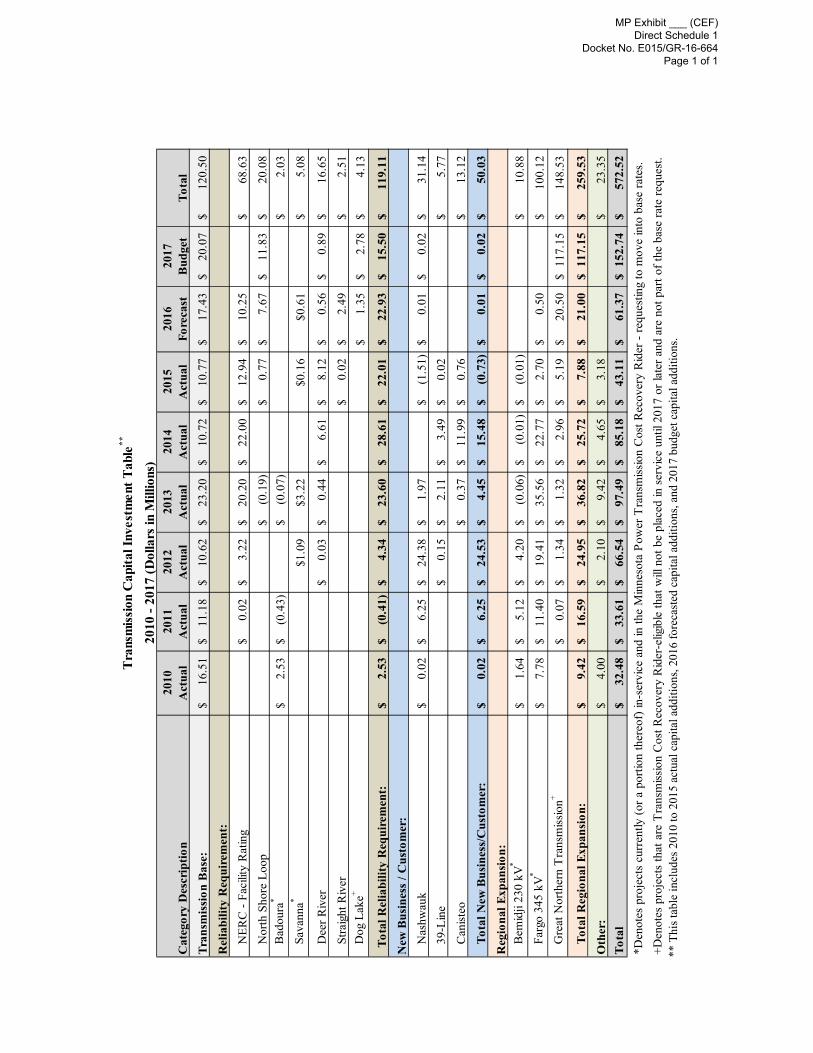
** T
his t
able
incl
udes
201
0 to
201
5 ac
tual
cap
ital a
dditi
ons,
2016
fore
cast
ed c
apita
l add
ition
s, an
d 20
17 b
udge
t cap
ital a
dditi
ons.
Tra
nsm
issi
on C
apita
l Inv
estm
ent T
able
**
2010
- 20
17 (D
olla
rs in
Mill
ions
)
Cat
egor
y D
escr
iptio
n20
10
Act
ual
2011
A
ctua
l20
12
Act
ual
2013
A
ctua
l20
14
Act
ual
2015
A
ctua
l20
16
Fore
cast
2017
B
udge
tTo
tal
Tran
smis
sion
Bas
e:16
.51
$
11
.18
$
10.6
2$
23
.20
$
10.7
2$
10
.77
$
17.4
3$
20.0
7$
12
0.50
$
Rel
iabi
lity
Req
uire
men
t:
N
ERC
- Fa
cilit
y R
atin
g0.
02$
3.22
$
20
.20
$
22.0
0$
12
.94
$
10.2
5$
68.6
3$
N
orth
Sho
re L
oop
(0.1
9)$
0.77
$
7.
67$
11
.83
$
20.0
8$
Bad
oura
*2.
53$
(0.4
3)$
(0.0
7)$
2.03
$
Sava
nna*
$1.0
9$3
.22
$0.1
6$0
.61
5.08
$
D
eer R
iver
0.03
$
0.
44$
6.61
$
8.
12$
0.56
$
0.89
$
16
.65
$
St
raig
ht R
iver
0.02
$
2.
49$
2.
51$
D
og L
ake+
1.35
$
2.78
$
4.
13$
Tot
al R
elia
bilit
y R
equi
rem
ent:
2.53
$
(0
.41)
$
4.
34$
23.6
0$
28
.61
$
22.0
1$
22
.93
$
15
.50
$
119.
11$
New
Bus
ines
s / C
usto
mer
:
N
ashw
auk
0.02
$
6.
25$
24.3
8$
1.
97$
(1.5
1)$
0.01
$
0.02
$
31
.14
$
39
-Lin
e0.
15$
2.11
$
3.
49$
0.02
$
5.
77$
C
anist
eo0.
37$
11.9
9$
0.
76$
13.1
2$
To
tal N
ew B
usin
ess/
Cus
tom
er:
0.02
$
6.
25$
24.5
3$
4.
45$
15.4
8$
(0
.73)
$
0.
01$
0.
02$
50.0
3$
Reg
iona
l Exp
ansi
on:
B
emid
ji 23
0 kV
*1.
64$
5.12
$
4.
20$
(0.0
6)$
(0.0
1)$
(0.0
1)$
10.8
8$
Farg
o 34
5 kV
*7.
78$
11.4
0$
19
.41
$
35.5
6$
22
.77
$
2.70
$
0.
50$
10
0.12
$
G
reat
Nor
ther
n T
rans
miss
ion+
0.07
$
1.
34$
1.32
$
2.
96$
5.19
$
20
.50
$
11
7.15
$
148.
53$
To
tal R
egio
nal E
xpan
sion
:9.
42$
16.5
9$
24
.95
$
36.8
2$
25
.72
$
7.88
$
21
.00
$
11
7.15
$
259.
53$
Oth
er:
4.00
$
2.
10$
9.42
$
4.
65$
3.18
$
23
.35
$
Tota
l32
.48
$
33
.61
$
66.5
4$
97
.49
$
85.1
8$
43
.11
$
61.3
7$
152.
74$
57
2.52
$
*Den
otes
pro
ject
s cu
rren
tly (o
r a p
ortio
n th
ereo
f) in
-ser
vice
and
in th
e M
inne
sota
Pow
er T
rans
miss
ion
Cos
t Rec
over
y R
ider
- re
ques
ting
to m
ove
into
bas
e ra
tes.
+Den
otes
pro
ject
s th
at a
re T
rans
miss
ion
Cos
t Rec
over
y R
ider
-elig
ible
that
will
not
be
plac
ed in
ser
vice
unt
il 20
17 o
r lat
er a
nd a
re n
ot p
art o
f the
bas
e ra
te re
ques
t.
MP Exhibit ___ (CEF) Direct Schedule 1
Docket No. E015/GR-16-664 Page 1 of 1

MP Exhibit ___ (CEF) Direct Schedule 2
Docket No. E015/GR-16-664 Page 1 of 1

11
TCR Rider recovery.7 We believe our proposed inclusion of the Buffalo Ridge restoration project costs in the 2011 tracker is consistent with this past practice, assuming the Commission agrees the Buffalo Ridge project is eligible for TCR Rider recovery.
4. Insurance Proceeds and Other Compensation
The Department indicated the Company should be allowed to request recovery of the Buffalo Ridge restoration costs in our next rate case, but recommended the Commission require the Company to provide information in that rate case about whether we received any insurance proceeds, other compensation, or a reduction in taxes as a result of the storm damage. We provide the information below to assure the Commission that granting recovery of the Buffalo Ridge restoration costs through the TCR Rider will not result in double recovery.
We will not receive any insurance proceeds related to the storm damage. The Company does not purchase insurance covering storm damage to either our transmission system or distribution lines. From time to time, we investigate the availability and cost of such insurance, but both factors indicate that purchasing a policy would be prohibitively expensive for our customers. For example, the last time the Company investigated such insurance, the premium for each $1 million of coverage was approximately $300,000 per year. That cost would be included in rates. While there are electric utilities that purchase such coverage, they are all located in hurricane prone areas. Since the Company experiences large scale damage less frequently than utilities in hurricane zones, and given the cost of insurance coverage, it is less expensive to our customers over the long term for the Company to repair damage to our transmission system caused by storms as it occurs than to purchase insurance.
Further, the Company has not received and does not expect to receive other compensation or a tax reduction that would offset the Buffalo Ridge restoration costs. As such, it is not necessary for the Commission to require a compliance report in the Company’s next rate case.
C. Project Costs for Bemidji and Brookings CapX2020 Projects
The Department recommends that the Commission impose a “cost cap” on TCR Rider recovery of the cost of the CapX2020 Bemidji project, and requests further information regarding whether certain costs were included in the CapX2020
7 April 27, 2010 Order at p. 4-5.
MP Exhibit ___ (CEF) Direct Schedule 3
Docket No. E015/GR-16-664 Page 1 of 10
12
Brookings project. The Company requests that the Commission and Department consider the following reply.
1. Certificate of Need Cost Estimate Caps
While certain Commission orders have imposed caps on costs recovered through the TCR Riders, the statutes enabling utilities to recover transmission and renewable investments through these riders contain no provisions for such caps. As such, we believe the Commission can consider in this case whether the use of cost caps continues to be appropriate.
The Commission first considered the issue of a cost cap on a transmission project in Docket No E002/M-10-1048 related to the Blue Lake-Wilmarth 345 kV line, where the Company sought recovery under the RCR Statute. The Commission did not allow recovery in the TCR Rider of the anticipated $1.7 increase on a project initially expected to cost $6 million. The Company did not ask the Commission to reconsider the decision at the time. This was in part because we received a contribution in aid of construction which reduced our total investment to less than $6 million, meaning the Company’s total investment was ultimately less than the cap.
We also recognize there may be circumstances where using cost caps on rider recovery could be appropriate. For example, the Commission initially established the cost cap concept when considering RES rider recovery of the Nobles wind project costs. The Commission limited RES Rider recovery to the cost estimates in the original Certificate of Need estimate, and ruled that costs above that level would be reviewed for possible inclusion in a subsequent rate case subject to a prudence determination. Part of the Commission’s reasoning was that the initial project cost estimates were those used in a bidding process where the Nobles project competed against other generation projects. As costs were a factor related to competition with other generation projects, the Commission determined allowing RES Rider recovery of increased project costs was not appropriate without additional review in a rate case.
We do not believe, however, the same rationale is applicable to eligible transmission projects. While cost is considered in determining whether a transmission line is needed, more important are reliability and customer demand considerations. We move forward with transmission projects when needed to meet demand or improve reliability, and utilities are the only entities allowed to construct such facilities.
One of the reasons the Legislature enacted the TCR Statute to allow rider recovery was because it recognized the complexity of the transmission permitting, siting, routing, and construction process and length of time required to complete projects.
Page 2 of 10MP Exhibit ___ (CEF) Direct Schedule 3
Docket No. E015/GR-16-664 Page 2 of 10

13
Imposing a cap on rider recovery and deferring review of certain costs to a future rate case is contrary to the intent of the statute. The estimates we include in a Certificate of Need (CON) application are outdated by the time we begin seeking rider recovery of costs for eligible transmission projects. To facilitate the need determination, we provide high-level planning cost estimates. Detailed design and engineering is not performed at this stage in order to minimize total costs in the event the CON is not granted. Permitting, land acquisition, and ancillary project costs are difficult to predict during this initial phase as well, as the route and pole alignments are not known.8
The Legislature foresaw significant investment in transmission was needed to accommodate projected new electric generating capacity when enacting the TCR Statute. To encourage the Company and other utilities to invest in transmission facilities, the Legislature provided the Commission with the authority to grant cost recovery through a rider outside of a general rate case. The Commission was authorized to approve an annual cost recovery mechanism and make prudency determinations as part of those proceedings. As noted, the TCR Statute provides:
the commission shall approve the annual rate adjustments provided that, after
notice and comment, the costs included for recovery through the tariff were or
are expected to be prudently incurred and achieve transmission system
improvements at the lowest feasible and prudent cost to ratepayers.
(Emphasis added.)
The Department comments do not assert that specific project costs were not prudently incurred. Indeed, the Commission has never previously determined any Company transmission project costs to be ineligible for rate recovery as imprudent, and we believe the estimated Bemidji project costs reflected in our TCR Rider petition can be expected to be prudent. Our annual TCR Rider proceedings can be the appropriate forum for making any prudency determination. Alternatively, if the Commission prefers, however, prudence review for individual projects could be deferred to the rate case after a project is placed in service. However, under the “expected to be prudently incurred” standard in the TCR Statute, the Commission should not disallow TCR Rider recovery of the costs of eligible projects if there is no assertion of imprudence.
8While not the norm, the Company has on occasion not included the routing, permitting, and siting-related
costs in a certificate of need proceeding for a transmission project that involves a complex routing project. For example, the cost estimates provided in the recently approved Hiawatha 115 kV transmission project did not contain these costs during consideration of the certificate of need. It was not until the final route had been approved that these costs were able to be reasonably quantified and included in the total project costs. Even when such costs are included in a certificate of need application, the estimates generally will not be able to reflect all federal, state, and tribal permitting complexities, or siting and land acquisition details.
Page 3 of 10MP Exhibit ___ (CEF) Direct Schedule 3
Docket No. E015/GR-16-664 Page 3 of 10

14
We appreciate that the Department’s comments indicating some flexibility in the level of costs allowed in the TCR Rider may be appropriate. For example, the Department indicates use of an appropriate escalator to reflect increasing costs over time, or allowing recovery of additional costs incurred due to unforeseen or extraordinary circumstances may be appropriate.
However, as we make significant transmission investments going forward – for example, we plan to invest over $1 billion in the CapX2020 projects – the TCR Rider mechanism for recovering these costs is important to provide the benefit intended by the statutes. The statutes were designed to promote investment in the transmission system to improve reliability and access to renewable generation for our customers. Allowing TCR Rider to recover the capital costs incurred between rate cases is consistent with the intent of the legislation. For these reasons, we believe the Commission should reconsider whether cost caps are appropriate for major transmission projects or alternatively, how they should be established.
In light of these policy considerations, we discuss further below the specific cost increase related to the Bemidji project. We believe this additional information demonstrates our concern with applying the “cost cap” principle to individual transmission projects, and demonstrates that recovery of Bemidji project costs in 2012 TCR Rider rates should not be capped at the level in the 2007 Certificate of Need application, even adjusted for a cost escalator.
2. Bemidji Project
a. Eligible Project Costs
The Bemidji Project is a 70 mile 230 kV transmission line between Bemidji and Grand Rapids that will address reliability concerns in this area. Under the CapX2020 collaborative development arrangements, Otter Tail Power was designated the project manager and prepared and filed the Certificate of Need application in 2007 with assistance by the other CapX2020 project participants, including Xcel Energy. (Docket No. E017, E015 & ET-6/CN-07-1222). The project is currently approximately 98 percent complete, and the first segment of the project was energized in August 2011.
At the time of the Certificate of Need application in 2007, the estimated cost of the Bemidji project cost was $60.6 million (2007 dollars). At the time of the route permit proceeding in 2007 (Docket No. E017, E015 & ET-6/TL-07-1317) the projected cost as approved was estimated to be $66.2 million (2007 dollars). We now estimate the
Page 4 of 10MP Exhibit ___ (CEF) Direct Schedule 3
Docket No. E015/GR-16-664 Page 4 of 10
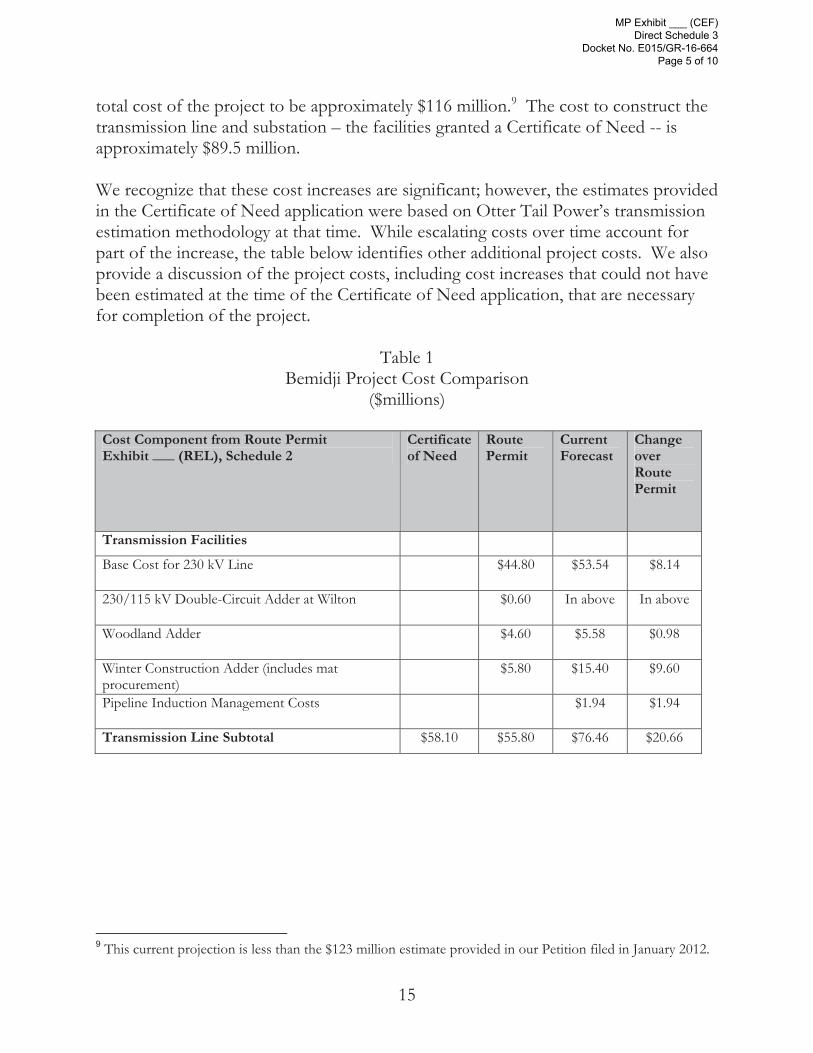
15
total cost of the project to be approximately $116 million.9 The cost to construct the transmission line and substation – the facilities granted a Certificate of Need -- is approximately $89.5 million.
We recognize that these cost increases are significant; however, the estimates provided in the Certificate of Need application were based on Otter Tail Power’s transmission estimation methodology at that time. While escalating costs over time account for part of the increase, the table below identifies other additional project costs. We also provide a discussion of the project costs, including cost increases that could not have been estimated at the time of the Certificate of Need application, that are necessary for completion of the project.
Table 1 Bemidji Project Cost Comparison
($millions)
Cost Component from Route Permit Exhibit ___ (REL), Schedule 2
Certificate of Need
Route Permit
Current Forecast
Change over Route Permit
Transmission Facilities
Base Cost for 230 kV Line $44.80 $53.54 $8.14
230/115 kV Double-Circuit Adder at Wilton $0.60 In above In above
Woodland Adder $4.60 $5.58 $0.98
Winter Construction Adder (includes mat procurement)
$5.80 $15.40 $9.60
Pipeline Induction Management Costs $1.94 $1.94
Transmission Line Subtotal $58.10 $55.80 $76.46 $20.66
9 This current projection is less than the $123 million estimate provided in our Petition filed in January 2012.
Page 5 of 10MP Exhibit ___ (CEF) Direct Schedule 3
Docket No. E015/GR-16-664 Page 5 of 10

16
Cost Component from Route Permit Exhibit ___ (REL), Schedule 2
Certificate of Need
Route Permit
Current Forecast
Change over Route Permit
Associated Facilities
Boswell Substation Expansion $1.00 $0.89 ($0.11)
Wilton Substation Expansion $1.50 $1.24 ($0.26)
Cass Lake Substation Expansion $5.20 $5.70 $0.50
Nary Breaker Station $2.70 $2.25 ($0.45)
Ottertail Power Underlying Facilities $0.24 $0.24
Minnesota Power Underlying Facilities $0.05 $0.05
Nary to Cass Lake OTP $1.60 $1.60
Nary to Cass Lake MPC $1.05 $1.05
Associated Facilities Subtotal $2.50 $10.40 $13.02 $2.62
Permitting, Right of Way and Legal
CON and Route Permit Permitting Costs $9.10 $9.10
Post permit legal fees $3.22 $3.22
Environmental Permitting and Compliance $8.38 $8.38
Right of Way $5.70 $5.70
CapX2020 Joint Sourcing and Management $0.50 $0.50
Total $26.90 $26.90
Transmission Line and Facilities Total $60.60 $66.20 $116.38 $50.18
The following discussion describes the cost increases (or decreases) related to the Bemidji Project:
Page 6 of 10MP Exhibit ___ (CEF) Direct Schedule 3
Docket No. E015/GR-16-664 Page 6 of 10

17
Transmission Facilities Winter Construction Adder. The Project incurred $15.4 million to purchase, install and remove additional wetland protection mats due to warm winter temperatures during 2011-2012, which was $9.6 million more than originally estimated. During normal winters, wetlands in the area freeze so that construction with typical protective measures can continue. This past winter was one of the warmest on record and the wetlands in the project area did not freeze sufficiently to support construction equipment. Continuing construction was more cost-effective than waiting until spring but required additional equipment to protect the wetland areas against damage from heavy traffic and use of construction equipment. To protect the landscape, the Project purchased, installed, and removed an additional 20,000 mats.
Tree clearing and Road Restoration. The Project has incurred approximately $5.6 million thus far. This is an increase of approximately $1.0 million over what was originally estimated. Trees along the route were larger and more dense than anticipated.
Pipeline Induction Mitigation. Electric transmission lines located near natural gas or oil pipelines can induce electrical currents across the pipeline facilities, which can reduce the effectiveness of the pipeline’s corrosion protection system. Portions of the Bemidji Project parallel the Great Lakes Gas Transmission natural gas pipeline along U.S. Highway 2. As a result, the project needed to install special equipment to protect the pipeline facilities. The Project incurred approximately $1.9 million to perform pipeline induction mitigation. This cost was not estimated at the time of the Certificate of Need or Route Permit applications because it was dependent on route alignment and determination of the specifics of the protective techniques required. However, the cost is essential to the safe operation of both the electric and pipeline facilities.
Transmission Line Construction. The cost to construct the transmission line facilities is now estimated to cost approximately $8.1 million more than the $45.4 million estimate (2007 dollars) provided during the Route Permit proceeding. It is common for facility cost estimates to be updated using the Handy Whitman Index, an industry index specifically used to estimate the impacts of inflation on transmission projects over time. Applying the Handy Whitman index values for the 2007 to 2012 period to the $45.3 million estimate would result in an estimated cost increase of $8.2 million, slightly more than the current estimate. See Attachment C. Therefore, the increase in transmission line construction costs over the five years since the route permit was issued is consistent with (or slightly less than) the results experienced for similar
Page 7 of 10MP Exhibit ___ (CEF) Direct Schedule 3
Docket No. E015/GR-16-664 Page 7 of 10

18
transmission projects, demonstrating the increases are reasonable.
Associated Facilities The costs of the substation facilities associated with the Bemidji 230 kV line have increased approximately $2.6 million from the estimate provided in the Route Permit application. For those associated facilities that were individually identified and a cost estimate was provided, the costs have actually decreased slightly. The overall increase in cost in this category is thus due to several additional associated facilities that were identified as being needed for the project to be reliably interconnected to substations and the underlying transmission system.
Permitting, Right of Way and Legal As discussed in the Petition, the costs associated with this category of project costs were expected in the regulatory approval processes; however, the specific value of these costs were not quantified at the time of project approval in the Certificate of Need or Route Permit applications. These costs include:
Certificate of Need and Route Permit Costs. The Project has spent approximately $9.1 million on activities to obtain the permits to proceed with this project, including the Certificate of Need and Route Permit.
Post Permit Legal Fees. The Project has spent approximately $3.2 million on legal fees since the Certificate of Need and Route Permit were granted. This includes the legal fees to litigate our dispute with the Leech Lake Band of Ojibwe (the Tribe) over the route through tribal land, and to obtain and comply with permits. At the time the project applied for a Certificate of Need, we did not foresee a protracted litigation would be needed to site this project and reach the best outcome for all parties involved.
Environmental Permitting and Compliance. Approximately $8.4 million has beenspent on environmental permitting and compliance matters. For example, this includes $2.2 million paid to the U.S. Forest Service for permits, wetland restoration, hunting and gathering rights for the Tribe and agency monitoring.
Right of Way. Approximately $5.7 million was spent to acquire easements toconstruct this project. It was specifically noted in the Certificate of Need application that right of way costs would be incurred but the costs not included in the cost estimate.
Page 8 of 10MP Exhibit ___ (CEF) Direct Schedule 3
Docket No. E015/GR-16-664 Page 8 of 10

19
We believe all of the costs incurred to date for the Bemidji Project are necessary to complete the project, were prudently incurred and are in the public interest. The CapX2020 entities have taken all of the steps needed to construct and route a successful transmission project. The cost increases meet the “prudent or expected to be prudent” standard in the TCR Statute, and the actual cost of the project (not the 2007 estimate, even if it were adjusted) should provide the basis for the TCR Rider cost recovery.
b. A Cost Cap Should Not be Applied Retroactively
Even if the Commission were to decide to continue to apply the cost cap principle to TCR eligible projects, it would be inappropriate to apply such a cap to the CapX2020 Bemidji project. At the time the project applicants submitted the Certificate of Need application for the Bemidji line in 2007, the Commission had not applied a cost cap to a TCR eligible project. The Commission did not apply this principle to a transmission project until its April 2010 order regarding the Wilmarth/Blue Lake line. Thus, the project applicants could not have known the Commission might later seek to limit TCR Rider rate recovery to the estimates in the CON or Route Permit applications. It would be arbitrary and capricious to apply the cost cap ratemaking principle where the Certificate of Need application was submitted and approved before the Commission ever announced the cost cap principle.
Moreover, while the Bemidji project Certificate of Need estimates did not include cost estimates for all necessary work and permitting, the fact that the project would incur some additional costs was disclosed and known.10 Consistent with Certificate of Need and Route Permitting practice at that time, the project applicants provided high-level estimates to construct the transmission line along various route alternatives. It is not feasible to estimate costs to the granularity needed for rate making purposes when a route and the issues associated with constructing a transmission line are not known.
c. Cost Cap Alternatives
We recognize that the Commission may nonetheless cap TCR Rider recovery of the Bemidji Project costs linked to the initial cost estimates provided by the project applicants during the Certificate of Need proceeding. If so, we respectfully request that the Commission consider two adjustments to the 2007 initial cost estimates.
10 Environmental Report, Bemidji – Grand Rapids 230 kV Transmission Project, Docket No. E017, E015, ET-6/CN-07-1222, Page 5
Page 9 of 10MP Exhibit ___ (CEF) Direct Schedule 3
Docket No. E015/GR-16-664 Page 9 of 10
20
First, the Department suggested use of an escalator for the Bemidji cost estimates. We appreciate this recommendation. As discussed previously, we believe the appropriate escalator is the Handy Whitman index for transmission projects, rather than escalation factors based on GDP or CPI. Based on the Handy Whitman index, the cost estimate for the Bemidji Project in 2012 dollars is approximately $8.2 million higher, or $74 million, compared to the original cost estimate of $66.2 million contained in the Route Permit proceeding.
Second, this escalated 2012 estimate does not include additional critical costs – several of which the project applicants had no way of foreseeing – that were necessary and prudent to effectuate the project and actually place it in service in 2012. When the Commission first applied the cost cap principle to the Wilmarth/Blue Lake project in our 2010 TCR Rider proceeding, the Commission provided for the recovery of costs in excess of the project cap when such costs are unforeseeable and extraordinary. We believe the Bemidji Project costs eligible for TCR Rider recovery should include the unforeseeable or extraordinary events provided in the table above. Specifically the $9.6 million of additional winter construction costs incurred due to a record warm winter was an unforeseen and extraordinary situation, as were the $3.2 million of post permit legal fees. This adjustment is reasonable and would bring the cost of the project eligible for TCR Rider recovery to approximately $87.2 million.
Again, while we believe it is unreasonable to retroactively apply the cost cap principle to a transmission project approved before the Commission adopted the concept of applying cost caps to project costs recovered through the TCR Riders, if the Commission nonetheless orders a limit on TCR Rider recoveries for the Bemidji project, the cost cap for the Bemidji project should be no lower than $87.2 million.
3. Brookings Project
Our Petition identified $30 million in necessary system underbuild upgrades for the CapX2020 Brookings Project. The Department requested that we clarify whether this $30 million is included in or in addition to the $70-100 million cost range provided in the CapX2020 Certificate of Need proceeding for underbuild upgrades for the three CapX2020 345 kV projects. We confirm that the $30 million is a part of the $70-100 million estimate – it is the portion of that total required for the Brookings project underbuild upgrades. As such, we believe these costs for the Brookings project are recoverable in the TCR, even if the Commission were to impose a Certificate of Need cost estimate cap to the Brookings project.
Page 10 of 10MP Exhibit ___ (CEF) Direct Schedule 3
Docket No. E015/GR-16-664 Page 10 of 10

7
Row
No.
Estimated Historic Incremental O&M Storm
& Trouble Restoration Expenses 2010
Actual
2011
Actual
2012
Actual
2013
Actual
2014
Actual
2015 #
Actual
& (Est.)++
2016 #
YTD
& (Est.)++
2017
(Budget)++
1 Total ‐ Overtime OT Labor Expense** 1,458,990$ 1,456,992$ 1,533,656$ 1,426,756$ 1,649,668$ 1,791,769$ 1,907,657$ N/A
2 Total ‐ Stipends / OT Meal Expense** 19,227$ 21,960$ 54,212$ 29,980$ 20,593$ 87,910$ 78,424$ N/A
3 Total ‐ Prearranged OT Labor (Planned Overtime)** N/A N/A 93,642$ 126,710$ 213,799$ 209,490$ 98,761$ N/A
4 Unplanned ‐ Overtime OT Labor Expense N/A N/A 1,440,014$ 1,300,045$ 1,435,869$ 1,582,278$ 1,808,896$ N/A
5 Unplanned ‐ Employee Stipends / OT Meals Expense N/A N/A 50,902$ 27,317$ 17,924$ 77,631$ 74,364$ N/A
6 Unplanned ‐ Total Overtime Labor & OT Expenses N/A N/A 1,490,916$ 1,327,363$ 1,453,793$ 1,659,910$ 1,883,259$ N/A
7 O&M ‐ Overtime Labor & OT Expense* N/A+ N/A+ 1,192,733$ 1,061,890$ 1,163,035$ N/A# N/A# N/A#
8 O&M ‐ Overtime Labor & OT Expense ‐ Estimated++ 1,139,219$ 1,139,219$ 1,139,219$
9 O&M ‐ Actual Storm (Nisswa ‐ July 12, 2015)! 876,788$
10 O&M ‐ Actual Storm (Duluth / North Gull Lake ‐ July 21, 2016)! 2,929,088$
11 O&M ‐ Actual Storm (Nisswa / Pine River ‐ August 4, 2016)! 118,223$
12 O&M ‐ Total Storm & Trouble Restoration Expense N/A+ N/A+ 1,192,733$ 1,061,890$ 1,163,035$ 2,016,007$ 4,186,530$
13 O&M ‐ Overtime Budget for Line workers (RC‐190)** 1,004,550$ 512,000$ 518,000$ 800,000$ 825,000$ 696,300$ 696,300$ 876,300$
14 O&M ‐ Variance (Budget to Actual) N/A (674,733)$ (261,890)$ (338,035)$ (1,319,707)$ (3,490,230)$
++ Average O&M Based on 2012 ‐2014 Actuals 1,139,219$
* Estimated Historic O&M vs. Capital ‐ "Call out" 80%
Worksheet Formulas:
R4 = R1 ‐ R3
R5 = (R4 / R1) * R2
R6 = R4 + R5
** OAG IR # 003 ‐ MP Response (MPUC Docket No. E015/M‐16‐648)
# Denotes 2015 and 2016 when MP requested Mutual Aid for Storm Events
R7 = R6 * 80%
2010 ‐ 2017 Actuals & Budget (Dollars)
Storm Response Cost Information
+ Prearranged / Planned OT was not tracked separately in 2010 and 2011 in the previous MP accounting system all OT was included in the total RC 190
! O&M Actual Incremental Expenses for Storm Events Noted in 2015 & 2016
# Denotes 2015 and 2016 when MP request Mutual Aid for Storm Events
R12 = R7 + R8 + R9 + R10 + R11
R8 = Average(R7) ‐ 2012, 2013, 2014
Notes:
MP Exhibit ___ (CEF) Direct Schedule 4
Docket No. E015/GR-16-664 Page 1 of 1

MP Exhibit ___ (CEF) Direct Schedule 5
Docket No. E015/GR-16-664 Page 1 of 1
Category Description2010
Actual2011
Actual2012
Actual2013
Actual2014
Actual2015
Actual2016
Budget2017
BudgetThird-Party Transmission ExpensesJPZ Payments $15.49 $45.95 $46.97 $45.36 $44.05
MISO Network, Firm, and
Non Firm Service
(AC Sched 7, 8, & 9) $5.68 $4.54 $4.01 $4.17 $5.07 $5.85 $4.51 $5.78
HVDC Firm & Non Firm
Service (HVDC Sched 7 & 8) $8.75 $8.43 $8.93 $9.09 $9.87 $12.95 $15.48 $12.89
NERC Required (Sched 45) $5.05 $9.88 $10.21 $10.10
MISO Admin Charges (Sched
10 & 45) $2.24 $2.69 $2.89 $2.45 $2.52 $2.67 $2.59 $2.51
Other‐Ancillary
Services/LBA Services, etc.
(Sched 1&2) $1.76 $1.73 $1.86 $1.97 $1.89 $1.83 $1.97 $2.11
Total Third-Party Transmission Expenses
$18.43 $17.39 $17.69 $33.17 $70.35 $80.15 $80.12 $77.44
Third-Party Transmission RevenuesExpired NITSA Revenue $0.59 $0.53 $0.53 $0.35
JPZ Revenue $12.38 $39.22 $43.45 $41.90 $39.96
MISO Network, Firm, and
Non Firm Service (AC Sched
7, 8, &9) $10.62 $5.91 $4.69 $4.61 $7.23 $0.17 $6.00 $10.30
HVDC Firm and Non Firm
Service (HVDC Sched 7 & 8) $16.13 $15.87 $16.36 $18.38 $15.71 $14.15 $15.48 $12.88
NERC Required (Sched 45) $7.72 $13.86 $12.23 $11.68
GFAs $2.53 $1.80 $1.04 $1.07 $1.09 $1.06 $1.06 $1.06Other‐Ancillary
Services/LBA Services, etc.
(Sched 1&2) $1.97 $2.31 $4.37 $3.70 $3.16 $3.17 $2.76 $3.00
Total Third-Party Transmission Revenues
31.84 26.42 26.99 40.49 74.13 75.86 79.43 78.88
Net Revenue (Expense) $13.41 $9.03 $9.30 $7.32 $3.78 ($4.29) ($0.69) $1.44
Minnesota Power Third-Party Transmission Expenses and Revenues
2010 - 2017 (Dollars in Millions)

Minne
sota Pow
er Sum
mary of Qua
ntifiab
le Cost C
ontrols a
nd Savings
Docket No. E01
5/GR‐09
‐115
1 Co
mmission Order dated
11/2/20
10, page 71
, Order Point 15:
"Include
testim
ony abou
t effo
rts to control costs, including
list of cost red
uctio
ns m
ade, iden
tification of which cost red
uctio
ns are permanen
t, and qu
antification of to
tal cost savings."
Initiative
Descrip
tion
Date of A
ction
Taken
Savings E
stim
ate
Basis
for E
stim
ate
Tempo
rary,
One
‐Tim
e, or
Perm
anen
t?Witn
ess
Testim
ony
Electric M
eter
Ope
ratio
ns
Capital red
uctio
n of 80%
ann
ually and
O&M sa
vings p
er
year fo
r Dual Fue
l System upkeep after changing to AMI
and sim
plified
asset m
anagem
ent related
to th
e tw
o‐way sy
stem
2010
$150
,000
less ann
ual Capita
l Re
quire
men
tsand
$50,00
0 annu
ally less O&M
Expe
nse
Elim
ination of Dual Fue
l Capital and
Mainten
ance
Portion of bud
get
Perm
anen
tCh
ris Fleege
Electric M
eter
Ope
ratio
ns
Completed
Load Re
search m
etering project w
ith 30%
less capita
l than previous load
research project.
Purchase of A
MI M
eters for Load Re
search vs. One
‐Tim
e Use Load Re
search M
eters (Am
erican
Inno
vatio
n Mod
ules) ‐ AMI w
ere lower cost a
nd have a much longer
asset life
than
our previou
s project.
2012
$280
,000
List cost o
f the
AIM
Load
Research M
odules
installed in 200
3 vs. The
AM
I Load Re
search
Meters installed in
2012
/13
Perm
anen
tCh
ris Fleege
Engine
ering
The Distrib
ution Service Re
presen
tativ
es in
the area
doing the Gen
eral Led
ger W
ork Orders is a
savings o
n mileage of app
roximately 7%
per year
Mileage redu
ction in th
e form
of e
very other m
onth
staff m
eetin
gs and
heavily encou
raging
ride
sharing to
all 201
2 ou
t of tow
n meetin
gs
2014
Approxim
ately $1
0,00
0 annu
ally
Internal Calculatio
nPe
rmanen
tCh
ris Fleege
Fleet C
osts
Iden
tified 19
veh
icles for re
moval from
fleet.
2015
$1.03 M
Annu
al lease expe
nse of
the vehicles was
$127
,000
, total
replacem
ent cost
avoidance is $1
.03M
Perm
anen
tCh
ris Fleege
Fleet C
osts
Redu
ced on
e fle
et position
permanen
tly20
15$7
9,00
0 Labo
r savings
Perm
anen
tCh
ris Fleege
Fleet C
osts
Fleet p
osition
staffed on
e day a week
2015
$60,00
0 Labo
r savings
One
‐Tim
eCh
ris Fleege
Fleet C
osts
Obtaine
d warranty coverage on service invoices
2015
$12,00
0 OEM
ven
dors
One
‐Tim
eCh
ris Fleege
Fleet C
osts
Refurbish
ed instead of re
placing line tensione
r too
l20
15$5
6,00
0 Internal calculatio
nOne
‐Tim
eCh
ris Fleege
*Note that th
is list includes those ite
ms the
Com
pany cou
ld re
liably qu
antify per the
Com
mission's O
rder Point. Testim
ony ad
dresses a
ddition
al cost reductio
ns effo
rts.
MP Exhibit ___ (CEF) Direct Schedule 6
Docket No. E015/GR-16-664 Page 1 of 2

Minne
sota Pow
er Sum
mary of Qua
ntifiab
le Cost C
ontrols a
nd Savings
Docket No. E01
5/GR‐09
‐115
1 Co
mmission Order dated
11/2/20
10, page 71
, Order Point 15:
"Include
testim
ony abou
t effo
rts to control costs, including
list of cost red
uctio
ns m
ade, iden
tification of which cost red
uctio
ns are permanen
t, and qu
antification of to
tal cost savings."
Initiative
Descrip
tion
Date of A
ction
Taken
Savings E
stim
ate
Basis
for E
stim
ate
Tempo
rary,
One
‐Tim
e, or
Perm
anen
t?Witn
ess
Testim
ony
Fleet C
osts
Internal up fittin
g for S
pacekap po
d installatio
n vs
external up fittin
g; Ability to re
use Spacekap
at n
ext
replacem
ent
2015
$29,00
0$5
91,000
Internal calculatio
nOne
‐Tim
eCh
ris Fleege
Fleet C
osts
Body
transfer vs n
ew build
2016
$40,00
0 Internal calculatio
nOne
‐Tim
eCh
ris Fleege
Service Ce
nter
Consolidation
Consolidation of Nisswa, Aurora and Ch
isholm Service
Centers. Other con
solidations are being
stud
ied.
Jul‐1
5
$2.2 m
illion avoide
d capital
investmen
ts; O
&M sa
vings
approxim
ately
$36,00
0 to $90
,000
ann
ually
Avoid iden
tified capita
l investmen
ts at closed
facilities; re
duced
overtim
e associated
with
de
eper crew availability
at con
solidation
locatio
ns.
Perm
anen
tCh
ris Fleege
Upgrade
Customer
Inform
ation System
to
use corporate
standard sy
stem
s
Upgrade
d Cu
stom
er Inform
ation System
to use
corporate standard Oracle database and
corpo
rate
standard ExaLogic Server. Enabled
dropp
ing supp
ort for
Adabase database and
the IBM m
ainframe
2015
$604
,498
Budget cost savings
associated
with
no
longer ope
ratin
g the
Mainframe.
Perm
anen
tCh
ris Fleege
Western Union
Initiative
Negotiated a redu
ction in one
‐tim
e conven
ience fee for
MP custom
ers for electronic paym
ents. Re
duces the
am
ount paid by
the custom
erJuly 201
2$5
0,00
0‐$6
0,00
0 pe
r year (costs
quantified be
ginn
ing Janu
ary 1,
2013
)Internal Calculatio
nPe
rmanen
tCh
ris Fleege
*Note that th
is list includes those ite
ms the
Com
pany cou
ld re
liably qu
antify per the
Com
mission's O
rder Point. Testim
ony ad
dresses a
ddition
al cost reductio
ns effo
rts.
MP Exhibit ___ (CEF) Direct Schedule 6
Docket No. E015/GR-16-664 Page 2 of 2

MP Exhibit ___ (CEF) Direct Schedule 7
Docket No. E015/GR-16-664 Page 1 of 1