translational genome informatics laboratory, severance biomedical science institute, yonsei...
TRANSCRIPT

Translational Genome Informatics Laboratory,Severance Biomedical Science Institute,Yonsei University College of Medicine
Journal club presentation
August 26 2015
In Seok Yang | [email protected]

Journal
| 2

| 3
Application of RNA sequencing
1. Expressions of genes or isoforms 2. Alternative splicing
3. Non-coding RNAs 4. Gene fusions
Expression level - Single-end: RPKM - Paired-end: FPKM
| 4
Challenging issues
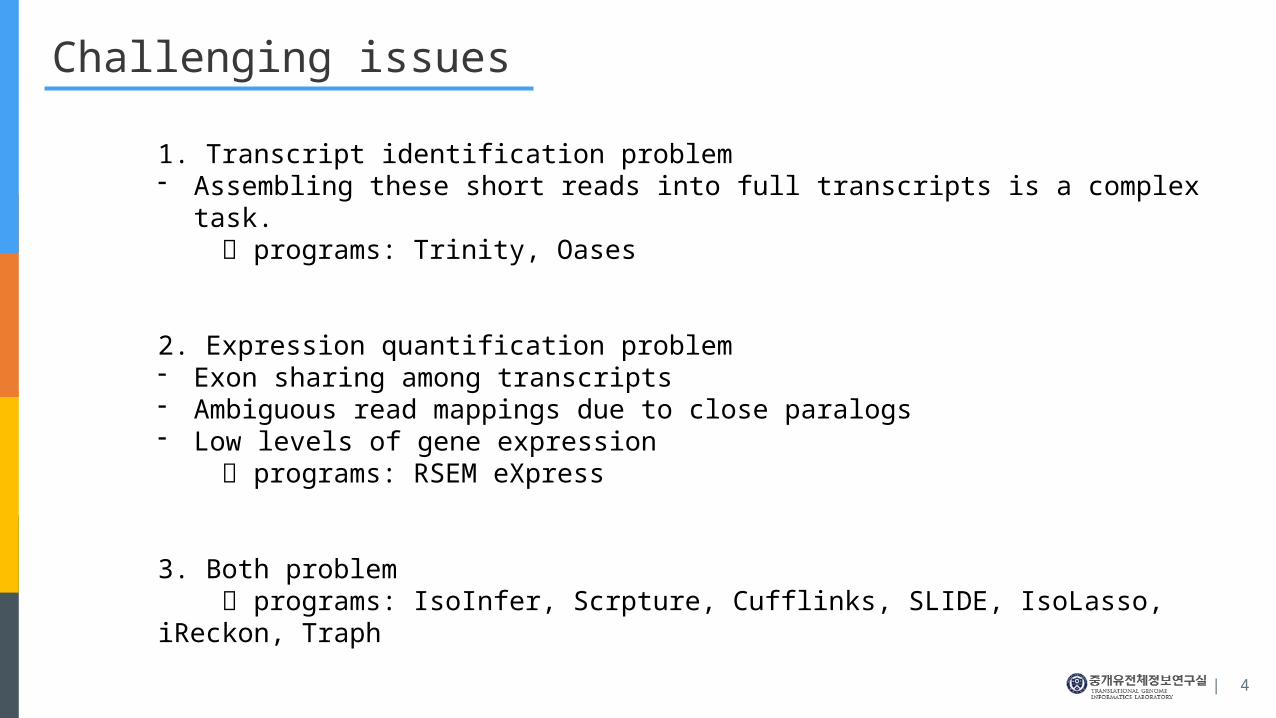
1. Transcript identification problem- Assembling these short reads into full transcripts is a complex task. programs: Trinity, Oases
2. Expression quantification problem- Exon sharing among transcripts- Ambiguous read mappings due to close paralogs- Low levels of gene expression programs: RSEM eXpress
3. Both problem programs: IsoInfer, Scrpture, Cufflinks, SLIDE, IsoLasso, iReckon, Traph

| 5
Recent study
Steijger, T. et al. Nat. Methods 10, 1177–1184 (2013).
The current transcript reconstruction methods showed that even in cases where these methods identified all constituent exons of a transcript, they often failed to assemble the exons into complete isoforms.

| 6
In this study
The authors developed a transcriptome assembly method named StringTie.
They showed that StringTie correctly identified 36–60% more transcripts than the next best assembler (Cuf-flinks) on multiple real and simulated data sets.
Using simulated data, they showed that the expression levels produced by StringTie also showed higher agreement with the true values.
| 7
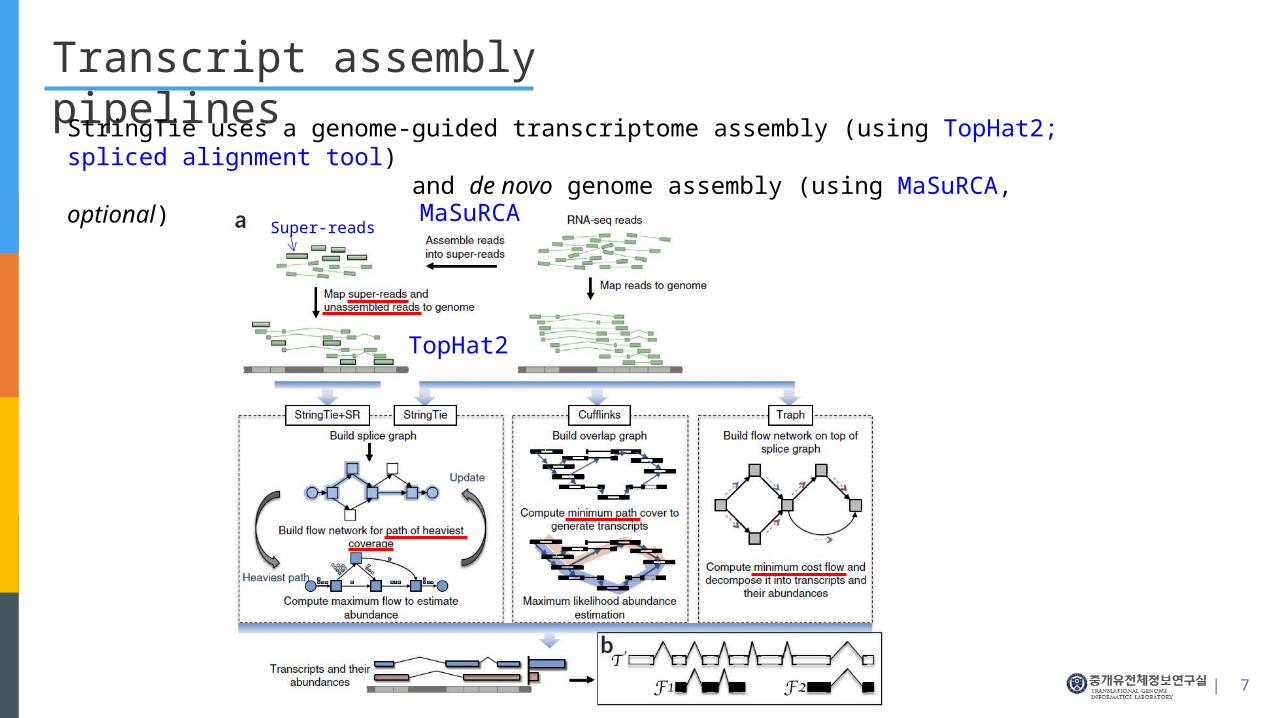
Transcript assembly pipelines
StringTie uses a genome-guided transcriptome assembly (using TopHat2; spliced alignment tool) and de novo genome assembly (using MaSuRCA, optional)
TopHat2
MaSuRCASuper-reads

| 8
Algorithm (assembly)
1. Create super-reads using de novo assembly algorithm (MaSuRCA program)
2. Extend every read in both directions as long as the extension is unique
3. Identify pairs of reads that belong to the same super-read (assembled read)
4. Extract the sequence containing the pair plus the sequence between them; that is, the entire sequence of the original DNA fragment
Assembled sequence (=super-read)
A single read (=super-read)
5. Map the super-reads to the reference genome
Unassembled read pairUnassembled read pair

| 9
Algorithm (overall)
Node 1Node 2
Node 3
Node 4Node 5
Edge 1
Edge 2
Edge 3
9
4
3 3
14
911 9
4
5 3 2
3 3
Cufflinks(parsimony principal): 4 transcripts
StringTie(maximum flow algorithm): 5 transcripts
Weight on edge
ASG
| 10
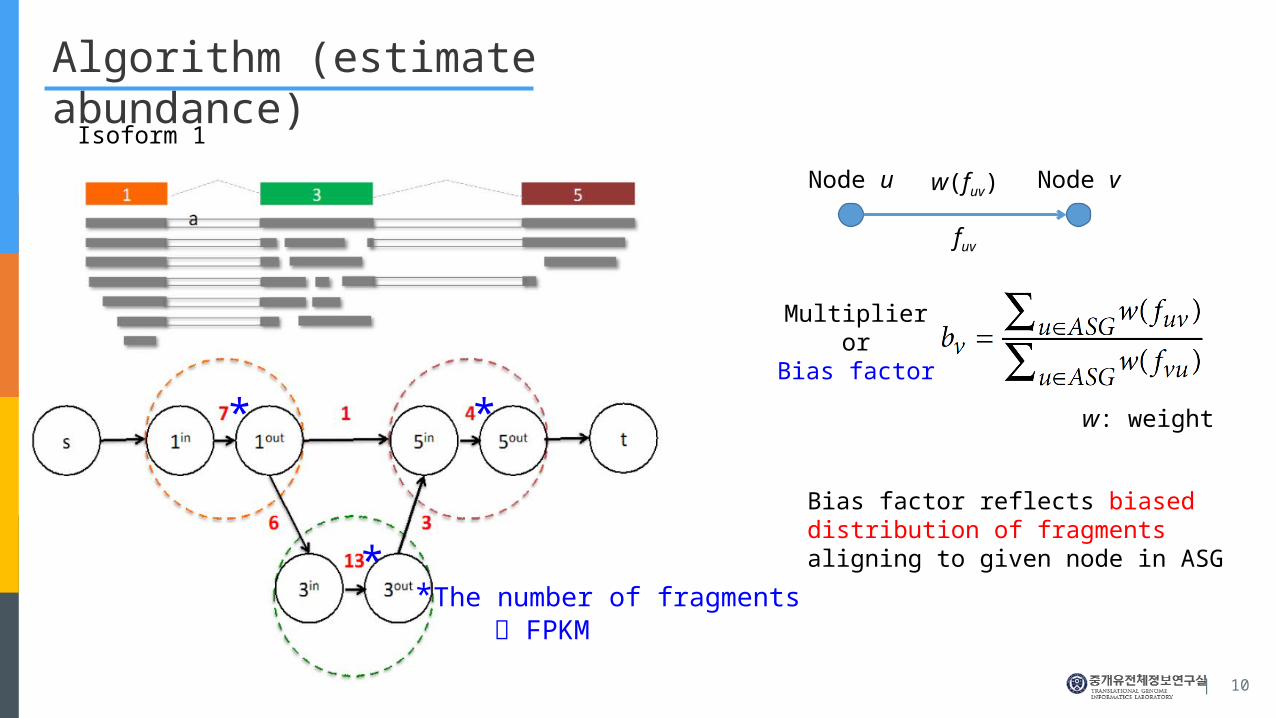
Algorithm (estimate abundance)
Isoform 1
* *
*
Multiplieror
Bias factor
Node u Node v
fuv
w: weight
w(fuv)
Bias factor reflects biased distribution of fragments aligning to given node in ASG
*The number of fragments FPKM

| 11
Program running
StringTie v1.0.4 usage:
stringtie <input.bam> [-G <guide_gff>] [-l <label>] [-o <out_gtf>] [-p <cpus>] [-v] [-a <min_anchor_len>][-m <min_tlen>] [-j <min_anchor_cov>] [-n sens] [-C <coverage_file_name>] [-s <maxcov>][-c <min_bundle_cov>] [-g <bdist>] [-e] [-x <seqid,..>] {-B | -b <dir_path>}
Assemble RNA-Seq alignments into potential transcripts.
Options:-G reference annotation to use for guiding the assembly process (GTF/GFF3)-l name prefix for output transcripts (default: STRG)-f minimum isoform fraction (default: 0.1)-m minimum assembled transcript length (default: 200)-o output path/file name for the assembled transcripts GTF (default: stdout)-a minimum anchor length for junctions (default: 10)-j minimum junction coverage (default: 1)-t disable trimming of predicted transcripts based on coverage (default: coverage
trimming is enabled)-c minimum reads per bp coverage to consider for transcript assembly (default: 2.5)-s coverage saturation threshold; further read alignments will be ignored in a region
where a local coverage depth of <maxcov> is reached (default: 1,000,000);
-v verbose (log bundle processing details)-g gap between read mappings triggering a new bundle (default: 50)-C output file with reference transcripts that are covered by reads-M fraction of bundle allowed to be covered by multi-hit reads (default:0.95)-p number of threads (CPUs) to use (default: 1)-B enable output of Ballgown table files which will be created in the same
directory as the output GTF (requires -G, -o recommended)-b enable output of Ballgown table files but these files will be created under
the directory path given as <dir path>-e only estimates the abundance of given reference transcripts (requires -G)-x do not assemble any transcripts on these reference sequence(s)
pre-built Linux x86_64 binary packagepre-built Apple OS X binary for OS X version 10.7 or above
| 12
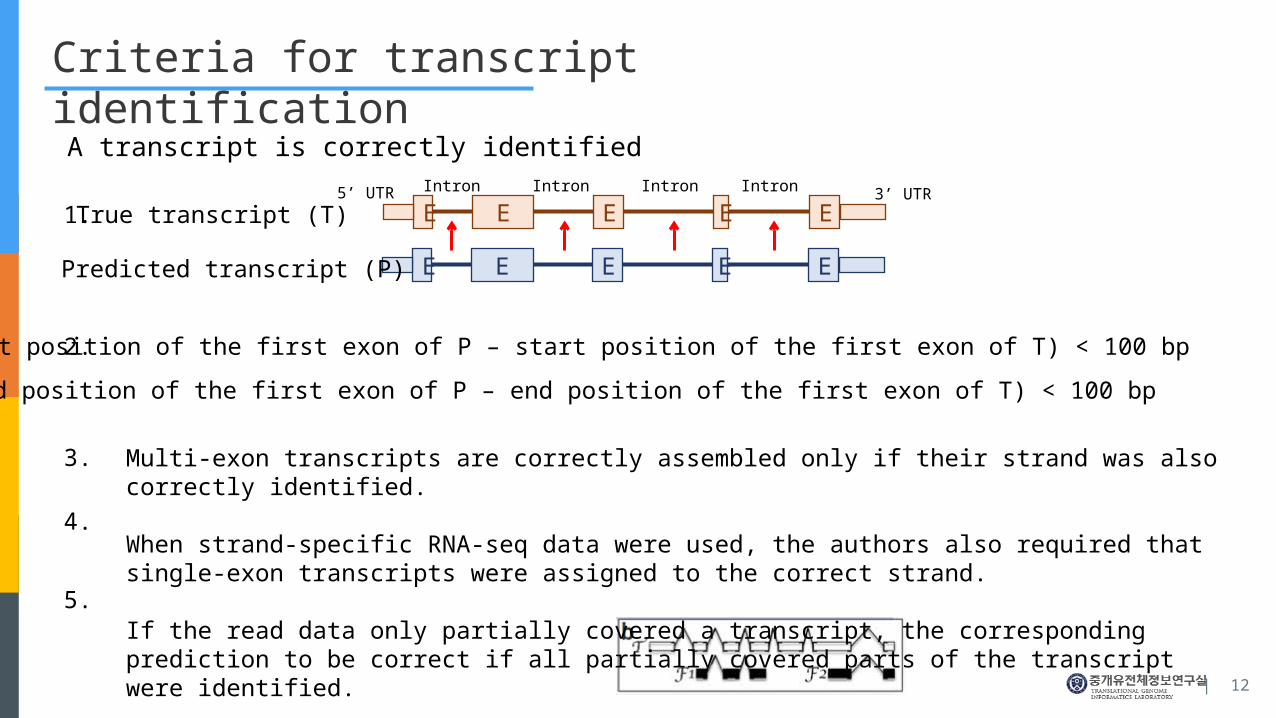
Criteria for transcript identification
A transcript is correctly identified
E E E E E
E E E E E
Predicted transcript (P)
True transcript (T)5’ UTR 3’ UTRIntron Intron Intron Intron
Abs(start position of the first exon of P – start position of the first exon of T) < 100 bp
Abs(end position of the first exon of P – end position of the first exon of T) < 100 bp
1.
2.
3.
4.
5.
Multi-exon transcripts are correctly assembled only if their strand was also correctly identified.
When strand-specific RNA-seq data were used, the authors also required that single-exon transcripts were as-signed to the correct strand.
If the read data only partially covered a transcript, the corresponding prediction to be correct if all partially cov-ered parts of the transcript were identified.
| 13
Simulated data sets
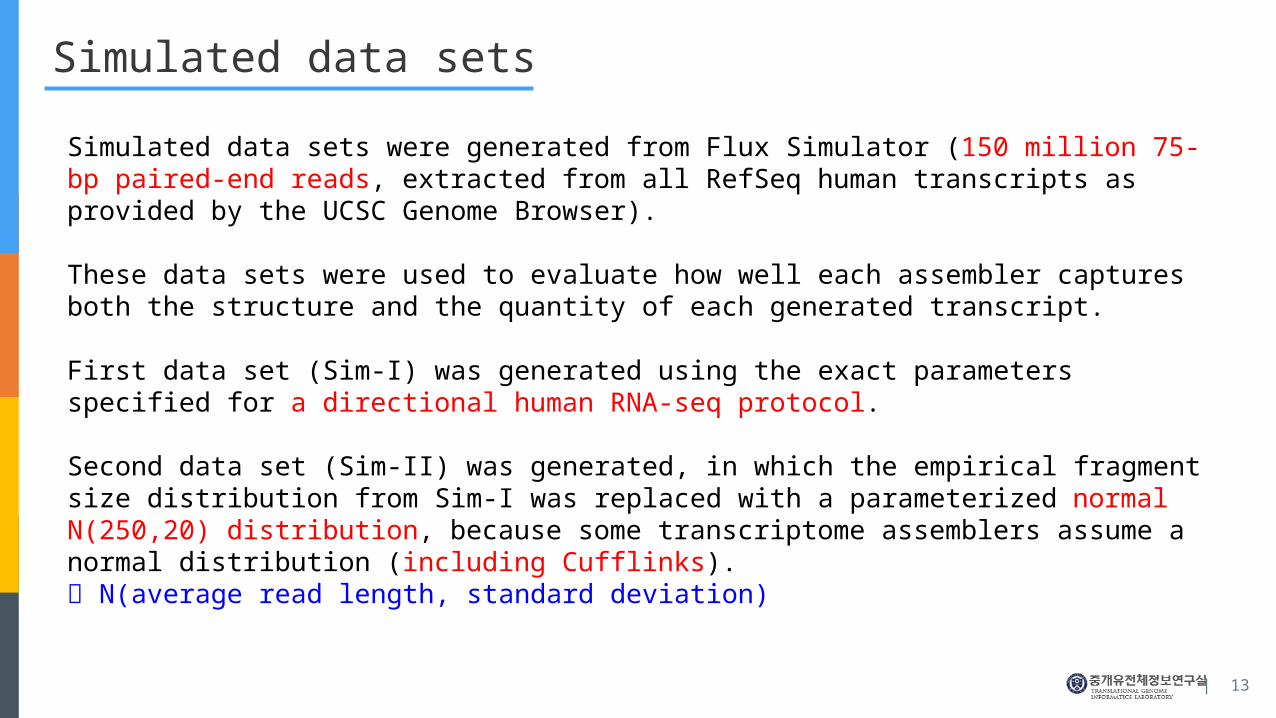
Simulated data sets were generated from Flux Simulator (150 million 75-bp paired-end reads, extracted from all RefSeq human transcripts as provided by the UCSC Genome Browser).
These data sets were used to evaluate how well each assembler captures both the structure and the quantity of each generated transcript.
First data set (Sim-I) was generated using the exact parameters specified for a directional human RNA-seq protocol.
Second data set (Sim-II) was generated, in which the empirical fragment size distribution from Sim-I was replaced with a parameterized normal N(250,20) distribution, because some transcriptome assemblers as-sume a normal distribution (including Cufflinks). N(average read length, standard deviation)

| 14
Transcriptome assemblers’ accuracies in detecting transcripts
StringTie
Cufflinks
All transcripts (full and partial) Fully covered transcripts only

| 15
Filtering out of low-abundance transcripts
It is designed to eliminate isoforms expressed at very low levels(i.e., incompletely spliced precursors or other artifacts).
StringTie and Cufflinks = 10% of the most abundant isoform
Figures in previous slide show StringTie’s accuracy when this filtering threshold was set to 10%, the same level as used by Cufflinks.
Interestingly, lowering the threshold to 5% for StringTie still yielded better sensitivity and precision than Cufflinks yielded at the 10% threshold.
| 16
Real data sets
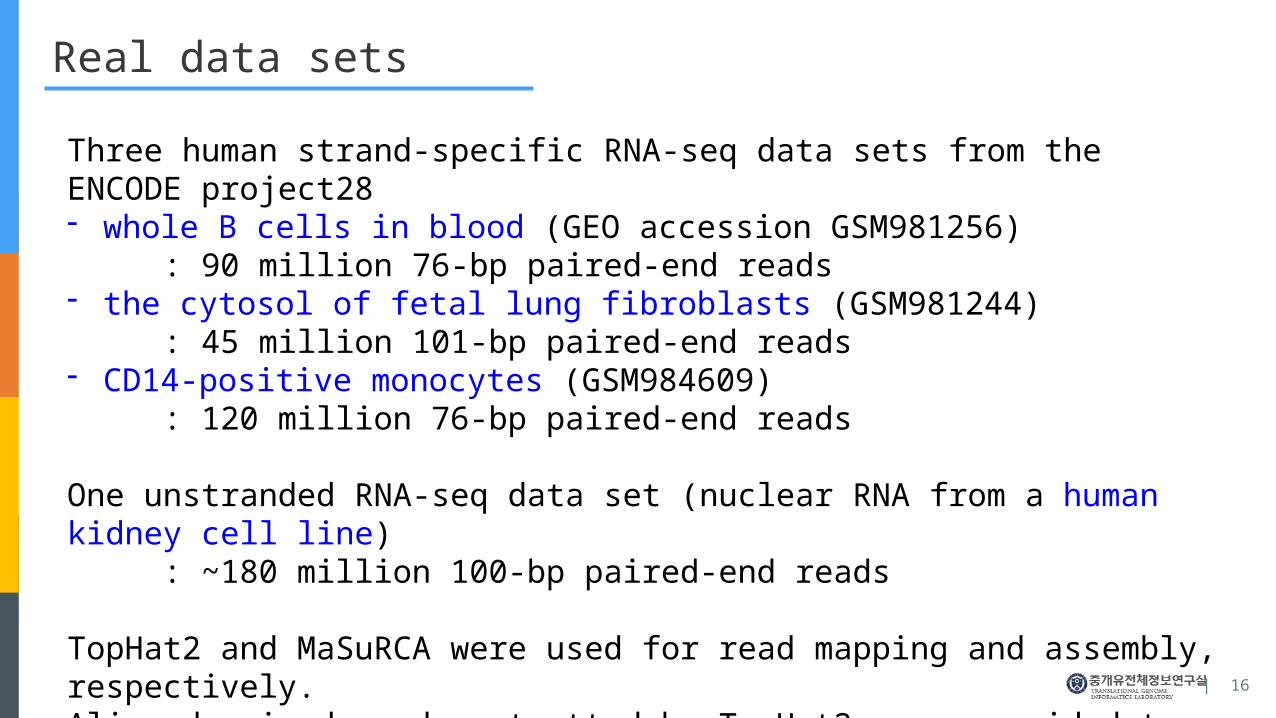
Three human strand-specific RNA-seq data sets from the ENCODE project28- whole B cells in blood (GEO accession GSM981256) : 90 million 76-bp paired-end reads - the cytosol of fetal lung fibroblasts (GSM981244) : 45 million 101-bp paired-end reads - CD14-positive monocytes (GSM984609) : 120 million 76-bp paired-end reads
One unstranded RNA-seq data set (nuclear RNA from a human kidney cell line) : ~180 million 100-bp paired-end reads
TopHat2 and MaSuRCA were used for read mapping and assembly, respectively.Aligned paired reads outputted by TopHat2 were provided to StringTie, Cufflinks, Scrip-ture, IsoLasso and Traph.
| 17
Quantification (expression level) of transcript
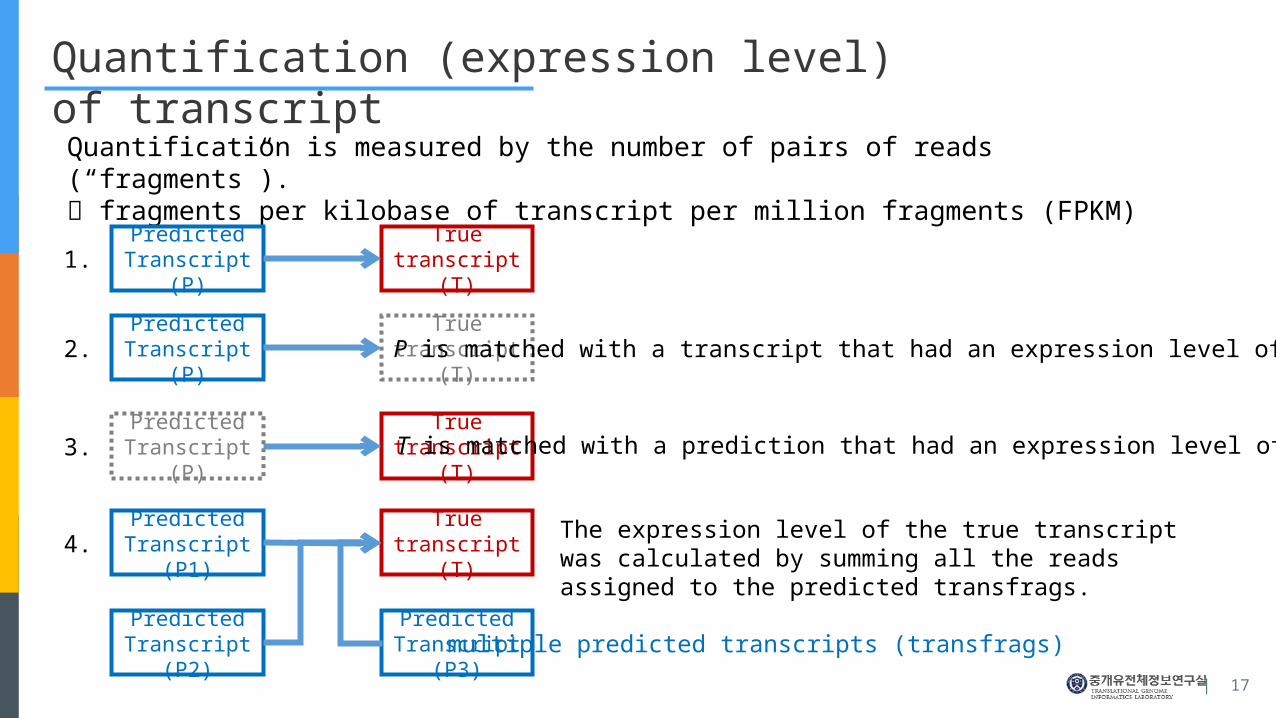
Quantification is measured by the number of pairs of reads (“fragments”). fragments per kilobase of transcript per million fragments (FPKM)
Predicted Tran-script (P)
True transcript (T)
Predicted Tran-script (P)
True transcript (T)
Predicted Tran-script (P)
True transcript (T)
P is matched with a transcript that had an expression level of zero.
T is matched with a prediction that had an expression level of zero.
Predicted Tran-script (P1)
True transcript (T)
Predicted Tran-script (P2)
Predicted Tran-script (P3)
multiple predicted transcripts (transfrags)
The expression level of the true transcript was calculated by summing all the reads assigned to the predicted transfrags.
1.
2.
3.
4.

| 18
Transcriptome assemblers’ performancesR
eal d
ata
Results on simulated data show the Spearman correlation coefficient between the real and predicted number of reads.For the four real data sets, shown are the number of genes and transcripts exactly matching known annotation.
Real data provide a better test of each program’s performance because they have properties that are not accurately captured by simulations. Repetitive regions in the human genome, wide variance in GC content, isoform length and alternative splicing complexity are all factors that influence performance
all include all true and
predicted transcripts.
predicted include all pre-
dicted transcripts but ex-clude true transcripts that were not predicted.
| 19
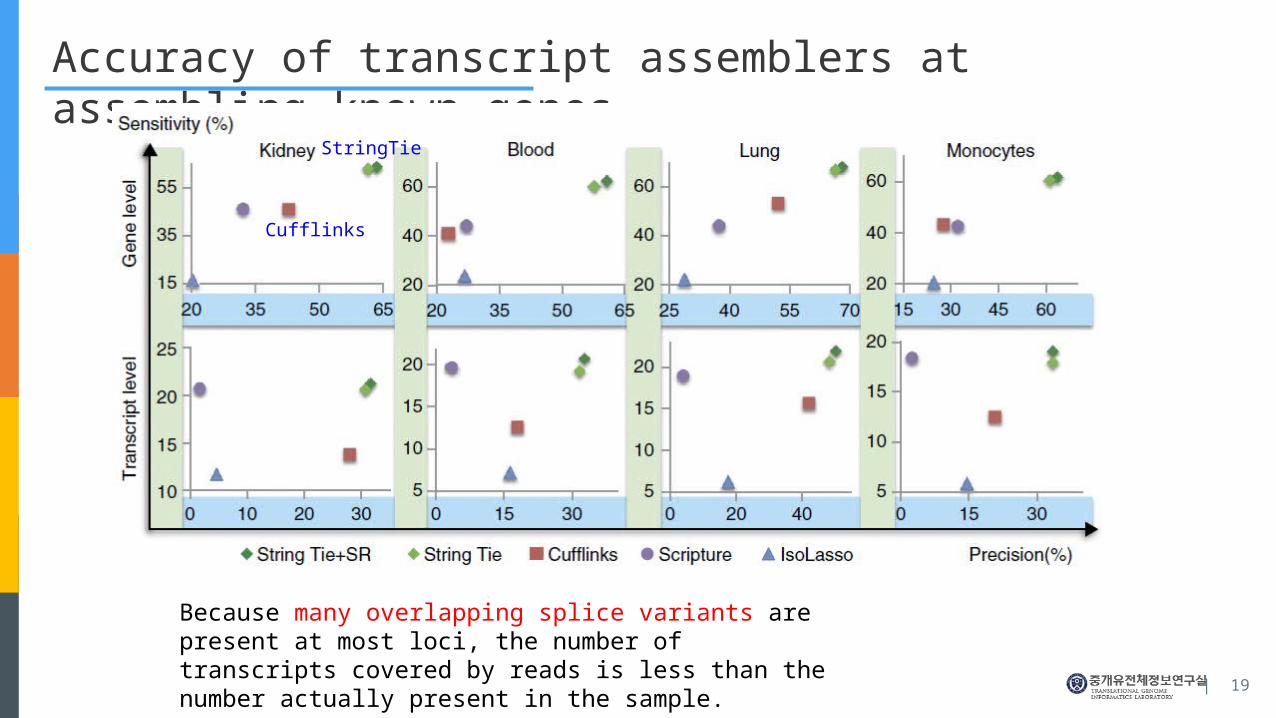
Accuracy of transcript assemblers at assembling known genes
StringTie
Cufflinks
Because many overlapping splice variants are present at most loci, the number of transcripts covered by reads is less than the number actually present in the sample.
| 20
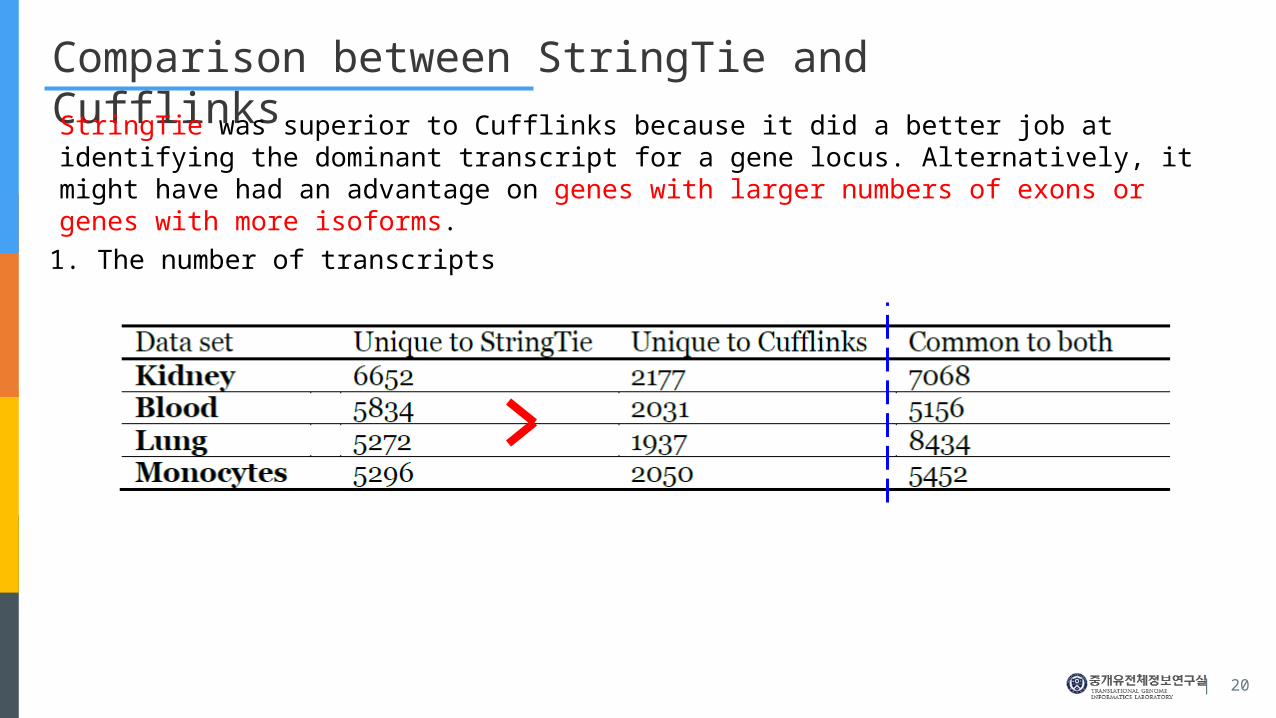
Comparison between StringTie and Cufflinks
StringTie was superior to Cufflinks because it did a better job at identifying the dominant transcript for a gene locus. Alternatively, it might have had an advantage on genes with larger numbers of exons or genes with more isoforms.
1. The number of transcripts

| 21
Comparison between StringTie and Cufflinks
StringTie was superior to Cufflinks because it did a better job at identifying the dominant transcript for a gene locus. Alternatively, it might have had an advantage on genes with larger numbers of exons or genes with more isoforms.
Kedney Blood Lung Mnocytes
the
num
ber
of e
xons
in tr
ansc
ript
s
the
num
ber
of e
xons
in tr
ansc
ript
s
the
num
ber
of e
xons
in tr
ansc
ript
s
the
num
ber
of e
xons
in tr
ansc
ript
s
StringTie Cufflinks StringTie Cufflinks StringTie Cufflinks StringTie Cufflinks
2. The distribution of the number of exons in transcripts identified by StringTie and not Cuff-links (left side of each plot), or by Cufflinks and not StringTie (right side of each plot).

| 22
Comparison between StringTie and Cufflinks
StringTie was superior to Cufflinks because it did a better job at identifying the dominant transcript for a gene locus. Alternatively, it might have had an advantage on genes with larger numbers of exons or genes with more isoforms.
StringTie StringTie StringTie StringTie
Cufflinks Cufflinks Cufflinks Cufflinks
FPKM FPKM FPKM FPKM
Kedney Blood Lung Mnocytes
Den
sity
3. The FPKM values of transcripts identified only by StringTie or only by Cuff-links

| 23
Comparison between StringTie and Cufflinks
StringTie was superior to Cufflinks because it did a better job at identifying the dominant transcript for a gene locus. Alternatively, it might have had an advantage on genes with larger numbers of exons or genes with more isoforms.
3. Distribution of genes containing transcripts correctly identified only by StringTie or only by Cufflinks
StringTie StringTie StringTie StringTie
Cufflinks Cufflinks Cufflinks Cufflinks
Kedney Blood Lung Mnocytes
Per
cent
age
of g
enes
con
tain
ing
uniq
uely
iden
tifi
ed tr
ansc
ript
s
No. of trascript No. of trascript No. of trascript
*** *** *** ***
1 2 3 4 5+ 1 2 3 4 5+ 1 2 3 4 5+ 1 2 3 4 5+
No. of trascript

| 24
Conclusion
1. Compared with other leading methods on both simulated and real data, StringTie was substantially more accurate at both assembly and quantitation of gene transcripts, recovering more expressed transcripts.
2. The main reason for StringTie’s accuracy is the network flow algorithm.3. StringTie can also use aligned de novo assembled fragments that combine pairs of reads into a longer se-
quence.4. StringTie assembles transcripts and estimates their expression levels simultaneously.
By comparison of two programs (StringTie and Cufflinks), StringTie was better at reconstructing at least three types of genes: (i) those at low abundance; (ii) those with more exons and (iii) those with multiple isoforms.
The authors envisage that users could replace Cufflinks with StringTie in most RNA-seq analysis pipelines and expect substantial improvements in transcript assembly coupled with faster performance.

Thank You