translating the world health organization 25x25 goals into ... · translating the world health...
TRANSCRIPT

1
Translating the World Health Organization 25x25
goals into a United Kingdom context: The PROMISE
study
Final Report
January 2016
British Heart Foundation Centre on Population Approaches for Non-Communicable Disease Prevention
Nuffield Department of Population Health
Old Road Campus, Roosevelt Drive, Headington, Oxford OX3 7LF, UK

2
Project team contributors
Dr Peter Scarborough, Associate Professor Charlie Foster, Dr Linda Cobiac, Gill Cowburn, Dr Anne
Matthews, Dr Karen Milton, Prof Mike Rayner, Emma Thomas, Elizabeth Wilkins
Expert participants
Emma Adams, Professor Annie Anderson, Katherine Brown, Kim Buxton, Dr Jonathan Campion,
Professor Simon Capewell, Dr Nick Cavill, Alison Cox, Dr Mary Docherty, Mary Edwards, Jo Foster,
Professor Sir Ian Gilmore, Christine Hancock, Dr John Holmes, Professor Mike Kelly, Professor
Jonathan Mant, Professor Teresa Marteau, Professor Alan Maryon-Davies, Elaine McNish, Professor
David Melzer, Dr James Nicholls, Dr Matt Norton, Dr David Ogilvie, Dr Jenna Panter, Professor Mike
Rayner, Spencer Robinson, Dr Harry Rutter, Bryony Sinclair, Dr David Werring, Professor Martin
White, Professor Martin Wiseman, Dr Thomas Yates
Richmond Group
Charlotte Augst, Jennifer Boon, Flynne Rushton, Amy Smullen
Suggested citation
Scarborough P, Cowburn G, Cobiac L, Foster C, Matthews A, Milton K, Thomas E, Wilkins E, Rayner
M. Translating the World Health Organization 25x25 goals into a United Kingdom context: The
PROMISE study. Richmond Group: London, 2016.

3
Table of Contents
EXECUTIVE SUMMARY ............................................................................................................................ 5
Modelling study .................................................................................................................................. 5
Policy review ....................................................................................................................................... 6
Table: Total NCD deaths and YLDs that are averted or delayed between 2015 and 2025, for each
intervention. ................................................................................................................................... 8
INTRODUCTION ....................................................................................................................................... 9
Table 1: The WHO 25 by 25 targets .............................................................................................. 11
METHODS .............................................................................................................................................. 12
Modelling study ................................................................................................................................ 12
Policy review ..................................................................................................................................... 13
Box 1: Inclusion criteria for interventions ..................................................................................... 13
Box 2: Shortlist of prioritised intervention options for poor diet, physical inactivity, smoking and
alcohol consumption ..................................................................................................................... 14
RESULTS ................................................................................................................................................ 15
Modelling study ................................................................................................................................ 15
Figure 1: Projected trends in the probability of dying prematurely from non-communicable
disease for the business as usual and 25 by 25 target scenarios. ................................................ 16
Table 2: Relative reduction in probability of premature mortality from non-communicable
diseases by 2025. .......................................................................................................................... 17
Figure 2: NCD deaths and YLDs that are averted or delayed between 2015 and 2025, for the
combined risk factor target scenario. ........................................................................................... 18
Figure 3: DALYs averted by the 25 by 25 targets between 2010 and 2025. ................................. 21
Policy review ..................................................................................................................................... 22
POOR DIET ..................................................................................................................................... 22
Sugar sweetened beverage tax ......................................................................................................... 22
Reformulation of packaged food, including portion size control ..................................................... 24
Figure 4: NCD deaths and YLDs that are averted or delayed between 2015 and 2025 with food
reformulation. ............................................................................................................................... 27
Table 4: NCD deaths and YLDs that are averted or delayed between 2015 and 2025 with food
reformulation. ............................................................................................................................... 28
Further restriction of unhealthy food marketing ............................................................................. 29
PHYSICAL INACTIVITY .................................................................................................................... 29
Redesign urban environments to prioritise walking and cycling ...................................................... 29
Support for community groups that encourage physical activity .................................................... 31
Behaviour change advice service, delivered through primary care.................................................. 31

4
Figure 5: NCD deaths and YLDs that are averted or delayed between 2015 and 2025 with
physical activity behaviour change. .............................................................................................. 34
Table 5: NCD deaths and YLDs that are averted or delayed between 2015 and 2025 with
physical activity behaviour change. .............................................................................................. 35
SMOKING ...................................................................................................................................... 36
Maintain increases of tax on tobacco at above inflation rates ........................................................ 36
Figure 6: NCD deaths and YLDs that are averted or delayed between 2015 and 2025 with an
increase in tobacco tax. ................................................................................................................ 38
Table 6: NCD deaths and YLDs that are averted or delayed between 2015 and 2025 with an
increase in tobacco tax. ................................................................................................................ 39
Tackling illicit trade in cigarettes ...................................................................................................... 40
Increased support for smoking cessation services, particularly in hard to reach groups ................ 41
ALCOHOL CONSUMPTION ............................................................................................................. 42
Regulation to raise the price of high strength cheap alcohol ........................................................... 42
Strengthen local authority control over licensing powers ................................................................ 44
Further restriction of alcohol marketing .......................................................................................... 45
Figure 7: NCD deaths and YLDs that are averted or delayed between 2015 and 2025 with
alcohol marketing restrictions. ..................................................................................................... 47
Table 7: NCD deaths and YLDs that are averted or delayed between 2015 and 2025 with alcohol
marketing restrictions. .................................................................................................................. 48
CONCLUSIONS ....................................................................................................................................... 49
ABBREVIATIONS .................................................................................................................................... 51
DEFINITIONS .......................................................................................................................................... 51

5
EXECUTIVE SUMMARY
The World Health Organization (WHO) Global Non-Communicable Disease (NCD) Action Plan 2013-
20201 sets targets for improvements in the prevalence of NCD risk factors, specifically obesity,
diabetes, raised blood pressure, tobacco use, salt intake, physical inactivity and harmful use of
alcohol. The Richmond Group of Charities commissioned the BHF Centre on Population Approaches
for Non-Communicable Disease Prevention to run a research project which translates the WHO
targets into a UK health context. We did this in a two stage process – a modelling project using
innovative methods to estimate the NCD burden in England between 2010 and 2025 if the WHO 25
by 25 targets are met; and a policy review of the potential prevention-based population-level
interventions that are available for reducing poor diet, physical inactivity, smoking and alcohol
consumption. In addition, we modelled the potential health impact of four interventions: food
reformulation; physical activity behaviour change advice delivered through primary care; increased
tax on tobacco at above inflation rates; further restrictions of alcohol marketing.
Modelling study
We projected trends in the seven risk factors to 2025 and developed a population and mortality
model to forecast mortality and disability from NCDs in the UK to 2025. These projections provided a
business as usual (BAU) scenario for comparison with scenarios where the UK achieves the WHO 25
by 25 targets., Using relative risks describing dose-response relationships from meta-analyses of
prospective observational studies, we related the seven risk factors with the following NCDs:
coronary heart disease; stroke; type 2 diabetes; hypertensive disease; chronic obstructive
pulmonary disease; liver cirrhosis; kidney disease; and cancers of the following sites: mouth,
oesophagus, larynx, colon/rectum, liver, pancreas, lung, kidney, breast, cervix, stomach and bladder.
We also included the relationship between the risk factors and depression and dementia in the
modelling exercise, but note that the strength of the evidence relating the risk factors and these
NCD outcomes is not as strong as for the other NCDs.
Under the BAU scenario, the probability of dying between the age of 30 and 70 fell by 22% in men
and 25% in women by 2025 (note that this definition of premature mortality is the same measure
which the WHO use to benchmark progress towards the 25 by 25 targets reported in the NCD Action
Plan and does not include mortality from depression or dementia). Achieving all of the seven risk
factor targets resulted in both men and women achieving the 25% reduction in premature mortality
by 2025 in comparison to 2010. The biggest reduction in premature mortality was achieved by the
obesity target (to halt the rise in overweight and obesity).
Including deaths at all ages, achieving all of the WHO 25 by 25 targets would result in 161,000
(135,000 to 206,000) deaths delayed or averted in men and 89,000 (70,000 to 107,000) in women by
2025, most of which are due to reduced rates of coronary heart disease and stroke. We also
modelled the impact of achieving the targets on disability from NCDs, measured in terms of ‘years of
life lost to disability (YLDs)’. Achieving all of the targets would reduce YLDs by 630,000 (570,000 to
690,000) in men and 490,000 (460,000 to 520,000) by 2025, with substantial contributions to this
reduction due to falls in prevalence of diabetes, coronary heart disease, stroke and chronic
1 World Health Organization. WHO Global NCD Action Plan 2013-2020. WHO: Geneva, 2013.

6
obstructive pulmonary disease. Including depression and dementia in these analyses increases the
reduction in disability considerably.
Most of the reductions in mortality and disability are due to meeting the 25 by 25 targets for obesity
and diabetes. However, this is primarily due to the ambitious nature of these targets, which will
require the cessation of increases in the prevalence of both obesity and diabetes. In contrast the
remaining 25 by 25 targets call for a proportional reduction in the prevalence of risk factors that are
already falling in the UK.
Policy review
We conducted a purposive scoping review of the literature to identify policy intervention options to
address each of the four main risk factors for NCDs, namely poor diet, physical inactivity, smoking,
and alcohol consumption. We focused our search on review-level evidence from the peer-reviewed
journals and supplemented this search by exploring web-based sources of grey literature aimed
specifically at a policy making audience, some of which includes non-review level evidence.
To be included, each identified intervention had to meet the following criteria:
• Must be aimed at addressing diet and/or physical inactivity and/or smoking and/or alcohol
consumption.
• Must be supported by review-level data published in English from January 2005 onwards
(end date December 2014), except for grey literature.
• Must be non-clinical.
• Must be ‘population-based’.
We included 16 sources of evidence about alcohol-related interventions, 27 about interventions
around diet, 26 about physical activity related interventions and 36 about smoking interventions.
Having extracted standard data from each source, we categorised them into intervention types.
Nineteen experts nominated by the Richmond Group helped to refine the identified intervention
options until we had a long list of potential policy intervention options for each of the four risk
factors. A workshop was held where experts were asked to assess the identified interventions
against a range of criteria in order to produce a short list of possible policy options to be taken
forward. Following the workshop, and after further discussion within the Richmond Group, the
following 12 policy intervention options were shortlisted for data extraction for the policy review:
Poor diet
• Sugar sweetened beverage tax
• Reformulation of packaged food, including portion size control
• Further restriction of unhealthy food marketing
• Physical inactivity
• Redesign urban environments to prioritise walking and cycling
• Support for community groups that encourage physical activity

7
• Behaviour change advice service, delivered through primary care
Smoking
• Maintain increases of tax on tobacco at above inflation rates
• Tackling illicit trade in cigarettes
• Increased support for smoking cessation services, particularly in hard to reach groups
Alcohol
Regulation to raise the price of high strength cheap alcohol
Strengthen local authority control over licensing powers
Further restriction of alcohol marketing
A narrative summary of evidence relating to each chosen intervention option is provided. This
evidence strengthens the case for the prioritisation of prevention action but our review, across the
four risk factors, uncovers three key challenges that will restrict further progress (i) developing and
maintaining evidence and advocacy for the four risk factors; (ii) identifying workable solutions; and
(iii) encouraging policy makers to support and implement solutions.
There is a need for smarter research not only to generate and develop the evidence base for each
risk factor, and to continue to evaluate policy interventions, but also to build a new evidence base
around implementation. We found a dearth of evidence on the implementation of policies and
practices that would improve diets, levels of physical inactivity, smoking and alcohol intakes.
Our modelling exercises showed that the four selected interventions could have a substantial impact
on mortality and disability from NCDs, ranging from a reduction in 1,500 (1,300 to 1,700) deaths in
men and 950 (860 to 1,100) in women up to 2025 with increased tobacco taxation to 44,000 (2,900
to 85,000) deaths in men and 34,000 (-43,000 to 110,000) deaths in women up to 2025 for a total
ban on alcohol advertising (see table). Differences in the size of the effect are related to the extent
of the ambition of the interventions compared to current practice and difference in the uncertainty
range reflects large differences in the evidence base associated with implementation of these
interventions. Modelling of the interventions demonstrates that even modest population-level
approaches to prevent NCDs can have a substantial impact on future disease burden in the UK.

8
Table: Total NCD deaths and YLDs that are averted or delayed between 2015 and 2025, for each
intervention.
Deaths YLDs
Men Women Men Women
Food reformulation 14,000 (2,500 to 25,000) 12,000 (1,700 to 22,000) 51,000 (40,000 to 63,000)
63,000 (53,000 to 73,000)
Tobacco tax increase 1,500 (1,300 to 1,700) 950 (860 to 1,100) 11,000 (11,000 to 12,000)
14,000 (14,000 to 14,000)
Alcohol marketing restrictions
44,000 (2,900 to 85,000) 34,000 (-43,000 to 110,000)
64,000 (23,000 to 110,000)
22,000 (-55,000 to 99,000)
Physical activity behaviour change
5,800 (2,800 to 8,800) 5,800 (2,300 to 9,400) 43,000 (40,000 to 46,000)
55,000 (52,000 to 59,000)
NB. Values are mean and 95% uncertainty intervals.

9
INTRODUCTION
Non-communicable diseases (NCDs) present a huge health burden to all countries worldwide,
whether industrialised or developing, and the UK is no exception. In the most recent year for which
comparable estimates are available (2013), NCDs were responsible for over 38 million deaths
worldwide, more than two thirds of all global deaths2. Although rates of NCDs are generally falling in
most countries, the absolute number of NCD deaths is increasing due to an ageing global
population3. NCDs also cause a huge (and growing) amount of disability, contributing to the loss of
more than 600 million years of healthy life in 20134.
In the UK, NCDs contribute to the vast majority of deaths and disability, despite falling death rates
for many conditions. Cardiovascular diseases (CVD) and cancers are the two leading causes of
deaths, responsible for 27% and 29% of all deaths in the UK in 20145, despite both seeing substantial
falls in death rates over recent decades (e.g. age-standardised mortality rates for cardiovascular
diseases have fell by 74% between 1969 and 2013)6. Disability for both cardiovascular disease and
cancer are currently increasing, due to a combination of an ageing population and improvements in
survival rates meaning people are living longer with chronic conditions7. Age-standardised disability
rates from diabetes have risen by nearly 20% since 1990, alongside increases in the prevalence of
overweight and obesity8. Over the same time period death and disability rates of liver cirrhosis have
risen by over 50%, whilst there have been falls in death rates and disability from chronic obstructive
pulmonary disease (COPD) mirrored by reductions in the prevalence of smoking9. Meanwhile,
despite small falls in the disability associated with both conditions, depression and dementia now
make bigger contributions to the total burden of NCDs in England, with depression being the fourth
biggest contributor to ill health in England, behind back pain, coronary heart disease and skin
diseases10.
There is a large and growing body of evidence that describes the relationship between these NCDs
and modifiable behavioural risk factors, the most important of which are poor diet, physical
inactivity, smoking and alcohol consumption and their related medical conditions of overweight /
obesity, raised blood pressure, raised cholesterol and diabetes. The Global Burden of Disease study
estimates that in 2013 behavioural risk factors were responsible for 30% of mortality and disability
2 GBD 2013 Mortality and Causes of Death Collaborators. Global, regional, and national age–sex specific all-
cause and cause-specific mortality for 240 causes of death, 1990–2013: a systematic analysis for the Global Burden of Disease Study 2013. Lancet, 2015;385:117-171. 3 ibid
4 GBD 2013 Collaborators. Global, regional, and national incidence, prevalence, and years lived with disability
for 301 acute and chronic diseases and injuries in 188 countries, 1990–2013: a systematic analysis for the Global Burden of Disease Study 2013. Lancet, 2015;386:743-800. 5 Townsend N, Bhatnagar P, Wilkins E, Wickramasinghe K, Rayner M. Cardiovascular disease statistics 2015.
British Heart Foundation: London, 2015. https://www.bhf.org.uk/publications/statistics/cvd-stats-2015 6 ibid
7 Newton J, Briggs A, Murray C, Dicker D, Foreman K, Wang H, et al. Changes in health in England, with analysis
by English regions and areas of deprivation, 1990-2013: a systematic analysis for the Global Burden of Disease 2013. Lancet, 2015;doi:10.1016/S0140-6736(15)00195-6. 8 Institute of Health Metrics and Evaluations. Global Burden of Disease Evaluations – Data visualisations.
http://www.healthdata.org/data-visualization/gbd-compare Accessed January 2016. 9 ibid
10 ibid

10
worldwide, with the associated metabolic risk factors responsible for 16%11. In England, poor diet
and smoking are each responsible for greater than 10% of all death and disability, with alcohol
consumption and physical inactivity also making important contributions12. Whilst recent years have
seen positive trends in some risk factors in the UK with the prevalence of smoking falling and
physical activity levels rising, there have also been some adverse trends – notable increases in
obesity and diabetes13.
The large burden of NCDs that is due to modifiable behaviours suggests that prevention can be an
important tool for reducing disease burden. The World Health Organization (WHO) has developed a
strategy to reduce premature mortality from NCDs by 25% by the year 2025, by setting targets for
improvements in obesity, diabetes, raised blood pressure, tobacco use, salt intake, physical inactivity
and harmful use of alcohol (the so-called ‘25 by 25 targets’)14. These targets are shown in table 1
below. A modelling study by Kontis et al. has shown that achievement of these targets would reduce
global premature mortality from CVD, cancer, diabetes and COPD by 22% in men and 19% in women
between 2010 and 202515. But premature mortality is not the only measure of ill health. Whereas
the diseases included in the Kontis et al. analysis are responsible for 87% of all NCD deaths
worldwide, they only contribute to 57% of the disability burden from NCDs16. And the analysis does
not include NCDs that make a substantial impact on disease burden in the UK, such as depression
and dementia.
The WHO 25 by 25 targets will dominate the NCD policy landscape for the foreseeable future and
their publication represents a challenge to national policy makers to develop comprehensive
prevention-based health policies. In order to build and maintain momentum towards achieving
these goals, each country has been challenged to review potential priority interventions and report
on current progress towards their implementation17. The Richmond Group of charities have called
for prioritising prevention in the UK, with their call for prevention to be ‘at the heart of the health
service and at the centre of all policy decisions’18.
In this report, we set out policy options that are available in the UK in order to transform the
landscape of prevention of NCDs, informed by reviews of the evidence and an expert workshop held
in July 2015. We also quantify the health impact of meeting the 25 by 25 targets in England,
11
GBD 2013 Risk Factors Collaborators. Global, regional, and national comparative risk assessment of 79 behavioural, environmental and occupational, and metabolic risks or clusters of risks in 188 countries,1990–2013: a systematic analysis for the Global Burden of Disease Study 2013. Lancet, 2015;386:2287-2323. 12
Newton J, Briggs A, Murray C, Dicker D, Foreman K, Wang H, et al. Changes in health in England, with analysis by English regions and areas of deprivation, 1990-2013: a systematic analysis for the Global Burden of Disease 2013. Lancet, 2015;doi:10.1016/S0140-6736(15)00195-6. 13
Townsend N, Bhatnagar P, Wilkins E, Wickramasinghe K, Rayner M. Cardiovascular disease statistics 2015. British Heart Foundation: London, 2015. https://www.bhf.org.uk/publications/statistics/cvd-stats-2015 14
World Health Organization. WHO Global NCD Action Plan 2013-2020. WHO: Geneva, 2013. 15
Kontis V, Mathers C, Rehm J, Stevens G, Shield K, Bonita R, Riley L, Poznyak V, Beaglehole R, Ezzati M. Contribution of six risk factors to achieving the 25x25 non-communicable disease mortality reduction target: a modelling study. Lancet, 2014;384(9941):427-437. 16
Pearce N, Ebrahim S, McKee M, Lamptey P, Barreto M, Matheson D, et al. The road to 25x25 how can the five-target strategy reach its goal? Lancet Global Health, 2014;2(3):e126-128. 17
Beaglehole R, Bonita R, Ezzati M, Alleyne G, Dain K, Kishore S, Horton R. NCD countdown 2025: accountability for the 25x25 NCD mortality reduction target. Lancet; 2014;384(9938):105-107. 18
The Richmond Group of Charities. What is Preventing Progress? Richmond Group: London, 2014. http://www.richmondgroupofcharities.org.uk/publications

11
including a broad range of NCDs (CVD, cancer, COPD, cirrhosis, diabetes, depression, dementia and
kidney disease) and calculating the impact on both mortality and disability. And we also quantify the
likely impact on health of four potential policy initiatives aimed at preventing NCDs by improving
diets, reducing physical inactivity, cutting smoking and addressing problem alcohol consumption.
The rest of this report provides an overview of the methods used for the policy review and the
modelling studies followed by an in-depth discussion of the results, and then a conclusion. Full
details of the methods used for the study can be found in the technical appendix.
Table 1: The WHO 25 by 25 targets
Risk factor 25 by 25 target†
Salt consumption 30% reduction in salt / sodium intake Physical inactivity 10% reduction in physical inactivity Smoking 30% reduction in tobacco use Alcohol consumption 10% reduction in harmful use of alcohol Obesity 0% increase in obesity Diabetes 0% increase in diabetes Raised blood pressure 25% reduction in raised blood pressure
†Targets are to be met by 2025, in comparison to 2010 figures

12
METHODS
This report provides the results of the PROMISE study, which incorporated a Policy Review and a
Modelling Study. In this section the methods for the policy review and the modelling study are
described briefly to give an indication of how the PROMISE study was conducted. Full details of the
methods used for the studies are available in the Technical Appendix.
Modelling study
To estimate the impact of the WHO 25 by 25 targets on NCD mortality and disability in England we
first had to project a baseline scenario of disease burden to 2025. This baseline scenario represents a
business as usual (BAU), where current efforts to prevent and treat NCDs are expected to continue
up to 2025. Since the burden of most NCDs is currently on a downward trend, this means the BAU
scenario will result in falls in NCD burden. In modelled scenarios where risk factor trends are
changed, the results are compared against this BAU scenario.
To project the baseline scenario, we first projected population figures for England to 2025 using
published projections of fertility and mortality rates and deriving estimates for migration. We then
sub-divided the total mortality rates by the NCDs of interest by projecting the proportion of all-cause
mortality from each condition since 2000, using a method developed for the Global Burden of
Disease study19. To estimate disability for each condition, we applied age-specific estimates of the
proportion of years lived in disability to mortality rates.
We used data from the Health Survey of England20 and National Diet and Nutrition Survey21 datasets
to estimate age-specific trends in the prevalence of the seven risk factors between 1995 and 2012.
We then produced BAU projections of these trends to 2025 using similar methods as those
developed for the Foresight report on obesity22.
To model the 25 by 25 scenarios, we needed to connect the changes in risk factor prevalence with
changes in disease outcomes and to do this we calculated population impact fractions (PIFs) for each
scenario. These were calculated using a comparative risk assessment model called PRIME which has
been used for many analyses of the impact of prevention-based interventions in the UK and
elsewhere23. The PIFs were based on meta-analyses of randomised and observational studies of the
relationship between the risk factors and the NCD outcomes. A detailed account of the studies
included in the PRIME model is provided in the Technical Appendix.
We applied the 25 by 25 targets to the BAU projections of risk factors and used the year-by-year
differences in the BAU projection and the scenarios to calculate age-specific PIFs, which were
19
Salomon J, Murray C. The epidemiologic transition revisited: compositional models for causes of death by age and sex. Population and Development Review, 2002;28:205-228. 20
Joint Health Surveys Unit. Health Survey for England 2012, and previous editions. HSCIC: Leeds, 2014. 21
NatCen. The National Diet and Nutrition Survey: Results from years 1-4 (combined) of the rolling programme (2008/09 – 2011/12), and previous editions. Public Health England: London, 2014 22
McPherson K, Marsh T, Brown M. Foresight. Tackling obesities – modelling future trends in obesity and the impact on health. Government Office for Science: London, 2007. 23
Scarborough P, Harrington R, Mizdrak A, Zhou M, Doherty A. The Preventable Risk Integrated ModEl (PRIME) and its use to estimate the health impact of public health policy scenarios. Scientifica, 2014;doi:10.1155/2014/748750.

13
applied to disease rates in the model to produce scenario estimates of the impact of the 25 by 25
targets on NCD mortality and disability.
In order to estimate the health impact of selected policy initiatives, we first modelled the impact of
these initiatives on the prevalence of risk factors for disease using the best available evidence on
efficacy of the interventions and their potential uptake and reach within the population. This
provided us with estimates of the effect of the policy initiatives, which we used to calculate PIFs and
apply to the disease model in the same way as described earlier.
Policy review
We conducted a purposive scoping review of the literature to identify policy intervention options to
address poor diet, physical inactivity, tobacco smoking, and harmful alcohol consumption. We
focused our search on review-level evidence from the peer-reviewed journals and supplemented
this search by exploring web-based sources of grey literature aimed specifically at a policy making
audience, some of which included non-review level evidence. To identify this evidence we searched
the TRIP database, the Cochrane Library, PubMed, Google Scholar, NICE Guidelines, and carried out
focused searches of publication lists in key websites of other UK government bodies (Department of
Health, Food Standards Agency) and non-governmental organisations (Ash, Sustain, Alcohol
Research UK).
Box 1: Inclusion criteria for interventions
To be included in the policy review, an intervention must meet each of the following criteria: 1 Must be aimed at addressing diet and/or physical inactivity and/or smoking and/or alcohol. 2 Must be supported by review-level data published in English from January 2005 onwards (end
date December 2014), except for grey literature. 3 Must be non-clinical. 4 Must be population-based.
We identified 16 sources of evidence about alcohol-related interventions, 27 about interventions
around diet, 26 about physical activity related interventions and 36 about smoking interventions.
The list of intervention options was submitted to a group of 19 experts nominated by the Richmond
Group to refine the identified intervention options into a long list of potential policy intervention
options for each of the four risk factors. This longlist was considered at a day long workshop hosted
by the British Heart Foundation in July 2015. Invitees included public health experts from academia,
government bodies, and health-related NGOs, some of whom had provided comments in the expert
consultation stage. The workshop asked the experts to assess the longlist of interventions generated
by the scoping review against a range of criteria in order to produce a shortlist of possible policy
options for further review of the evidence. The criteria used by the experts were: size of population
impact; resources required; impact on health inequalities; political acceptability; and strength of
evidence.

14
After the workshop the recommendations of the experts were refined by the Richmond Group into
the list of 12 interventions shown in box 2 below. The sources of evidence identified in the scoping
review were then used to review the evidence regarding implementation of these policy options.
Box 2: Shortlist of prioritised intervention options for poor diet, physical inactivity, smoking and
alcohol consumption
Alcohol Diet
Regulation to raise the price of high strength cheap alcohol
Sugar sweetened beverage tax
Strengthen local authority control over licensing powers
Reformulation of packaged food, including portion
size control
Further restriction of alcohol marketing
Further restriction of unhealthy food marketing, including pre-watershed broadcast advertising,
online marketing and restrictions on sporting event sponsorship
Physical activity Smoking
Redesign urban environments to prioritise walking and cycling
Maintain increases of tax on tobacco at above
inflation rates
Support for community groups that encourage
physical activity
Tackling illicit trade in cigarettes
Behaviour change advice service, delivered through primary care
Increased support for smoking cessation services,
particularly in hard to reach groups

15
RESULTS
Modelling study
Here we present the results of modelling the 25 by 25 scenarios in England (the effect of selected
policy interventions are presented alongside the results of the policy review). Throughout this report
we present two sets of modelled results – the main results which include depression and dementia
as outcomes, and secondary results where these conditions are not included. This is because the
evidence relating a link between the risk factors and both dementia and depression is less
established than for the other disease outcomes. In some cases the mechanisms are unclear24, or
previous results investigating the relationship have been highly heterogeneous25. Meta-analyses of
the relationship between risk factors and depression and dementia are often not based on analyses
adjusted for other risk factors, increasing the risk of confounding26.
Initially, we investigated whether the achievement of the 25 by 25 targets in England would reduce
premature mortality from NCDs by 25% by 2025. This is the WHO target for NCD prevention27 and
their definition of NCDs does not include liver cirrhosis, depression and dementia. Therefore we
excluded them from this analysis. Under the BAU scenario (i.e. following current trends in disease
burden), the probability of dying between 30 and 70 years of age from NCDs is expected to fall from
17.6% in 2010 to 13.7% in 2025 for men, and from 11.9% in 2010 to 8.9% in 2025 for women (Figure
1). The projected BAU changes in premature mortality equate to relative reductions of 22% for men
and 25% for women.
Achieving the 25 by 25 targets reduces the probability of premature NCD mortality for both men and
women (Figure 1). In our projections the additional benefit ranges from an extra 0.1% reduction for
men and women, if prevalence of physical inactivity can be reduced by 10%, up to an extra 2.3%
reduction for men and 1.1% reduction for women, if the rise in obesity is halted. Achieving all seven
behavioural risk factor targets combined would lead to both men and women reaching the 25%
premature mortality reduction target by 2025 (Table 2).
We also modelled the impact of achieving the 25 by 25 targets on deaths at all ages, including those
from depression and dementia (Figure 2 and Table 3). Because of the strong relationship between
age and NCDs, most of the reduction in deaths happens in older age groups where over 200,000
deaths would be averted or delayed by 2025. Most of the delayed and averted deaths are from CHD
or stroke, with a sizeable contribution (over 17,000) from dementia. As with the analysis of
premature mortality, the biggest contributor to reductions in mortality was halting the rise in
obesity.
24
Baumgart M, Snyder H, Carrillo M, et al. Summary of the evidence on modifiable risk factors for cognitive decline and dementia: a population-based perspective. Alzheimer’s & Dementia, 2015;718-726. 25
Valkanova V, Ebmeier K. Vascular risk factors and depression in later life: a systematic review and meta-analysis. Biology Psychiatry, 2013;73:406-413. 26
Cheng G, Huang C, Deng H, Wang H. Diabetes as a risk factor for dementia and mild cognitive impairment: a meta-analysis of longitudinal studies. Internal Medicine Journal, 2012;484-491. 27
World Health Organization. WHO Global NCD Action Plan 2013-2020. WHO: Geneva, 2013.

16
Figure 1: Projected trends in the probability of dying prematurely from non-communicable disease
for the business as usual and 25 by 25 target scenarios.
12%
13%
14%
15%
16%
17%
18%
2010 2012 2014 2016 2018 2020 2022 2024
Pro
bab
ility
of
pre
mat
ure
mo
rtal
ity
Year
Men2010 level
25% reduction
8%
9%
10%
11%
12%
2010 2012 2014 2016 2018 2020 2022 2024
Pro
bab
ility
of
pre
mat
ure
mo
rtal
ity
Year
Women
Business-as-usual Obesity Tobacco use
Diabetes Raised blood pressure Salt intake
Harmful alcohol use Physical inactivity Combined scenario
2010 level
25% reduction
17
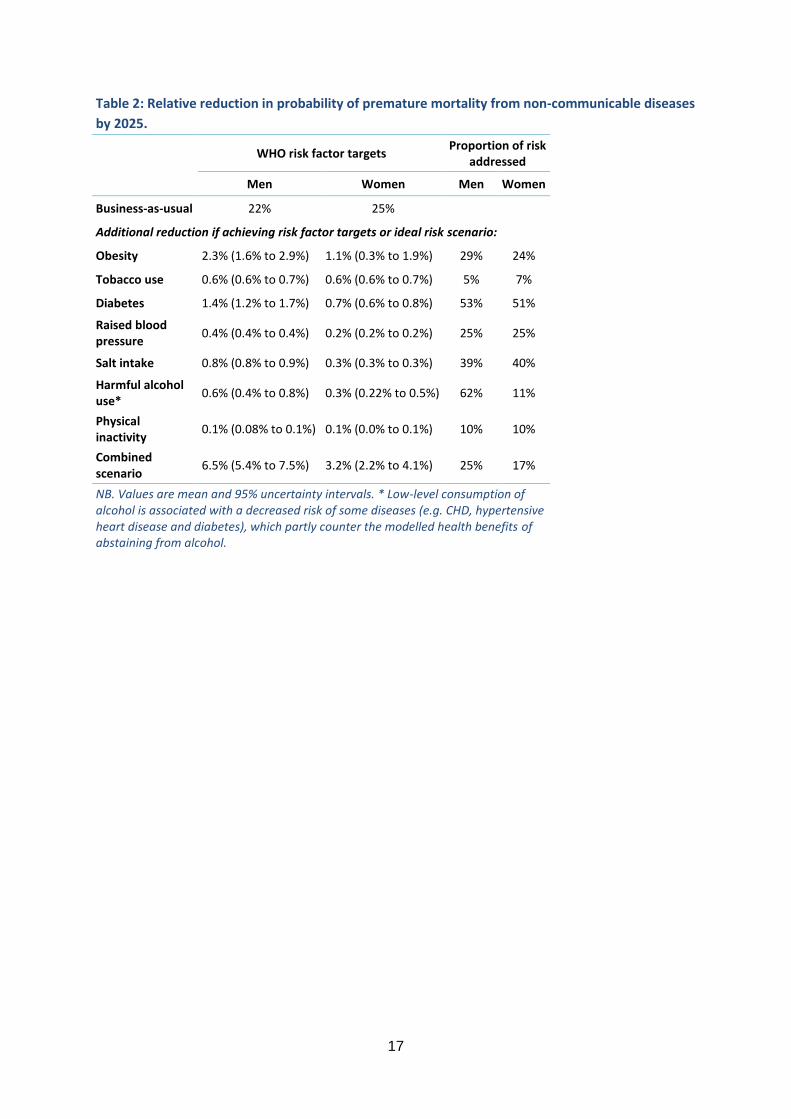
Table 2: Relative reduction in probability of premature mortality from non-communicable diseases
by 2025.
WHO risk factor targets
Proportion of risk addressed
Men Women Men Women
Business-as-usual 22% 25%
Additional reduction if achieving risk factor targets or ideal risk scenario:
Obesity 2.3% (1.6% to 2.9%) 1.1% (0.3% to 1.9%) 29% 24%
Tobacco use 0.6% (0.6% to 0.7%) 0.6% (0.6% to 0.7%) 5% 7%
Diabetes 1.4% (1.2% to 1.7%) 0.7% (0.6% to 0.8%) 53% 51%
Raised blood pressure
0.4% (0.4% to 0.4%) 0.2% (0.2% to 0.2%) 25% 25%
Salt intake 0.8% (0.8% to 0.9%) 0.3% (0.3% to 0.3%) 39% 40%
Harmful alcohol use*
0.6% (0.4% to 0.8%) 0.3% (0.22% to 0.5%) 62% 11%
Physical inactivity
0.1% (0.08% to 0.1%) 0.1% (0.0% to 0.1%) 10% 10%
Combined scenario
6.5% (5.4% to 7.5%) 3.2% (2.2% to 4.1%) 25% 17%
NB. Values are mean and 95% uncertainty intervals. * Low-level consumption of alcohol is associated with a decreased risk of some diseases (e.g. CHD, hypertensive heart disease and diabetes), which partly counter the modelled health benefits of abstaining from alcohol.

18
Figure 2: NCD deaths and YLDs that are averted or delayed between 2015 and 2025, for the
combined risk factor target scenario.
NB. The small increase in COPD YLDs is due to a shift in the age distribution of the population, primarily as a
result of reductions in CHD and stroke mortality, and does not reflect an increase in COPD rates
-50 50 150 250 350 450 550
Women 70+
Men 70+
Women 30-69
Men 30-69
YLDs (thousands)
CHD Stroke Diabetes Cirrhosis Cancer
COPD Kidney disease Hypertensive HD Depression Dementia
0 20 40 60 80 100 120 140 160
Women 70+
Men 70+
Women 30-69
Men 30-69
Deaths (thousands)

19
Table 3: Total NCD deaths and YLDs that are averted or delayed between 2015 and 2025, for each of the 25 by 25 targets.
30-69 years 70+ years
Men Women Men Women
Deaths
Obesity 12,000 (8,400 to 15,000) 4,100 (1,100 to 7,100) 44,000 (32,000 to 55,000) 23,000 (12,000 to 34,000)
Tobacco use 2,900 (2,700 to 3,000) 2,500 (2,500 to 2,600) 8,200 (7,800 to 8,600) 8,700 (8,400 to 8,900)
Diabetes 6,600 (5,400 to 7,900) 2,300 (1,800 to 2,700) 35,000 (28,000 to 42,000) 29,000 (23,000 to 35,000)
Raised blood pressure 3,000 (2,800 to 3,200) 1,200 (1,100 to 1,300) 14,000 (13,000 to 14,000) 11,000 (11,000 to 12,000)
Salt intake 5,600 (5,400 to 5,800) 1,500 (1,400 to 1,600) 25,000 (24,000 to 26,000) 16,000 (15,000 to 16,000)
Harmful alcohol use 3,100 (1,900 to 4,400) 1,300 (750 to 1,800) 7,700 (5,000 to 10,000) 4,000 (800 to 7,300)
Physical inactivity 560 (400 to 720) 170 (130 to 210) 2,700 (2,000 to 3,400) 2,200 (1,600 to 2,800)
Combined scenario 31,000 (25,000 to 36,000) 9,700 (6,700 to 13,000) 130,000 (110,000 to 140,000) 79,000 (63,000 to 94,000)
YLDs
Obesity 72,000 (60,000 to 84,000) 46,000 (35,000 to 57,000) 140,000 (120,000 to 160,000) 90,000 (63,000 to 120,000)
Tobacco use 11,000 (11,000 to 11,000) 14,000 (13,000 to 14,000) 14,000 (14,000 to 14,000) 20,000 (20,000 to 21,000)
Diabetes 170,000 (170,000 to 170,000) 140,000 (140,000 to 140,000) 300,000 (290,000 to 310,000) 260,000 (260,000 to 270,000)
Raised blood pressure 9,400 (8,700 to 10,000) 6,200 (5,600 to 6,900) 22,000 (21,000 to 23,000) 15,000 (14,000 to 16,000)
Salt intake 17,000 (16,000 to 18,000) 8,500 (8,100 to 8,800) 38,000 (36,000 to 40,000) 21,000 (20,000 to 21,000)
Harmful alcohol use 3,800 (-12,000 to 20,000) -230 (-5,900 to 5,400) 9,600 (-17,000 to 36,000) 2,000 (-8,100 to 12,000)
Physical inactivity 3,800 (3,300 to 4,300) 3,300 (2,900 to 3,700) 8,300 (7,100 to 9,500) 7,800 (6,800 to 8,900)
Combined scenario 220,000 (200,000 to 240,000) 170,000 (160,000 to 180,000) 410,000 (370,000 to 450,000) 320,000 (300,000 to 340,000)
NB. Values are mean and 95% uncertainty intervals. The Technical Appendix presents numbers further broken down by disease (e.g. type of cancer).

20
Although reductions in mortality as a result of achievement of the 25 by 25 targets were dominated
by cardiovascular conditions (CHD and stroke), reductions in disability had a different pattern (Figure
2 and Table 3). The largest contributors to reductions in disability (measures as years of life lost in
disability – YLDs) by order were diabetes, depression, stroke, dementia and CHD for women, and
diabetes, stroke, CHD, dementia and depression for men. Due mainly to the large burden of diabetes
in younger age groups, the disparity between reductions in disability due to the 25 by 25 targets in
30-69 year olds and 70+ year olds was much smaller than for mortality. The 25 by 25 target to halt
the increase in diabetes made the biggest contribution to reductions in disability, contributing nearly
three quarters of the improvements for men and over 80% for women.
For most of the risk factors, the biggest impact on health outcomes was achieved in the initial year
of the modelling (2010), and the remainder of the simulation period showed similar or diminishing
impact on health burdens (Figure 3). For example, the reduction of female smoking by 30% reduces
the total disease burden by 20 DALYs averted per 100,000 in 2010 (DALYs are a combination of early
mortality and years lived with disability) to 15 DALYs averted per 100,000 in 2025. However, this is
not the case for diabetes and obesity, where the impact on health burden of meeting the 25 by 25
targets increases year on year between 2010 and 2025. This is because of the nature of the targets.
For blood pressure, smoking, salt, alcohol consumption and physical inactivity the targets are set as
a relative reduction in the prevalence of a risk factor that is currently reducing already. For obesity
and diabetes, the target is for an absolute reduction in the prevalence of risk factors that are
currently increasing.
The difference in the size of the impact for each of the risk factor targets is due to a combination of
the following: the size of the relationship between the risk factor and NCDs; the current trend in the
risk factor; the ambition of the target. Obesity is strongly linked with many NCDs, rates are currently
increasing in the UK, and halting the rise in obesity is an ambitious target that would result in wide
divergences between the business-as-usual and target scenarios by 2025, so it is unsurprising that
this target has the biggest impact on NCD burden in our analyses. In contrast, physical activity is
strongly related to many NCDs, but rates of physical inactivity are currently falling in the UK, and
achieving the WHO target would not lead to wide differences in physical activity levels by 2025 (for
example, by 2025 our projections suggest 28% of men aged 36-55 will be inactive, which would
reduce to 25% if the WHO target is achieved. In comparison, the obesity target would keep the
prevalence of obesity at 31% compared to 45% in the business-as-usual scenario). Therefore,
comparisons of the relative size of the impact of achieving the WHO risk factor targets should not be
taken as an indication of the relative importance of tackling each risk factor.
For complete results by age, sex, risk factor and disease, see the Technical Appendix.

21
Figure 3: DALYs averted by the 25 by 25 targets between 2010 and 2025.
-
20
40
60
80
100
120
140
160
180
2010 2015 2020 2025
DA
LYs
aver
ted
(p
er 1
00
,00
0 p
op
ula
tio
n)
Year
Men
-
20
40
60
80
100
120
140
2010 2015 2020 2025
DA
LYs
aver
ted
(p
er 1
00
,00
0 p
op
ula
tio
n)
Year
Women
Raised blood pressure Obesity Tobacco use Diabetes
Salt intake Harmful alcohol use Physical inactivity Combined scenario

22
Policy review
The results of the policy review are presented below, subdivided by the four behavioural risk factors:
poor diet, physical inactivity, smoking and alcohol consumption. For each risk factor, the three
interventions on the PROMISE shortlist (see Box 2) are discussed in turn. For four of the
interventions, we have also modelled the potential impact of implementation using the models
described above. These interventions are: reformulation of packaged food, including portion size
control; behaviour change advice for physical inactivity, delivered through primary care; further
restriction of alcohol marketing; and maintaining increases of tax on tobacco at above inflation
rates. For each of these interventions detailed methods of the modelling are described in the
Technical Appendix, and results are presented in this section. All of the sources of evidence used to
inform the policy review are provided in a reference list in the Technical Appendix.
POOR DIET
The House of Commons Health Select Committee report ‘Impact of physical activity and diet on
health’, published in 2015, concludes that policy makers should consider actions relating to each of
the following three intervention options chosen to be taken forward for further consideration by the
Richmond Group.
Sugar sweetened beverage tax
In their briefing paper 'Using price policies to promote healthier diets', the European Regional Office
of the WHO provides a summary of the rationale and evidence around food pricing strategies and
highlights the experiences of several countries where some form of food-based tax has been
introduced. It concludes that “the evidence is largely consistent with the theory, and suggests that
price policies have the potential to influence consumer purchasing in the desired direction” and that
“taxes on sugar sweetened beverages and targeted subsidies on fruit and vegetables emerge as the
policy options with the greatest potential to induce positive changes in consumption”. Our scoping
review supports these conclusions with the caveat that the existing evidence base is largely drawn
from simulation or modelling studies which limits our understanding about the impact of food
pricing strategies in ‘real’ life. There is still much to understand about how such taxation systems
might be implemented and much to learn about how different population groups might receive and
respond to such policy initiatives.
Andreyeva et al (2010)28 report the results of their systematic review of research on the price
elasticity of demand for food. This review included 160 US studies (sourced until 2007) and aimed to
estimate the effect of price changes on the primary demand for a range of food categories employed
by the Dietary Guidelines for Americans. They report that food prices are relatively inelastic
compared with other commodities but that, according to their estimates, food eaten away from
home, soft drinks and juice are most likely to be responsive to changes in price compared with other
food categories like eggs or fats and oils. In this review, elasticity estimates for soft drinks remained
28
Andreyeva T, Long MW, Brownell KD. The impact of food prices on consumption: a systematic review of research on the price elasticity of demand for food. Am J Public Health, 2012;100(2):216-222.

23
relatively stable even when the definition of ‘soft drink’ was changed to incorporate different drink
categories (e.g. carbonated soft drinks, fruit juices, soda, non-alcoholic beverages). There was no
information available on cross-price elasticity for soft drinks (where consumers substitute one
product for another). Limited data availability meant that Andreyeva et al were unable to estimate
the differential impact of prices changes on consumers with varying incomes, or across differences in
age, educational status, culture or ethnicity. The authors conclude that “soft drinks offer a possible
target for public health tax policies” but also warn that the evidence base would be strengthened by
a greater understanding of real-life changes in consumer behaviour as price changes occur rather
than estimating potential public health benefits.
Thow et al (2010)29 included 24 peer-reviewed and grey-literature studies in their systematic review
of the effect of food taxes and subsidies on diet, body weight and health. The literature included was
published between 2000-2009, with most studies published from 2006, and 23 studies originating in
high income countries, mostly in the US. They conclude that taxes and subsidies have the potential
to impact on public health, especially when the price changes proposed are substantial. Mixed
results were found in the 10 included studies which addressed soft drinks taxes. The authors also
noted inconsistent findings around the regressive nature of food taxes and point to an over-reliance
on modelling studies, which they argue are based on assumptions and subject to data limitations.
Thow et al call for improvements in the range and quality of studies on food taxes and subsidies to
supplement the “inadequate evidence” available for policy makers.
Eyles et al (2012)30 undertook a systematic review of simulation studies of food pricing strategies to
ascertain how food price changes might impact on food consumption, health and disease outcomes
and on different income groups with a population. They included 32 studies sourced from 1990-2011
(of which 19 were peer-reviewed papers and 13 other types of report). They report findings that
point towards a health benefit in the included studies which assessed the impact of carbonated soft
drinks taxes. They also suggest that, in modelled relationships, larger price increases provide a
correspondingly greater reduction in consumption. The authors updated their literature search to
include studies published after they had completed their systematic review (until October 2012) and
concluded that the additional literature they found on sugar-sweetened beverages supported their
review findings. The review found that most of the included studies estimated a positive absolute
impact on lower income population groups but the authors also noted that the majority of studies
which they included were of low/medium methodological quality. Eyles et al conclude that, based on
modelling studies, the introduction of carbonated soft drinks taxes would be associated with positive
dietary change. They also call for improvements in the quality of simulation studies; highlight the
need for more information about the impact of food pricing strategies on lower income groups; for
evaluation of ‘natural experiments’, where soft drinks taxes are introduced in the ‘real’ world which
would build an understanding of the practical implications of the introduction of a food tax.
29
Thow AM, Jan S, Leeder S, Swinburn B. The effect of fiscal policy on diet, obesity and chronic disease: a systematic review. Bull World Health Organ, 2010;88(8):609-614. 30
Eyles H, Ni Mhurchu C, Nghiem N, Blakely T. Food pricing strategies, population diets, and non-communicable disease: a systematic review of simulation studies. PLoS Med, 2012;9(12):e1001353.

24
Powell et al (2013)31 set out to assess the potential effectiveness of food and beverage taxation for
improving public health. They included 41 US studies (20 studies on the effects of price on
consumption patterns and 21 studies linking effects of price on body weight) in their systematic
review, sourced from 2007 – March 2012. Their findings support earlier review conclusions and
suggest that sugar-sweetened beverages may be more price sensitive than previously considered.
The authors found limited or no association between existing soda taxes and weight outcomes
(which could be explained by the nature of the evidence they are able to examine), although they
suggest that this may be due to the small level of taxation and that such taxes are typically applied
equally to healthier and less healthy product choices. Powell et al call for future studies to refine
their methods to disaggregate sugar-sweetened beverages from ‘diet’ varieties and for further work
on the mechanisms for applying such taxes.
Reformulation of packaged food, including portion size control
Our scoping review suggests that there is evidence to support encouraging reformulation of food
products to improve their nutritional profiles, although there remains much to learn about the most
effective type of approaches, or combinations of approaches, which might be needed to achieve
this.
In 2010, NICE published public health guidance on the prevention of cardiovascular disease32.
Between September 2008 and July 2009, the PDG charged with producing the guidance considered
evidence of effectiveness, expert reports and cost effectiveness to generate a comprehensive set of
recommendations based on the best available evidence. This included policy goals to reduce
population-level consumption of salt and saturated fat and to protect the population from the
harmful effects of industrially-produced trans fatty acids (IPTFAs). NICE suggest the following
evidence-based measures, amongst others, which would favourably impact on population levels of
salt, saturated fat and IPTFAs:
Ensure food producers and caterers continue to reduce the salt content of commonly
consumed foods (including bread, meat products, cheese, soups and breakfast cereals). This
can be achieved by progressively changing recipes, products and manufacturing and
production methods.
Encourage manufacturers, caterers and producers to reduce substantially the amount of
saturated fat in all food products. If necessary, consider supportive legislation.
Create favourable conditions for industry and agriculture to produce dairy products for
human consumption that are low in saturated fat.
Eliminate the use of IPTFAs for human consumption.
In line with other EU countries, introduce legislation to ensure that IPTFA levels do not
exceed 2% in the fats and oils used in food manufacturing and cooking.
Create and sustain local and national conditions which support a reduction in the amount of
IPTFAs in foods, while ensuring levels of saturated fat are not increased. Encourage the use
31
Powell L, Chriqui J, Khan T, Wada R, Chaloupka F. Assessing the potential effectiveness of food and beverage taxes and subsidies for improving public health: a systematic review of prices, demand and body weight outcomes. Obesity Reviews, 2013;14:110–128. 32
NICE. Prevention of Cardiovascular Disease. NICE public health guideline 25. NICE: London, 2010.

25
of vegetable oils high in polyunsaturated and monounsaturated fatty acids to replace oils
containing IPTFAs.
Develop UK-validated guidelines and information for the food service sector and local
government on removing IPTFAs from the food preparation process.
In their assessment of the public health nutrition policies of 30 European countries, Lloyd-Williams
et al (2014)33 report that, at the time of their study, 13 countries had mandatory maximum salt
content levels in foods; four countries had trans-fat bans, two countries had legislation in place in
relation to sugar, one country had mandatory regulation around fatty and sugary foods and one
country had regulation affecting fruit and vegetables. The authors report that participants in their
study perceived mandatory reformulation of food products to be an effective mechanism for
improving public health nutrition. Voluntary reformulation was more commonly reported than
mandatory reformulation (in 25 of the 30 countries), most commonly for salt, and less frequently in
relation to the fat and sugar content of some foods. Lloyd-Williams et al suggest that voluntary
reformulation has had a modest and variable impact.
Webster et al (2014)34 provide a global overview of national initiatives to encourage the food
industry to reduce salt. They report that 80% of countries with a national salt reduction strategy are
working with the food industry and suggest that almost all countries which have achieved progress
have done so by setting a target for salt levels in foods. They consider the debate about whether
success can be attributed to voluntary or mandatory action, suggesting that a combination of
measures such as strong leadership, requirements for consumer labelling, robust monitoring and
NGO pressure can re-enforce voluntary action to reformulate.
Downs et al (2013)35 report a systematic review of 26 studies (sourced from 2005-2012) which
examined various policy actions to reduce dietary trans-fat consumption, including reformulation.
They find positive findings for any policy intervention aimed at trans-fat reduction, although the
degree of success varied across product category, and suggest that product reformulation has led to
an improvement in the fatty acid profile of foods, at least in high-income countries.
The most convincing evidence to date about the role of portion size in food selection comes from a
systematic review published by Hollands et al in 201536. This Cochrane review included 72 studies
published up to July 2013, 96% of which manipulated food products, either by portion size (35
studies), package size or tableware size/shape. The authors conclude that “people consistently
consume more food and drink when offered larger-sized portions, packages or tableware than when
offered smaller-sized versions. This suggests that policies and practices that successfully reduce the
33
Lloyd-Williams F, Bromley H, Orton L, Hawkes C, Taylor-Robinson D, O’Flaherty M, et al. Smorgasbord or symphony? Assessing public health nutrition policies across 30 European countries using a novel framework. BMC Public Health, 2014;14:1195. 34
Webster J, Trieu K, Dunford E, Hawkes C. Target Salt 2025: A Global Overview of National Programs to Encourage the Food Industry to Reduce Salt in Foods. Nutrients, 2014;6(8):3274-3287. 35
Downs SM, Thow AM, Leeder SR. The effectiveness of policies for reducing dietary trans fat: a systematic review of the evidence. Bulletin of the World Health Organization, 2013;91(4):262-269. 36
Hollands GJ, Shemilt I, Marteau TM, Jebb SA, Lewis HB, Wei Y, et al. Portion, package or tableware size for changing selection and consumption of food, alcohol and tobacco. Cochrane Database of Systematic Reviews 2015, 9:CD011045. DOI: 10.1002/14651858.CD011045.pub2.

26
size, availability and appeal of larger-sized portions, packages, individual units and tableware can
contribute to meaningful reductions in the quantities of food (including non-alcoholic beverages)
people select and consume in the immediate and short term.” Hollands et al rated the overall quality
of the evidence they reviewed as moderate and suggest that more needs to be known about longer-
term impacts and in ‘real-life’ conditions where portion size is not likely to be so highly controlled as
in many of the studies included in this review.
We modelled the impact of reformulating foods in England in order to reduce salt levels, sugar levels
and portion sizes. For salt levels, we used salt targets for 2017 developed by the Food Standards
Agency for 76 food categories37. For both sugar levels and portion size reduction we used examples
of industry best practice identified by the UK Food Network Responsibility Deal38. We assumed that
reformulation would be taken up by 39% of the food industry, following an expert consultation by
Gillespie et al (2015)39. Full methods are provided in the Technical Appendix.
We estimated that food reformulation would result in 14,000 (2,500 to 25,000) deaths averted or
delayed in men, and 12,000 (1,700 to 22,000) in women by 2025 (Figure 4 and Table 4). For both
men and women, the majority of the deaths delayed or averted were from CHD or stroke, but there
were also sizeable reductions in mortality from cirrhosis and cancer of the colorectum, liver,
pancreas and kidney (due primarily to reductions in body weight). Food reformulation would also
have a sizeable impact on disability, with over 32,000 years of life lived with disability from diabetes
removed by reformulation.
37
Food Standards Agency. Salt reduction targets for 2017. FSA: London, 2015. 38
Department of Health. Calorie reduction pledge development tool – using industry best practice examples. DH: London, 2015. 39
Gillespie D, Allen K, Guzman-Castillo M, Bandosz P, Moreira P, McGill R, et al. The Health Equity and Effectiveness of Policy Options to Reduce Dietary Salt Intake in England: Policy Forecast. Plos One, 2015;10(7):e0127927.

27
Figure 4: NCD deaths and YLDs that are averted or delayed between 2015 and 2025 with food
reformulation.
0 1 2 3 4 5 6 7 8 9 10 11 12
Women 70+
Men 70+
Women 30-69
Men 30-69
Deaths (thousands)
0 5 10 15 20 25 30 35 40 45
Women 70+
Men 70+
Women 30-69
Men 30-69
YLDs (thousands)
CHD Stroke Diabetes Cirrhosis Cancer
COPD Kidney disease Hypertensive HD Depression Dementia

28
Table 4: NCD deaths and YLDs that are averted or delayed between 2015 and 2025 with food reformulation.
Deaths YLDs
Men Women Men Women
CHD 7,400 (1,200 to 14,000) 3,800 (570 to 7,100) 8,900 (2,600 to 15,000) 6,200 (2,900 to 9,400)
Stroke 3,200 (560 to 5,800) 4,200 (660 to 7,700) 8,400 (5,800 to 11,000) 6,300 (2,800 to 9,900)
Diabetes 56 (34 to 79) 36 (17 to 56) 15,000 (15,000 to 15,000) 17,000 (17,000 to 17,000)
Cirrhosis 810 (100 to 1,500) 510 (67 to 950) 410 (-300 to 1,100) 250 (-190 to 700)
Mouth cancer - - - -
Oesophagus cancer - - - -
Colorectal cancer 610 (120 to 1,100) 500 (62.0 to 930) 530 (39 to 1,000) 410 (-26 to 850)
Liver cancer 350 (30 to 670) 270 (17 to 520) 99 (-220 to 420) 64 (-190 to 310)
Pancreas cancer 150 (45 to 250) 150 (24 to 270) 11 (-93 to 110) 11 (-110 to 130)
Larynx cancer - - - -
Lung cancer - - - -
Breast cancer - 620 (-180 to 1,400) - 1,300 (480 to 2,100)
Cervix cancer - - - -
Kidney cancer 160 (-10 to 320) 110 (-13 to 230) 73 (-94 to 240) 44 (-75 to 160)
Bladder cancer - - - -
Stomach cancer - - - -
COPD - - - -
Kidney disease 110 (22 to 200) 150 (15 to 290) 1,900 (1,800 to 2,000) 3,400 (3,300 to 3,500)
Hypertensive HD 260 (42 to 470) 280 (28 to 520) 200 (-21 to 410) 240 (-10 to 490)
Depression - - 12,000 (12,000 to 12,000) 22,000 (22,000 to 22,000)
Dementia 550 (310 to 790) 1,000 (430 to 1,600) 4,200 (4,000 to 4,400) 5,700 (5,100 to 6,300)
NB. Values are mean and 95% uncertainty intervals, rounded to two significant figures.
29
Further restriction of unhealthy food marketing
In 2010, the NICE public health guidance on the ‘Prevention of Cardiovascular Disease’ also made
recommendations in relation to restrictions on food marketing aimed at children40. These included
the following evidence-based measures:
Ensure children and young people under 16 are protected from all forms of marketing,
advertising and promotions (including product placements) which encourage an unhealthy
diet.
Extend TV advertising scheduling restrictions on food and drink high in fat, salt or sugar (as
determined by the Food Standards Agency's nutrient profile) up to 9pm.
Develop equivalent standards, supported by legislation, to restrict the marketing, advertising
and promotion of food and drink high in fat, salt or sugar via all non-broadcast media. This
includes manufacturers' websites, use of the Internet generally, mobile phones and other
new technologies.
Ensure restrictions for non-broadcast media on advertising, marketing and promotion of
food and drink high in fat, salt or sugar are underpinned by the Food Standards Agency
nutrient profiling system.
In a systematic review produced for the WHO, Cairns et al (2009)41 identified 115 studies on the
extent and nature of food promotion to children and 90 studies on its effects. They report that “food
promotion is the most prevalent marketing category targeting children and young people… the
majority of foods and food products promoted are energy dense, high fat, sugar and/or high salt, and
in sharp contrast to national and international dietary guidelines. Sugar-sweetened breakfast
cereals, soft-drinks, confectionary and savoury snacks are the most frequently advertised categories,
with fast-food promotion continuing to gain marketing share.” The authors suggest that while
television advertising remains the most common form of food promotion, new mass media
approaches via websites and mobile telephones seem to be gaining in popularity, and what evidence
exists suggests that these new approaches are effective forms of food promotion. Cairns et al
conclude that there is modest, consistent evidence of a causal link between food promotion and
determinants of behaviour (like nutrition knowledge and food preferences), food behaviours
(consumption patterns) and diet-related health outcomes.
PHYSICAL INACTIVITY
Redesign urban environments to prioritise walking and cycling
Redesigning urban or built environments to prioritise walking and cycling was the central focus of
NICE’s PH41 review42. When updated in 2014, the evidence statements remained unchanged, and
the best available evidence was used to state that cycling demonstration towns (multi-component
interventions to increase cycling in six towns) are effective in increasing population levels of cycling
40
NICE. Prevention of Cardiovascular Disease. NICE public health guideline 25. NICE: London, 2010. 41
Cairns G, Angus K, Hastings G. The extent, nature and effects of food promotion to children: a review of the evidence to December 2008. World Health Organization: Geneva, 2009. 42
NICE. Walking and cycling: local measures to promote walking and cycling as forms of travel or recreation. NICE public health guidelines 41. NICE: London, 2012.

30
for active travel in the general population up to 10 years post intervention. Our scoping review
agrees with this position and is also supplemented by some economic modelling of examples where
infrastructure has been altered and evaluated with cost benefits and cost utility changes in walking
and cycling. Although some of this modelling is based on a number of heroic assumptions such
approaches were cost effective and applicable to adoption in the UK.
Implementing this evidence would see a range of different actions combined together. There were
different levels of evidence to support these actions however NICE felt that their combined actions
would be preferable than separate implementation. Actions would include:
Implement town-wide programmes to promote cycling for both transport and recreational
purposes. These could include cycle hire schemes, car-free events or days, providing
information such as maps and route signing, activities and campaigns that emphasise the
benefits of cycling, fun rides, and others.
Ensure walking routes are integrated with accessible public transport links to support longer
journeys. Signage should give details of the distance and/or walking time, in both directions,
between public transport facilities and key destinations.
Develop and implement school travel plans that encourage children to walk or cycle all or
part of the way to school, including children with limited mobility. Pupils should be involved
in the development and implementation of these plans.
Ensure walking and cycling are considered alongside other interventions, when working to
achieve specific health outcomes in relation to the local population (such as a reduction in
the risk of cardiovascular disease, cancer, obesity and diabetes, or the promotion of mental
wellbeing).
The review by Hansen et al (2015)43 warns that most of the research studies relating to the
environment’s impact on physical activity have not been performed with rural populations or in rural
contexts. The issue relates to the different patterns of environmental exposure between urban and
rural communities. There will be fewer parks, playing fields, cycle and walking infrastructure, higher
traffic speeds, less networked pubic transport and a greater reliance on motorised transport. The
authors also warn that despite having more immediate access to natural resources in a rural area,
the lack of infrastructure to access or encourage use also limits its potential use.
A recent review of systematic reviews of the relationship of the environment and physical activity
stated that many of the reviews of effectiveness in this field demonstrate methodological limitations
that might lead to inaccurate portrayals of the evidence44. The authors stress the importance of
taking an ecological or multi-variable pathway between the environment and specific population
groups, as these differ between environments and people. Ecological models postulate that
environmental attributes may interact with sociodemographic characteristics in influencing one’s
behaviour, which may lead to differential associations between environments and physical activity
among different population subgroups. The ability to respond to an environmental intervention may
be as limited as healthy volunteers responding to traditional offers of health screening. The authors
43
Hansen AY, Umstattd Meyer MR, Lenardson JD, Hartley D. Built Environments and Active Living in Rural and Remote Areas: a Review of the Literature. Curr Obes Rep,2015;4(4):484-493. 44
Gebel K, Ding D, Foster C, Bauman AE, Sallis JF. Improving current practice in reviews of the built environment and physical activity. Sports Medicine, 2015;45(3):297-302.

31
conclude with identical calls from NICE for research to identify the differential impacts of
environmental interventions across and within population groups.
Support for community groups that encourage physical activity
Support for community groups that encourage physical activity can include a range of actions by a
range of different community based organisations. Reviews by NICE have supported the evidence of
effectiveness for community led walking groups that have used pedometers, as part of their
intervention strategies45. The evidence on community pedometer interventions to increase walking
is only partially applicable to the UK. Three studies were conducted in the UK, with the majority in
the USA, Australian, Canada, and Japan. The evidence to support individual-level change in
community-based walking group interventions to increase walking is less consistent. There was
consistent evidence that the provision of clubs to promote walking were only partially successful at
reaching men and were generally poor at sustaining walking beyond 12 weeks duration. Recent
primary studies of Football Fans in Training, physical activity interventions based in local football
clubs, have demonstrated long term and sustained behaviour change, showing the context and
framing of an offer to be active must be seen as something that “people like me would do”46 (Hunt
et al, 2014). The location and style of delivery of early sessions fostered team spirit; men appreciated
being with others 'like them' and the opportunity to undertake physical activity and weight
management in circumstances that enhanced physical and symbolic proximity to something they
valued highly, the football club. This data has not been assimilated within review level evidence as
yet.
A meta-analysis of group based approaches to promoting walking (19 studies, 4 572 participants) by
Kassavou et al (2013)47 found moderate effects on physical activity, however less than half of the
studies included in this review were randomised controlled trials (RCTs). The authors also report that
no significant differences were found between studies delivered by professionals and those
delivered by lay people. They state one of the benefits of group interventions being to target more
people than individually based interventions, so there are economies of scale and implementation
by devoting resources to designing and implementing interventions to promote walking in groups.
Again the issue of reach and recruitment appears largely ignored by this body of evidence.
Behaviour change advice service, delivered through primary care
The effectiveness of promotion of physical activity in primary care has received much research
attention since the mid-1990s. The effectiveness of UK RCTs has tended to be low compared to
other studies performed in the USA or Australia48. The quality of studies has been poor with short
45
NICE. Walking and cycling: local measures to promote walking and cycling as forms of travel or recreation. NICE public health guidelines 41. NICE: London, 2012. 46
Hunt K, Gray CM, Maclean A, Smillie S, Bunn C, Wyke S. Do weight management programmes delivered at professional football clubs attract and engage high risk men? A mixed-methods study. BMC Public Health, 2014;21:14-50. 47
Kassavou A, Turner A, French DP. Do interventions to promote walking in groups increase physical activity? A meta-analysis. International Journal of Behavioral Nutrition and Physical Activity, 2013;10:18. 48
Richards J, Thorogood M, Hillsdon M, Foster C. Face-to-face interventions for promoting physical activity. Cochrane Database of Systematic Reviews, 2013;9:CD010392.

32
term effects in changing behaviour declining over time. Despite this evidence, UK policy makers and
practitioners appear committed to seeing the promotion of physical activity delivered within primary
care. The challenges for the implementation of any behaviour change service remains who will
deliver this approach, who will be targeted and who will pay?
The strategies or components of an intervention were identified by NICE’s review49. The guideline
aimed to support routine provision of brief advice on physical activity in primary care practice. The
term 'brief advice' used in this guidance was defined to mean verbal advice, discussion, negotiation
or encouragement, with or without written or other support or follow-up. It can vary from basic
advice to a more extended, individually focused discussion. Typically strategies suggested for such an
intervention included:
identifying adults who are inactive
delivering and following up on brief advice
incorporating brief advice in commissioning
systems to support brief advice
information and training to support brief advice.
The challenge of implementation for primary care staff was addressed in the NICE guidance with two
key issues, systems and training. Systems to support brief advice included:
Ensure systems such as Read Codes are being used to identify opportunities to assess
people's physical activity levels and deliver brief advice.
Ensure resources (for example, standard documents and forms) and systems are available to
assess, record and follow up on the provision of brief advice.
Ensure information about local opportunities to be active (including non-sporting activities)
is available and up to date. This could include online maps and route finding for walking or
adapted cycling.
Training needs included to provide information and training for primary care practitioners and
included:
how physical activity promotion fits within their remit and how it can help prevent and
manage a range of health conditions
the definition of physical activity: what constitutes moderate and vigorous physical activity,
and what intensity, duration and frequency of physical activity is needed to achieve the UK
physical activity guidelines
groups more likely to be inactive
misconceptions about who needs to increase their physical activity (based, for example, on
visual cues such as body weight)
how to undertake physical activity assessments
local opportunities for physical activity
the needs of specific groups, such as people with disabilities, including local opportunities
for them to be physically active
delivery of brief advice including, for example, the skills to motivate people to change
49
NICE. Physical activity: brief advice for adults in primary care. Public health guidance 44. NICE: London, 2013.

33
The call for primary care based counselling is aspirational according to the effectiveness evidence
and is, at present, without effective pathways for implementation.
We modelled the impact of brief advice for physical activity being delivered in primary care as
defined by the NICE guidance50, with standardised measurement of physical activity included as a
Quality Outcomes Framework (QOF) outcome. We assumed brief advice would be delivered by 67%
of GP practices, after a meta-analysis of UK surveys of GPs and practice nurses about willingness to
deliver brief advice about physical activity (see Technical Appendix). We estimated the effect size of
the advice using a meta-analysis of studies that included at least six months of follow-up, identified
from the NICE review that supported the guidance51. Full details of the methods can be found in the
Technical Appendix.
We estimated that the intervention would lead to 5,800 (2,800 to 8,800) deaths averted or delayed
in men, and a further 5,800 (2,300 to 9,400) in women up to 2025. The vast majority of these
averted or delayed deaths would be from either CHD or stroke, with a small contribution from
colorectal and breast cancers. The intervention would also have a substantial impact on disability,
particularly from diabetes with around 17,000 years of life lost to disability averted by 2025 (Figure 5
and Table 5).
50
ibid. 51
Campbell F, Blank L, Messina J, Day M, Buckley Woods H, Payne N, Goyder E, Armitage C. Physical activity: brief advice for adults in primary care. ScHARR: Sheffield, 2012.
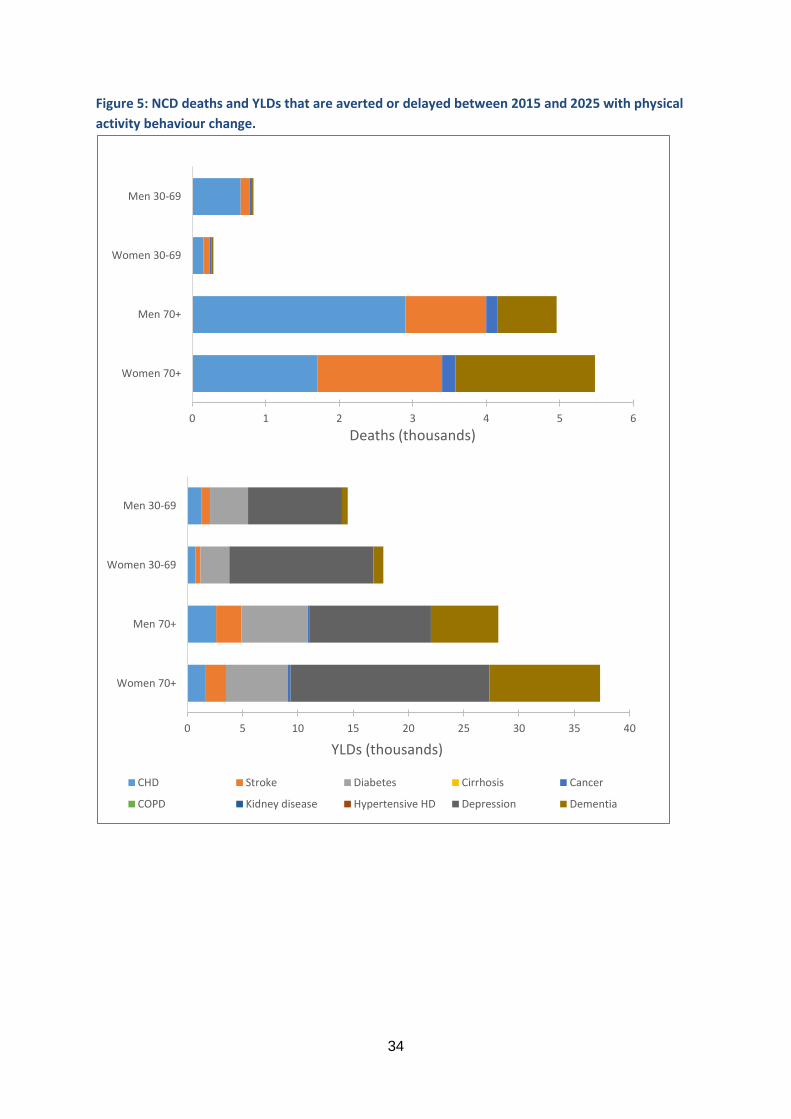
34
Figure 5: NCD deaths and YLDs that are averted or delayed between 2015 and 2025 with physical
activity behaviour change.
0 1 2 3 4 5 6
Women 70+
Men 70+
Women 30-69
Men 30-69
Deaths (thousands)
0 5 10 15 20 25 30 35 40
Women 70+
Men 70+
Women 30-69
Men 30-69
YLDs (thousands)
CHD Stroke Diabetes Cirrhosis Cancer
COPD Kidney disease Hypertensive HD Depression Dementia

35
Table 5: NCD deaths and YLDs that are averted or delayed between 2015 and 2025 with physical activity behaviour change.
Deaths YLDs
Men Women Men Women
CHD 3,500 (1,700 to 5,300) 1,900 (850 to 2,900) 3,900 (2,100 to 5,700) 2,300 (1,300 to 3,400)
Stroke 1,200 (650 to 1,800) 1,800 (820 to 2,700) 3,100 (2,500 to 3,700) 2,400 (1,400 to 3,400)
Diabetes 24 (10 to 38) 18.0 (15 to 21) 9,400 (9,400 to 9,400) 8,300 (8,300 to 8,300)
Cirrhosis - - - -
Mouth cancer - - - -
Oesophagus cancer - - - -
Colorectal cancer 180 (130 to 230) 94 (56 to 130) 160 (120 to 210) 70 (32 to 110)
Liver cancer - - - -
Pancreas cancer - - - -
Larynx cancer - - - -
Lung cancer - - - -
Breast cancer - 110 (55 to 170) - 210 (160 to 270)
Cervix cancer - - - -
Kidney cancer - - - -
Bladder cancer - - - -
Stomach cancer - - - -
COPD - - - -
Kidney disease - - - -
Hypertensive HD - - - -
Depression - - 20,000 (20,000 to 20,000) 31,000 (31,000 to 31,000)
Dementia 830 (290 to 1,400) 1,900 (480 to 3,400) 6,600 (6,100 to 7,100) 11,000 (9,700 to 13,000)
NB. Values are mean and 95% uncertainty intervals, rounded to two significant figures.

36
SMOKING
In the report Smoking Still Kills52, Action on Smoking and Health (ASH) propose a target to reduce
adult smoking prevalence to no more than 5% in all socio-economic groups, by 2035. To support this
goal, the ASH report recommends a series of actions, including the following three intervention
options, shortlisted by the PROMISE study.
Maintain increases of tax on tobacco at above inflation rates
Wilson et al (2012)53 report the findings from a review which included 35 studies involving taxation
and smoking prevalence. They conclude that there is a strong independent effect of price on
smoking prevalence and found evidence, consistent with previous studies, to suggest that younger
people are more price-sensitive than older smokers.
Chaloupka et al (2011)54 report the findings of a review undertaken for the International Agency for
Research on Cancer, which evaluated evidence on the effects of tax and price policies to prevent and
reduce tobacco use. They conclude that there is ‘sufficient’ evidence (author defined) linking the
effectiveness of increased tobacco taxation and prices with reductions in overall tobacco
consumption and in prevalence of tobacco use. The findings support the use of “relatively simple
tobacco excise tax structures …that include regular tax increases that outpace growth in general
price levels and incomes”.
Amos et al (2011)55 undertook a review of evidence on action to reduce socio-economic inequalities
in smoking as part of a wider review of inequalities in health and tobacco control. They included 10
studies (2 reviews and 8 primary studies, sourced until September 2010) relating to the impact of
price on smoking inequalities and conclude that there is strong evidence that increases in price
reduce socioeconomic inequalities in smoking, at least in high income countries. An updated version
of this review56 reports the findings of 27 studies (sourced until January 2013) examining the impact
of tax/price increases on inequalities and broadly confirms the conclusions of the earlier review.
Gilmore et al (2013)57 reviewed a decade (1999-2009) of brand segmentation literature to assess
whether the pricing strategies used by the tobacco industry undermine tobacco tax policy in the UK.
They conclude that by maintaining the price of ultra-low price brands (by not passing on tax
increases in full to the consumer) industry pricing strategies encourage smokers to switch to a
cheaper brand (down trading) and that this may contribute to smoking-related inequalities.
52
ASH. Smoking Still Kills: Protecting children, reducing inequalities. ASH: London, 2015 53
Wilson LM, Avila Tang E, Chander G, Hutton HE, Odelola OA, Elf JL, et al. Impact of Tobacco Control Interventions on Smoking Initiation, Cessation, and Prevalence: A Systematic Review. Journal of Environmental and Public Health, 2012;961724. 54
Chaloupka FJ, Straif K, Leon ME. Effectiveness of tax and price policies in tobacco control. Tobacco Control, 2011;20:235-238. 55
Amos A, Bauld L, Clifford D, Fidler J, Hill S, Hiscock R, et al. Tobacco Control, Inequalities in Health and Action at a Local Level. Public Health Research Consortium: York, 2011. 56
Brown T, Platt S, Amos A. Equity impact of population-level interventions and policies to reduce smoking in adults: a systematic review. Drug and Alcohol Dependence, 2014;138:7-16. 57
Gilmore AB, Tavakoly B, Taylor G, Reed H. Understanding tobacco industry pricing strategy and whether it undermines tobacco tax policy: the example of the UK cigarette market. Addiction, 2013;108:1317-1326.

37
ASH58 recommends the following actions as part of an overall strategy to reduce the affordability of
tobacco:
• Increase the tax escalator on tobacco products to 5 per cent above the level of inflation.
• Adjust the current national tax regime to raise the price of the cheapest cigarettes and
prevent down-trading
We modelled the impact of increasing the tax on tobacco products at 5 per cent above the level of
inflation up to 2025. We used estimates of price sensitivity to tobacco products from a study from
the International Agency for Research on Cancer59. We found that the intervention would result in
1,500 (1,300 to 1,700) deaths averted or delayed in men, and a further 950 (860 to 1,100) in women
up to 2025. The main contributors to this reduced mortality were cancers of the lung, oesophagus,
liver, pancreas, bladder and stomach. The intervention would also have a substantial impact on
disability, averting 11,000 (11,000 to 12,000) years of life with disability in men and 14,000 (14,000
to 14,000) in women (NB: small uncertainty ranges are obscured here due to rounding). The main
contributor to reduce disability is COPD, responsible for over half of the reduction in disability for
both men and women (Figure 6 and Table 6).
Whilst the results for this intervention are more modest than those for other interventions modelled
here, it is worthwhile remembering that the size of the proposed intervention is very small. The BAU
scenario, which provides the projected health outcomes against the intervention scenarios are
compared, assumes that tax on cigarettes will be increased at a rate of 2% per year above inflation
as that has been an approximation of UK Government policy since 200960. Therefore, in our analyses
the intervention only accounts for an extra 3% increase in tax per annum, which has a modest
impact on the overall price of cigarettes over this time.
58
ASH. Smoking Still Kills: Protecting children, reducing inequalities. ASH: London, 2015. 59
International Agency for Research on Cancer. Effectiveness of Tax and Price Policies for Tobacco Control. International Agency for Research on Cancer: Lyon, 2011. 60
ASH. ASH analysis of tobacco tax increases in the United Kingdom. http://www.ash.org.uk/files/documents/ASH_976.pdf (Accessed on 8 December 2015).

38
Figure 6: NCD deaths and YLDs that are averted or delayed between 2015 and 2025 with an
increase in tobacco tax.
0.0 0.2 0.4 0.6 0.8 1.0 1.2
Women 70+
Men 70+
Women 30-69
Men 30-69
Deaths (thousands) Thousands
0 1 2 3 4 5 6 7 8
Women 70+
Men 70+
Women 30-69
Men 30-69
YLDs (thousands) Thousands
CHD Stroke Diabetes Cirrhosis Cancer
COPD Kidney disease Hypertensive HD Depression Dementia

39
Table 6: NCD deaths and YLDs that are averted or delayed between 2015 and 2025 with an increase in tobacco tax.
Deaths YLDs
Men Women Men Women
CHD 270 (250 to 290) 49 (-1.5 to 100) 760 (730 to 780) 700 (650 to 750)
Stroke 130 (120 to 140) 68 (7.0 to 130) 740 (730 to 750) 460 (390 to 520)
Diabetes -10 (-25 to 4.5) -18 (-37 to 0.5) 870 (860 to 890) 650 (630 to 670)
Cirrhosis - - - -
Mouth cancer - - - -
Oesophagus cancer 35 (32 to 39) 9.0 (5.5 to 13) 0 (-3.5 to 3.5) 0 (-3.5 to 3.5)
Colorectal cancer - - - -
Liver cancer 24 (10 to 38) 14 (4.5 to 24) 2.0 (-12 to 16) 0 (-10 to 10)
Pancreas cancer 45 (40 to 50) 38 (33 to 44) 0 (-5.0 to 5.0) 0 (-5.5 to 5.5)
Larynx cancer 6.0 (-5.5 to 18) 0 (0 to 0) 0 (-12 to 12) 0 (0 to 0)
Lung cancer 770 (520 to 1,000) 620 (400 to 850) 130 (-120 to 380) 160 (-67 to 380)
Breast cancer - - - -
Cervix cancer - 18 (15 to 21) - 18 (15 to 21)
Kidney cancer 10 (9.0 to 11) 0 (-3.0 to 3.0) 2.0 (1.0 to 3.0) 0 (-3.0 to 3.0)
Bladder cancer 42 (37 to 47) 16 (8.0 to 24) 50 (45 to 55) 18 (10 to 26)
Stomach cancer 20 (20 to 21) 6.0 (5.5 to 07) 0 (-0.5 to 0.5) 0 (-0.5 to 0.5)
COPD 120 (120 to 120) 110 (89 to 130) 3,200 (3,200 to 3,200) 4,400 (4,400 to 4,400)
Kidney disease - - - -
Hypertensive HD - - - -
Depression - - 5,200 (5,200 to 5,200) 6,800 (6,800 to 6,800)
Dementia 15 (-12 to 42) 21 (-23 to 65) 370 (340 to 400) 570 (530 to 610)
NB. Values are mean and 95% uncertainty intervals, rounded to two significant figures.

40
Tackling illicit trade in cigarettes
Silvano et al (2014)61 report on their study to estimate the size of the illicit trading of cigarettes in
Europe. They found an overall proportion of illicit cigarettes of 6.5%, with wide variations across
countries, with higher proportions particularly in countries geographically close to known major
suppliers of illicit cigarettes. They suggest that defining a measure of illicit trade of cigarettes is
complex, transparent public data are limited and conclude that, contrary to arguments made by the
tobacco industry that tax/price increases fuel illicit trade practices, the supply of illicit tobacco is a
key issue.
Joossens et al (2009)62 report on the scale of global illicit tobacco trade and find that “Higher income
countries, where cigarettes are more expensive, have lower levels of cigarette smuggling than lower
income countries. Other factors, including the presence of informal distribution networks, organized
crime, industry participation, and corruption, probably contribute more to cigarette smuggling than
price levels.”
Joossens et al (2008)63 report on how controlling the supply chain has been an effective mechanism
to reduce illicit cigarette trade. They suggest that a combination of better detection, increased
punishment, more enforcers and government scrutiny of tobacco companies contributed to a fall in
smuggling activity in the UK.
ASH (2015)64 suggests that although illicit trade in cigarettes has fallen in the UK over time, existing
targets to tackle illicit trade are weak and need strengthening. The report recommends the following
actions:
• Fully implement the WHO Illicit Trade Protocol including an international tracking and
tracing regime for tobacco products.
• Strengthen and resource national, regional and local partnerships to enable co-ordinated
action on illicit trade.
• Set new targets for the control of tobacco smuggling:
- Reduce the illicit market share for cigarettes to no more than 5% by 2020
- Reduce the illicit market share for hand-rolled tobacco to no more than 22% by 2020
and no more than 11% by 2025.
61
Silvano G, Lugo A, La Vecchia C, Boffetta P, Chaloupka F, Colombo P, et al. Pricing Policies And Control of Tobacco in Europe (PPACTE) project: cross-national comparison of smoking prevalence in 18 European countries. Eur J Cancer Prev, 2014;23(3):177-185. 62
Joossens L, Merriman D, Ross H, Raw M. How eliminating the global illicit cigarette trade would increase tax revenue and save lives. International Union Against Tuberculosis and Lung Disease: Paris, 2009. 63
Joossens L, Raw M. Progress in combating cigarette smuggling: controlling the supply chain Tobacco Control, 2008;17:399–404. 64
ASH. Smoking Still Kills: Protecting children, reducing inequalities. ASH: London, 2015.

41
Increased support for smoking cessation services, particularly in hard to reach groups
The Smoking Still Kills report65 includes the following recommendation in relation to smoking
cessation services:
• Ensure that good quality evidence-based Stop Smoking Services are accessible to all
smokers, particularly those from lower socio-economic groups and disadvantaged
populations.
NICE (2013)66 issued public health guidance for smoking cessation services and recommend that
action should be taken to ensure the local NHS Stop Smoking Service aims to treat minority ethnic
and disadvantaged groups at least in proportion to their representation in the local population of
tobacco users.
Bauld et al (2010)67 report the findings of a systematic review which included 20 studies (sourced
from 1990-2007) which explored the effectiveness of NHS smoking cessation services. They conclude
that although NHS stop smoking services help smokers to quit, these services seem to have less
impact on smoking rates in some groups of smokers, including younger people, women, pregnant
women and more deprived smokers. Bauld et al highlight the lack of evidence available to enable
appropriate sub-group analyses.
Twyman et al (2014)68 carried out a systematic review into the barriers faced by smokers categorised
as ‘vulnerable’. The review examined 65 studies and concluded that “Barriers common to all
vulnerable groups included: smoking for stress management, lack of support from health and other
service providers, and the high prevalence and acceptability of smoking in vulnerable communities.
Unique barriers were identified for people with a mental illness (e.g. maintenance of mental health),
Indigenous groups (e.g. cultural and historical norms), prisoners (e.g. living conditions), people who
are homeless (e.g. competing priorities) and at-risk youth (e.g. high accessibility of tobacco).”
Stanton and Grimshaw (2013)69 report on an updated Cochrane review looking at tobacco cessation
interventions for young people. They included 28 RCTs and concluded that although some
interventions showed promise, there is a need for further research to be undertaken in order to
understand how most effectively to help young smokers to quit.
Chamberlain et al (2013)70 report on an update of a Cochrane review which looked at data of 86
trials of psycho-social interventions designed to help pregnant women to stop smoking. They found
65
ibid 66
NICE. School-based interventions to prevent the uptake of smoking among children and young people Evidence Update 2013. NICE: London, 2013. 67
Bauld L, Bell K, McCulloch L, Richardson L, Greaves L. The effectiveness of NHS smoking cessation services: a systematic review. Journal of Public Health, 2010;32(1):71-82. 68
Twyman L, Bonevski B, Paul C, Bryant J. Perceived barriers to smoking cessation in selected vulnerable groups: a systematic review of the qualitative and quantitative literature. BMJ Open, 2014;4: e006414. 69
Stanton A, Grimshaw G. Tobacco cessation interventions for young people. Cochrane Database of Systematic Reviews, 2013;8:CD003289. 70
Chamberlain C, O'Mara-Eves A, Oliver S, Caird JR, Perlen SM, Eades SJ, et al. Psychosocial interventions for supporting women to stop smoking in pregnancy. Cochrane Database of Systematic Reviews, 2013;10:CD001055.

42
that these interventions were effective and suggest that providing incentives may be a helpful
strategy.
Van der Meer et al (2013)71 report the findings of a Cochrane review into smoking cessation
interventions for smokers with current or a history of depression. They found that adding ‘mood
management’ to standard smoking cessation increases long-term cessation rates in smokers with
past or current depression. They also suggest that an anti-depressant medication (Bupropion) is
helpful for smokers with a history of depression but not for those with current depression. The
authors point to the lack of available evidence regarding the use of other types of anti-depression
medication and, more generally, for smoking cessation services for people who have depression or
have previously suffered from depression. NICE finds that there is insufficient available evidence to
understand how to offer smoking cessation services to people in institutional settings with mental
illnesses72.
NICE public health guidance 10 reports evidence that suggests that only a small number of prisoners
access smoking cessation services despite a higher proportion wanting help to stop smoking, and
that smoking cessation services can help prisoners to stop smoking, although differences in rates of
success vary between institutions73.
ALCOHOL CONSUMPTION
Regulation to raise the price of high strength cheap alcohol
Martineau et al (2013)74 report the findings of a review of systematic reviews of population-based
interventions designed to reduce alcohol consumption and alcohol-related harm. This review of 52
reviews (sourced from 2002-2012) included 3 medium quality (author defined) reviews on taxation
and concluded that there is consistent evidence that increasing alcohol price or taxation reduces
overall consumption and related harm. The authors suggest that such policies present practical and
political implementation difficulties.
In their systematic review of 112 studies looking at the relationship between alcohol tax or price
levels and alcohol sales or self-reported drinking, Wagenaar et al (2009)75 report a strong inverse
relationship between price and consumption, that is, as alcohol prices increase alcohol consumption
correspondingly falls. The authors report that “the meta-analyses reported here demonstrate the
statistically overwhelming evidence of effects of alcohol prices on drinking. Price affects drinking of
all types of beverages, and across the population of drinkers from light drinkers to heavy drinkers.
We know of no other preventive intervention to reduce drinking that has the numbers of studies and
consistency of effects seen in the literature on alcohol taxes and prices.”
71
Van der Meer RM, Willemsen MC, Smit F, Cuijpers P. Smoking cessation interventions for smokers with current or past depression. Cochrane Database of Systematic Reviews, 2013;8:CD006102. 72
NICE. School-based interventions to prevent the uptake of smoking among children and young people Evidence Update 2013. NICE: London, 2013. 73
NICE. Stop smoking services. Public health guidance 10. NICE: London, 2008. 74
Martineau F, Tyner E, Lorenc T, Petticrew M, Lock K. Population-level interventions to reduce alcohol-related harm: an overview of systematic reviews. Preventive Medicine, 2013;57:278-296. 75
Wagenaar A, Salois M, Komro K. Effects of beverage alcohol price and tax levels on drinking: a meta-analysis of 1003 estimates from 112 studies. Addiction, 2009;104:179–190.

43
Booth et al (2008)76 conclude that there is consistent evidence to suggest an association between
increases in taxation or pricing of alcohol and reductions in alcohol-related harm in their report for
the Policy Research Programme of the Department of Health.
In 2010, the National Institute for Health and Care Excellence (NICE) produced public health
guidance on alcohol which recommended policies which reduced the affordability of alcohol77. One
mechanism to achieve this goal would be to introduce minimum unit pricing, where alcohol is priced
according to its alcohol content, making products with high alcohol content more expensive. The
NICE guidance included the following recommendations:
• Consider introducing a minimum price per unit. Set the level by taking into account the
health and social costs of alcohol-related harm and its impact on alcohol consumption.
• Consider initiating a review of the excise duty regime with fellow EU member states. The
aim would be to obtain a pan-EU agreement on harmonisation which links alcohol duty to
the strength of each product. Regularly review the minimum price per unit to ensure
alcohol does not become more affordable over time.
• Regularly review alcohol duties to make sure alcohol does not become more affordable
over time
In 2013, the University of Stirling published a report by an independent group of experts calling for
concerted action to reduce the harm caused by excessive alcohol consumption78. A key policy call in
the report was to re-iterate the need to reduce the affordability of alcohol in order to reduce alcohol
consumption and its associated harms.
Stockwell and Thomas (2013)79 report findings from the Canadian experience of the introduction of
minimum unit pricing. They support findings from previous research and conclude that significant
health and social benefits would be gained from the introduction of minimum unit pricing in the UK.
They also suggest that their results would have a differentially important impact on the heaviest
drinkers compared with those with more moderate intakes of alcohol.
In 2012, the Scottish Parliament passed legislation to introduce a minimum retail price for alcohol to
increase the price of cheap, strong alcohol to reduce alcohol-related harm. This law is still waiting
enactment following opposition from the European Commission, suggesting that Martineau et al
(2013)80 were correct in their assertion about the complexities of implementation of policies
influencing alcohol pricing.
76
Booth A, Meier P, Stockwell T, Sutton A, Wilkinson A, Wong R, et al. Independent review of the effects of alcohol pricing and promotion. ScHARR, University of Sheffield: Sheffield, 2008. 77
NICE. Alcohol-use disorders: Prevention (PH24). NICE: London, 2010. 78
Anderson W (ed). Health First: an evidence-based alcohol strategy for the UK. University of Stirling: Stirling, 2013. 79
Stockwell T, Thomas G. Is alcohol too cheap in the UK? The case for setting a Minimum Unit Price for alcohol. Institute of Alcohol Studies: London, 2013. 80
Martineau F, Tyner E, Lorenc T, Petticrew M, Lock K. Population-level interventions to reduce alcohol-related harm: an overview of systematic reviews. Preventive Medicine, 2013;57:278-296.

44
Strengthen local authority control over licensing powers
The University of Stirling (2013)81 report sets out clear recommendations to assist with restricting
the availability of alcohol to reduce alcohol-related harm and to tackle alcohol-related anti-social
behaviour. The report recommends that:
Public health should be a core objective and statutory obligation of licensing throughout
the UK.
Licensing legislation should be comprehensively reviewed. Licensing authorities must be
empowered to tackle alcohol-related harm by controlling the total availability of alcohol in
their jurisdiction.
The sale of alcohol in shops should be restricted to specific times of the day and designated
areas.
The law prohibiting the sale of alcohol to people who are already drunk should be actively
enforced.
Local authorities should develop comprehensive alcohol strategies that prioritise public
health and community safety.
Measures to deal with the consequences of drunkenness must be complemented by
measures to reduce the prevalence of drunkenness, including forward planning of the
number, density and opening hours of all licensed premises.
Martineau et al (2013)82 found 8 systematic reviews (assessed as mostly moderate quality) which
addressed the issue of reducing alcohol availability. They present mixed results, with 2 reviews
finding good evidence of effect for limiting hours of sale and 2 other reviews reporting conflicting
results.
The NICE Local Government Briefing on alcohol (2012)83 summarises the evidence-based
recommendations made by NICE (NICE 2010 public health guidance) in relation to licensing and
enforcement. These are:
• Using local health, crime and related trauma data, map the extent of alcohol-related
problems locally before developing or reviewing a licensing policy. If an area has a lot of
licensed premises, and the evidence suggests that additional premises may affect the
licensing objectives, adopt a cumulative impact policy. This can be used to ensure an area
offers a wide range of leisure and cultural-based activities, rather than just providing
alcohol related entertainment.
• Ensure sufficient resources are available to prevent under-age sales (including proxy sales),
sales to those who are intoxicated, non-compliance with any other alcohol licence
condition, irresponsible drinks promotions and illegal imports of alcohol.
• Ensure sanctions are fully applied to businesses that break the law.
81
Anderson W (ed). Health First: an evidence-based alcohol strategy for the UK. University of Stirling: Stirling, 2013. 82
Martineau F, Tyner E, Lorenc T, Petticrew M, Lock K. Population-level interventions to reduce alcohol-related harm: an overview of systematic reviews. Preventive Medicine, 2013;57:278-296. 83
NICE. Alcohol. Public health advice (LGB6). NICE: London, 2012.

45
We could find no review level evidence which evaluated the impact of implementing policies to
strengthen local authority control over licencing powers, although research is underway to evaluate
the use of cumulative impact policies on alcohol-related harm in a London Borough.
Further restriction of alcohol marketing
The NICE (2010)84 public health guidance on alcohol also includes recommendations to strengthen
current regulations on alcohol marketing, particularly in relation to children and young people. NICE
reports strong Cochrane review based evidence that alcohol advertising affects children and young
people, is associated with the onset of drinking in young people and increases consumption in those
who already drink alcohol. Recommendations include:
• Ensure children and young people's exposure to alcohol advertising is as low as possible by
considering a review of the current advertising codes. This review would ensure:
- the limits set by the Advertising Standards Authority (ASA) for the proportion of the
audience under age 18 are appropriate where alcohol advertising is permitted.
- there is adequate protection for children and young people.
- all alcohol marketing, particularly when it involves new media (for example, web based
channels and mobile phones) and product placement, is covered by a stringent
regulatory system which includes ongoing monitoring of practice.
• Ofcom, the ASA and the government should keep the current regulatory structure under
review.
• Assess the potential costs and benefits of a complete alcohol advertising ban to protect
children and young people from exposure to alcohol marketing.
The NICE guidance85 also states that there is a small but clear and consistent link between
advertising expenditure and alcohol consumption but limited evidence examining a complete ban on
advertising. The Programme Development Group (PDG) concluded that there should be a cost-
benefit assessment of the impact of an advertising ban and suggested that alcohol-related product
placement should not be encouraged.
Siegfried et al (2014)86 published a Cochrane review which systematically examined the impact of
the restriction or banning of alcohol advertising (via any format) to reduce alcohol consumption in
adults and adolescents. This review included only 4 studies and rated their quality as low in all cases;
the interventions either varied exposure to alcohol (in 1 case), explored the introduction of
partial/total bans on advertising of alcohol in an area (2 studies) or the impact of the removal of an
84
NICE. Alcohol-use disorders: Prevention (PH24). NICE: London, 2010. 85
ibid 86
Siegfried N, Pienaar DC, Ataguba JE, Volmink J, Kredo T, Jere M, et al. Restricting or banning alcohol advertising to reduce alcohol consumption in adults and adolescents. Cochrane Database of Systematic Reviews, 2014;11:CD010704.

46
advertising ban. The authors conclude that the existing evidence base does not show a clear effect
either for or against alcohol advertising restrictions or bans. Siegfried et al (2014) call for further
research to be undertaken to strengthen the evidence base in this area.
We modelled the impact of a total ban of advertising of alcohol products in England, using evidence
on effectiveness from an econometric study by Saffer and Dave87. As the quality of evidence is low in
this area, the results are accompanied with a large degree of uncertainty. Also, the intervention
being modelled represents a large departure from the current situation, so the impact of such an
intervention is likely to be large.
We estimated that implementing a ban on alcohol marketing in England would result in 44,000
(2,900 to 85,000) deaths averted or delayed in men, and 34,000 (-43,000 to 110,000) deaths averted
and delayed in women up to 2025 (Figure 7 and Table 7). These delayed or averted deaths would
mostly be from liver cirrhosis, oesophagus cancer, and cardiovascular diseases (although the results
around cardiovascular disease are extremely uncertain). The intervention would also have a
substantial impact on disability from NCDs, with potentially large reductions in disability from CHD
and stroke in both men and women (albeit with large uncertainty).
87
Saffer H, Dave D. Alcohol consumption and alcohol advertising bans. Applied Economics, 2002;34:1325-1334.

47
Figure 7: NCD deaths and YLDs that are averted or delayed between 2015 and 2025 with alcohol
marketing restrictions.
NB. The increase in diabetes YLDs in women is due to a small increased risk of diabetes with falls in alcohol
consumption88
.
88
Shield K, Parry C, Rehm J. Chronic diseases and conditions related to alcohol use. Alcohol Research: Current Reviews, 2013;35(2):155-173.
0 5 10 15 20 25 30 35
Women 70+
Men 70+
Women 30-69
Men 30-69
Deaths (thousands)
-20 -10 0 10 20 30 40 50
Women 70+
Men 70+
Women 30-69
Men 30-69
YLDs (thousands)
CHD Stroke Diabetes Cirrhosis Cancer
COPD Kidney disease Hypertensive HD Depression Dementia

48
Table 7: NCD deaths and YLDs that are averted or delayed between 2015 and 2025 with alcohol marketing restrictions.
Deaths YLDs
Men Women Men Women
CHD 7,500 (-5,100 to 20,000) 17,000 (-42,000 to 76,000) 15,000 (2,400 to 28,000) 21,000 (-38,000 to 79,000)
Stroke 7,900 (1,700 to 14,000) 6,900 (-2,400 to 16,000) 22,000 (16,000 to 28,000) 11,000 (1,800 to 20,000)
Diabetes -3.0 (-17 to 11) -23 (-31 to -16) 14,000 (14,000 to 14,000) -15,000 (-15,000 to -15,000)
Cirrhosis 12,000 (3,000 to 22,000) 6,500 (940 to 12,000) 6,100 (-3,300 to 16,000) 3,200 (-2,400 to 8,800)
Mouth cancer 4,300 (910 to 7,700) 1,000 (200 to 1,800) 2,700 (-670 to 6,100) 720 (-100 to 1,500)
Oesophagus cancer 8,000 (2,000 to 14,000) 1,500 (320 to 2,700) 1,500 (-4,600 to 7,500) 310 (-900 to 1,500)
Colorectal cancer 2,100 (260 to 4,000) 720 (50 to 1,400) 1,900 (22 to 3,700) 620 (-50 to 1,300)
Liver cancer 1,800 (97 to 3,500) 560 (23.0 to 1,100) 530 (-1,200 to 2,200) 140 (-400 to 670)
Pancreas cancer - - - -
Larynx cancer - - - -
Lung cancer - - - -
Breast cancer - -14 (-25 to -3.5) - -11 (-22 to -0.5)
Cervix cancer - - - -
Kidney cancer - - - -
Bladder cancer - - - -
Stomach cancer - - - -
COPD - - - -
Kidney disease - - - -
Hypertensive HD - - - -
Depression - - - -
Dementia - - - -
NB. Values are mean and 95% uncertainty intervals, rounded to two significant figures.

49
CONCLUSIONS
The UK has made huge strides at reducing the burden of NCDs, with particularly large reductions in
the burden of cardiovascular disease89. If we continue on this path then we will go a long way to
achieving the WHO target of reducing premature mortality from NCDs by 25% by 2025 and this will
involve maintaining current public health effort. However, the modelling conducted for this report
shows that we will not achieve this goal without increasing current public health effort by tackling
the prevalence of risk factors for NCD including poor diet, physical inactivity, smoking and alcohol
consumption. Our results suggest that achieving the 25 by 25 targets for obesity and diabetes will
have a much bigger impact on NCD outcomes than targets for salt consumption, blood pressure,
smoking, alcohol consumption and physical activity, but this is primarily due to the ambitious nature
of these targets which will require us to halt increases in the prevalence of both obesity and
diabetes. In comparison, the other risk factor targets are much less ambitious, requiring a
proportional reduction in risk factor prevalence rates that are already falling. Our results
demonstrate that reducing all risk factors can contribute to reducing disease burden – not just from
deaths, but increasingly from disability from chronic conditions, including depression and dementia.
The policy review demonstrates the range of potential policy options available to policy makers and
stakeholders to address NCD risk factors. But it also shows the relative paucity of evidence for
prevention-based interventions (particularly those interventions aimed at populations rather than
individuals). Our review of policy options, across the four risk factors, uncovers three key challenges
threatening further progress, which operate independently at present:
(i) Developing and maintaining evidence and advocacy for reductions in the four risk factors.
(ii) Identifying workable solutions.
(iii) Encouraging policy makers to support and implement solutions.
There is need for smarter research not only to generate and develop the evidence base for each risk
factor and evaluate policy interventions, but also to build a new evidence base around
implementation. We found inverse relationships between the strength of evidence and population
reach across all the risk factors. The prevention evidence base is still mostly defined with
individualised rather than population-based interventions: this starts with the difficulty of defining
population-based health interventions and is reflected in the 12 interventions included in the
PROMISE study shortlist. We also highlight the almost complete dearth of evidence on how to
implement workable solutions in everyday policy and practice.
Our modelling results for potential interventions across the four risk factor domains show how even
relatively modest population-level interventions (e.g. small increases in tobacco taxation) can result
in large health impacts if they can be effectively implemented across the whole population. Such
modelling results are useful but they only consider one side of the cost-effectiveness equation:
namely, ‘how much impact will this intervention have?’, but not ‘how much will this intervention
cost?’. Hence they cannot address whether the interventions would be good value for money. The
public health guidance produced by NICE often (but not always) includes estimates of cost-
effectiveness of interventions, but results are not directly comparable across risk factor domains.
89
Townsend N, Bhatnagar P, Wilkins E, Wickramasinghe K, Rayner M. Cardiovascular disease statistics 2015. British Heart Foundation: London, 2015. https://www.bhf.org.uk/publications/statistics/cvd-stats-2015

50
Previous studies have considered the cost-effectiveness of public health interventions using
comparable methods across risk factors in Australia90 and the US91, and these studies show that
many population-level interventions to address risk factors are cost-saving due to the reduced
burden on health sector costs associated with lower disease incidence. Such comparable results are
needed in the UK, alongside well-conducted evaluations of prevention-based policy interventions, to
push the debate about disease prevention forward. Ideally, such economic analyses and evaluations
would be conducted at the local authority level where much of the responsibility for addressing
public health now lies. Even when public health measures are delivered at a national level, local level
results are needed to assess impact on inequalities and provide information about the impact on
budgets controlled at a local level.
Whilst better conducted research can improve the evidence base and refine prioritisation of public
health interventions, we cannot allow a call for further research to halt action which is needed now.
This report has demonstrated the potential impact that focussed prevention-based population-level
interventions can have in the UK. It has reviewed the available evidence about implementation of 12
such interventions across multiple risk factor domains. It now lies with policy makers to implement
(and evaluate) interventions to reduce the vast disease burden associated with poor diet, physical
inactivity, smoking and alcohol consumption.
90
Carter R, Moodie M, Markwick A, Magnus A, Vos T, Swinburn B, et al. Assessing cost-effectiveness in obesity (ACE-Obesity): an overview of the ACE approach, economic methods and cost results. BMC Public Health, 2009;9:419. 91
Gortmaker S, Long M, Resch S, Ward Z, Cradock A, Barrett J, et al. Cost-effectiveness of Childhood Obesity Interventions: Evidence and Methods for CHOICES. American Journal of Preventive Medicine, 2015;49(1):102–111.

51
ABBREVIATIONS
ASH Action on Smoking and Health
BAU Business As Usual
BHF British Heart Foundation
COPD Chronic Obstructive Pulmonary Disease
CHD Coronary Heart Disease
CVD Cardiovascular Disease
DALY Disability Adjusted Life Year
IPTFA Industrially Produced Trans Fatty Acids
NCD Non-Communicable Disease
PIF Population Impact Fraction
RCT Randomised Controlled Trial
WHO World Health Organization
YLD Years of Life lived with Disability
DEFINITIONS
25 by 25 targets A set of targets set by the WHO for improvements in obesity, diabetes, raised
blood pressure, tobacco use, salt intake, physical inactivity and harmful use
of alcohol, with the aim of achieving a 25% reduction in premature mortality
by the year 2025.
Business as usual The baseline projections for the modelling study, where it is assumed that
current trends in risk factors, NCD incidence and NCD mortality will continue
up to 2025 under the assumption that current efforts to prevent and treat
NCDs will continue as usual.
Disability Adjusted Life Year In this project, DALYs are a summary measure of the years of life
lived by a population, adjusted for time spent with disability The loss of
health is estimated using YLD estimates from the Global Burden of Disease
project.
Intervention A policy initiative or public health project designed to reduce poor diet,
physical inactivity, smoking or alcohol consumption.
Population impact fraction A measure of the proportion of a disease that would be reduced or
increased in a given risk factor scenario.
Premature mortality Death from any condition before the age of 70.