transitions towards a f4 society - low-carbon...
TRANSCRIPT
Jean-Charles Hourcade, Renaud Crassous, Olivier Sassi, Frederic Ghersi, Sandrine Mathy, Vincent Gitz, Henri Weitzman
Transitions towards a F4 societyA three year modelling program supported by IDDRI
A specific institutional setting
• IDDRI: a Research Foundation funded by French Ministries (foreignaffairs, finance, environment, research, equipment) and 15 enterprises
• EPE: Enterprises for the Environment; a consortium of 22 energyintensive entreprises including the cement,steel and non ferrousindustry
• Energy enterprises including EDF (Electricité de France) and Total (oil company)
• The CIRED (Cnrs, Ehess, Enpc, Engref, Meteo – France, Cirad)
• The LEPII (Cnrs and University of Grenoble)

A program based on a shared dissatisfaction betweenmodellers and industry
• A F4 objective cannot be reached without technologicalbreakthrough and deep changes in final demand
• This breakthrough will not been achieved unless industry sees the F4 objective as a mobilizing utopia instead of a pure constraint
• To help policy discussions the current state of the art in long termmodelling has to be improved in the following directions:– The consistency of the dialogue between macro-economists and
sector-based expertize– To scrutinize the transformation of the final demand– Transition mechanisms ‘instead of steady state economies’
– Macroeconomic parameters in a world economy under structural disequilibrium
– Sensitivity to controversial judgments
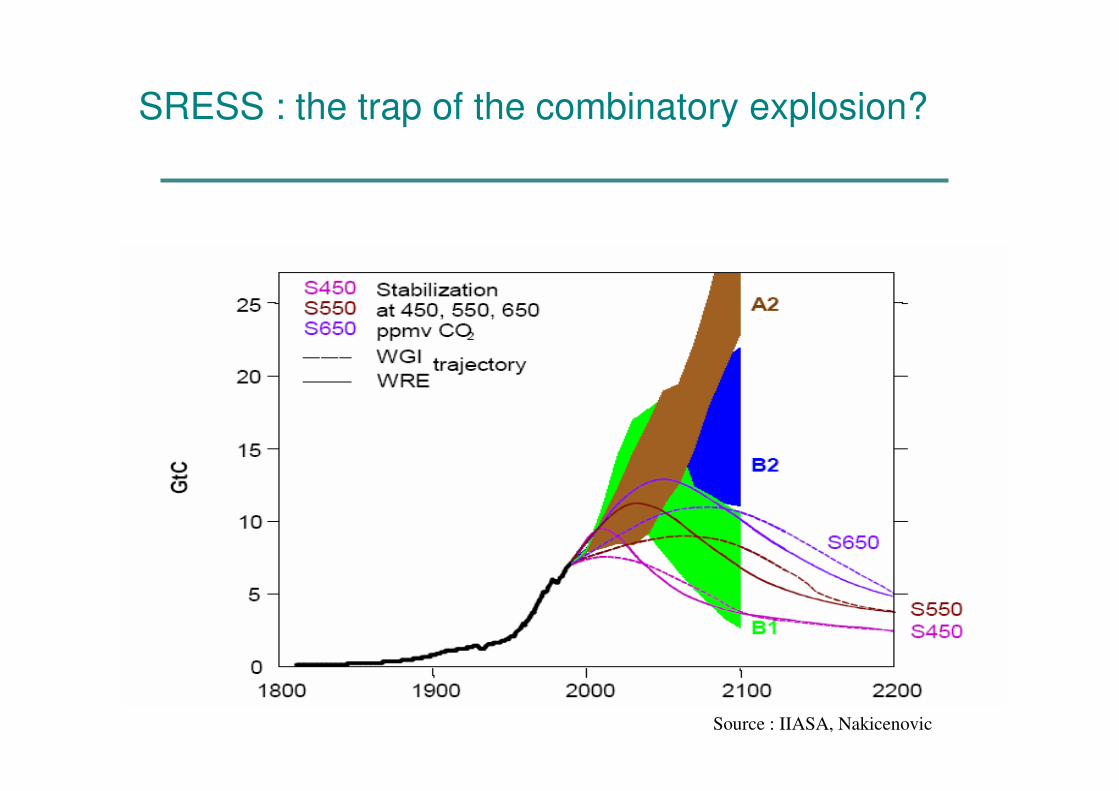
SRESS : the trap of the combinatory explosion?
Source : IIASA, Nakicenovic

Parameters of the KAYA entity are in fact linked by
endogenous interplays
CSM – Paris – 24 mars 2005
2
2
CO
CO
EGDP EnergyE POP
POP GDP Energy= ⋅ ⋅ ⋅

Two Main Policy Questions
• For minimizing the costs a F4 objective what is the relative role of:
– The decarbonisation of energy supply (fuel switching and minimisation on the conversion losses
– The end – use energy efficiency– Structural changes in final demand of goods and services
(dematerialisation of growth patterns)
– Macroeconomic parameters in opened economies
• What ‘climate regime’ is capable to incite
– Industry to provide responses to the first three challenges (technologies, products)
– Goverments to provide the most favorable macroeconomic context andto mobilize –non carbon price only - policies
A scientific strategy with four components ….
• An ‘novel’ modelling framework (Imaclim – Poles)
• A representation of alternative development styles
• A specific scenario approach
• A heuristic approach with a permanent dialogue with industry and other stakeholders

… and relying on two pre-existing models
Consommations
Technologies
Géographie humaine
Prospective énergétique
Modèle POLES (LEPII-EPE)
• Horizon 2050
• Monde en 38 zones
• 24 productions d’électricité
• 11 usages finaux de l’énergie
• Marchés mondiaux endogènes
• 6 gaz à effet de serre
• Etalement urbain
• Evolution des modes de travail
et de loisir
• Inerties des infrastructures
• Choix modaux
Matrice Input Output
Revenus
Investissement
Emploi
Fiscalité
Marchés internationaux
Prospective macroéconomique
Modèle IMACLIM(CIRED)
effet d’éviction, spillovers,progrès technique induit
propagation dessignaux prix
Réformes écofiscales,double dividende ?
Mise en cohérencequantités/prix
Calibrage desfonctions
comportementales(demandes de biens
et de facteurs)
EPE - 6 décembre 2004
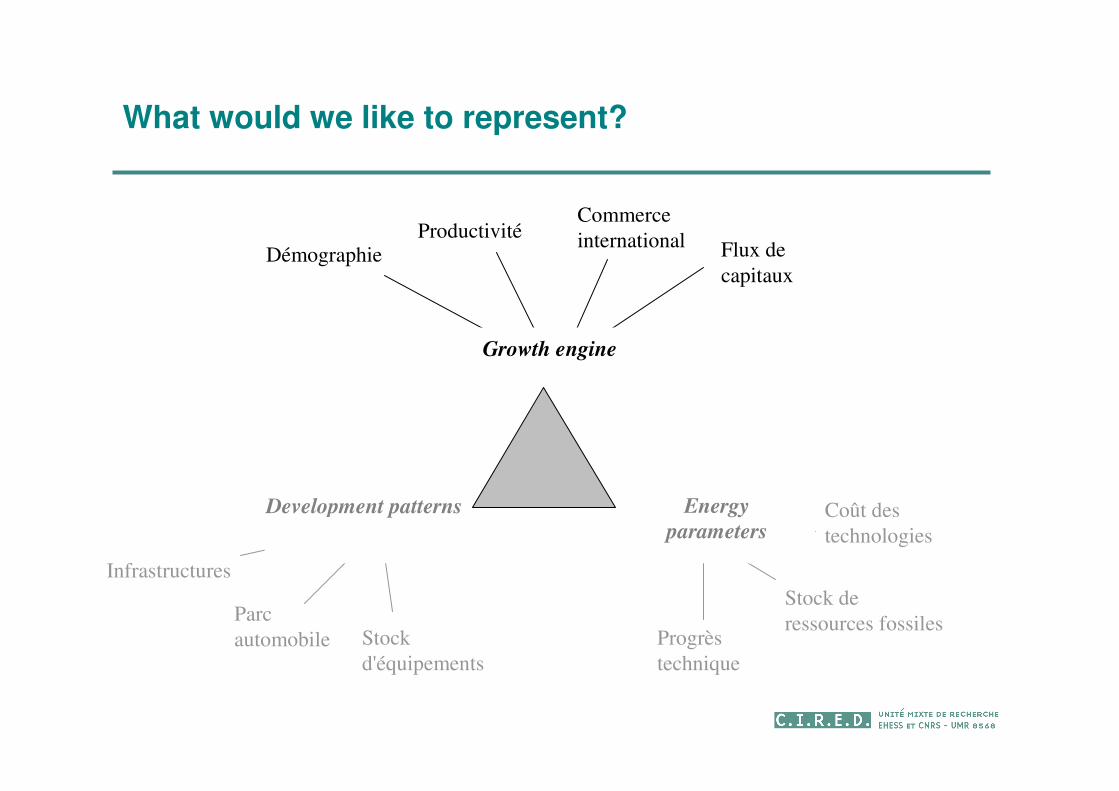
What would we like to represent?
Démographie
ProductivitéCommerce
international Flux de
capitaux
Coût des
technologies
Stock de
ressources fossilesProgrès
technique
Stock
d'équipements
Parc
automobile
Infrastructures
Development patterns Energy
parameters
Growth engine

Main modelling principles
• An hybrid modelling structure in physical and money flows in order to secure the dialogue with sector - based expertise andmake explicit– the assumptions governing the dematerialisation of the economy
– The sources of technical inertia
• A growth engine with disequilibrium:– With imperfect foresight and routine behaviours
– Allowing for structural imbalances (endebtedness, unemploymentand informal economy) and endogenous shocks
� An endogenous growth framework to minimize the trap of thecombinatory explosion

A risky departure from the Golden Age growth paradigm?
• The Solow’s advices (1988):
– a) economic cycles are not optimal responses to random shocks around an optimal pathway
– b) progress in growth theory requires to better capture the evolution of the structure of final demand
• Computational capacity now exists of overcoming the Harrod-Domar’s knife-edged versus steady growth Solow’s paradigms
• Back to “Kaleckian” dynamics with equipment vintages and flexibilities in a) the “equipment intensity” of growth b) the use of energy, labour and other inputs

A recursive and modular architecture: static equilibria + dynamic relations informed by sector based expertise
Updated parameters (tech. coef., stocks, etc.)
Bottom-up sub models (reduced forms) Marco economic growth engine
Price-signals, rate of return Physical flows
Static Equilibrium t Static equilibrium t+1
Time path
Lan
d-u
se
Ele
ctr
icit
y,
Fo
ssil f
uels
Tra
nsp
ort

Static equilibria under constraints stemming from technicalendowments and routine micro and macro behaviors
Transferts
Charges
Taxes
Prix
Salaires
Demande
finale
Taxes
MénagesFonction d'utilité sous contraintes
Secteurs de productionSous contrainte de court-
terme (capacité+technique)
Administrations Publiques
Redistribution & Infrastructures
Exportations
Importations
Marchés mondiaux
Biens et flux de capitaux
Transports : budget-temps
et capacités (infra+équipements)
Énergie : induction des besoins
par les transports et
le logement (stock de m²)
Balance commerciale et
Balance des capitaux
endogènes
Friction sur les
facteurs de production :
Sous- ou sur- capacités
Chômage

Suming up : Main features of the system
– Production functions conditional upon sector – basedexpertise
– (Partially) Endogenous Structural Change: induced interactions between demand and supply that affect the growth engine
– Endogenous Capital flows function of savings, returns on investment and country-risk and national public policies (amountof domestic savings put in an international pool)
– Representation of phases of over and under investment in production capacities; the timing of policies matter
EPE - 6 décembre 2004

An illustration with the transportation sector
Sous double contrainte :
Maximization d'utilité :
( ) ( ) ( ) ,,
k,i , k,j ,goods services
, Ck jk i
k k i k j
ij
C S bn S bnξξ
= − −Πk kUr r
( )² ²
, , , , ,
Energies
cars cars m m
k k k i k i k Ei k k Ei k k Ei
i Ei
ptc Income pArmC C pArmC S Sα α⋅ = ⋅ + ⋅ ⋅ + ⋅∑ ∑
( ),
jmeans of transport T 0
k T jpkm
k jTdisp u duτ= ∑ ∫
,, , ,
,
, , , ,
kkk k k
k publick air k cars k nonmotorized
k mobility
k air k public k cars k nonmotorized
pkmpkm pkm pkmS
b b b b
ηηη η η − = + + +
Capacité=f ( infrastructures, équipements )
� Côté consommation finale

Steps of the development of reduced forms (with thecollaboration of industry)
– Energy sector (2005 – 2006)
– Energy intensive industry (2006 – 2007) • Steel
• Cement
• Aluminium
• Glass
• Refining industry
– End-use products including transport andbuildings Infrastructures (2007)
EPE - 6 décembre 2004

Moteurs
de la
croissance
Démographie
(nivaux,flux)
Productivité
générale
Degré
d’extraversion
des économies
Epargne
et flux de
capitaux
EPE-IDDRI – Paris – 7 mars 2006
Marchés
de
l’énergie
Consommation
C
L
Localisation
T
Technologie
Scenarisation principles: articulating threemain sets of ‘visions’

Picturing development patterns
Consumption Patterns
� Buildings, housing equipments� Obsolescence rates� Mobility
Technological patterns
� Economies of scale vs distributedtechnologies� Material efficiency vs renevable� Recycling
Location patterns
� Urban forms
� Sea-side vs continental
EPE-IDDRI – Paris – 7 mars 2006
C
TL

Illustrative results: the induction of mobility through higher
efficiency of cars
Mobilité automobile OCDE
5,00E+12
7,00E+12
9,00E+12
1,10E+13
1,30E+13
1,50E+13
1,70E+13
1,90E+13
2,10E+13
2,30E+13
pkmauto BAU OCDE pkmauto 450ppm OCDE pkmauto 550ppm OCDE
EPE – 19 Mai 2005

0
2
4
6
8
10
12
400 600 800 1000 1200 1400 1600 1800
Carbon budget 2000-2100 (GtC)
An
nu
al ta
x in
cre
me
nt
fro
m 2
00
5 t
o 2
10
0
Carbon tax only Combined: Carbon tax + transportation infrastructure policy
Infrastructure policy lightens the required tax burden.
450 ppm 550 ppm

Energy burden for households - Hydro and Nuclear policies
0,0%
2,0%
4,0%
6,0%
8,0%
10,0%
12,0%
14,0%
1990 2000 2010 2020 2030 2040 2050 2060
BAU CHN BAU IND
Nuke & Hydro policies CHN Nuke & Hydro policies IND

GDP variations - Hydro and Nuclear policies
-3,0%
-2,0%
-1,0%
0,0%
1,0%
2,0%
3,0%
4,0%
2000 2010 2020 2030 2040 2050 2060
CHN IND w/o policies on apital flows
CHN IND with policies on apital flows