transitions to employment and marriage among ... - · pdf file4 middle east youth initiative...
TRANSCRIPT
NUMBER 12OCTOBER 2010
TH
E M
IDD
LE E
AST
YO
UT
H I
NIT
IATI
VE
WO
RK
ING
PA
PE
R
RAGUI ASSAADCHRISTINE BINZELMAY GADALLAH
Transitions to Employment andMarriage among Young Menin Egypt


Transitions to Employment and Marriage among Young Menin EgyptRAGUI ASSAAD
CHRISTINE BINZEL
MAY GADALLAH
MIDDLE EAST YOUTH INITIATIVE WORKING PAPER
WOLFENSOHN CENTER FOR DEVELOPMENT DUBAI SCHOOL OF GOVERNMENT

MIDDLE EAST YOUTH INITIATIVE WORKING PAPER | TRANSITIONS TO EMPLOYMENT AND MARRIAGE AMONG YOUNG MEN IN EGYPT 4
Ragui Assaad is professor of planning and public affairs at the Hubert H. Humphrey Institute of Public Affairs at the University of Minnesota and a nonresident senior fellow at the Wolfensohn Center for Development at the Brookings Institution. Assaad is editor of The Egyptian Labor Market in an Era of Reform (American University in Cairo Press, 2002) and The Egyptian Labor Market Revisited (American University in Cairo Press, 2009). Assaad is co-author of “Youth Exclusion in Egypt: In Search of ‘Second Chances’” (Middle East Youth Initiative Working Paper No. 2, 2007) and “Rising Expectations and Diminishing Opportunities for Egypt’s Young” in (Brookings Institution Press, 2009).
Christine Binzel is a doctoral candidate at Humboldt University of Berlin and scholarship holder at the German Institute for Economic Research (DIW Berlin). Her research interests are applied microeconomics, development
and others.
May Gadallah is an assistant professor in statistics at the School of Economics and Political Science, Cairo University, Egypt. She received her Ph.D. in biostatistics from the School of Public Health, University of California, Los Angeles. She also worked as a postdoctoral scholar at the School of Public Health at UCLA. She has participated in several labor market studies in Egypt and has written papers on both labor markets and epidemiology.
School of Government and the Wolfensohn Center for Development at the Brookings Institution. They would also like to thank Sung Soo Lim and Ali Rashed for their able research assistance and the Population Council for its support during all phases of this research.
This working paper is an electronic version of an article published as “Transitions to Employment and Marriage among Young Men in Egypt,” Middle East Development Journal, Vol. 2, No. 1, (2010) 39–88. DOI: 10.1142/
ABOUT THE AUTHORS

MIDDLE EAST YOUTH INITIATIVE WORKING PAPER | TRANSITIONS TO EMPLOYMENT AND MARRIAGE AMONG YOUNG MEN IN EGYPT 5
CONTENTS
Abstract ................................................................................................................................................ 8
1. Introduction .................................................................................................................................... 9
2. Literature Review ............................................................................................................................. 10
3. Conceptual Framework ................................................................................................................. 12
4. Data and Methodology .................................................................................................................. 14
4.1 Analyzing Transition Durations in the Presence of Discrete-Time Data ........................ 14
4.2 Measuring Job Quality ................................................................................................... 15
5. The Transition from School to Work .............................................................................................. 16
5.1 The Duration to First Employment ................................................................................ 16
5.2 The Type and Quality of the First Job .............................................................................. 22
5.3 Transition to a Second Job ............................................................................................. 27
6. Transitions to Marriage ................................................................................................................. 33
6.1 Recent Trends in the Timing of Marriage in Egypt ........................................................ 34
6.2 The Determinants of the Duration to First Marriage in Egypt ....................................... 36
6.3 Simulating the Effect of Labor Market Experience on the Hazard of Marriage ........................................................................................................ 41
7. Conclusions ..................................................................................................................................... 44

MIDDLE EAST YOUTH INITIATIVE WORKING PAPER | TRANSITIONS TO EMPLOYMENT AND MARRIAGE AMONG YOUNG MEN IN EGYPT 6
LIST OF TABLES
Table 1: Time to First Job by Birth Cohort (25th, 50th and 75th percentiles), Men 15-34 with
Table 2: Time to First Job for Those who Already Obtained such Jobs by Type of First Job (25th, 50th and 75th
Table 3: Time to First Job by Educational Attainment Cohort (25th, 50th and 75th percentiles),
Table 4: Time to First Job by Region of Birth (25th, 50th and 75th percentiles), Men 15-34 with
Table 5: Discrete-Time Proportional Hazard Model for Hazard of First Job with Non-Parametric Time Dependence and a Gamma Mixture Distribution for Unobserved Individual Heterogeneity, Men 15-34 with Secondary Schooling and Higher, Egypt, 2006
Table 6: Sector of Employment, Formality, and Job Quality in First Job, Row Percentages, Men 15-34 with Secondary Education and Higher
Table 7: Marginal Effects from Ordered Probit Regression on Job Quality in First Job and Probit Regressions on the Probability of Formal and Public Employment in the First Job, Men 15-34 with Secondary Education and Higher Who Have Obtained a First Job
Table 8: Average and Standard Deviation of Time to First Job by Type and Quality of First Job
Table 9: Marginal Effect of Time to First Job and Time to First Job Squared on Job Quality and Probability of Formal and Public Jobs
Table 10: Time to Second Job for Those who Obtained First Job by Selected Characteristics (25th, 50th and 75th
Table 11: Discrete-Time Proportional Hazard Model for Hazard of Second Job with Non-Parametric Time Dependence and a Gamma Mixture Distribution for Unobserved Individual Heterogeneity, Men 15-34 with Secondary Schooling and Higher who have Obtained a First Job, Egypt, 2006
Table 12: Transition Matrix for Quality of First and Second Jobs (Row Percentages)
Table 13: Summary Statistics of Explanatory Variables, Men 18-40 with Secondary School Education or Higher
Table 14: Discrete-Time Proportional Hazard Model for Hazard of First Marriage with Non-Parametric Time Dependence and a Gamma Mixture Distribution for Unobserved Individual Heterogeneity, Men 18-39 with Secondary Schooling, Egypt, 2006
........................................................................................................
...........................
..............................................................................
.........................................................................................................
............................................
.........................................................................................
..............................................
....................
............................................................................................................
...........................
..............................................................................................................................................
..................................
........................................................................................................................................
..............................................................
16
17
18
18
21
23
25
26
27
28
30
32
35
39

MIDDLE EAST YOUTH INITIATIVE WORKING PAPER | TRANSITIONS TO EMPLOYMENT AND MARRIAGE AMONG YOUNG MEN IN EGYPT 7
LIST OF FIGURES
Figure 1: Distribution of New Entrants with Secondary Education and Higher, by Type of First Job and Year of Entry into First Employment (percent) (Four-year Moving Average)
Figure 2a: The Hazard of Getting a First Job by Year Since Leaving School for the Reference Individual
Figure 2b: The Cumulative Probability of Getting a First Job by Year Since Leaving School for the Reference Individual
Figure 3a: The Hazard of Getting a Second Job by Year Since Entering First Job for the Reference Individual
Figure 3b: The Cumulative Probability of Getting a Second Job by Year Since Entering First Job for the Reference Individual
Figure 4: Median Age at First Marriage by Year of Birth and Sex (Four-year Moving Average)
Figure 5: Kaplan-Meier Survival Function for Distribution of Age at First Marriage for Men, by Cohort of Birth
Figure 6a: The Hazard of First Marriage by Age and Cohort of Birth
Figure 6b: The Cumulative Probability of Getting Married by Age and Cohort of Birth
Figure 7a: The Hazard of First Marriage by Age and Timing of First Job
Figure 7b: The Cumulative Probability of Getting Married by Age and Timing of First Job
Figure 8a: The Hazard of First Marriage by Age, Timing of First Job, and Timing of First Good Job
Figure 8b: The Cumulative Probability of Getting Married by Age, Timing of First Job, and Timing of First Good Job
Figure 9a: The Hazard of First Marriage by Age and Age of Return from Migration, if Any
Figure 9b: The Cumulative Probability of Getting Married by Age and Age of Return from Migration, if Any
.........................
........................................................................................................................................................
...........................................................................................................................
......................................................................................................................................
.....................................................................................................................
...................
..........................................................................................................................................
...........................................................
..............................
.....................................................
........................
.........................................................................................................................................................
...............................................................................................................................
.......................
............................................................................................................................................
17
20
20
29
29
33
34
37
37
42
42
42
42
42
42

MIDDLE EAST YOUTH INITIATIVE WORKING PAPER | TRANSITIONS TO EMPLOYMENT AND MARRIAGE AMONG YOUNG MEN IN EGYPT 8
TRANSITIONS TO EMPLOYMENT AND MARRIAGE AMONG YOUNG MEN IN EGYPT
We examine in this paper the transition from school to work and the transition to marriage among young men with at least a secondary education in Egypt, with
the second. In examining the transition from school to work, we analyze the determinants of the duration of
employment. We then move to an examination of the
examining the transition to marriage, we investigate the
for cohort of birth, education, family background and community-level variables.
has fallen over time primarily because of the reduced availability of formal employment, especially public employment, making it less worthwhile for young men
ABSTRACTHaving access to work in a family enterprise reduces
work as does the need to be the main breadwinner of the family. While education beyond the secondary level
because it is negatively associated with the quality of
into marriage. However, if delayed entry (due to search)
be a worthwhile strategy, from the point of view of curbing the delay in marriage, for an individual to spend

MIDDLE EAST YOUTH INITIATIVE WORKING PAPER | TRANSITIONS TO EMPLOYMENT AND MARRIAGE AMONG YOUNG MEN IN EGYPT 9
The transition of young people to adulthood in much of the Middle East has become, by most accounts, an increasingly protracted and anxious process in recent years for both the young people themselves and their families. The period between completing school,
accumulating the necessary resources for marriage has not only lengthened, but is also increasingly accompanied by uncertainty, anxiety and frustration, as well-established patterns of employment and family formation are gradually disrupted. Some have dubbed this prolonged period of anxious waiting for the different elements of life that mark a completed transition to adulthood to come together as “wait adulthood” or “waithood” for short (Dhillon and Yousef 2007, Singerman 2007). As education levels
of living within marriage also rise at the same time
to be declining relatively quickly in the context of a more competitive and informalized labor market. In this paper, we examine two important transitions in the life of young men, namely, the transition from school to work and the transition to marriage, with particular
Although the “waithood” phenomenon affects both young men and young women in Egypt, we focus on young men in this paper for several reasons. According to prevailing social norms in Egypt, it is young men who are expected to be the primary breadwinners after marriage and it is they and their families who assume the bulk of the cost of marriage.1 Young women’s transition to marriage, the main marker of adulthood in Egypt, has also been prolonged in recent years, but this is often because they must wait for their prospective spouse to become “ready” for marriage by obtaining
resources to acquire housing and the other necessities of setting up a new household. With respect to the transition from school to work, only about a third of young women ever make the transition to employment
1. INTRODUCTION before marriage, unless they happen to get one of the
(see Assaad and El-Hamidi 2009). Thus in the case of young men, it is fairly safe to assume that the direction
timing of marriage, but that is highly unlikely to be the case for young women.
We further restrict our attention in this paper to males with at least an upper secondary education since it is only for that group that the sequencing of the transition
than from early entry into work followed by dropout from school. Males with less than secondary education often interrupt their schooling in order to go to work, putting into question the exogeneity of schooling level to the decision to go to work. However, the
above hold terminal degrees for whom the decision to continue schooling is typically not an option. Among secondary school graduates, fewer than three percent have a general secondary degree that gives them the option to continue onto university. The rest have
degrees, which are for the most part terminal degrees in Egypt.2 Similarly, two-year post-secondary degrees and university degrees in Egypt are mainly terminal degrees. It should also be noted that with the increasing educational attainment in Egypt, those with secondary
labor market entrants. According to the Egypt Labor Market Panel Survey of 2006 (ELMPS 06), our main source of data, these graduates constitute over 70
ten years previous to the survey.
The remainder of this paper is divided into six sections. Section 2 provides a review of the literature on the transition from school to work and the links between employment experience and marriage. Section 3 provides the conceptual framework we use to derive testable hypotheses on both sets of transitions. Section 4 presents the data sources and econometric
on the transition from school to work, including the
MIDDLE EAST YOUTH INITIATIVE WORKING PAPER | TRANSITIONS TO EMPLOYMENT AND MARRIAGE AMONG YOUNG MEN IN EGYPT 10
to marriage and Section 7 concludes.
2. LITERATURE REVIEWAlthough they represent two essential aspects of the transition to adulthood, the literatures on the transition from school to work and on the transition to marriage have developed relatively independently. This paper and the recent paper on Iran by Egel and Salehi-
framework. Accordingly, we begin by reviewing the literature on the school-to-work transition, then move
draw on both to develop hypotheses relating to both the transition to employment and marriage.
The transition from school to work has received a great deal of attention in recent years because of its link to the quality and quantity of the labor force and to the quality
2001). In a review of the international literature on the topic, Bradley and Nguyen (2004) classify existing studies according to type of data used, available covariates, and methods of data analysis. They note that most studies of the school-to-work transition analyze cross-sectional data (Andrews and Bradley 1997, Andrews, Bradley and Stott 2002), with some using pooled cross-section time-series data (Lenton 2003, Betts et al. 2000, Lassibille et al. 2001). Few studies use longitudinal data.
The most important covariates included in the analysis are personal characteristics, mainly education and school-related variables, as well as skills training. These variables are important determinants of the duration of the transition and are also relevant for examining the mismatch between the level and type of education and the type and work obtained (Andrews et al. 2002 and Lassibille et al. 2001). Family background has been used in the literature as well, measured by parental education, occupation, family income, and
family structure and size (Bradley and Nguyen 2004). Finally, local labor market conditions are also included in these studies, in particular the local unemployment rate (ibid.).
The models used in modeling the transition from school to work include logit, multinomial logit (Lenton 2003), ordered logit or probit (Lassibille et al. 2001 and Dustman et al. 1998), and Cox proportional hazard models. In order to study the link between search
study used a system of simultaneous equations estimated by maximum likelihood methods (Bratberg and Nilson 1998). Singer and Willett (1993) called for the use of discrete-time survival models instead of either categorical variable or continuous time duration models to take into account the time-dependent nature of the transition and the fact that duration data are often only observed in discrete units of one year or in calendar years that group together a range of durations. Nguyen and Taylor (2003) and Verdu et al. (2008) heed this advice and use discrete-time hazard models to analyze school-to-work transition data. The latter paper uses the STATA module developed by Jenkins (2005) that we use in this paper.
Although there are a number of studies that examine the education-employment match, few studies discuss the
and a duration of at least 6 months.
The literature on the transition from school to work in Egypt documents well the high unemployment rates and long unemployment durations experienced by secondary school and university graduates as they
and Wahba 2005, Assaad 2008, Amer 2009, and Assaad and Mohie 2008). It is now well established that the
new entrants with at least a secondary education. After a sharp increase in youth unemployment from 1988 to 1998, there was a decline from 1998 to 2006, but

MIDDLE EAST YOUTH INITIATIVE WORKING PAPER | TRANSITIONS TO EMPLOYMENT AND MARRIAGE AMONG YOUNG MEN IN EGYPT 11
the decline did not extend to university graduates, especially those living in urban areas. In line with the decline in youth unemployment rates, the duration of transition from school to work has actually declined for young men in Egypt from 1998 to 2006. El-Hamidi and Wahba (2005) and Assaad (2008) speculate that it is because the prospects for public sector employment have declined and those of getting formal private sector work are still low, making it less worthwhile to delay entry into employment in order to search for formal employment. Young men are increasingly taking
upgrade their employment at a later date.
The literature on the economic determinants of the transition to marriage for young men is not voluminous. On the theoretical side, Keeley (1977) develops a model that incorporates search costs into Becker’s (1973, 1974) theory of marriage. Becker (1973, 1974) uses
marriage, such as love and child care, and to explain spouses’ specialization in market or domestic work depending on their relative wages. Costs associated with searching for a spouse, for instance, are neglected. In contrast, according to Keeley’s (1977) theory, an individual enters the marriage market only if his/her
expected costs. With regard to men’s and women’s employment status, Keeley’s (1977) model predicts that “higher-wage men and lower-wage women have greater gains from marriage and thus tend to enter the marriage market earlier” (ibid.) provided that men earn more than women. Using data from the 1967 Survey
empirical evidence in support of his theoretical model. Bergstrom and Schoeni (1996) develop a theoretical model of the marriage market that predicts a positive
for men. They use the 1980 United States census and regress family income and annual earnings on the age at marriage (not vice versa!). They restrict their analysis to men aged 40 and above who are currently married
theoretical model but also show a negative correlation
for those in the sample who married after age 30. Similarly, Danziger and Neuman’s (1999) estimation results support Keeley’s (1977) hypothesis. However,
(1993) hypothesis that in traditional societies, men’s age at marriage with their wage rate. Bergstrom and Bagnoli (1993) argue that it takes time until a man can show his ability to earn a high wage. Hence, men
marriage in order to marry a more desirable woman. Consequently, more desirable women will marry older men. Danziger and Neuman (1999) rely on data from the 1983 Israeli Census of Population and Housing and run separate regressions for Muslim and Jewish married couples. In addition, they run regressions for the following cases: non-working wife, working wife, wife’s wage exceeding the husband’s wage and vice versa.
or career. One exception is the study by Gutiérrez-
from Ahn and Mira (2001) that unemployment spells (non-employment spells in Ahn and Mira (2001)) and temporary contracts delay men’s timing of marriage
also control for the likely endogeneity of education to the marriage and childbearing decision by running the models separately for each educational category.
full-time continuous work, part-time or temporal work, no work and military duty. De la Rica and Iza (2005),
term contracts. They show that men working under such insecure conditions, or even not working at all, delay
contract. Women’s decision to marry remains, in contrast, unaffected by their contractual status. Finally, Oppenheimer et al. (1997) consider career transition as a process and therefore look at both current career and long-term labor market status as determinants

MIDDLE EAST YOUTH INITIATIVE WORKING PAPER | TRANSITIONS TO EMPLOYMENT AND MARRIAGE AMONG YOUNG MEN IN EGYPT 12
or military service) and work experience during the previous year expressed in categories based on hours worked and earnings. Using data from the National Longitudinal Survey of Youth from 1979 to 1990 and
the career-entry process on men’s age at marriage.
by studies on marriage timing in developing countries although these studies often focus on women’s age at marriage. The study by Anderson et al. (1987) shows, for instance, that the wife’s and husband’s occupations, age and – similar to Oppenheimer et al. (1997) –
marriage in Malaysia. Bates et al. (2007) show that other factors, such as mother’s education, also matter for rural Bangladesh. Of those who (also) analyze men’s marriage decisions, Caltabiano and Castiglioni
sexual intercourse, marriage, and cohabitation given that, in Nepal, cohabitation may be delayed up to several years after marriage. Using data from the 2001 Nepal Demographic and Health Survey (DHS), they do not, however, control for variables related
factors may be less important in their context as men’s average age at marriage has remained relatively stable across cohorts. Furthermore, they limit their estimation to married men and women in order to include variables related to the husband’s or wife’s characteristics. Another study on Nepal, conducted by Ghimire et al. (2006), looks at changes in spouse choice and its association with age at marriage. They estimate hazard models for a pooled sample of men and women, treating spouse choice and arranged marriage as competing risks. Employment status, however, is not taken into consideration.
To sum up, there are still relatively few studies linking the labor market and the marriage market. Historically, most economic studies on marriage timing covered industrialized societies, especially the United States and more recently Europe. However, with the role of marriage and the forms of family formation changing,
these studies have become more interested in related topics, such as cohabitation versus marriage and the timing of births and less on the age at marriage itself (e.g., Kreyenfeld 2000). Put differently, the role of marriage as a marker of adulthood has declined in Western societies, as have social and economic constraints on the marriage decision. With regard to marriage timing in developing countries, attention has primarily been paid to the determinants of women’s delay in marriage. This corresponds to the general trend in most developing regions as described earlier,
time and a relatively unchanged pattern for male age
is to build a better understanding of the determinants of men’s timing of marriage, and in particular the role of their employment status, in a developing country
06 allows us to study the impact of young men’s labor
Egypt.
3. CONCEPTUAL FRAMEWORK
If we adopt a search framework for both the transition
of testable hypotheses about the determinants of these transitions. The length of the transition in either case will depend on the expectation one forms about the kind
young men form certain expectations about what sort of
family background, and the labor market conditions prevailing at the time they are undertaking their search. They also weigh the cost of searching, which is essentially the income they forego by not working while they search, and their ability to afford this cost, which depends on their families’ ability to support them while they search.
A search framework can also be applied to duration to

MIDDLE EAST YOUTH INITIATIVE WORKING PAPER | TRANSITIONS TO EMPLOYMENT AND MARRIAGE AMONG YOUNG MEN IN EGYPT 13
men and their families form expectations about what kind of spouse they wish to marry based on their preferences for child quality versus quantity, their social class, their level of education, etc. Their ability
their economic eligibility for marriage, which includes
have and their level of earnings, as well as, of course, their social eligibility as described by education and social class. In the case of marriage, the cost of search is more psychological and social, including the inability to have one’s own family and have socially sanctioned sexual relations.
Using these insights, we start by deriving testable
employment. As we show in the empirical analysis
We therefore hypothesize that a higher expectation of
This hypothesized negative relationship between own
implies an implicit assumption that education raises
curtailment of public sector employment without a commensurate increase in formal private sector employment, younger cohorts of new entrants are likely to spend less time searching for these increasingly
than their older counterparts, everything else being equal. Similarly, individuals living in regions in which
metropolitan or rural regions, will spend less time in
local unemployment rate should lengthen it.
The effect of family background on the duration to
as measured by parental education, can act to raise a
obtain and thus lengthen search duration, but it can also
and connections, thus shortening transition time. However, correcting for his education, the nature of the father’s employment can have somewhat predictable effects. A self-employed father or one who owns his own business will likely employ his son, thus providing a smooth transition into the labor market. A father who is not working because of disability or age will often mean that a young man must support his family, leading to a high opportunity cost of searching and a quick transition to employment.
Egypt rarely end in involuntary layoff or dismissal. Thus we would expect that individuals who get formal
those who get informal ones. Older cohorts who had a better chance of getting formal employment than younger ones may therefore be less likely to move. However, it is not clear what the cohort effect would
it is not clear a priori what the impact of own education or family social background would be on the hazard of
Applying the search framework to the marriage market, we can derive the following hypotheses. The impact of a young man’s education on the timing of marriage is likely to be ambiguous. On the one hand, education potentially raises his earnings and could thus speed up his entry into marriage. However, as Bergstrom and Bagnoli (1993) suggest in the case of traditional societies, it may take a while for men to demonstrate
in their career path may postpone marriage in order to marry a more desirable woman. This essentially means that education could raise men’s expectations
to search longer. However, correcting for education,

MIDDLE EAST YOUTH INITIATIVE WORKING PAPER | TRANSITIONS TO EMPLOYMENT AND MARRIAGE AMONG YOUNG MEN IN EGYPT 14
Social class, as proxied by parent’s education, is likely to have the same ambiguous effect on the timing of
it affects both the expectations about spouse quality and the ability to obtain such a spouse.
4. DATA & METHODOLOGY
We rely on data from the Egypt Labor Market Panel Survey of 2006 (ERF 2006). The survey was administered to a nationally representative sample of 8,349 households of which 3,684 were among the original 4,816 households interviewed in the Egypt Labor Market Survey of 1998 (ELMS 98). An additional 2,167 new households emerged from these 3,684 households as a result of splits, and a refresher sample of 2,498 households was added in 2006. The full sample in 2006 includes 37,140 individuals. In the analysis of the school to work transition, we restrict the analysis to men aged 15 to 34 and our working sample consists of 3,110 individuals, each of whom is observed over a number of spells. In the analysis of transition to marriage, we consider all men 18 to 40, of which there are 3,995 in the ELMPS 06 sample.
The data from ELMPS 06 provide retrospective information about the employment history of each
Although we do not have earnings at each point in an individual’s career, we have enough information on
sector of ownership, occupation, economic activity,
accuracy, as described below. The ELMPS 06 also has detailed data on marriage that not only describes an individual’s age at marriage, but also the living
marriage including who bore these costs.3
4.1 ANALYZING TRANSITION DURATIONS IN THE PRESENCE OF DISCRETE-TIME DATA
A time-to-event analysis is adopted in the paper wherein A time-to-event analysis is adopted in the paper wherein time is a discrete variable measured
is measured from the calendar year of school
The latter constitute censored observations. Those who started work before age 15 while they were still in school were dropped from the study since
inclusion criteria of the analysis either in terms of age or in terms of education level. Young people
studying were included but their time to event was
and the time to event is the duration since obtaining
of the interview if the duration is censored. In the transition to marriage, the duration is measured as
married and his current age if he is still unmarried, with individuals currently 18 to 40 being observed from the age of 14 to 39.
Discrete-time models are more appropriate than continuous time hazard models when the durations are measured as intervals between two calendar years and can thus represent multiple durations in continuous time. We therefore have “grouped” or “banded” duration data that are best dealt with using discrete-time models (Steele 2005, Jenkins 1997). The discrete-time hazard for interval t is the probability of an event occurring during interval t, given that no event has occurred prior to that interval. This requires dividing the time into intervals where the event occurs only once and expanding each individual observation into a number of records equivalent to the number of years until the event occurs or until the year of the survey. A censoring indicator then marks whether or not an event has occurred (Singer and Willet 1993)

MIDDLE EAST YOUTH INITIATIVE WORKING PAPER | TRANSITIONS TO EMPLOYMENT AND MARRIAGE AMONG YOUNG MEN IN EGYPT 15
Let yti be a binary response for every time interval ti
based on the event/censoring time yi, and let be a censoring indicator:
Hence the discrete–time hazard for the interval t is as follows:
The functional form of the hazard can be logistic or
used in this paper, since it is a direct extension of the continuous Cox model (Jenkins 2005). Following Jenkins (2005), we assume a parametric Gamma distribution of the disturbances. This is a common assumption since it is a continuous distribution with
variance which provides a closed form expression for the survival function with frailty (Jenkins 2005). Consequently, the discrete-time hazard function at
variable and is given by:
where Xti is a vector of time-varying and time- invariant covariates with observed characteristics for person i and interval t, is a vector of parameters to be estimated, and is the logarithm of the integral of the baseline
the STATA program pgmhaz8 written by Jenkins to undertake the estimation.
over time is assumed. In our model, we estimate a
where each spell except for the reference is represented by a dummy variable. In the case of the duration to
zero, and in the case of the transition to marriage the reference age is age 32.
4.2 MEASURING JOB QUALITY
Due to the recent interest in the concept of “decent work”
and Rashed (2009) propose a method of measuring
wage workers in Egypt in an attempt to operationalize the International Labor Organization’s “decent work”
on pooled data from the ELMS 98 and ELMPS 06 (with mean zero and units equal to one standard deviation)
measured by the presence of a formal contract, social insurance coverage, paid vacations and paid sick
type of workplace. The index is developed to describe
required to form the index is available.
depends on having earnings information and such information is only available for an individual’s
from current data in 1998 and 2006 and then regress
in the current data and in the retrospective data about
occupation, (2-digit) economic activity, contractual status, social insurance coverage, sector of ownership, and regularity of employment. Separate regressions are estimated for males and females and for wage and nonwage workers. Job quality is then predicted for
the basis of these regressions. The main limitation of such a method is that the predicted index is not able

MIDDLE EAST YOUTH INITIATIVE WORKING PAPER | TRANSITIONS TO EMPLOYMENT AND MARRIAGE AMONG YOUNG MEN IN EGYPT 16
contractual status, or social insurance coverage are
.
5. THE TRANSITION FROM SCHOOLTO WORK
Our analysis of the transition from school to work
and its determinants; (ii) the determinants of the type
5.1 THE DURATION TO FIRST EMPLOYMENT
Contrary to conventional wisdom and popular
entrants in Egypt with at least a secondary education has been falling in recent years. As shown in Table
has dropped from 2.5 years for those born from 1971 to 1975 to 1.7 years for those born from 1986 to 1990. These estimates are based on Kaplan-Meier statistics and therefore take into account that a smaller fraction of the younger cohort has actually entered into employment. Although the decline in time to
under consideration can be detected throughout the distribution, it is more pronounced in the middle of the distribution than at the two ends. Median time has dropped by 34 percent compared to 19 percent at the 25th percentile and 14 percent at the 75th percentile.
As stated in our conceptual framework, the primary explanation for the decline in the duration of the transition from school to work across cohorts is the restructuring of the Egyptian labor market away from public sector employment, which led to a lower probability of such employment for younger cohorts and therefore a lesser incentive to queue for it. As shown in Figure 1, younger
educated new entrants dropped precipitously in the 1980s. While the share of formal private sector employment has increased somewhat, it is not nearly enough to make up for the reduction in public sector employment. As a result, the share of formal wage and salary employment
has dropped from nearly 80 percent for those entering the labor market in the mid-1970s to only 30 percent for those entering in the mid-2000s. With such a reduction
shorter period of time.
and possible queuing that accompanies these formal
of transition can be found among those who ended up
takes to set up one’s own enterprise. It is no surprise that the shortest durations are experienced by unpaid family
Table 1: Time to First Job by Birth Cohort (25th, 50th and 75th percentiles), Men 15-34 with Secondary School Certi!cates or Higher
1971-1975 1.5 2.5 4.4
1976-1980 1.4 2.0 4.4
1981-1985 1.4 1.9 4.4
1986-1990 1.2 1.7 3.8
Cohort Percentile50% 75%25%
Source: ELMPS 06Note: Estimates include all males 15-34 irrespective of whether or not they obtained a !rst job.

MIDDLE EAST YOUTH INITIATIVE WORKING PAPER | TRANSITIONS TO EMPLOYMENT AND MARRIAGE AMONG YOUNG MEN IN EGYPT 17
Some of the observed differences in the bivariate
attainment. As suggested in Section 3 above, individuals with higher levels of education are more likely to seek
positive relationship between educational attainment and duration of transition from school to work. Median durations increase substantially for those with two-
year post-secondary degrees and university degrees. These are precisely the educational levels that are more
conforms to the higher unemployment rates among educated workers, especially post-secondary institute
where unemployment has a positive relationship with education (Egel and Salehi-Isfahani 2010).
Figure 1: Distribution of New Entrants with Secondary Education and Higher, by Type of First Job and Year of Entry into First Employment (percent)
(Four-year Moving Average)
Perc
ent
Table 2: Time to First Job for those who Already Obtained such Jobs by Type of First Job (25th, 50th and 75th percentiles), Men 15-34 with Secondary School Certi!cates or Higher
Public 1.5 2.3 4.2
Private formal wage work 1.6 1.9 4.2
Private regular informal wage work 1.3 1.7 3.4
Private irregular wage work 1.2 1.6 2.7
Unpaid family work 1.2 1.5 1.9
Employer/self -employed 1.4 1.9 3.9
Type of First Job Percentile50% 75%25%
Source: ELMPS 06
Source: ELMPS 06
90
80
70
60
50
Public Sector Work
Formal Private Wage Work
Informal Private Regular Wage Work
Irregular Wage Works
Non-Wage Work
40
30
20
10
01970 1975 1980 1985 1990 1995 2000 2005

MIDDLE EAST YOUTH INITIATIVE WORKING PAPER | TRANSITIONS TO EMPLOYMENT AND MARRIAGE AMONG YOUNG MEN IN EGYPT 18
Since the location of the individual at the time of entry into the labor market can vary with time and is a decision
employment, we use the individual’s region of birth rather than the region of current residence to abstract from migration decisions. In the bivariate associations, the metropolitan regions of Greater Cairo and Alexandrian and the Suez Canal cities have the longest durations of transition, followed by urban Lower Egypt (Table 4). This pattern is consistent with the notion that youth living in regions with a greater probability of formal employment are more likely to search for such employment and
As mentioned in the methodology section above, we
a discrete-time hazard model with non-parametric time dependence. The working sample includes 3,110 young men ages 15 to 34 who completed at least an
upper secondary education. However, since the data for this model is made up of individual spells rather than individuals, the total number of spells observed for these individuals as they transition from school to work is 10,243.
Assuming that a proportional hazard model applies to the underlying continuous time data, the exponentiated
1.5 means that the variable in question raises the hazard of marriage by 50 percent. Incorporating time-varying covariates into the model relaxes the proportionality though (see Rabe-Hesketh and Skrondal 2008).
We estimate four models, with each subsequent model adding additional regressors or interaction terms to the previous model. Model 1, the simplest, includes
own educational attainment, in addition to the spell
Table 3: Time to First Job by Educational Attainment Cohort (25th, 50th and 75th percentiles), Men 15-34 with Secondary School Certi!cates or Higher
General secondary 1.4 1.8 3.7
Technical secondary 3yr 1.4 1.9 4.4
Technical secondary 5yr 1.3 1.9 4.2
Post-secondary 2yr 1.5 2.6 4.6
University and higher 1.5 2.5 4.3
Educational Attainment Percentile50% 75%25%
Source: ELMPS 06
Table 4: Time to First Job by Region of Birth (25th, 50th and 75th percentiles), Men 15-34 with Secondary School Certi!cates or Higher
Greater Cairo 1.5 2.6 4.7
Alexandria & Suez Canal 1.5 2.7 4.7
Upper Lower Egypt 1.5 2.5 4.6
Upper Urban Egypt 1.4 2.0 4.8
Rural Lower Egypt 1.4 1.9 4.0
Rural Upper Egypt 1.3 1.7 3.4
Region of Birth Percentile50% 75%25%
Source: ELMPS 06

MIDDLE EAST YOUTH INITIATIVE WORKING PAPER | TRANSITIONS TO EMPLOYMENT AND MARRIAGE AMONG YOUNG MEN IN EGYPT 19
dummies that describe the shape of the baseline hazard. The reference category for cohorts is the 1971-75 birth cohort and the reference category for own education is a three-year technical secondary degree. Model 2 adds to this basic model parental education, the father’s type of employment when the youth was 15, and the presence of a farm or a non-farm enterprise in the household. Model 3 adds time-varying labor market conditions in the young man’s governorate of birth. These indicators include the local unemployment rate and the ratios of private sector wage workers and public sector workers among all workers in the governorate. The year of the indicator is matched to the calendar year that corresponds to the individual spell under consideration. Finally, Model 4 adds to the previously included regressors dummies indicating the young man’s region of birth.
As shown in Table 5, results from Models 1 through 3 show that more recent cohorts have been transitioning to the labor market more rapidly than their predecessors. With only own education included as a control, young men born in 1981-85 and 1986-90 have a 41 percent and a 104 percent higher hazard of transitioning to
1971 to 1975, the reference category. Once parental education, father’s employment, and the presence of household enterprises are included, as in Model 2, the difference between the 1981-85 and 1971-75 cohort disappears and the difference in hazard between the 1986-90 cohort and the 1971-75 cohort is now smaller. This suggests that the more rapid entry of more recent cohorts may have something to do with the greater incidence of household enterprises in Egypt in recent years leading to opportunities to work as unpaid family workers. The difference between the 1986-90 and 1971-75 cohorts disappears completely when we include the regional dummies in Model 4. Thus, the strong observed differences in the duration of transition
for by differences in the labor market conditions these cohorts faced rather than differences in preferences or
Iran, there is not a strong relationship in Egypt between higher levels of educational attainment and longer
education has been achieved. Though longer durations are observed for post-secondary and university graduates in Model 1, the differences are not statistically
completely when other regressors are included. Thus, any observed bivariate associations between education and speed of entry into employment must be due to differences among workers with different education levels that are captured by the other regressors like parental education and father’s employment, keeping in mind that we are only dealing here with workers who are educated to at least the secondary level. These workers, as a group, have much longer transition times to employment than less educated workers who simply
obtaining them are minimal. It is interesting to note that differences in transition times between secondary school and university graduates in Iran persisted even when parental education was controlled for (Egel and Salehi-Isfahani 2010).
The results relating to the impact of parental education on the duration of transition from school to work are somewhat ambiguous. Having parents with secondary education leads to a slower transition to employment than parents with less than secondary education, but having parents with university education or higher has
4 This U-shaped effect of parental education could be the result of the tradeoff between the additional resources educated parents bring to bear
for formal employment that come with higher social class. Parents with secondary education have similar expectations for formal employment for their sons as parents with university education, but they are less
Iran, a result that they interpret as inconsistent with a higher reservation wage for youth from more privileged backgrounds. In fact, youth from higher social backgrounds could have higher reservation wages, but these higher expectations could be matched by greater

MIDDLE EAST YOUTH INITIATIVE WORKING PAPER | TRANSITIONS TO EMPLOYMENT AND MARRIAGE AMONG YOUNG MEN IN EGYPT 20
The results on father’s type of employment and presence of farm and non-farm enterprises are in the expected direction. Those whose fathers are either self-employed, unpaid workers or not working transition quickly into the labor market compared to those whose fathers are in regular employment either in the government or the private sectors. The transition time is longest for those whose fathers
search are a luxury that only those with regular and
stable household incomes are able to afford. Those in households with more irregular or limited income from labor must enter into work right away to support their households. Having a self-employed father or a household enterprise speeds up the transition by making available a ready source of work for the youth as an unpaid family worker. Our results further indicate that having access to a non-farm enterprise in the household results in a more rapid transition to
Contrary to expectations, the time-varying local labor market conditions included in Model 3 do not have a
employment. Being in a governorate with higher than average unemployment rates somewhat slows the rate
labor market variables have no discernible effect. Adding the regional dummies in Model 4 does not add much additional explanatory power. Only rural Upper Egypt seems to have a higher hazard of transition to
percent level.
The shape of the hazard or the time dependence of the model is described by the spell dummies from year 1 to year 11+, with the latter including all transitions longer than 11 years.5 The reference category is year zero (i.e., a transition to employment in the same year of, or prior to, graduation from school). With the exception of Model 1, which seems to contain
frailty), the shape of the baseline hazard is consistent across models. For simplicity, we only show the baseline hazard and cumulative probability of employment for the reference individual from Model 2. As shown in Figure 2a, the hazard increases sharply
rises again in year 3 and remains at a fairly constant
and remains low. As shown in Figure 2b, by year 2, the reference individual has more than a 50 percent
than a 90 percent probability.
Figure 2aThe Hazard of Getting a First Job
by Year Since Leaving School for the Reference Individual
Figure 2bThe Cumulative Probability of Getting a First Job
by Year Since Leaving School for the Reference Individual

MIDDLE EAST YOUTH INITIATIVE WORKING PAPER | TRANSITIONS TO EMPLOYMENT AND MARRIAGE AMONG YOUNG MEN IN EGYPT 21
Table 5: Discrete-Time Proportional Hazard Model for Hazard of First Job with Non-Parametric Time Dependence and a Gamma Mixture Distribution for Unobserved Individual Heterogeneity, Men 15-34 with Secondary Schooling and Higher, Egypt, 20061
HH has a non-agricultural enterprise 1.226*** 1.226*** 1.241*** (0.057) (0.057) (0.058)
L
R
R
G
T
A
U
F
F
F
M
M
M
I
S
R
U

MIDDLE EAST YOUTH INITIATIVE WORKING PAPER | TRANSITIONS TO EMPLOYMENT AND MARRIAGE AMONG YOUNG MEN IN EGYPT 22
HH has a non-agricultural enterprise 1.226*** 1.226*** 1.241*** (0.057) (0.057) (0.058) Region of Birth (Ref: Greater Cairo) Alexandria & Suez Canal 1.018 (0.082) Urban Lower Egypt 0.957 (0.080) Urban Upper Egypt 0.945 (0.075) Rural Lower Egypt 1.050 (0.081) Rural Upper Egypt 1.220* (0.102) Spell Dummies included included included included Constant 0.060*** 0.053*** 0.054*** 0.057*** (0.007) (0.005) (0.008) (0.011) Gamma variance 1.827* 0.000 0.000 0.000 (0.531) (0.000) (0.001) (0.001) Log-likelihood -5039.37 -4781.69 -4779.00 -4771.27 Number of Individual Spells 10,243 10,243 10,243 10,243 Number of Individuals 3,110 3,110 3,110 3,110 * p<0.05, ** p<0.01, *** p<0.001
Notes:
1. Exponentiated regression coe"cients indicating hazard ratios. Standard errors in parentheses can be used to test the statistical signi!cance of the deviation of the exponentiated coe"cients from 1.
2. Model 1 includes cohort and own education dummies only as regressors in addition to the non-parametric time dependence.
3. Model 2 adds parental education, father’s employment and the presense of farm and non-farm enterprises in the HH to the regressors included in Model 1.
4. Model 3 adds labor market conditions in the governorate of birth to the regressors included in Model 2.
5. Model 4 adds dummies for region of birth to the regressors in Model 3.
6. Time-varying labor market conditions in governorate of birth.
5.2. THE TYPE AND QUALITY OF THE FIRST JOB
As we have seen in Figure 1 above, the chances of
for educated new entrants in Egypt since the mid-1970s as the decreased likelihood of public sector employment has been only partially compensated by the small increase in the likelihood of obtaining formal private employment (Assaad 2008). In this
young men are able to get across cohort, controlling for some of the same covariates we used to explain
different dimensions: (i) public vs. private, (i) formal
above.
quality is more than half a standard deviation above
or less.6
either a formal contract or social insurance coverage. Finally, public includes both the civil service and the public enterprises and private includes all the rest.
The three dimensions are overlapping to some extent, but are not entirely equivalent to each other. There is
sector of employment. As Table 6 shows, 83 percent of

MIDDLE EAST YOUTH INITIATIVE WORKING PAPER | TRANSITIONS TO EMPLOYMENT AND MARRIAGE AMONG YOUNG MEN IN EGYPT 23
nearly equally between the private and public sectors. Job quality is also closely related to formality and sector
these three dimensions, we estimate an ordered probit
for the formal/informal and public/private dimensions. The covariates are similar to the ones we used to
the marginal effects for these models computed for a reference individual who is born between 1971 and 1975, has a technical secondary education, whose
Table 6: Sector of Employment, Formality and Job Quality in First Job, Row Percentages, Men 15-34 with Secondary Education and Higher
Private Public Informal Formal Poor Fair Good
Private 83 17 12 72 15
Public 9 91 0 12 88
Informal 98 2 15 81 4
Formal 47 53 0 17 83
Poor 100 0 100 0
Fair 97 3 92 8
Good 45 55 11 89
All 83 17 70 30 10 62 28
Source: ELMPS 06
parents have less than secondary education, whose father is a government employee, and who lives in Greater Cairo. This reference individual has a 2.4
and a 24 percent probability of getting a public sector
labor market conditions facing young people in Egypt, an individual born between 1981 and 1985 has more
individual born from 1971 to 1975. He also has a 20 percentage point reduction in the probability of getting
a young man is able to get. In particular, a 10 percent
by 3 percentage points, although it has no discernible
Similarly, a 10 percentage point increase in the local

MIDDLE EAST YOUTH INITIATIVE WORKING PAPER | TRANSITIONS TO EMPLOYMENT AND MARRIAGE AMONG YOUNG MEN IN EGYPT 24
unemployment rate is associated with a 4 percentage
This is probably because the greater local availability
As expected, higher levels of own educational attainment are associated with a lower probability of
Similarly, they are associated with a higher probability
percentage points and a university degree increases it by 35 percentage points, almost doubling it, compared to a three-year technical secondary degree. Similarly, a university degree raises the probability of a formal
32 percentage points (from 24 to 56 percent) for the reference individual.
Although the education of one’s father has a positive
for own education, mother’s education does not have
increases by 12 and 17 percentage points for young men whose fathers have a secondary and university and higher degrees, respectively, compared to those whose fathers have less than secondary education. However, the effect of father’s education does not extend to obtaining either formal or public employment. Mother’s education, on the other hand, seems to increase the probability of formal employment.
and parents’ education. Relative to someone whose father is a government employee, a young man whose father is an employer or is self-employed has an 8
and a 10 percentage point lower probability of getting a
whose father is a regular employee outside government.
family worker, there is a 9.5 percent reduction in the
whose father is a public employee. It therefore turns out that the best parental background to have to succeed in the labor market is to have a university educated father who works for the government.
The presence of a farm enterprise in the household has
employment by nearly 14 percentage points and of public employment by over 7 percentage points. The presence
due to the fact that it raises the probability that a young man will be an unpaid family worker in the beginning of his career, an employment state that precludes searching
7
Region of residence has the expected effect on the
lowest chance of both. It is noteworthy, however, that
probability of obtaining public employment.
from school to work. While we cannot address the
two decisions, it is interesting to note whether there is an association between the two. We begin investigating this by looking at the bivariate association between
MIDDLE EAST YOUTH INITIATIVE WORKING PAPER | TRANSITIONS TO EMPLOYMENT AND MARRIAGE AMONG YOUNG MEN IN EGYPT 25
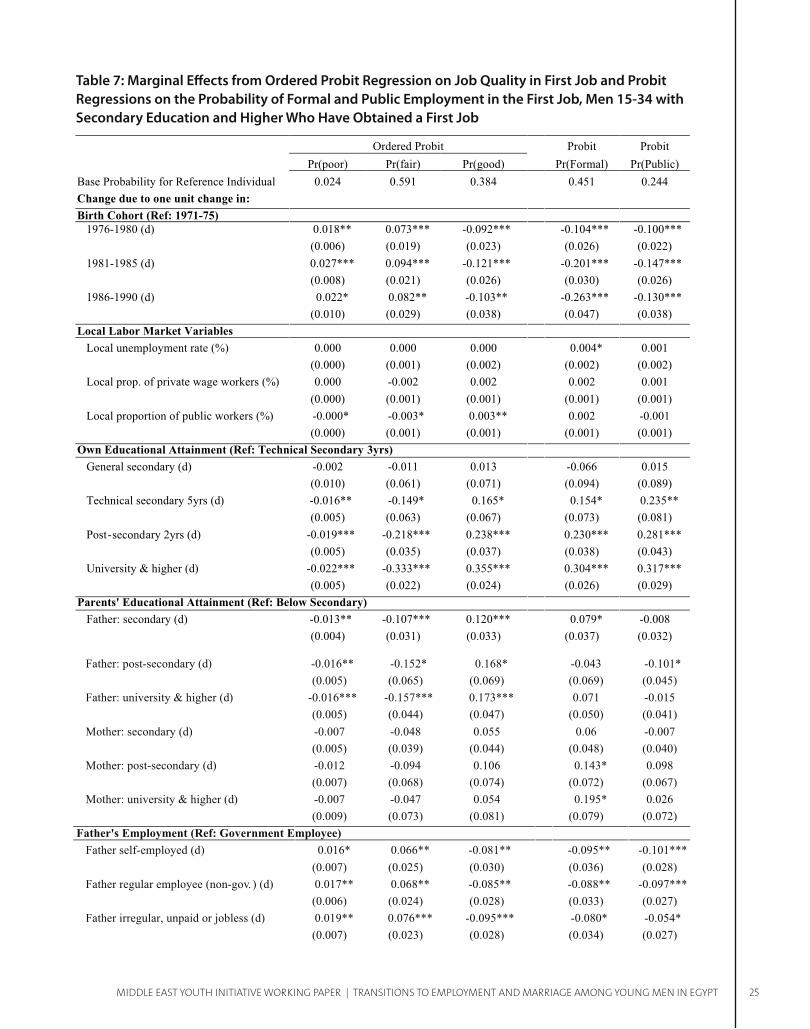
Table 7: Marginal E"ects from Ordered Probit Regression on Job Quality in First Job and Probit Regressions on the Probability of Formal and Public Employment in the First Job, Men 15-34 with Secondary Education and Higher Who Have Obtained a First Job
Ordered Probit Probit Probit Pr(poor) Pr(fair) Pr(good) Pr(Formal) Pr(Public) Base Probability for Reference Individual 0.024 0.591 0.384 0.451 0.244 Change due to one unit change in: Birth Cohort (Ref: 1971-75)
1976-1980 (d) 0.018** 0.073*** -0.092*** -0.104*** -0.100*** (0.006) (0.019) (0.023) (0.026) (0.022) 1981-1985 (d) 0.027*** 0.094*** -0.121*** -0.201*** -0.147*** (0.008) (0.021) (0.026) (0.030) (0.026) 1986-1990 (d) 0.022* 0.082** -0.103** -0.263*** -0.130***
(0.010) (0.029) (0.038) (0.047) (0.038) Local Labor Market Variables
Local unemployment rate (%) 0.000 0.000 0.000 0.004* 0.001 (0.000) (0.001) (0.002) (0.002) (0.002) Local prop. of private wage workers (%) 0.000 -0.002 0.002 0.002 0.001 (0.000) (0.001) (0.001) (0.001) (0.001) Local proportion of public workers (%) -0.000* -0.003* 0.003** 0.002 -0.001
(0.000) (0.001) (0.001) (0.001) (0.001) Own Educational Attainment (Ref: Technical Secondary 3yrs)
General secondary (d) -0.002 -0.011 0.013 -0.066 0.015 (0.010) (0.061) (0.071) (0.094) (0.089) Technical secondary 5yrs (d) -0.016** -0.149* 0.165* 0.154* 0.235** (0.005) (0.063) (0.067) (0.073) (0.081) Post-secondary 2yrs (d) -0.019*** -0.218*** 0.238*** 0.230*** 0.281*** (0.005) (0.035) (0.037) (0.038) (0.043) University & higher (d) -0.022*** -0.333*** 0.355*** 0.304*** 0.317***
(0.005) (0.022) (0.024) (0.026) (0.029) Parents' Educational Attainment (Ref: Below Secondary)
Father: secondary (d) -0.013** -0.107*** 0.120*** 0.079* -0.008 (0.004) (0.031) (0.033) (0.037) (0.032)
Father: post-secondary (d) -0.016** -0.152* 0.168* -0.043 -0.101* (0.005) (0.065) (0.069) (0.069) (0.045) Father: university & higher (d) -0.016*** -0.157*** 0.173*** 0.071 -0.015 (0.005) (0.044) (0.047) (0.050) (0.041) Mother: secondary (d) -0.007 -0.048 0.055 0.06 -0.007 (0.005) (0.039) (0.044) (0.048) (0.040) Mother: post-secondary (d) -0.012 -0.094 0.106 0.143* 0.098 (0.007) (0.068) (0.074) (0.072) (0.067) Mother: university & higher (d) -0.007 -0.047 0.054 0.195* 0.026
(0.009) (0.073) (0.081) (0.079) (0.072) Father's Employment (Ref: Government Employee)
Father self-employed (d) 0.016* 0.066** -0.081** -0.095** -0.101*** (0.007) (0.025) (0.030) (0.036) (0.028) Father regular employee (non-gov. ) (d) 0.017** 0.068** -0.085** -0.088** -0.097*** (0.006) (0.024) (0.028) (0.033) (0.027) Father irregular, unpaid or jobless (d) 0.019** 0.076*** -0.095*** -0.080* -0.054* (0.007) (0.023) (0.028) (0.034) (0.027)
Presence of Household Enterprise HH has farm enterprise (d) -0.004 -0.025 0.029 -0.137*** -0.074** (0.003) (0.023) (0.026) (0.032) (0.027) HH has non-farm enterprise (d) 0.023*** 0.086*** -0.110*** -0.153*** -0.137***
(0.007) (0.016) (0.019) (0.025) (0.022) Region of Residence (Ref: Greater Cairo)
Alexandria & Suez Canal (d) 0.010 0.046 -0.055 -0.051 0.027 (0.007) (0.030) (0.036) (0.042) (0.039) Urban Lower Egypt (d) 0.017* 0.070* -0.087* -0.054 0.047 (0.008) (0.030) (0.036) (0.043) (0.041) Urban Upper Egypt (d) 0.041*** 0.118*** -0.160*** -0.095* 0.029 (0.010) (0.028) (0.034) (0.042) (0.039) Rural Lower Egypt (d) 0.028*** 0.097*** -0.126*** -0.069 0.024 (0.008) (0.027) (0.033) (0.040) (0.037) Rural Upper Egypt (d) 0.104*** 0.152*** -0.255*** -0.153*** -0.015 (0.018) (0.032) (0.033) (0.044) (0.041)
N 2637 2637 2637 Pseudo-R2 0.1832 0.2059 0.1705 Log-Likelihood -1919.793 -1279.105 -1016.363

MIDDLE EAST YOUTH INITIATIVE WORKING PAPER | TRANSITIONS TO EMPLOYMENT AND MARRIAGE AMONG YOUNG MEN IN EGYPT 26
Table 8: Average and Standard Deviation of Time to First Job by Type and Quality of First Job
Poor 1.6 1.5Fair 1.8 1.8Good 2.5 1.9Informal 1.8 1.7Formal 2.6 2.0Private 1.9 1.8Public 2.5 2.0Total 2.0 1.8
Job Quality
Formality
Sector
Mean Std. Dev.Time to First JobType & Quality
of First Job
Father: post-secondary (d) -0.016** -0.152* 0.168* -0.043 -0.101* (0.005) (0.065) (0.069) (0.069) (0.045) Father: university & higher (d) -0.016*** -0.157*** 0.173*** 0.071 -0.015 (0.005) (0.044) (0.047) (0.050) (0.041) Mother: secondary (d) -0.007 -0.048 0.055 0.06 -0.007 (0.005) (0.039) (0.044) (0.048) (0.040) Mother: post-secondary (d) -0.012 -0.094 0.106 0.143* 0.098 (0.007) (0.068) (0.074) (0.072) (0.067) Mother: university & higher (d) -0.007 -0.047 0.054 0.195* 0.026
(0.009) (0.073) (0.081) (0.079) (0.072) Father's Employment (Ref: Government Employee)
Father self-employed (d) 0.016* 0.066** -0.081** -0.095** -0.101*** (0.007) (0.025) (0.030) (0.036) (0.028) Father regular employee (non-gov. ) (d) 0.017** 0.068** -0.085** -0.088** -0.097*** (0.006) (0.024) (0.028) (0.033) (0.027) Father irregular, unpaid or jobless (d) 0.019** 0.076*** -0.095*** -0.080* -0.054* (0.007) (0.023) (0.028) (0.034) (0.027)
Presence of Household Enterprise HH has farm enterprise (d) -0.004 -0.025 0.029 -0.137*** -0.074** (0.003) (0.023) (0.026) (0.032) (0.027) HH has non-farm enterprise (d) 0.023*** 0.086*** -0.110*** -0.153*** -0.137***
(0.007) (0.016) (0.019) (0.025) (0.022) Region of Residence (Ref: Greater Cairo)
Alexandria & Suez Canal (d) 0.010 0.046 -0.055 -0.051 0.027 (0.007) (0.030) (0.036) (0.042) (0.039) Urban Lower Egypt (d) 0.017* 0.070* -0.087* -0.054 0.047 (0.008) (0.030) (0.036) (0.043) (0.041) Urban Upper Egypt (d) 0.041*** 0.118*** -0.160*** -0.095* 0.029 (0.010) (0.028) (0.034) (0.042) (0.039) Rural Lower Egypt (d) 0.028*** 0.097*** -0.126*** -0.069 0.024 (0.008) (0.027) (0.033) (0.040) (0.037) Rural Upper Egypt (d) 0.104*** 0.152*** -0.255*** -0.153*** -0.015 (0.018) (0.032) (0.033) (0.044) (0.041)
N 2637 2637 2637 Pseudo-R2 0.1832 0.2059 0.1705 Log-Likelihood -1919.793 -1279.105 -1016.363
(d) marginal e#ect for discrete change of dummy variable from 0 to 1
* p<0.05, ** p<0.01, *** p<0.001
Note: Marginal e#ects are computed for a reference individual whose dummy variables are set to zero and whose continuous variables are set to their sample mean.
Does the association between the type and quality of the
survive when other determinants of type and quality of
similar to the ones shown in Table 7 but including time
regressors. The marginal effects of these two variables for the reference individual are shown in Table 9. All the regressors shown in Table 7 are included as well but are not shown. Based on these results the peak probability of
with a duration of 6 years and the peak probability of a
holding all other characteristics constant. Thus, getting
for younger generations of youth is therefore the most likely explanation for their more rapid transition from school to work.

MIDDLE EAST YOUTH INITIATIVE WORKING PAPER | TRANSITIONS TO EMPLOYMENT AND MARRIAGE AMONG YOUNG MEN IN EGYPT 27
* p<0.05, ** p<0.01, *** p<0.001
Note: Other regressors shown in Table 7 are included but not shown.
Table 9: Marginal E"ect of Time to First Job and Time to First Job Squared on Job Quality and Probability of Formal and Public Jobs
Pr(Poor) Pr(Fair) Pr(Good) Pr(Formal) Pr(Public)-0.012*** -0.066*** 0.078*** 0.119*** 0.037** (0.003) (0.013) (0.014) (0.017) (0.014)0.001** 0.005** -0.006** -0.010*** -0.002(0.000) (0.002) (0.002) (0.002) (0.002)
Ordered Probit Probit Probit
5.3 TRANSITION TO A SECOND JOB
To further investigate employment dynamics for educated young men in the Egyptian labor market, we examine in this section the determinants of the hazard of transition to
education in Egypt is 8.7 years, with 25 percent of young
8 Unlike
cohorts is somewhat more complicated for the transition
shorter from the 1971-75 to the 1976-80 cohort and then getting longer for younger cohorts. It remains to be seen whether this pattern holds in the multivariate analysis. There is not a strong relationship between the rate of
The shortest transition times are observed for those with 5-year technical secondary degrees, but the differences across educational levels appear to be fairly small.
lowest rates of transition are from the self-employment or employer states and from public sector work. The second
formal sector wage work and unpaid family work. The
regular and irregular informal wage work in the private sector. Also, as expected, rates of transition to second
be no clear bivariate relationship between transition time
that there is less stability in the Iranian public sector than in the private sector and they attribute this higher level of mobility to the widespread use of temporary contracts in the Iranian public sector. While temporary contracts are used in the public sector in Egypt as well, they are still the exception rather than the rule. According to the ELMPS 06, the proportion of temporary contracts in the Egyptian public sector constituted only 5.8 percent of public sector
Egypt the median duration is 8.7 years in private formal employment and much longer in public employment. The difference may be due to the fact that their sample includes workers at all educational levels whereas ours only focuses on those with secondary education and
Egypt), have shorter employment durations in formal employment than in informal employment. Thus, the differences appear to be real. A possible explanation of the observed differences between Iran and Egypt could be due to the fact that temporary employment contracts
been around longer in Iran than in Egypt. Prior to the new labor law of 2003, temporary contracts were allowed in Egypt, but if renewed once, they immediately reverted to
effect in 2004, allowed employers to renew temporary

MIDDLE EAST YOUTH INITIATIVE WORKING PAPER | TRANSITIONS TO EMPLOYMENT AND MARRIAGE AMONG YOUNG MEN IN EGYPT 28
seems to have been prevalent in Iran for some time (see footnote 6 in Egel and Salehi-Isfahani 2010). It remains to be seen whether the change in rules in Egypt will lead
We now move to a multivariate analysis of the determinants of the hazard of transition to a second
we estimate discrete-time hazard models with non-parametric duration dependence for the baseline
Table 10: Time to Second Job for Those who Obtained First Job by Selected Characteristics (25th, 50th and 75th percentiles), Men 15-34 with Secondary School Certi!cates or Higher
25% 50% 75%All 3.9 8.7 15.7Birth Cohort 1971-75 4.7 9.8 17.8 1976-80 3.6 7.5 12.5 1981-85 3.8 8.1 >14 1986-90 5.8 9.1 >12Own Education General Secondary 6.6 9.7 >16 Technical Secondary 3yrs 4.0 8.4 15.3 Technical Secondary 5yrs 3.6 7.9 >13 Post-Secondary 3.7 8.8 >13 University & Higher 4.0 10.4 16.5Type of First Job Public sector work 7.3 >17 >17 Private formal wage work 4.5 8.7 >16 Private informal regular wage work 2.9 6.1 11.8 Private informal irregular wage work 3.0 7.0 10.2 Unpaid family work 4.3 7.9 12.6 Employer/self-employed >15 >15 >15Quality of First Job Poor 3.0 5.9 13.1 Fair 4.0 8.8 16.0 Good 7.2 >16 >16Time to First Job 0 years 4.1 6.9 11.5 1 years 3.4 7.6 >16 2 years 4.9 >15 >15 3 years 4.1 10.7 >15 4 years 5.3 >13 >13 5 years 4.3 10.1 >12 6 years 5.2 8.7 >12 7 years 4.4 >8 >8 8 years 3.5 >7 >7
Note: Estimates from Kaplan-Meier life table estimates.

MIDDLE EAST YOUTH INITIATIVE WORKING PAPER | TRANSITIONS TO EMPLOYMENT AND MARRIAGE AMONG YOUNG MEN IN EGYPT 29
Figure 3a Figure 3b
The Hazard of Getting a Second Jobby Year Since Entering First Job for the Reference Individual
The Cumulative Probability of Getting a Second Jobby Year Since Entering First Job for the Reference Individual
are shown in Table 11, and the parameters of the spell dummies indicating the shape of the baseline hazard are shown in Appendix Table A2. Model 1, our baseline model, includes the basic set of regressors that were also
4 in Table 5), namely: cohort, time-varying local labor market conditions, own educational attainment, parent’s education, father’s employment, the presence of household enterprises, and region of residence at school
Model 3 adds to Model 1 dummies indicating the type
Model 5 adds to Model 1 dummies indicating the quality
9
by discussing the shape of the baseline hazard, which
dummies shown in Appendix Table A2. Since there
models, we use Model 1 to plot the shape of the hazard and cumulative hazard for the reference individuals in Figures 3a and 3b. We aggregate spell dummies from year 20 onwards, since by then there are very few people left in our sample of 15 to 34 year olds.
The basic pattern that emerges is that the hazard of
very gradually from year 1 to year 11. By then the
over 60 percent. The hazard of moving to a second
it becomes unstable because there are relatively few individuals in our sample who survive that long in a
10 The spike in the hazard at year 19 is almost certainly a statistical artifact since there are only 5
that long.
increases for the two cohorts that follow the 1971-75 birth cohort, but then declines for the 1986-90 cohort. This difference among cohorts is somewhat attenuated,
3 and 4). This suggests that the observed difference is due to the higher likelihood of public employment for members of the oldest cohort. Model 2 shows that time
Models 4 and 6). Thus, it is

MIDDLE EAST YOUTH INITIATIVE WORKING PAPER | TRANSITIONS TO EMPLOYMENT AND MARRIAGE AMONG YOUNG MEN IN EGYPT 30
19
Covariates Model 11 Model 22 Model 33 Model 44 Model 55 Model 66
Birth Cohort (Ref: 1971-75) 1976-1980 1.336*** 1.310*** 1.230** 1.224** 1.276*** 1.271** (0.087) (0.086) (0.081) (0.081) (0.093) (0.093) 1981-1985 1.382*** 1.320** 1.235* 1.218* 1.339** 1.321** (0.118) (0.114) (0.105) (0.106) (0.127) (0.128) 1986-1990 1.355* 1.258 1.238 1.206 1.385* 1.348 (0.195) (0.184) (0.179) (0.177) (0.223) (0.221) Time to First Job (in years) Time to first job 0.903** 0.945 0.945 (0.033) (0.035) (0.038) Time to first job squared 1.011 1.008 1.008 (0.006) (0.006) (0.007) Type of First Job (Ref: Unpaid Family Work) Public job 0.545*** 0.557*** (0.062) (0.064) Private formal wage job 0.852 0.877 (0.099) (0.104) Private informal regular wage 1.195* 1.207* (0.102) (0.104) Private informal irregular wage 1.417*** 1.424*** (0.137) (0.137) Employer or self-employed 0.523*** 0.535*** (0.068) (0.070) Quality of First Job (Ref: Good First Job) Poor first job 3.457*** 3.403*** (0.408) (0.404) Fair first job 1.903*** 1.881*** (0.191) (0.189) Local Labor Market Variables (Time Varying) Local unemployment rates 1.003 1.003 1.005 1.005 1.004 1.005 (0.003) (0.003) (0.003) (0.003) (0.003) (0.003)
Table 11: Discrete-Time Proportional Hazard Model for Hazard of Second Job with Non-Parametric Time Dependence and a Gamma Mixture Distribution for Unobserved Individual Heterogeneity, Men 15-34 with Secondary Schooling and Higher who have Obtained a First Job, Egypt, 20061
Ratio of local priv. W&S workers 1.002 1.002 1.001 1.001 1.002 1.002 (0.004) (0.004) (0.004) (0.004) (0.004) (0.004) Ratio of local public workers 1.002 1.002 1.003 1.003 1.003 1.003 (0.004) (0.004) (0.004) (0.004) (0.004) (0.004) Own Educational Attainment (Ref: Technical Secondary 3 yrs.) General secondary 0.921 0.904 0.898 0.888 0.856 0.847 (0.193) (0.189) (0.188) (0.186) (0.207) (0.205) Technical secondary 5yrs 1.170 1.173 1.308 1.312 1.273 1.283 (0.213) (0.214) (0.240) (0.241) (0.268) (0.270) Above intermediate 0.956 0.950 1.103 1.099 1.054 1.055 (0.103) (0.102) (0.119) (0.119) (0.126) (0.127) University and higher 0.917 0.910 1.134 1.128 1.105 1.105 (0.068) (0.068) (0.088) (0.089) (0.090) (0.091) Parents’ Educational Attainment (Ref: Below Secondary) Father: secondary 1.011 1.018 1.063 1.063 1.041 1.042 (0.096) (0.097) (0.101) (0.101) (0.108) (0.108) Father: post secondary 1.212 1.216 1.210 1.200 1.344 1.331 (0.239) (0.240) (0.240) (0.239) (0.289) (0.288) Father: university and higher 1.367* 1.365* 1.432** 1.430** 1.599*** 1.596*** (0.176) (0.176) (0.183) (0.183) (0.220) (0.219) Mother: secondary 0.831 0.832 0.833 0.830 0.835 0.832 (0.111) (0.111) (0.111) (0.111) (0.121) (0.121) Mother: post secondary 0.839 0.829 0.882 0.880 0.875 0.877 (0.161) (0.159) (0.169) (0.169) (0.185) (0.185) Mother: university and higher 0.691 0.686 0.771 0.764 0.753 0.751 (0.185) (0.183) (0.206) (0.204) (0.202) (0.201) Father’s Employment (Ref: Government Employee) Irregular job 0.939 0.947 0.696 0.703 0.333 0.332 (0.430) (0.434) (0.321) (0.325) (0.239) (0.238) Self-employed 0.956 0.939 0.951 0.948 0.891 0.885 (0.082) (0.081) (0.083) (0.083) (0.085) (0.084) Regular job (non-government) 1.047 1.046 0.952 0.953 0.917 0.916 (0.084) (0.085) (0.078) (0.078) (0.083) (0.083) Unpaid job or jobless 0.828* 0.817* 0.777** 0.775** 0.744** 0.740** (0.071) (0.071) (0.067) (0.067) (0.070) (0.070) Presence of Household Enterprise (Ref: No HH Enterprise) HH has farm 0.859* 0.849* 0.920 0.918 0.956 0.949 (0.066) (0.065) (0.074) (0.074) (0.081) (0.080) HH has a non-agric. enterp. 1.061 1.050 1.162* 1.157* 1.024 1.023 (0.064) (0.064) (0.075) (0.075) (0.069) (0.069) Region of Residence (Ref: Greater Cairo) Alexandria & Suez Canal 1.149 1.158 1.156 1.164 1.085 1.093 (0.123) (0.124) (0.124) (0.125) (0.128) (0.129) Urban Lower Egypt 0.863 0.873 0.870 0.879 0.793 0.800 (0.096) (0.097) (0.097) (0.099) (0.098) (0.099) Urban Upper Egypt 1.008 1.009 0.967 0.971 0.773* 0.776* (0.105) (0.105) (0.102) (0.103) (0.091) (0.092) Rural Lower Egypt 0.951 0.955 0.947 0.951 0.735** 0.740** (0.096) (0.097) (0.096) (0.097) (0.085) (0.086) Rural Upper Egypt 1.191 1.180 1.113 1.115 0.839 0.841 (0.127) (0.126) (0.121) (0.122) (0.102) (0.102) Spell Dummies included included included included included included Constant 0.202*** 0.223*** 0.207*** 0.213*** 0.107*** 0.113*** (0.046) (0.052) (0.048) (0.051) (0.028) (0.030) Log Gamma Variance 0.000 0.000 0.000 0.000 0.000 0.000 (0.004) (0.002) (0.000) (0.001) (0.006) (0.005) Number of Spells 13,259 13,259 13,259 13,259 11,614 11,614 Number of Individuals 2,750 2,750 2,750 2,750 2,352 2,352 Log-Likelihood -4266.599 -4261.852 -4202.601 -4201.462 -3527.058 -3526.097
Ratio of local priv. W&S workers 1.002 1.002 1.001 1.001 1.002 1.002 (0.004) (0.004) (0.004) (0.004) (0.004) (0.004) Ratio of local public workers 1.002 1.002 1.003 1.003 1.003 1.003 (0.004) (0.004) (0.004) (0.004) (0.004) (0.004) Own Educational Attainment (Ref: Technical Secondary 3 yrs.) General secondary 0.921 0.904 0.898 0.888 0.856 0.847 (0.193) (0.189) (0.188) (0.186) (0.207) (0.205) Technical secondary 5yrs 1.170 1.173 1.308 1.312 1.273 1.283 (0.213) (0.214) (0.240) (0.241) (0.268) (0.270) Above intermediate 0.956 0.950 1.103 1.099 1.054 1.055 (0.103) (0.102) (0.119) (0.119) (0.126) (0.127) University and higher 0.917 0.910 1.134 1.128 1.105 1.105 (0.068) (0.068) (0.088) (0.089) (0.090) (0.091) Parents’ Educational Attainment (Ref: Below Secondary) Father: secondary 1.011 1.018 1.063 1.063 1.041 1.042 (0.096) (0.097) (0.101) (0.101) (0.108) (0.108) Father: post secondary 1.212 1.216 1.210 1.200 1.344 1.331 (0.239) (0.240) (0.240) (0.239) (0.289) (0.288) Father: university and higher 1.367* 1.365* 1.432** 1.430** 1.599*** 1.596*** (0.176) (0.176) (0.183) (0.183) (0.220) (0.219) Mother: secondary 0.831 0.832 0.833 0.830 0.835 0.832 (0.111) (0.111) (0.111) (0.111) (0.121) (0.121) Mother: post secondary 0.839 0.829 0.882 0.880 0.875 0.877 (0.161) (0.159) (0.169) (0.169) (0.185) (0.185) Mother: university and higher 0.691 0.686 0.771 0.764 0.753 0.751 (0.185) (0.183) (0.206) (0.204) (0.202) (0.201) Father’s Employment (Ref: Government Employee) Irregular job 0.939 0.947 0.696 0.703 0.333 0.332 (0.430) (0.434) (0.321) (0.325) (0.239) (0.238) Self-employed 0.956 0.939 0.951 0.948 0.891 0.885 (0.082) (0.081) (0.083) (0.083) (0.085) (0.084) Regular job (non-government) 1.047 1.046 0.952 0.953 0.917 0.916 (0.084) (0.085) (0.078) (0.078) (0.083) (0.083) Unpaid job or jobless 0.828* 0.817* 0.777** 0.775** 0.744** 0.740** (0.071) (0.071) (0.067) (0.067) (0.070) (0.070) Presence of Household Enterprise (Ref: No HH Enterprise) HH has farm 0.859* 0.849* 0.920 0.918 0.956 0.949 (0.066) (0.065) (0.074) (0.074) (0.081) (0.080) HH has a non-agric. enterp. 1.061 1.050 1.162* 1.157* 1.024 1.023 (0.064) (0.064) (0.075) (0.075) (0.069) (0.069) Region of Residence (Ref: Greater Cairo) Alexandria & Suez Canal 1.149 1.158 1.156 1.164 1.085 1.093 (0.123) (0.124) (0.124) (0.125) (0.128) (0.129) Urban Lower Egypt 0.863 0.873 0.870 0.879 0.793 0.800 (0.096) (0.097) (0.097) (0.099) (0.098) (0.099) Urban Upper Egypt 1.008 1.009 0.967 0.971 0.773* 0.776* (0.105) (0.105) (0.102) (0.103) (0.091) (0.092) Rural Lower Egypt 0.951 0.955 0.947 0.951 0.735** 0.740** (0.096) (0.097) (0.096) (0.097) (0.085) (0.086) Rural Upper Egypt 1.191 1.180 1.113 1.115 0.839 0.841 (0.127) (0.126) (0.121) (0.122) (0.102) (0.102) Spell Dummies included included included included included included Constant 0.202*** 0.223*** 0.207*** 0.213*** 0.107*** 0.113*** (0.046) (0.052) (0.048) (0.051) (0.028) (0.030) Log Gamma Variance 0.000 0.000 0.000 0.000 0.000 0.000 (0.004) (0.002) (0.000) (0.001) (0.006) (0.005) Number of Spells 13,259 13,259 13,259 13,259 11,614 11,614 Number of Individuals 2,750 2,750 2,750 2,750 2,352 2,352 Log-Likelihood -4266.599 -4261.852 -4202.601 -4201.462 -3527.058 -3526.097
Ratio of local priv. W&S workers 1.002 1.002 1.001 1.001 1.002 1.002 (0.004) (0.004) (0.004) (0.004) (0.004) (0.004) Ratio of local public workers 1.002 1.002 1.003 1.003 1.003 1.003 (0.004) (0.004) (0.004) (0.004) (0.004) (0.004) Own Educational Attainment (Ref: Technical Secondary 3 yrs.) General secondary 0.921 0.904 0.898 0.888 0.856 0.847 (0.193) (0.189) (0.188) (0.186) (0.207) (0.205) Technical secondary 5yrs 1.170 1.173 1.308 1.312 1.273 1.283 (0.213) (0.214) (0.240) (0.241) (0.268) (0.270) Above intermediate 0.956 0.950 1.103 1.099 1.054 1.055 (0.103) (0.102) (0.119) (0.119) (0.126) (0.127) University and higher 0.917 0.910 1.134 1.128 1.105 1.105 (0.068) (0.068) (0.088) (0.089) (0.090) (0.091) Parents’ Educational Attainment (Ref: Below Secondary) Father: secondary 1.011 1.018 1.063 1.063 1.041 1.042 (0.096) (0.097) (0.101) (0.101) (0.108) (0.108) Father: post secondary 1.212 1.216 1.210 1.200 1.344 1.331 (0.239) (0.240) (0.240) (0.239) (0.289) (0.288) Father: university and higher 1.367* 1.365* 1.432** 1.430** 1.599*** 1.596*** (0.176) (0.176) (0.183) (0.183) (0.220) (0.219) Mother: secondary 0.831 0.832 0.833 0.830 0.835 0.832 (0.111) (0.111) (0.111) (0.111) (0.121) (0.121) Mother: post secondary 0.839 0.829 0.882 0.880 0.875 0.877 (0.161) (0.159) (0.169) (0.169) (0.185) (0.185) Mother: university and higher 0.691 0.686 0.771 0.764 0.753 0.751 (0.185) (0.183) (0.206) (0.204) (0.202) (0.201) Father’s Employment (Ref: Government Employee) Irregular job 0.939 0.947 0.696 0.703 0.333 0.332 (0.430) (0.434) (0.321) (0.325) (0.239) (0.238) Self-employed 0.956 0.939 0.951 0.948 0.891 0.885 (0.082) (0.081) (0.083) (0.083) (0.085) (0.084) Regular job (non-government) 1.047 1.046 0.952 0.953 0.917 0.916 (0.084) (0.085) (0.078) (0.078) (0.083) (0.083) Unpaid job or jobless 0.828* 0.817* 0.777** 0.775** 0.744** 0.740** (0.071) (0.071) (0.067) (0.067) (0.070) (0.070) Presence of Household Enterprise (Ref: No HH Enterprise) HH has farm 0.859* 0.849* 0.920 0.918 0.956 0.949 (0.066) (0.065) (0.074) (0.074) (0.081) (0.080) HH has a non-agric. enterp. 1.061 1.050 1.162* 1.157* 1.024 1.023 (0.064) (0.064) (0.075) (0.075) (0.069) (0.069) Region of Residence (Ref: Greater Cairo) Alexandria & Suez Canal 1.149 1.158 1.156 1.164 1.085 1.093 (0.123) (0.124) (0.124) (0.125) (0.128) (0.129) Urban Lower Egypt 0.863 0.873 0.870 0.879 0.793 0.800 (0.096) (0.097) (0.097) (0.099) (0.098) (0.099) Urban Upper Egypt 1.008 1.009 0.967 0.971 0.773* 0.776* (0.105) (0.105) (0.102) (0.103) (0.091) (0.092) Rural Lower Egypt 0.951 0.955 0.947 0.951 0.735** 0.740** (0.096) (0.097) (0.096) (0.097) (0.085) (0.086) Rural Upper Egypt 1.191 1.180 1.113 1.115 0.839 0.841 (0.127) (0.126) (0.121) (0.122) (0.102) (0.102) Spell Dummies included included included included included included Constant 0.202*** 0.223*** 0.207*** 0.213*** 0.107*** 0.113*** (0.046) (0.052) (0.048) (0.051) (0.028) (0.030) Log Gamma Variance 0.000 0.000 0.000 0.000 0.000 0.000 (0.004) (0.002) (0.000) (0.001) (0.006) (0.005) Number of Spells 13,259 13,259 13,259 13,259 11,614 11,614 Number of Individuals 2,750 2,750 2,750 2,750 2,352 2,352 Log-Likelihood -4266.599 -4261.852 -4202.601 -4201.462 -3527.058 -3526.097
Ratio of local priv. W&S workers 1.002 1.002 1.001 1.001 1.002 1.002 (0.004) (0.004) (0.004) (0.004) (0.004) (0.004) Ratio of local public workers 1.002 1.002 1.003 1.003 1.003 1.003 (0.004) (0.004) (0.004) (0.004) (0.004) (0.004) Own Educational Attainment (Ref: Technical Secondary 3 yrs.) General secondary 0.921 0.904 0.898 0.888 0.856 0.847 (0.193) (0.189) (0.188) (0.186) (0.207) (0.205) Technical secondary 5yrs 1.170 1.173 1.308 1.312 1.273 1.283 (0.213) (0.214) (0.240) (0.241) (0.268) (0.270) Above intermediate 0.956 0.950 1.103 1.099 1.054 1.055 (0.103) (0.102) (0.119) (0.119) (0.126) (0.127) University and higher 0.917 0.910 1.134 1.128 1.105 1.105 (0.068) (0.068) (0.088) (0.089) (0.090) (0.091) Parents’ Educational Attainment (Ref: Below Secondary) Father: secondary 1.011 1.018 1.063 1.063 1.041 1.042 (0.096) (0.097) (0.101) (0.101) (0.108) (0.108) Father: post secondary 1.212 1.216 1.210 1.200 1.344 1.331 (0.239) (0.240) (0.240) (0.239) (0.289) (0.288) Father: university and higher 1.367* 1.365* 1.432** 1.430** 1.599*** 1.596*** (0.176) (0.176) (0.183) (0.183) (0.220) (0.219) Mother: secondary 0.831 0.832 0.833 0.830 0.835 0.832 (0.111) (0.111) (0.111) (0.111) (0.121) (0.121) Mother: post secondary 0.839 0.829 0.882 0.880 0.875 0.877 (0.161) (0.159) (0.169) (0.169) (0.185) (0.185) Mother: university and higher 0.691 0.686 0.771 0.764 0.753 0.751 (0.185) (0.183) (0.206) (0.204) (0.202) (0.201) Father’s Employment (Ref: Government Employee) Irregular job 0.939 0.947 0.696 0.703 0.333 0.332 (0.430) (0.434) (0.321) (0.325) (0.239) (0.238) Self-employed 0.956 0.939 0.951 0.948 0.891 0.885 (0.082) (0.081) (0.083) (0.083) (0.085) (0.084) Regular job (non-government) 1.047 1.046 0.952 0.953 0.917 0.916 (0.084) (0.085) (0.078) (0.078) (0.083) (0.083) Unpaid job or jobless 0.828* 0.817* 0.777** 0.775** 0.744** 0.740** (0.071) (0.071) (0.067) (0.067) (0.070) (0.070) Presence of Household Enterprise (Ref: No HH Enterprise) HH has farm 0.859* 0.849* 0.920 0.918 0.956 0.949 (0.066) (0.065) (0.074) (0.074) (0.081) (0.080) HH has a non-agric. enterp. 1.061 1.050 1.162* 1.157* 1.024 1.023 (0.064) (0.064) (0.075) (0.075) (0.069) (0.069) Region of Residence (Ref: Greater Cairo) Alexandria & Suez Canal 1.149 1.158 1.156 1.164 1.085 1.093 (0.123) (0.124) (0.124) (0.125) (0.128) (0.129) Urban Lower Egypt 0.863 0.873 0.870 0.879 0.793 0.800 (0.096) (0.097) (0.097) (0.099) (0.098) (0.099) Urban Upper Egypt 1.008 1.009 0.967 0.971 0.773* 0.776* (0.105) (0.105) (0.102) (0.103) (0.091) (0.092) Rural Lower Egypt 0.951 0.955 0.947 0.951 0.735** 0.740** (0.096) (0.097) (0.096) (0.097) (0.085) (0.086) Rural Upper Egypt 1.191 1.180 1.113 1.115 0.839 0.841 (0.127) (0.126) (0.121) (0.122) (0.102) (0.102) Spell Dummies included included included included included included Constant 0.202*** 0.223*** 0.207*** 0.213*** 0.107*** 0.113*** (0.046) (0.052) (0.048) (0.051) (0.028) (0.030) Log Gamma Variance 0.000 0.000 0.000 0.000 0.000 0.000 (0.004) (0.002) (0.000) (0.001) (0.006) (0.005) Number of Spells 13,259 13,259 13,259 13,259 11,614 11,614 Number of Individuals 2,750 2,750 2,750 2,750 2,352 2,352 Log-Likelihood -4266.599 -4261.852 -4202.601 -4201.462 -3527.058 -3526.097

MIDDLE EAST YOUTH INITIATIVE WORKING PAPER | TRANSITIONS TO EMPLOYMENT AND MARRIAGE AMONG YOUNG MEN IN EGYPT 31
Ratio of local priv. W&S workers 1.002 1.002 1.001 1.001 1.002 1.002 (0.004) (0.004) (0.004) (0.004) (0.004) (0.004) Ratio of local public workers 1.002 1.002 1.003 1.003 1.003 1.003 (0.004) (0.004) (0.004) (0.004) (0.004) (0.004) Own Educational Attainment (Ref: Technical Secondary 3 yrs.) General secondary 0.921 0.904 0.898 0.888 0.856 0.847 (0.193) (0.189) (0.188) (0.186) (0.207) (0.205) Technical secondary 5yrs 1.170 1.173 1.308 1.312 1.273 1.283 (0.213) (0.214) (0.240) (0.241) (0.268) (0.270) Above intermediate 0.956 0.950 1.103 1.099 1.054 1.055 (0.103) (0.102) (0.119) (0.119) (0.126) (0.127) University and higher 0.917 0.910 1.134 1.128 1.105 1.105 (0.068) (0.068) (0.088) (0.089) (0.090) (0.091) Parents’ Educational Attainment (Ref: Below Secondary) Father: secondary 1.011 1.018 1.063 1.063 1.041 1.042 (0.096) (0.097) (0.101) (0.101) (0.108) (0.108) Father: post secondary 1.212 1.216 1.210 1.200 1.344 1.331 (0.239) (0.240) (0.240) (0.239) (0.289) (0.288) Father: university and higher 1.367* 1.365* 1.432** 1.430** 1.599*** 1.596*** (0.176) (0.176) (0.183) (0.183) (0.220) (0.219) Mother: secondary 0.831 0.832 0.833 0.830 0.835 0.832 (0.111) (0.111) (0.111) (0.111) (0.121) (0.121) Mother: post secondary 0.839 0.829 0.882 0.880 0.875 0.877 (0.161) (0.159) (0.169) (0.169) (0.185) (0.185) Mother: university and higher 0.691 0.686 0.771 0.764 0.753 0.751 (0.185) (0.183) (0.206) (0.204) (0.202) (0.201) Father’s Employment (Ref: Government Employee) Irregular job 0.939 0.947 0.696 0.703 0.333 0.332 (0.430) (0.434) (0.321) (0.325) (0.239) (0.238) Self-employed 0.956 0.939 0.951 0.948 0.891 0.885 (0.082) (0.081) (0.083) (0.083) (0.085) (0.084) Regular job (non-government) 1.047 1.046 0.952 0.953 0.917 0.916 (0.084) (0.085) (0.078) (0.078) (0.083) (0.083) Unpaid job or jobless 0.828* 0.817* 0.777** 0.775** 0.744** 0.740** (0.071) (0.071) (0.067) (0.067) (0.070) (0.070) Presence of Household Enterprise (Ref: No HH Enterprise) HH has farm 0.859* 0.849* 0.920 0.918 0.956 0.949 (0.066) (0.065) (0.074) (0.074) (0.081) (0.080) HH has a non-agric. enterp. 1.061 1.050 1.162* 1.157* 1.024 1.023 (0.064) (0.064) (0.075) (0.075) (0.069) (0.069) Region of Residence (Ref: Greater Cairo) Alexandria & Suez Canal 1.149 1.158 1.156 1.164 1.085 1.093 (0.123) (0.124) (0.124) (0.125) (0.128) (0.129) Urban Lower Egypt 0.863 0.873 0.870 0.879 0.793 0.800 (0.096) (0.097) (0.097) (0.099) (0.098) (0.099) Urban Upper Egypt 1.008 1.009 0.967 0.971 0.773* 0.776* (0.105) (0.105) (0.102) (0.103) (0.091) (0.092) Rural Lower Egypt 0.951 0.955 0.947 0.951 0.735** 0.740** (0.096) (0.097) (0.096) (0.097) (0.085) (0.086) Rural Upper Egypt 1.191 1.180 1.113 1.115 0.839 0.841 (0.127) (0.126) (0.121) (0.122) (0.102) (0.102) Spell Dummies included included included included included included Constant 0.202*** 0.223*** 0.207*** 0.213*** 0.107*** 0.113*** (0.046) (0.052) (0.048) (0.051) (0.028) (0.030) Log Gamma Variance 0.000 0.000 0.000 0.000 0.000 0.000 (0.004) (0.002) (0.000) (0.001) (0.006) (0.005) Number of Spells 13,259 13,259 13,259 13,259 11,614 11,614 Number of Individuals 2,750 2,750 2,750 2,750 2,352 2,352 Log-Likelihood -4266.599 -4261.852 -4202.601 -4201.462 -3527.058 -3526.097
Ratio of local priv. W&S workers 1.002 1.002 1.001 1.001 1.002 1.002 (0.004) (0.004) (0.004) (0.004) (0.004) (0.004) Ratio of local public workers 1.002 1.002 1.003 1.003 1.003 1.003 (0.004) (0.004) (0.004) (0.004) (0.004) (0.004) Own Educational Attainment (Ref: Technical Secondary 3 yrs.) General secondary 0.921 0.904 0.898 0.888 0.856 0.847 (0.193) (0.189) (0.188) (0.186) (0.207) (0.205) Technical secondary 5yrs 1.170 1.173 1.308 1.312 1.273 1.283 (0.213) (0.214) (0.240) (0.241) (0.268) (0.270) Above intermediate 0.956 0.950 1.103 1.099 1.054 1.055 (0.103) (0.102) (0.119) (0.119) (0.126) (0.127) University and higher 0.917 0.910 1.134 1.128 1.105 1.105 (0.068) (0.068) (0.088) (0.089) (0.090) (0.091) Parents’ Educational Attainment (Ref: Below Secondary) Father: secondary 1.011 1.018 1.063 1.063 1.041 1.042 (0.096) (0.097) (0.101) (0.101) (0.108) (0.108) Father: post secondary 1.212 1.216 1.210 1.200 1.344 1.331 (0.239) (0.240) (0.240) (0.239) (0.289) (0.288) Father: university and higher 1.367* 1.365* 1.432** 1.430** 1.599*** 1.596*** (0.176) (0.176) (0.183) (0.183) (0.220) (0.219) Mother: secondary 0.831 0.832 0.833 0.830 0.835 0.832 (0.111) (0.111) (0.111) (0.111) (0.121) (0.121) Mother: post secondary 0.839 0.829 0.882 0.880 0.875 0.877 (0.161) (0.159) (0.169) (0.169) (0.185) (0.185) Mother: university and higher 0.691 0.686 0.771 0.764 0.753 0.751 (0.185) (0.183) (0.206) (0.204) (0.202) (0.201) Father’s Employment (Ref: Government Employee) Irregular job 0.939 0.947 0.696 0.703 0.333 0.332 (0.430) (0.434) (0.321) (0.325) (0.239) (0.238) Self-employed 0.956 0.939 0.951 0.948 0.891 0.885 (0.082) (0.081) (0.083) (0.083) (0.085) (0.084) Regular job (non-government) 1.047 1.046 0.952 0.953 0.917 0.916 (0.084) (0.085) (0.078) (0.078) (0.083) (0.083) Unpaid job or jobless 0.828* 0.817* 0.777** 0.775** 0.744** 0.740** (0.071) (0.071) (0.067) (0.067) (0.070) (0.070) Presence of Household Enterprise (Ref: No HH Enterprise) HH has farm 0.859* 0.849* 0.920 0.918 0.956 0.949 (0.066) (0.065) (0.074) (0.074) (0.081) (0.080) HH has a non-agric. enterp. 1.061 1.050 1.162* 1.157* 1.024 1.023 (0.064) (0.064) (0.075) (0.075) (0.069) (0.069) Region of Residence (Ref: Greater Cairo) Alexandria & Suez Canal 1.149 1.158 1.156 1.164 1.085 1.093 (0.123) (0.124) (0.124) (0.125) (0.128) (0.129) Urban Lower Egypt 0.863 0.873 0.870 0.879 0.793 0.800 (0.096) (0.097) (0.097) (0.099) (0.098) (0.099) Urban Upper Egypt 1.008 1.009 0.967 0.971 0.773* 0.776* (0.105) (0.105) (0.102) (0.103) (0.091) (0.092) Rural Lower Egypt 0.951 0.955 0.947 0.951 0.735** 0.740** (0.096) (0.097) (0.096) (0.097) (0.085) (0.086) Rural Upper Egypt 1.191 1.180 1.113 1.115 0.839 0.841 (0.127) (0.126) (0.121) (0.122) (0.102) (0.102) Spell Dummies included included included included included included Constant 0.202*** 0.223*** 0.207*** 0.213*** 0.107*** 0.113*** (0.046) (0.052) (0.048) (0.051) (0.028) (0.030) Log Gamma Variance 0.000 0.000 0.000 0.000 0.000 0.000 (0.004) (0.002) (0.000) (0.001) (0.006) (0.005) Number of Spells 13,259 13,259 13,259 13,259 11,614 11,614 Number of Individuals 2,750 2,750 2,750 2,750 2,352 2,352 Log-Likelihood -4266.599 -4261.852 -4202.601 -4201.462 -3527.058 -3526.097
* p<0.05, ** p<0.01, *** p<0.0011. Exponentiated regression coe"cients indicating hazard ratios. Standard errors in parentheses can be used to test the statistical signi!cance
of the deviation of the exponentiated coe"cient from 1.2. A baseline model.3. Model 1 plus ‘time to a !rst job’ and ‘time to !rst job squared’ terms added.4. Model 1 plus type of !rst job dummies added.5. Model 1 plus ‘time to a !rst job’ and ‘time to !rst job squared’ terms and type of !rst job dummies added.6. Model 1 with quality of !rst job dummies added.7. Model 1 plus ‘time to a !rst job’ and ‘time to !rst job squared’ terms and quality of !rst job dummies added.8. The coe"cients for the spell dummies are shown in Appendix Table A2.
of transition is for people who obtain formal private sector employment, followed by unpaid family work. The highest hazards of transition are among informal private wage workers, with irregular wage workers
the highest hazards of moving on.
additional regressors. Thus it appears that there is some scope for mobility if one gets stuck with a poor
whether such mobility allows young men to improve

MIDDLE EAST YOUTH INITIATIVE WORKING PAPER | TRANSITIONS TO EMPLOYMENT AND MARRIAGE AMONG YOUNG MEN IN EGYPT 32
Table 12: Transition Matrix for Quality of First and Second Jobs (Row Percentages)
Poor 30 52 18 100Fair 12 63 25 100Good 0 25 75 100Total 15 56 29 100
Job Quality in First Job
Poor Fair Good TotalJob Quality in Second Job
table also shows, however, that 25 percent of those who
local labor market conditions nor own educational
at the university level, however, seems to increase
a father who is not working reduces that hazard. Being part of a household that has a farm reduces
enterprise in the household increases the hazard of
region of residence at school exit has no effect on the
obtained by Egel and Salehi-Isfahani (2010) for Iran.
sector than in the private sector and they attribute this higher level of mobility to the widespread use of temporary contracts in the Iranian public sector. While temporary contracts are used in the public sector in Egypt as well, they are still the exception rather than the rule. According to the ELMPS 06, the proportion of temporary contracts in the Egyptian public sector constituted only 5.8 percent of public sector employment in 2006.
in Egypt the median duration is 8.7 years in private formal employment and much longer in public employment. The difference may be due to the fact that their sample includes workers at all educational levels, whereas ours only focuses on those with secondary education and above. However, they do
much. Secondary school graduates, who constitute
Egypt), have shorter employment durations in formal employment than in informal employment. Thus, the differences appear to be real.
A possible explanation of the observed differences between Iran and Egypt could be due to the fact that temporary employment contracts, which can be
around longer in Iran than in Egypt. Prior to the new labor law of 2003, temporary contracts were allowed in Egypt; however, if renewed once, they immediately
which came into effect in 2004, allowed employers
times, a situation that seems to have been prevalent in Iran for some time (see Egel and Salehi-Isfahani 2010). It remains to be seen whether the change in rules in
formal sector.

MIDDLE EAST YOUTH INITIATIVE WORKING PAPER | TRANSITIONS TO EMPLOYMENT AND MARRIAGE AMONG YOUNG MEN IN EGYPT 33
1980
Males
Females
Males (4-period moving average)
Females (4-period moving average)
Year of Birth
Med
ian
Age
At F
irst
Mar
riag
e in
Yea
rs
197519701965196019551950194519401935
30
28
26
24
22
20
18
16
14
12
10
Figure 4: Median Age at First Marriage by Year of Birth and Sex (Four-year Moving Average)
Source: ELMPS 06.
6. TRANSITIONS TO MARRIAGEMarriage constitutes the sole socially-accepted institution of family formation in the Arab world and is widely perceived as the main marker of adulthood.
stand out among other world regions. While female age at marriage has also gone up, the trend there is comparable to trends elsewhere in the world. Thus, the increase in male age at marriage and the continuing
to Arab societies (Mensch 2005, Mensch et al. 2005). This seemingly involuntary postponement of marriage
political implications of the better documented effects of a “surplus” unmarried male population in China resulting from unbalanced sex ratios (Hudson and Den Boer 2002, 2004). While the high cost of marriage has been documented for Egypt (Singerman 2007, Singerman and Ibrahim 2001), an in-depth analysis
marriage is still lacking.
Using the detailed life-course data available from the ELMPS 06, this section of the paper analyzes the determinants of the timing of marriage in Egypt and links the timing of marriage to the changing labor market prospects facing Egyptian youth that
employment, the incidence and timing of a good
educational attainment, the socioeconomic background of his parents, the performance of local labor markets, and the prevailing sex ratios in the region of residence.
describing trends in the timing of marriage in Section 6.1, we present in Section 6.2 our results on the determinants of the timing of marriage among men in Egypt. To better illustrate these results, we use our estimates to conduct simulations of the effect of the
the timing of marriage. The simulations are presented in Section 6.3.

MIDDLE EAST YOUTH INITIATIVE WORKING PAPER | TRANSITIONS TO EMPLOYMENT AND MARRIAGE AMONG YOUNG MEN IN EGYPT 34
1945-48
1969-71
1960-62
1975-77
Age
Prop
ortio
n N
ever
Mar
ried
15 20 25 30 35 40
1
0.9
0.8
0.7
0.6
0.5
0.4
0.3
0.2
0.1
0
Figure 5: Kaplan-Meier Survival Function for Distribution of Age at First Marriage for Men, by Cohort of Birth
Source: ELMPS 06.
6.1 RECENT TRENDS IN THE TIMING OF MARRIAGE IN EGYPT
While for a long time Egypt conformed to the general trend in Arab societies of delayed marriage for men, this trend has actually reversed itself in recent years, starting with the cohorts born in the early 1970s. Figure 4 shows
using life table analysis that takes into account that some members of each cohort had not yet married at the time of the survey. As Figure 4 shows, the delay in male
end of the 1950s and continued through to those born in the early 1970s. The delay for women began somewhat earlier and continued uninterrupted through the cohorts born in the late 1970s.11
As a result of this pattern, the age gap between spouses remained fairly constant at 8 to 9 years and only started to narrow for males born after 1973. The delay in the age of marriage for young men and its subsequent reversal can be observed throughout the entire distribution of age
relatively novel and goes counter to either conventional wisdom or recent qualitative studies. Assaad and Ramadan (2008) attribute this recent decline to housing law reform passed in 1996 that made it easier for young couples to acquire market-rate rental housing.
The delay in age of marriage for young men and its subsequent reversal can also be seen by looking at the entire distribution of age at marriage by birth cohort and
in age at marriage from the 1945-48 birth cohort to the 1960-62 birth cohort was very slight, with the median age shifting by at most one year from 25 to 26. By the 1969-71 birth cohort, the median had reached about 28. Seventy percent of that cohort had not yet married by age 25, and 30 percent had not married by age 30. The reversal in the delay in age at marriage is readily apparent for the 1975-77 birth cohort compared to the 1969-71 cohort. Although very early marriages (before age 23) were equally rare for these two cohorts (less
from 28 to 26, right back to where it was for the 1960-

MIDDLE EAST YOUTH INITIATIVE WORKING PAPER | TRANSITIONS TO EMPLOYMENT AND MARRIAGE AMONG YOUNG MEN IN EGYPT 35
Table 13: Summary Statistics of Explanatory Variables, Men 18-40 with Secondary School Education or Higher
Explanatory VariablesIndividual Characteristics
Parental Background
Regional and Community-Level Variables
Mean
19.60.0180.5980.0210.0760.28820.1723.754.3827.822.04
0.7750.1150.0230.08710.8810.0730.0170.0300.4420.1280.1070.323
0.8600.1960.1040.1370.2360.1720.1810.1470.2220.2900.2740.067
General secondary degreeTechnical secondary 3 yrs***Technical secondary 5 yrsPost-secondaryUniversity & higher
Duration of migration period**
Number of sisters
Father: below secondary education***Father: secondary educationFather: post-secondary educationFather: university & higherMother: below secondary***Mother: secondary educationMother: post-secondaryMother: university & higherFather: government employee***Father: regular wage worker outside governmentFather: irregular wage work or not workingFather: employer or self-employed
Sex ratio in district of residence in 1996Greater Cairo***Alexandria and SuezUrban Lower EgyptRural Lower EgyptUrban Upper EgyptUrban Upper EgyptCohort 1966 - 1970***Cohort 1971-1975Cohort 1976-1980Cohort 1981-1985Cohort 1986+
** provided that individuals are not censored and that migration started before year of marriage*** omitted categoryNote: Italics denote time-varying covariatesSource: ELMPS 06
2.390.1320.4900.1420.2640.4533.633.573.94.401.51
0.4170.3190.1480.2820.3240.2600.1290.1690.4970.3340.3090.468
0.1140.3750.3050.3440.4250.3770.3850.3540.4150.4540.4460.250
399539953995399539953995333211323939
3995
399539953995399539953995399539953995399539953995
399539953995399539953995399539953995399539953995
17000006120190
000000000000
0.4000000000000
3911111373153912
111111111111
311111111111
St. dev. N min max

MIDDLE EAST YOUTH INITIATIVE WORKING PAPER | TRANSITIONS TO EMPLOYMENT AND MARRIAGE AMONG YOUNG MEN IN EGYPT 36
62 cohort. Finally, it is clearly apparent from Figure 5 that marriage for men in Egypt is virtually universal by age 40.
for Iran in Egel and Salehi-Isfahani (2010). Although marriage is virtually universal in Iran by age 40 as well, the tendency in Iran has been for a continual delay in
age of marriage for men in Iran has shifted from about 23.5 for those born in 1964 to 26 for those born in 1979 and then remained constant until the 1984 birth cohort. We should note however that the median age for men in Egypt had climbed much higher than in Iran before it started its recent decline.
6.2 THE DETERMINANTS OF THE DURATION TO FIRST MARRIAGE IN EGYPT
varying and time-invariant covariates. The principal explanatory variables upon which we focus our attention in this section are all time-varying and describe the
the variable in our person-year dataset takes on the value of 1 irrespective of whether or not the individual experiences a period of non-employment later. Out of a total of 3,995 men aged 18-40 in our sample, 3,332 (83
The second time-varying covariate attempts to capture
We do that by including a variable that switches from zero to one when, if ever, an individual has obtained a
as that used earlier. Again, out of 3,332 individuals who
it correlates closely to formal employment, captures
The third employment-related time-varying covariate relates to a young man’s experience with international migration. There is ample qualitative evidence that young men often use temporary international migration as a strategy to raise the necessary capital for marriage (Singerman 1995, Hoodfar 1997). Migration experience
Egypt. We use the migration history module of the ELMPS 06 to determine young men’s experience with international migration. We assume that an individual who departed abroad after age 15 left in order to work. Our time-varying migration variable turns on when an individual returns from migration. We also include a time-invariant variable that indicates how long he was away in total. Since we are only interested in the effects of migration on the timing of marriage, we ignore migration that occurs after marriage. Only 39 individuals in our sample, or 1 percent, migrated prior to marriage. The mean duration of migration for those who migrated was 4.4 years and the mean age upon return was 27.8 (see Table 13).
The norm in the literature is to lag the employment-related time-varying covariates by one year (see for example Gutiérrez-Domènech 2008). The argument is that the decision to marry and marriage itself usually occur with a certain time-lag. The disadvantage of this approach is that it assumes the length of the lag rather than allows it to be determined from the data. Since it may take longer than one year for a change in employment status to affect the hazard of marrying,
therefore initially estimate several models with a one-year lag, but then include a version of our preferred model with a more complex lag structure for the time-varying employment variables, namely one, three and
variables can tell us about the speed with which the hazard of marrying responds to changes in employment or migration status.
The last time-varying covariate we use is an indicator variable that shows whether the individual was still in school. Although all individuals in our sample are currently out of school by design, we start observing them at age 14 and therefore they would have been in

MIDDLE EAST YOUTH INITIATIVE WORKING PAPER | TRANSITIONS TO EMPLOYMENT AND MARRIAGE AMONG YOUNG MEN IN EGYPT 37
school in the past. The variable takes on the value of 1 when the individual is attending school and switches to zero when he leaves it.
Our time-invariant explanatory variables include cohort of birth, own educational attainment, number of living sisters, parental education, father’s type of employment, the sex ratio in the district of residence in 1996, region, and the duration of migration, if the individual is a return migrant. We include the number of living sisters a young man has as an explanatory variable because young men in Egypt are expected to
in accumulating the required capital for his sisters to marry. We therefore expect men with a higher number of sisters to marry later. The mean number of sisters for men in the sample is two. The individuals in our sample fall into one of four birth cohorts, namely 1966-70, which is the reference cohort, 1971-75, 1976-80, 1981-85, and 1986+. Since the last cohort only includes individuals 18 to 20 in 2006, it is much smaller than the previous three. We use the same categories for own education, parental education and father’s employment that we used in the transition to employment analysis.
We control for conditions in an individual’s wider community that can affect the timing of marriage by including the sex ratio in the district of residence as
provided by the 1996 Population Census. Because there is an average age gap of 6-7 years between spouses in Egypt, sex ratios were calculated by dividing
group in the individual’s district of residence. For example, men aged 25 to 29 were related to women aged 20 to 24. Men in the sample were assigned the sex ratio corresponding to their age in 1996. The average district-level sex ratio for individuals in the sample was 0.86 (see Table 13).
In what follows we estimate a series of increasingly richer models. Model (1) includes only the cohort and education dummies. Model (2) adds the labor market and migration variables describing an individual’s
lagged one period only. Model (3) adds the number of sisters and parental background variables. Model (4) adds the community-level variables and regional dummies. Finally, Model (5) is similar to Model (4) but includes the full lag structure of the time-varying labor
various discrete-time hazard models we estimate with
which are shown in Appendix Table A3. In discussing
Figure 6a Figure 6bThe Hazard of First Marriage
by Age and Cohort of BirthThe Cumulative Probability of Getting Married
by Age and Cohort of Birth
Note: Calculations based on Model 4 in Table 14.
MIDDLE EAST YOUTH INITIATIVE WORKING PAPER | TRANSITIONS TO EMPLOYMENT AND MARRIAGE AMONG YOUNG MEN IN EGYPT 38
the results, we will focus on Models (3) and (4), our most comprehensive models, and will point out differences with other models, if any.
The discrete-time baseline hazard and cumulative
different cohorts are shown in Figure 6a and 6b. The hazard function reveals a non-monotonic relationship
with age until about age 30 and then remaining roughly constant for another decade.12 The reversal in the delay
multivariate results. For the cohorts under consideration, namely people born between 1966 and 1988, the hazard
starting with the 1971-75 cohort, meaning that the age at
1970, the same pattern seen in Figure 5. Based on these results, the median age of marriage for the reference individual has gone from 31 for the 1966-70 birth cohort to 27 for the 1981-85 cohort, keeping all else constant.
This is a somewhat surprising result given the popular
the perception that Egyptian society is going through a marriage crisis. Assaad and Ramadan (2008) argue that the decline in the age at marriage after the 1970 birth cohort can be attributed to the change in housing laws that occurred in the late 1990s that made rental housing more readily available to young people, precluding the need to save large amounts of cash to acquire housing. The concern about the deteriorating labor market conditions facing young men is real, however, and is
we discuss below.
We move to an examination of the results relating to the
hazard of marrying. Since we return to these variables when we present the simulation results, we limit ourselves here to the direction and rough magnitude
nearly two times. As Model (4) suggests, however, this effect is spread out over more than three years, since the
the employment variables are fairly consistent across all four models where they are entered with only a single period lag.
Similarly, migrating abroad and returning from such migration has a fairly large positive effect on the hazard of marrying, with those returning from migration having nearly three times the hazard of marrying than those who did not migrate at all. Again the impact of returning from migration is fairly immediate and raises the probability of marriage one year after returning. It turns out, however, that the duration an individual
of marrying.
Like most previous studies (e.g., Yabiku 2005, Ghimire
the hazard of marrying, but in our case the effect is not
that school attainment in Nepal increases the hazard of
marriage. Compared to an individual with a three-year
for someone with a university degree or higher is about 30 percent lower in Model 3. It is even lower in Model 1, where parental background and region are not controlled for. This is consistent with the interpretation that education in Egypt does more to raise a young man’s expectation about what sort of spouse he should marry than to make it possible for him to afford
of own education on male age at marriage once father’s education is controlled for (Egel and Salehi-Isfahani 2010).
and studies on social class and mobility in Egypt (Nagi 2001), we expect indicators related to social class, such as parental background, to have important effects on

MIDDLE EAST YOUTH INITIATIVE WORKING PAPER | TRANSITIONS TO EMPLOYMENT AND MARRIAGE AMONG YOUNG MEN IN EGYPT 39
education does not affect the hazard of marrying in a
education. Again this contrasts with Iran where father’s
their own education.13 In any case, the results in both
countries show that higher social class or education raises expectations for the quality of spouse more than it increases a young man’s ability to marry and thus delays marriage. This is in contrast to the situation in Nepal (Yabiku 2005) or Yemen (Assaad et al. 2009), where male education speeds up marriage.
Table 14: Discrete-Time Proportional Hazard Model for Hazard of First Marriage with Non-Parametric Time Dependence and a Gamma Mixture Distribution for Unobserved Individual Heterogeneity, Men 18-39 with Secondary Schooling, Egypt, 20061
S
S
S
S
S
S
D
R
R
R
E
G
T
P
U
F
F
F
M
M
M
T S
B S

MIDDLE EAST YOUTH INITIATIVE WORKING PAPER | TRANSITIONS TO EMPLOYMENT AND MARRIAGE AMONG YOUNG MEN IN EGYPT 40
* p<0.05, ** p<0.01, *** p<0.001
1. Exponentiated regression coe"cients indicating hazard ratios. Standard errors in parentheses can be used to test the statistical signi!cance
of the deviation of the exponentiated coe"cient from 1.
2. Baseline model including time-varying employment and migration variables lagged one period, cohort and own educational attainment.
3. Adds to Model 1 parental and family background variables.
4. Adds to Model 2 community and regional level variables.
5. Adds to Model 3 the time-varying employment and migration variables lagged three periods and !ve periods.
6. The coe"cients of the spell dummies are shown in Appendix Table A3.
Note: Italics denote time-varying covariates
S
S
S
S
S
S
D
R
R
R
E
G
T
P
U
F
F
F
M
M
M
T S
B S
S
S
S
S
S
S
D
R
R
R
E
G
T
P
U
F
F
F
M
M
M
T S
B S
Father’s Employment (Ref: Government Employee)Self-employed or employer
Regular wage worker outside government2
Number of sisters
Regional and Community-Level VariablesSex ratio in district of residence in 1996
Alexandria and Suez Canal Cities4
Urban Lower Egypt
Urban Upper Egypt
Rural Lower Egypt
Rural Upper Egypt
Spell Dummies6
Constant
Gamma Variance
Log-Likelihood
Person-yearsN
1.244***(0.075)1.002(0.080)0.985(0.094)1.048**(0.017)
included0.107**(0.018)0.220***(0.050)-5885.014
49,8483,996
1.211***(0.069)0.992(0.075)0.912(0.083)1.026(0.015)
0.853(0.213)0.961(0.086)1.153(0.098)0.904(0.075)1.404***(0.107)1.557***(0.130)included0.091***(0.026)0.000(0.000)-5809.234
49,8483,996
1.199**(0.069)0.991(0.077)0.906(0.084)1..27(0.016)
0.847(0.213)0.960(0.087)1.153(0.099)0.897(0.076)1.409***(0.112)1.551***(0.141)included0.081***(0.026)0.017(0.077)-5798.813
49,8483,996
1.244***(0.075)1.002(0.080)0.985(0.094)1.048**(0.017)
included0.107**(0.018)0.220***(0.050)-5885.014
49,8483,996
(continued)

MIDDLE EAST YOUTH INITIATIVE WORKING PAPER | TRANSITIONS TO EMPLOYMENT AND MARRIAGE AMONG YOUNG MEN IN EGYPT 41
the father’s employment status. Having a father who is self-employed or an employer raises the hazard of marriage by about 20 percent compared to someone whose father is a government employee. This increase in the hazard of marriage in families that own their own
to bring the additional help that a daughter-in-law can provide into the family business. Other paternal
government employment.
We expected that the number of sisters a man has to have a negative effect on his hazard of marrying, but
marginally raise his hazard of marrying in Model 2, but
district with a ‘surplus’ of men relative to women of the appropriate age (i.e., a sex ratio greater than 1) has a negative impact on the hazard of marrying, but the
for other factors, men in rural areas have hazards of marrying that are about one and a half times higher than men in urban areas, with the ratio being higher in rural Upper Egypt than in Lower Egypt. The different urban
urbanized areas have later ages at marriage, which may be due in part to the availability and cost of housing.
Our estimates indicate that there is some remaining unobserved heterogeneity, as measured by the variance of gamma, in Models 1 and 2, but these variances tend toward zero in our preferred Models 3 and 4.
6.3 SIMULATING THE EFFECT OF LABOR MARKET EXPERIENCE ON THE HAZARD OF MARRIAGE
To clarify the impact of the different labor market
we conduct a series of simulations where we vary the
any, and migration for a reference individual.14 If not
and is not a return migrant. Our simulations are based on the estimation results from Model (4), the last model in Table 14. This is our richest model that includes all the time-varying covariates with their full lag structures.
To see how the employment situation of young men affects their transition to marriage, we simulate the following scenarios:
Scenario 1 (“job entry effect”) compares the reference case with the four alternatives relating
employment to the ages of 22, 25, and 28.
timing of getting a ‘good’ job”) examines the
eventualities. The main idea here is to compare a
late with a situation where he enters early but
simulate the following cases and compare them
Scenario 3 (“incidence of migration and timing of return from migration”) compares the impact of migrating abroad and returning at different ages to starting to work early in the domestic labor market.
Figures 7a and 7b show our simulation results for Scenario 1. Figure 7a shows the effect of different
of marrying and Figure 7b shows the same for the cumulative probability of remaining unmarried by a certain age for reference individuals who never
of

MIDDLE EAST YOUTH INITIATIVE WORKING PAPER | TRANSITIONS TO EMPLOYMENT AND MARRIAGE AMONG YOUNG MEN IN EGYPT 42
Figure 8a Figure 8bThe Hazard of First Marriage
by Age, Timing of First Job and Timing of First Good JobThe Cumulative Probability of Getting Married
by Age, Timing of First Job and Timing of First Good Job
Figure 9a Figure 9bThe Hazard of First Marriage
by Age and Age of Return from Migration, if AnyThe Cumulative Probability of Getting Marriedby Age and Age of Return from Migration, if Any
Figure 7a Figure 7bThe Hazard of First Marriageby Age and Timing of First Job
The Cumulative Probability of Getting Marriedby Age and Timing of First Job

MIDDLE EAST YOUTH INITIATIVE WORKING PAPER | TRANSITIONS TO EMPLOYMENT AND MARRIAGE AMONG YOUNG MEN IN EGYPT 43
of the lag structure of the estimates. Thus, for example, the hazard of marrying for a young man who obtains
Figure 7b, we can see that the median age at marriage
is 31. If entry into employment is delayed to age 22, there is hardly any delay in marriage, but if it is delayed to age 28, here is a delay in the median age to 33. If there is no entry into employment at all, the median age goes to 35. These results are in line with those of Egel and Salehi-Isfahani (2010) for Iran where a three-year delay in entry into employment for a secondary school graduate results in about a year delay in the median age of marriage.
perspective, if such waiting enhances the probability of
to investigate. Figure 8a shows that for two individuals entering employment at age 19, one who enters into a
age, the hazard of marrying is initially lower than if one
a year (at age 25) and then exceeds it to catch up with
at that age has a lower hazard of marrying until age 28
age 32.
Figure 8b shows the effect of these scenarios on the probability of being married by a certain age. The median age at marriage is the easiest way to
has a median age at marriage of 27, more than four years earlier than someone who starts working at 19
earlier than someone who waits until age 28 to enter
about three years younger than someone who enters
perspective of reducing age at marriage, it may be worth it for a young man to remain unemployed and
(Scenario 3) relates to the incidence of international migration prior to marriage and the timing of return from such migration. Our results indicate that the actual duration of migration seems not to matter, so we set that duration to the mean value for return migrants, which is 4.5 years. We designate the situation of a reference individual who never goes abroad and starts work at 19 in the domestic labor market as the reference case. As shown in Figure 9a, a young man who migrates and returns at age 22 sees his hazard of marrying rising rapidly after that age. Interestingly, someone who returns at age 25 has a brief period between the ages of 28 and 30 where they have a higher hazard of marrying than someone returning at age 22. As shown in Figure 9b, however, the lowest median age of marriage (26) is for someone who migrates and returns by age 22. This compares to a median age of 27.5 for someone who migrates and returns at 25 and to a median age of 31 for someone who does not migrate and starts working in the domestic market at age 19.

MIDDLE EAST YOUTH INITIATIVE WORKING PAPER | TRANSITIONS TO EMPLOYMENT AND MARRIAGE AMONG YOUNG MEN IN EGYPT 44
7. CONCLUSIONSthe
transition to adulthood for young men in Egypt, namely the transition to employment and the transition to marriage and family formation, with a focus on how the
new entrants, they appear to be, paradoxically, making
contradiction is quickly dispelled when we realize that longer transitions represent longer search durations
For decades, these expectations, at least for educated
in the public sector. As educated young people realize
it becomes increasingly futile for them to spend a long
even create for themselves.
Family background can either lengthen or shorten
whether it contributes more to raising expectations
provides the additional connections and resources
make the smoothest transition to employment, but they may also be the very young people who become trapped in very low productivity employment on a small family farm or family enterprise. Our
to do that are the ones in informal and casual wage employment rather than in self-employment or unpaid family work.
contrary to expectations, the age of marriage for men has not continued to increase in recent years, but that there is evidence of a reversal in that trend for cohorts born after the early 1970s. This reversal
cannot be explained by developments in the labor market, as the pattern of earlier marriage among men is actually strengthened rather than weakened when labor market variables are accounted. We concur with Assaad and Ramadan (2008) who attribute the pattern toward earlier marriage for men in recent years to a change in housing laws in the mid to late 1990s that made rental housing more accessible.
The labor market has affected marriage in two contradictory ways. On the one hand, the trend toward earlier entry into employment has contributed to earlier marriage among young men. On the other hand, we
marriage, so that the recent trend toward lower quality
searches do indeed increase the probability of obtaining
suggests, it may be worthwhile for a young man wishing to marry to extend his search. Someone who
to speed up marriage that a small minority of young men has been able to use is to migrate to work abroad, typically to the Gulf, to save the money necessary for marriage.
implications for policy. We show that getting good
effect on a young man’s ability to signal that he
employment contracts and a lower social insurance burden, current labor market policies and ongoing reform efforts are attempting (with some success) to increase the extent of formality in the Egyptian labor market (Wahba 2009). While it is still too early to study the impact of these labor market reforms on age at marriage, we can already see how similar reforms in the housing market that led to greater access to rental housing have indeed paid off in terms of curbing the delays in marriage among young men. Clearly, other
the domestic market, such as policies that lead to more rapid economic growth, would also help.

MIDDLE EAST YOUTH INITIATIVE WORKING PAPER | TRANSITIONS TO EMPLOYMENT AND MARRIAGE AMONG YOUNG MEN IN EGYPT 45
schooling is helpful so long as it does not reduce the
programs that encourage such early entry and reduce
delays in marriage. Examples of such policies are ones that reduce the cost of hiring new entrants for employers
reduction in social insurance contributions. Finally, policies that make it easier for young men to migrate for work abroad to enable them to save up for marriage would also be helpful in curbing the “waithood” phenomenon. These would include agreements with labor receiving countries on temporary work visas and
circular migration.

MIDDLE EAST YOUTH INITIATIVE WORKING PAPER | TRANSITIONS TO EMPLOYMENT AND MARRIAGE AMONG YOUNG MEN IN EGYPT 46
APPENDIXNON-PARAMETRIC DURATION DEPENDENCE PARAMETER ESTIMATES
Appendix Table A1 - Non-Parametric Duration Dependence in Discrete-Time Hazard Model of Time to First Job, Exponentiated Regression Coe#cients1
Appendix Non-Parametric Duration Dependence Parameter Estimates
P
Appendix Non-Parametric Duration Dependence Parameter Estimates
P
* p<0.05, ** p<0.01, *** p<0.0011See Table 7 for remaining regression coe"cients. Reference category is year 0.

MIDDLE EAST YOUTH INITIATIVE WORKING PAPER | TRANSITIONS TO EMPLOYMENT AND MARRIAGE AMONG YOUNG MEN IN EGYPT 47
Appendix Table A2 - Non-Parametric Duration Dependence in Discrete-Time Hazard Model of Time to Second Job from Starting First Job, Exponentiated Regression Coe#cients1
* p<0.05, ** p<0.01, *** p<0.0011See Table 11 for remaining regression coe"cients. Reference category is year 0.
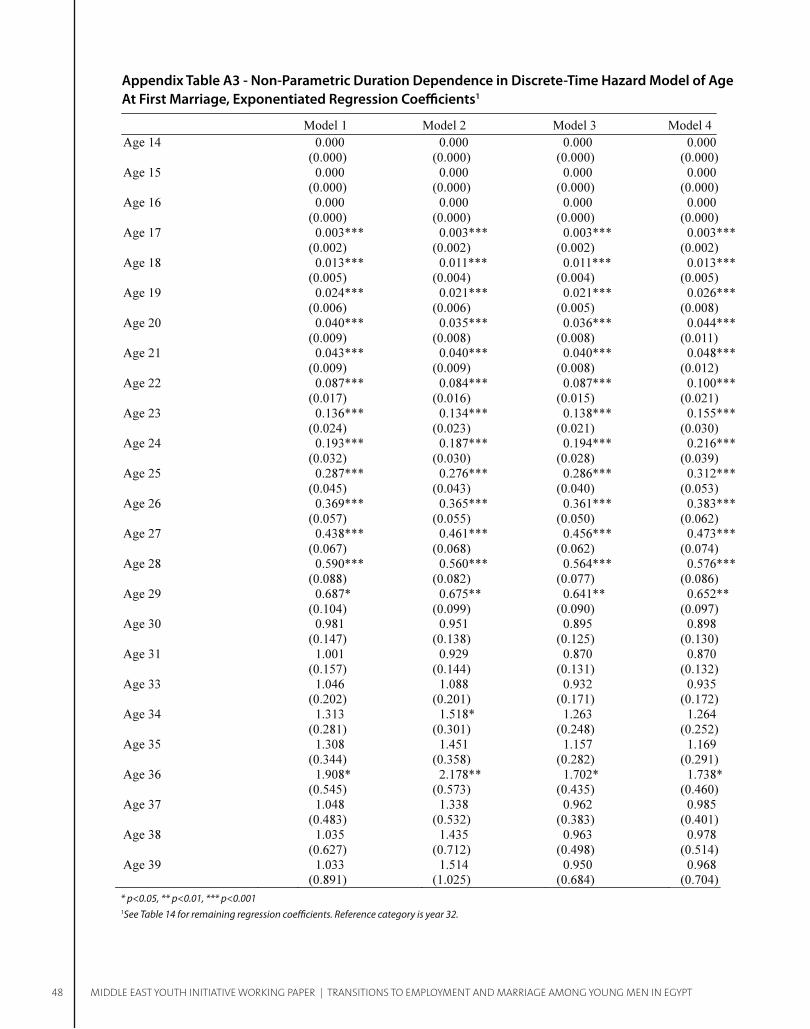
MIDDLE EAST YOUTH INITIATIVE WORKING PAPER | TRANSITIONS TO EMPLOYMENT AND MARRIAGE AMONG YOUNG MEN IN EGYPT 48
Appendix Table A3 - Non-Parametric Duration Dependence in Discrete-Time Hazard Model of Age At First Marriage, Exponentiated Regression Coe#cients1
* p<0.05, ** p<0.01, *** p<0.0011See Table 14 for remaining regression coe"cients. Reference category is year 32.
MIDDLE EAST YOUTH INITIATIVE WORKING PAPER | TRANSITIONS TO EMPLOYMENT AND MARRIAGE AMONG YOUNG MEN IN EGYPT 49
REFERENCES
Evidence from Spain.” 14, 505-21.
Amer, M. (2009). “The Egyptian Youth Labor Market, School-to-Work Transition, 1988-2006.” In Ragui Assaad (Ed.), The Egyptian
Cairo: The American University in Cairo Press.
Anderson, K. H., M. A. Hill, and J. S. Butler (1987). “Age at Marriage in Malaysia.” Journal of
, 223-34.
Andrews, M. and S. Bradley (1997). “Modeling the Transition from School and the Demand for Training in the United Kingdom.” 64, 387-413.
Andrews, M., S. Bradley, and D. Stott (2002). “The School-to-Work Transition, Skill Preferences and Matching.” , C201-C219.
Assaad, R. and F. El-Hamidi (2009). “Women in the Egyptian Labor Market: An Analysis of Developments, 1988-2006.” In Ragui Assaad (Ed.), Cairo: The American University in Cairo Press.
Assaad, R. (2008). “Unemployment and Youth Insertion in the Labor Market in Egypt.” In Hanaa Kheir-El-Din (Ed.), The Egyptian
Cairo: The American University in Cairo Press.
Assaad, R. and D. Mohie (2008). “School-to-Work Transition Indicators with an Application to Egypt.” Report presented to the World Bank Human Development, Education, and Social Protection Sector. Draft.
Assaad, R., R. Roushdy and A. Rashed (2009). “Measuring and Operationalizing Job Quality in Egypt.” Gender and Work in the MENA Region Working Papers Series Number 1. Cairo, Egypt: The Population Council.
Assaad, R. and M. Ramadan (2008). “Did Housing Policy Reforms Curb the Delay in Marriage
Youth Initiative Policy Outlook Number 1. Washington, D.C.: Wolfensohn Center for Development at Brookings and Dubai School of Government. [www.shababinclusion.org]
Bates, L. M., J. Maselko, and S. R. Schuler (2007). “Women’s Education and the Timing of Marriage and Childbearing in the Next Generation: Evidence from Rural Bangladesh.”
(2), 101-12.
Becker, G. S. (1973). “A Theory of Marriage: Part I.” , 813-846.
Becker, G. S. (1974). “A Theory of Marriage: Part II.” , S11-S26.
Bergstrom, T. and B. Schoeni (1996). “Income Prospects and Age at Marriage.” Journal of
, 115-130.
Bergstrom, T. C. and M. Bagnoli (1993). “Courtship as a Waiting Game.” Journal of
, 185-202.
Betts, J. , C. Ferrall, and R. Finnie (2000). “The Transition to Work for Canadian University Graduates: Time to First Job, 1982-1990.” Business and Labour Market Analysis, Statistics Canada. Research Paper No. 141.
Bradley S. and N. Nguyen (2004). “The School to Work Transition.” In G. Johns and J. Johns (Eds.),
. Cheltenham, U.K.: Edward Elgar.

MIDDLE EAST YOUTH INITIATIVE WORKING PAPER | TRANSITIONS TO EMPLOYMENT AND MARRIAGE AMONG YOUNG MEN IN EGYPT 50
Bratberg, E. and O. Nilson (1998). “Transition from School to Work: Search Time and Job
Caltabiano, M. and M. Castiglioni (2008). “Changing Family Formation in Nepal: Marriage, Cohabitation and First Sexual Intercourse.”
(1), 30-39.
Danziger, L. and S. Neuman (1999). “On the Age at Marriage: Theory and Evidence from Jews and Moslems in Israel.”
, 179-93.
De la Rica, S. and A. Iza (2005). “Career Planning in Spain: Do Fixed-term Contracts Delay
Review of , 49-73.
Dhillon, N. and T. Yousef (2007). “Inclusion: Meeting the 100 Million Youth Challenge.” Middle East Youth Initiative Report. Washington, D.C.: Wolfensohn Center for Development at Brookings and Dubai School of Government. [www.shababinclusion.org]
“School Quality, Exam Performance and Career Choice.” Discussion Papers No. 120. Tilburg: Center for Economic Research.
El-Hamidi, F. and J. Wahba (2005). “The Effect of
in Egypt.” Paper presented at the 12th Annual Conference of the Economic Research Forum (ERF), Cairo, Egypt. [http://www.erf.org.eg/
Egel, D. and D. Salehi-Isfahani (2010). “Youth Transitions to Employment and Marriage in Iran: Evidence from the School to Work Transition Survey.” Middle East Development Journal (1), 89-120.
ERF (2006). “Egypt Labor Market Panel Survey of 2006.” Publicly Accessible Database, Economic Research Forum, Cairo, Egypt (www.erf.org.eg).
Ghimire, D. J., W. G. Axinn, S. T. Yabiku, and A. Thornton (2006). “Social Change, Premarital Nonfamily Experience, and Spouse Choice in an Arranged Marriage Society.”
(4), 1181-1218.
Gutiérrez-Domènech, M. (2008). “The Impact of the Labour Market on the Timing of Marriage and Births in Spain.”
, 83-110.
Hoodfar, H. (1997). Between Marriage and the
Cairo. Berkeley: University of California Press.
Hudson, V. M and A.M. Den Boer (2004). Bare
. Cambridge, Mass.: MIT Press.
Hudson, V.M. and A.M. Den Boer (2002). “A
and Sex Ratios in Asia›s Largest States.” (4), 5-38.
Jenkins, S. (1997). “Estimation of Discrete Time (Grouped Duration Data) Proportional Hazards Models: pgmhaz.” Mimeo.
Jenkins, S. (2005). “Survival Analysis, Lecture Notes and Lessons Using Stata.” Mimeo.
Keeley, M. C. (1977). “The Economics of Family Formation.” (2), 238-50.
Kreyenfeld, M. (2000). “Employment Careers and the Timing of First Births in East Germany.” Max Planck Institute for Demographic Research Working Paper, 2000-004.
MIDDLE EAST YOUTH INITIATIVE WORKING PAPER | TRANSITIONS TO EMPLOYMENT AND MARRIAGE AMONG YOUNG MEN IN EGYPT 51
Lassibille, G., L. Navarro Gomez, I. Aguilar Ramos, and C. de la O Sanchez (2001). “Youth Transition from School to Work in Spain.”
, 139-149.
Lenton, P. (2003). “The School-to-Work Transition in England and Wales: Evidence from a Pooled Cross-Sectional Analysis.” Lancaster University Management School Working Paper 2003/006.
Mensch, B. (2005). “The Transition to Marriage.” In C. B. Lloyd (ed.), Growing Up Global: The Changing Transitions to Adulthood in Developing Countries. Panel on Transitions to Adulthood in Developing Countries, National Research Council. Washington, DC: The National Academies Press.
Mensch, B. S., S. Singh, and J. B. Casterline (2005). “Trends in the Timing of First Marriage Among Men and Women in the Developing World.” Population Council Policy Research Division Working Paper 202.
Oxford: Lexington Books.
Nguyen, N. and J. Taylor (2003). “Transition
Educational Attainment.” Lancaster University Management School Working Paper 2003/009.
(1997). “Men’s Career Development and Marriage Timing during a Period of Rising Inequality.” (3), 311-30
Rabe-Hesketh, S. and A. Skrondal (2008). Multilevel
Edition). College Station, TX: Stata Press.
Russell, H., and P. O’Connell (2001). “Getting a Job in Europe: The Transition from Unemployment to Work among Young People in Nine European Countries.” Work,
(10), 1-24.
Singer, J. and J. Willet (1993). “It’s about Time: Using Discrete-Time Survival Analysis to Study Duration and the Timing of Events.”
(2), 155-95.
Singerman, D. (1995).
Princeton, NJ: Princeton University Press.
Singerman, D. (2007). “The Economic Imperatives of Marriage: Emerging Practices and Identities Among Youth in the Middle East.” Middle East Youth Initiative Working Paper Number 6. Washington, D.C.: Wolfensohn Center for Development at Brookings and Dubai School of Government. [www.shababinclusion.org]
Singerman, D. and B. Ibrahim (2001). “The Costs of Marriage in Egypt: A Hidden Dimension in the New Arab Demography.” In Nicholas Hopkins (Ed.), special edition on “The New Arab Family,”
(1/2), 80-116.
Steele, F. (2005). “Event History Analysis.” ESRC National Centre for Research Methods. NCRM Methods Review Papers NCRM/4.
Verdu, C., L. Cortes, and M. Rodriguez (2008). “To
(XVI), 37-59.
Wahba, J. (2009). “The Impact of Labor Market Reforms on Informality in Egypt.” Gender and Work in the MENA Region Working Papers Series Number 3. Cairo, Egypt: The Population Council.
Yabiku, S. T. (2005). “The Effect of Non-family Experiences on Age of Marriage in a Setting of Rapid Social Change.”
(3), 339-54.

MIDDLE EAST YOUTH INITIATIVE WORKING PAPER | TRANSITIONS TO EMPLOYMENT AND MARRIAGE AMONG YOUNG MEN IN EGYPT 52
ENDNOTES
1. While the bride and her family contribute some of the costs of marriage, about 70 percent of these costs on average are covered by the groom and his family according to data from the Egypt Labor Market Panel Survey of 2006 (Singerman 2007; see also analysis in Section 3).
2. According to the Egypt Labor Market Panel
of technical secondary graduates in Egypt continue on to two-year post-secondary institutes and fewer than two percent continue on to university.
3. See Singerman (2007) for a detailed analysis of this data.
4. The impact of having a parent with post-secondary education has opposite effects for fathers and mothers. Post-secondary degrees are fairly rare in Egypt, so these results must be interpreted with some degree of caution.
5. By year 11, 99.8 percent of the individuals in
6. a mean of zero and units of one standard
1998 and 2006 in Egypt are pooled together into a single distribution.
7. understates the quality of self-employment and unpaid family labor because it emphasizes institutional aspects of employment such as the presence of social and medical insurance coverage and paid vacations, which are typically absent in family enterprises.
8. The results reported in Table 10 are corrected for censoring by using a Kaplan-Meier life table estimator.
9. Because there are some missing observations
index, Models 5 and 6 are estimated on fewer
10.
year 14.
11. It is not possible to calculate the median age at marriage for cohorts born after that because less than 50 percent of these cohorts are married.
12. Although all men in the sample are currently over age 18, which is the legal age of marriage, several older men in the sample had married before 18, with the earliest marrying at age 14.
13. These differences in results should be interpreted with caution as there might be
own education and his parents’ education.
14. As before, the reference individual is born between 1966 and 1970, has a three-year technical secondary education, lives in Greater Cairo, and has parents with below secondary education and a father that works for the government. He also has the average number of sisters and lives in a district with the average sex ratio.

MIDDLE EAST YOUTH INITIATIVE WORKING PAPER | TRANSITIONS TO EMPLOYMENT AND MARRIAGE AMONG YOUNG MEN IN EGYPT 53
ABOUT THE MIDDLE EAST YOUTH INITIATIVE
Our Mission
Creating Alliances for Maximum Progress
accelerate the international community’s ability to better understand and respond to the changing needs of young people in the Middle East. By creating an international alliance of academics, policymakers, youth leaders and leading thinkers from the private sector and civil society, we aim to develop and promote a progressive agenda of youth inclusion.
The Middle East Youth Initiative was launched in July 2006 by the Wolfensohn Center for Development at the Brookings Institution in partnership with the Dubai School of Government.
Connecting Ideas with Action
The initiative blends activities in an attempt to bridge the divide between thinkers and practitioners and utilizes robust research as a foundation for effective policy and programs. The initiative has three complementary pillars:
Research and Policy: Pathways to Inclusion
With this initiative, cutting-edge research advances the understanding of economic and social issues affecting young people. The main target group is youth 15 to 29 years old, with a special focus on young men and women who live in urban areas and have secondary or post-secondary education. In addition to addressing needs of older youth, the initiative will also focus on strategies for promoting development of youth 15 years and under in areas such as primary education, skills development and community participation.
The research framework focuses on youth making
from education to employment; and ii) the transition to household formation (marriage and family). Research will concentrate on strategies to achieve inclusion in:
Quality education
Quality employment
Marriage
Housing
Civic participation
Our goal is to examine the relationship between economic and social policies and generate new recommendations that promote inclusion.
Advocacy and Networking: Creating Vital Connections
The initiative aspires to be a hub for knowledge and ideas, open to all stakeholders who can make change happen. Strong partnerships with policymakers,
private sector and civil society organizations, donors and the media will pioneer forms of dialogue that bridge the divide between ideas and action. By bringing in the voice and new perspectives of young people, the initiative will revitalize debate on development in the Middle East.
Practical Action: Life-Changing Impact
Outcomes matter. With a focus on areas with the greatest potential for innovation and impact, the initiative will mobilize partners for practical action that can improve young people’s lives. The initiative will help develop policies and program interventions which provide youth with skills, expand opportunities for employment and facilitate access to credit, housing and civic participation.

ABOUT THE WOLFENSOHN CENTER FOR DEVELOPMENT
The Wolfensohn Center for Development at the Brookings Institution was founded in July 2006 by James D. Wolfensohn, former president of the World Bank and member of the Brookings Board of Trustees.
The Wolfensohn Center for Development analyzes how resources, knowledge and implementation capabilities can be combined toward broad-based economic and social change in a four-tier world.
The following principles guide the center’s work:
A focus on impact, scaling-up and sustainability of development interventions
Bridging the gap between development theory and practice to bring about action
Giving voice to developing countries, with high-level policy engagement and broad networking
A rigorous, independent research approach that draws from multiple disciplines
Working in partnership with others
ABOUT THE DUBAI SCHOOL OF GOVERNMENT
The Dubai School of Government is a research and teaching institution focusing on public policy in the Arab world. Established in 2005 under the patronage of HH Sheikh Mohammed bin Rashid Al Maktoum, Vice President and Prime Minister of the United Arab Emirates and Ruler of Dubai, the school aims to promote good governance by enhancing the region’s capacity for effective public policy.
Toward this goal, the Dubai School of Government collaborates with international institutions such as Harvard University’s John F. Kennedy School of Government and the Lee Kuan Yew School of Public Policy in its research and training programs. In addition, the school organizes policy forums and international conferences to facilitate the exchange of ideas and promote critical debate on public policy in the Arab world.
The school is committed to the creation of knowledge, the dissemination of best practice and the training of policy makers in the Arab world. To achieve this mission, the school is developing strong capabilities to support research and teaching programs including:
Applied research in public policy and management
Masters degrees in public policy and public administration
executives
Knowledge forums for scholars and policy makers


MIDDLE EAST YOUTH INITIATIVE WORKING PAPER | TRANSITIONS TO EMPLOYMENT AND MARRIAGE AMONG YOUNG MEN IN EGYPT 56
Dubai School of GovernmentConvention Tower, Level 13P.O. Box 72229Dubai, United Arab EmiratesTel: [email protected] www.dsg.ae
Wolfensohn Center for Development1775 Massachusetts Ave, NWWashington, DC 20036Tel: [email protected]/wolfensohncenter
M I D D L E E A S T Y O U T H I N I T I A T I V E Visit us at: http://www.shababinclusion.org