transitions in rangeland evaluations
DESCRIPTION
Forest and Rangeland Ecosystem Science Center. Jornada Experimental Range. Transitions in Rangeland Evaluations. David A. Pyke & Jeffrey E. Herrick. Rangeland Evaluations:. Age of Discovery - 1800’s to 1930 Rangeland Uses & Abuses Observations Age of Inventory - 1930’s to 1970’s - PowerPoint PPT PresentationTRANSCRIPT

Transitions in Rangeland Evaluations
David A. Pyke & Jeffrey E. Herrick
Jornada Experimental
Range
Forest and Rangeland Ecosystem Science Center
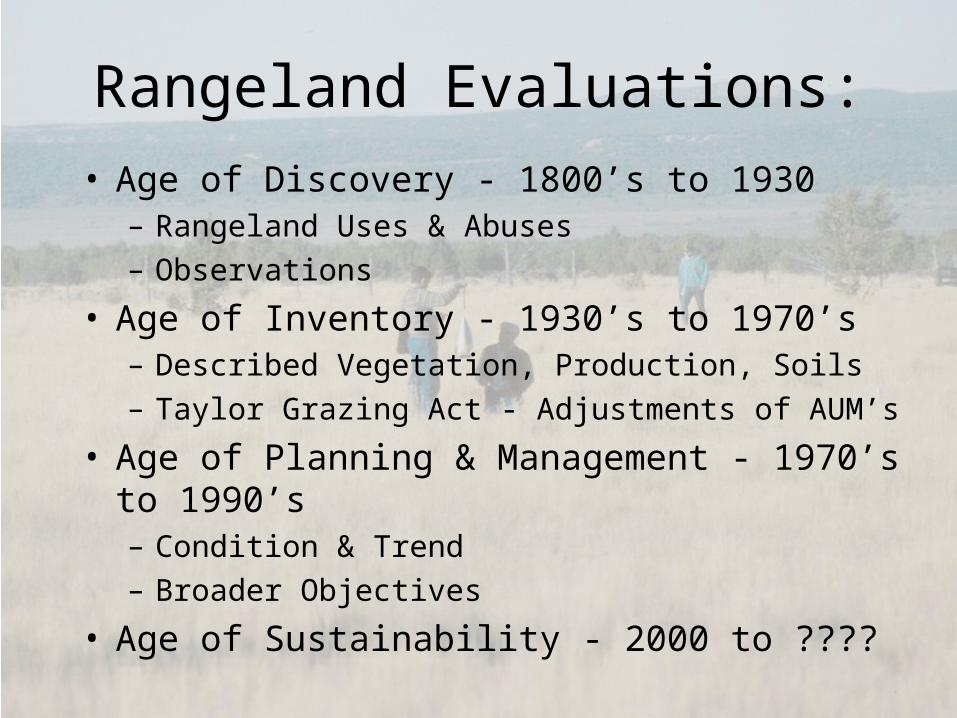
Rangeland Evaluations:• Age of Discovery - 1800’s to 1930
– Rangeland Uses & Abuses– Observations
• Age of Inventory - 1930’s to 1970’s– Described Vegetation, Production, Soils– Taylor Grazing Act - Adjustments of AUM’s
• Age of Planning & Management - 1970’s to 1990’s– Condition & Trend– Broader Objectives
• Age of Sustainability - 2000 to ????
1905
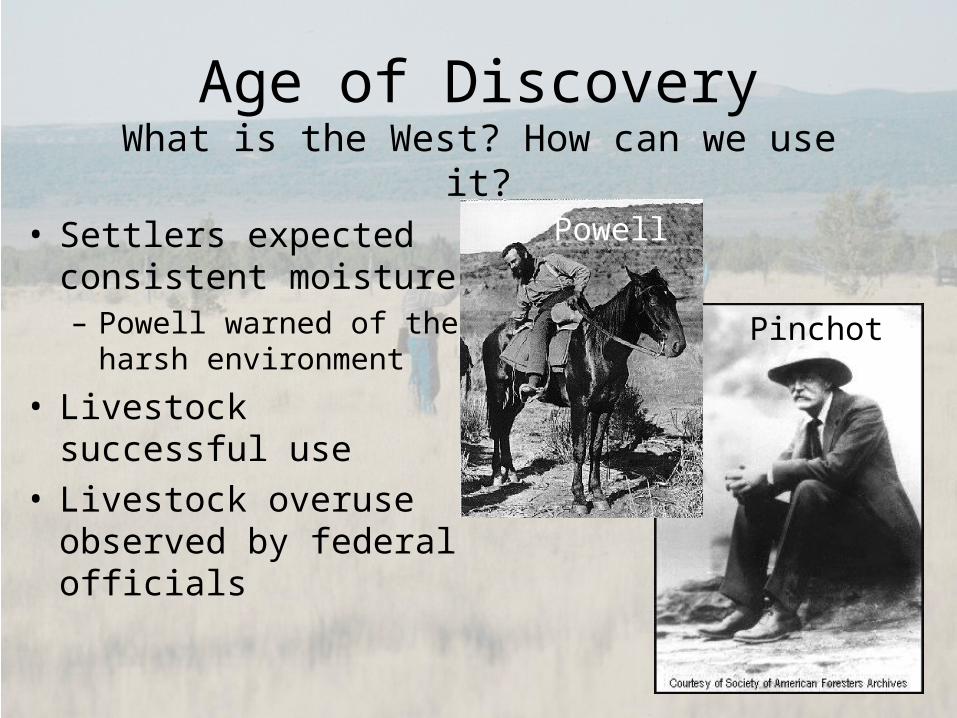
Age of DiscoveryWhat is the West? How can we use it?
• Settlers expected consistent moisture– Powell warned of the
harsh environment
• Livestock successful use
• Livestock overuse observed by federal officials
Powell
Pinchot
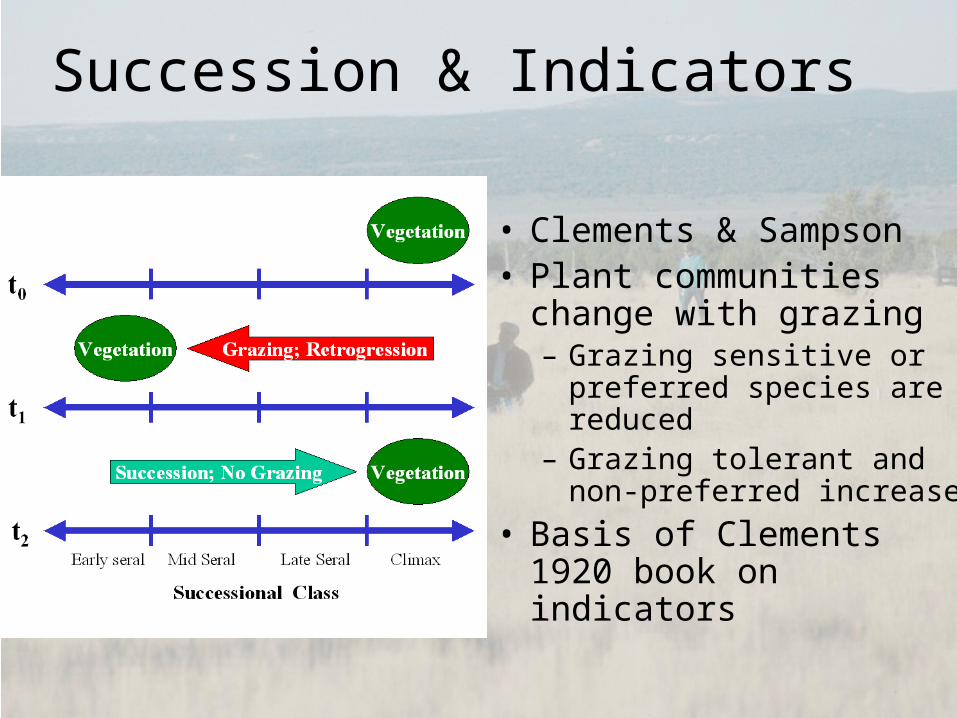
Succession & Indicators
• Clements & Sampson• Plant communities
change with grazing– Grazing sensitive or
preferred species are reduced
– Grazing tolerant and non-preferred increase
• Basis of Clements 1920 book on indicators
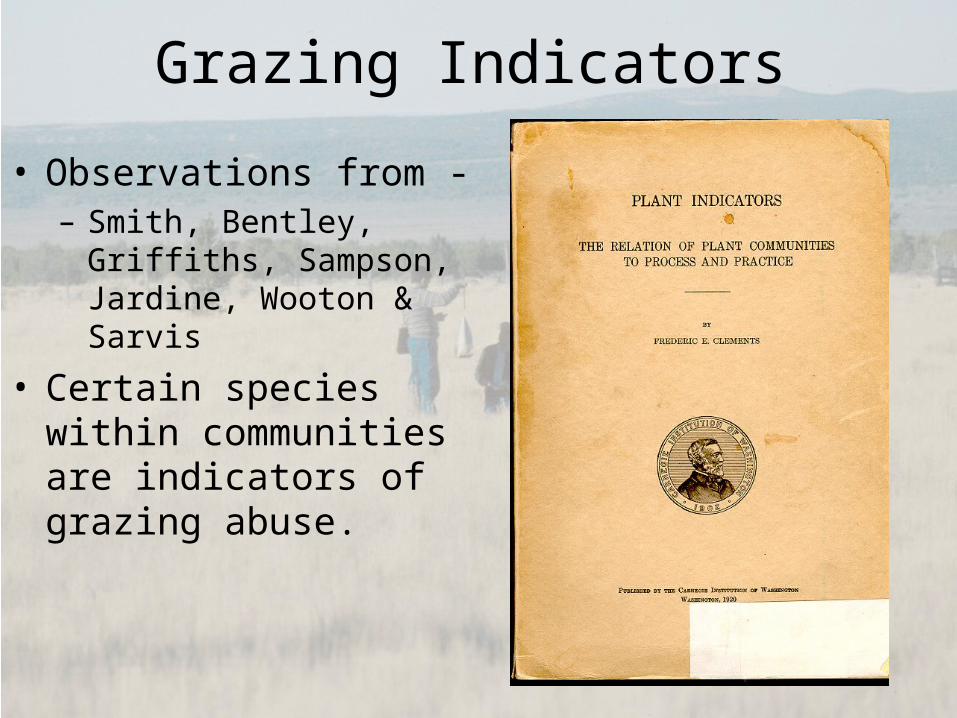
Grazing Indicators
• Observations from -– Smith, Bentley, Griffiths,
Sampson, Jardine, Wooton & Sarvis
• Certain species within communities are indicators of grazing abuse.

1959
Age of Inventory
• Dust Bowl leads to Taylor Grazing Act – Required inventories of the amount of forage
available for livestock
• Stoddart introduces rangeland condition classes
• Dyksterhuis relates Clementsian succession to condition classes
• Rangeland Classification– Dyksterhuis
• Proposes range site concept
– Daubenmire• Habitat types
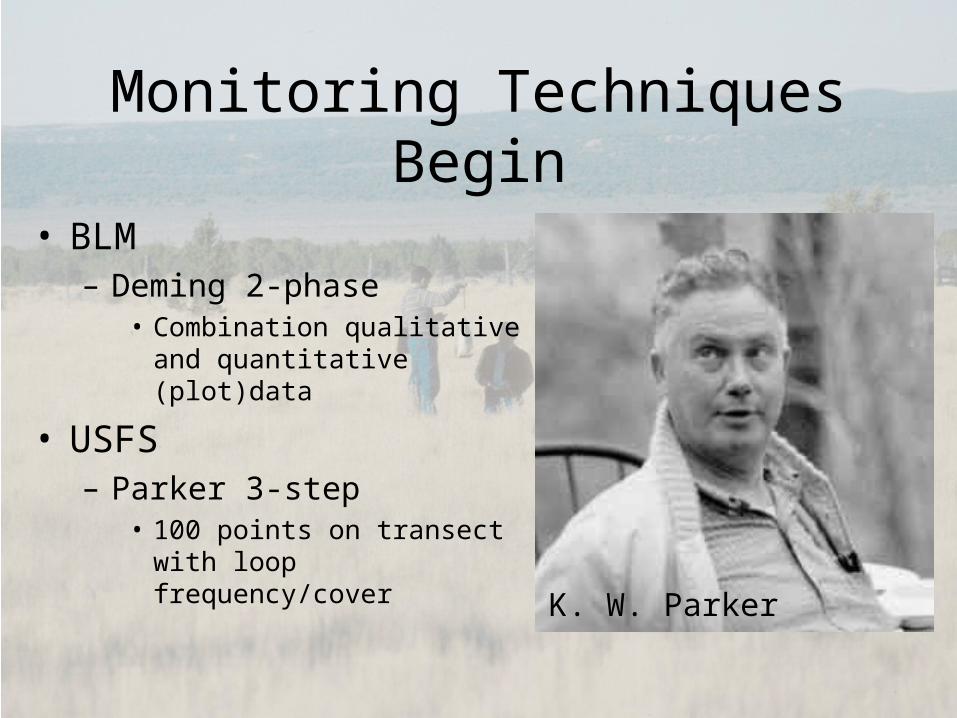
Monitoring Techniques Begin
• BLM – Deming 2-phase
• Combination qualitative and quantitative (plot)data
• USFS– Parker 3-step
• 100 points on transect with loop frequency/cover
K. W. Parker

Monitoring Focus
• Vegetation tends to dominate over soils– SCS still maintains soil-vegetation
emphasis
• Forage plants & undesirable plants are indicators of rangeland status
• Upland communities are the focus– Lands around water sources tend to be
sacrificed
• Wildlife habitat needs are secondary to livestock needs

1978
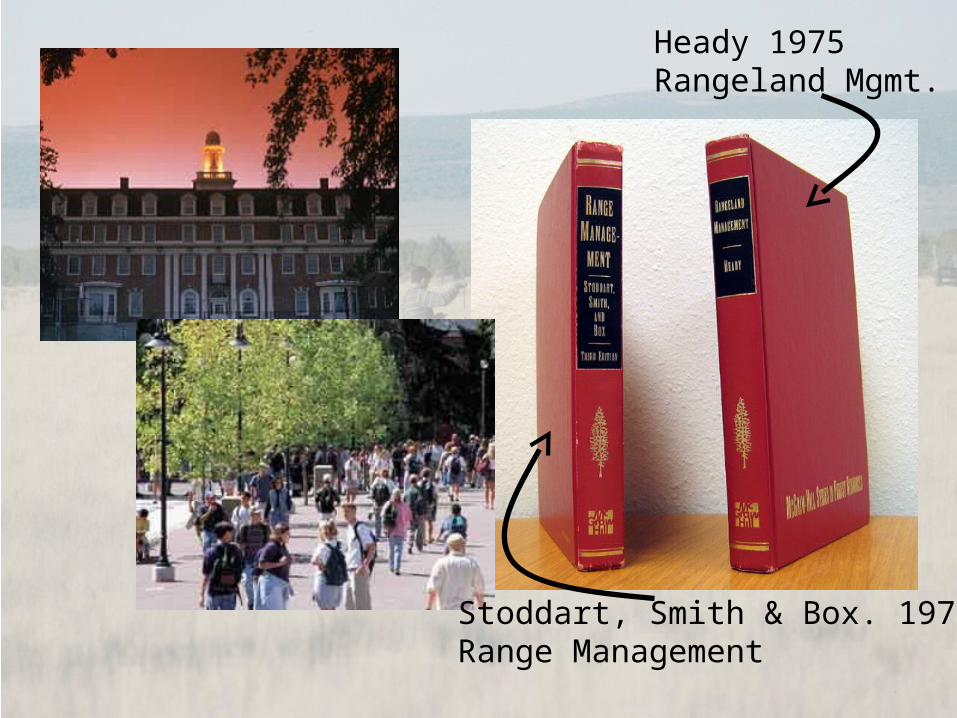
Heady 1975Rangeland Mgmt.
Stoddart, Smith & Box. 1975. Range Management
Congressional Directions
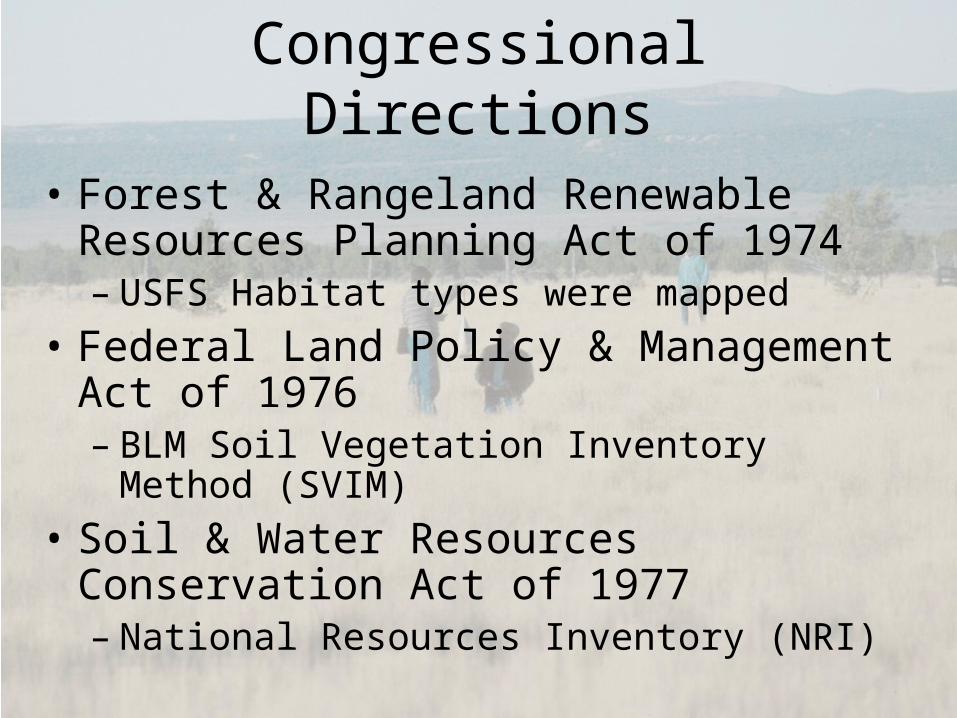
• Forest & Rangeland Renewable Resources Planning Act of 1974– USFS Habitat types were mapped
• Federal Land Policy & Management Act of 1976– BLM Soil Vegetation Inventory Method
(SVIM)• Soil & Water Resources Conservation
Act of 1977– National Resources Inventory (NRI)
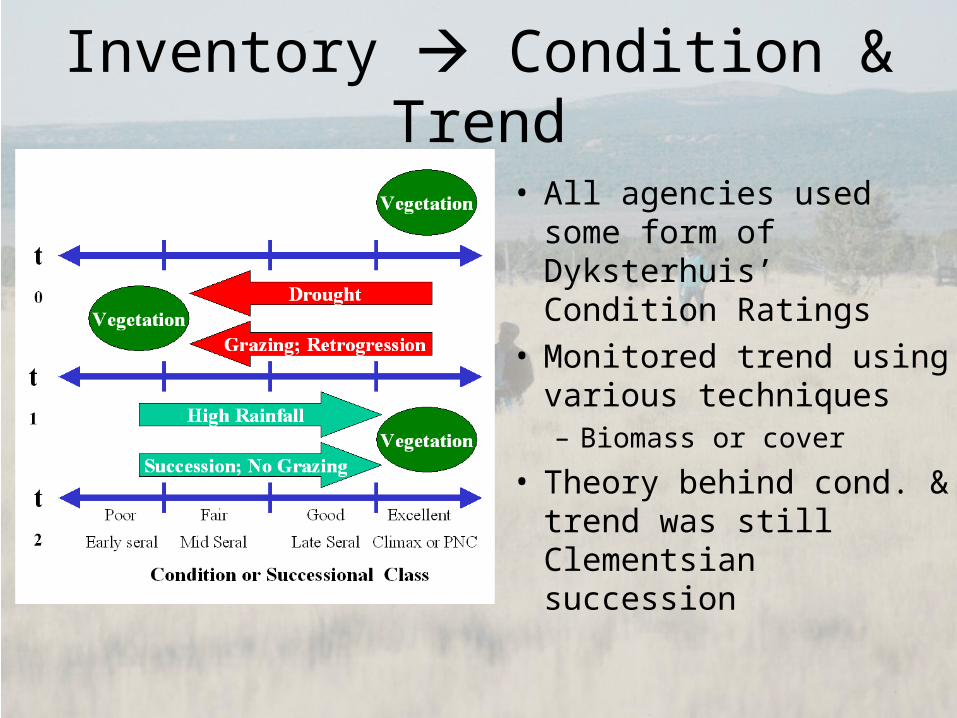
Inventory Condition & Trend
• All agencies used some form of Dyksterhuis’ Condition Ratings
• Monitored trend using various techniques– Biomass or cover
• Theory behind cond. & trend was still Clementsian succession
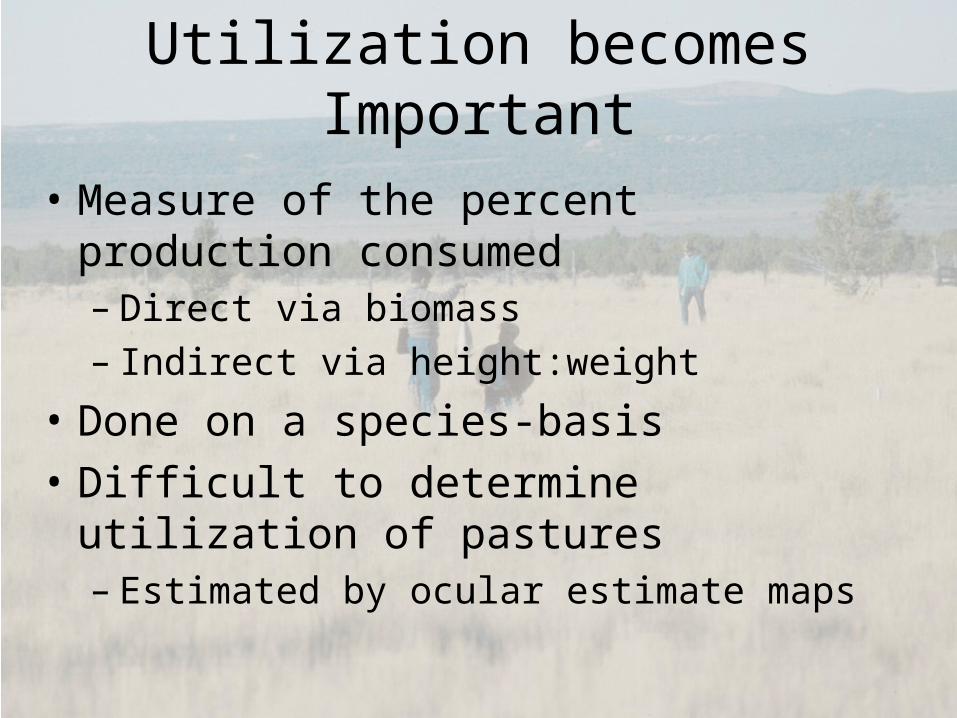
Utilization becomes Important
• Measure of the percent production consumed– Direct via biomass– Indirect via height:weight
• Done on a species-basis• Difficult to determine utilization of
pastures– Estimated by ocular estimate maps
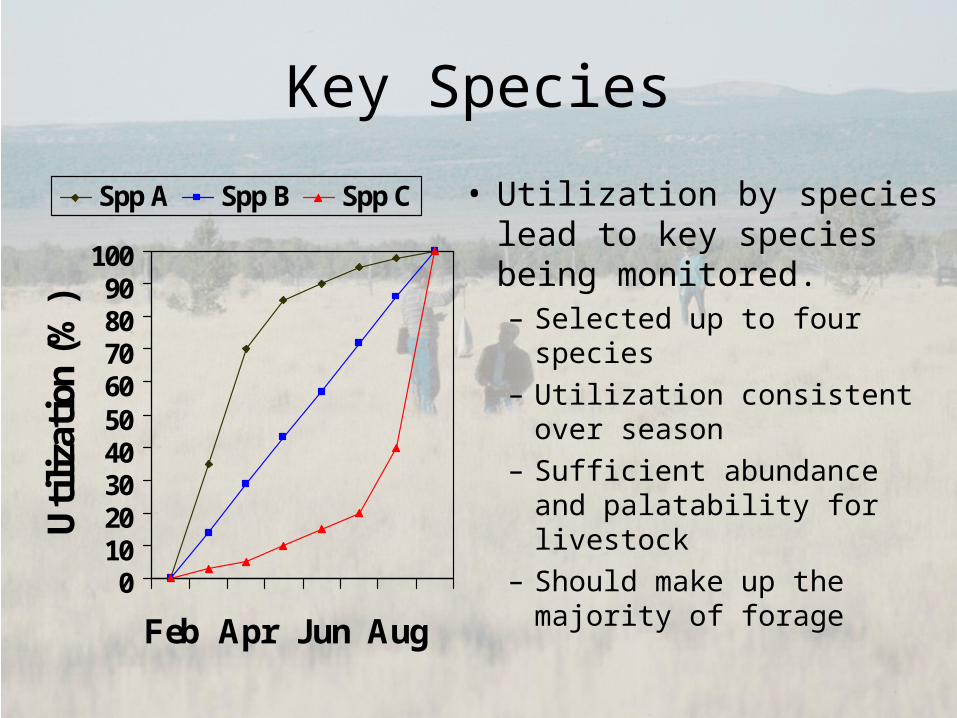
Key Species
0102030405060708090
100
Feb Apr Jun Aug
Uti
liza
tion
(%
)
Spp A Spp B Spp C • Utilization by species lead to key species being monitored.– Selected up to four
species– Utilization consistent
over season– Sufficient abundance and
palatability for livestock– Should make up the
majority of forage
Weakness of Key Species Concept
• Less abundant, highly palatable species are sacrificed– Rangelands recovering from excessive
livestock grazing in the early 1900’s :• Former dominant, but palatable species would
be rare• Some dominant or co-dominant palatable
species might have been sacrificed.• Possible example - Basin Wildrye
Introduction of New Ecological Concepts
• Biological Diversity– Species richness, evenness– Diversity among communities
• Non-equilibrium ecosystem dynamics– State & transition successional models– Thresholds of community change
• Riparian and wetland communities as integral parts of rangelands
• Ecosystem processes– Nutrient & water cycles, energy flow
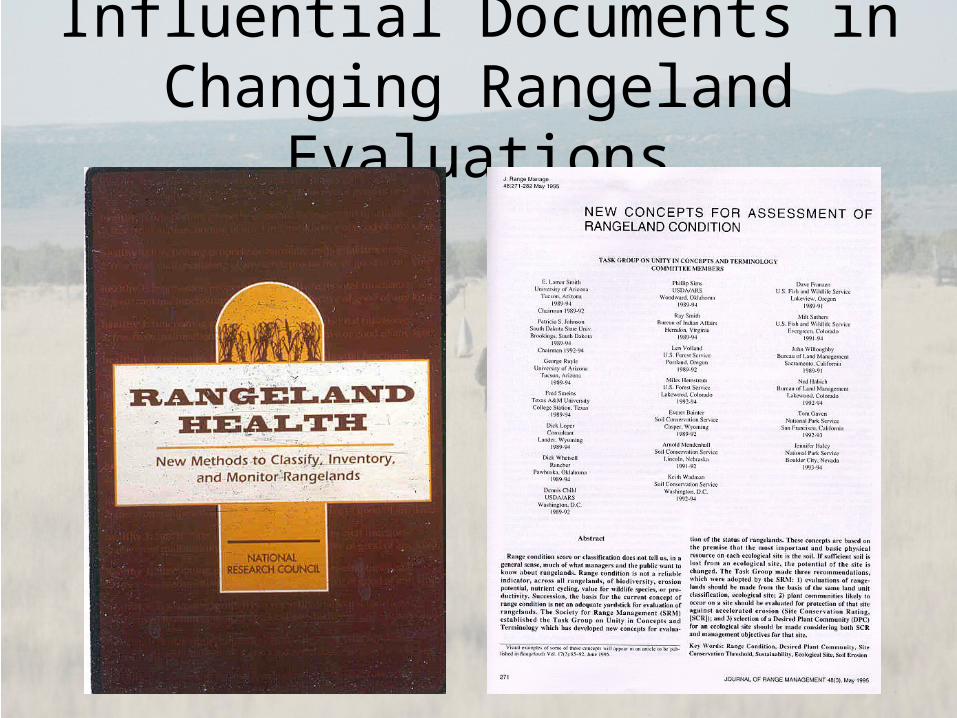
Influential Documents in Changing Rangeland
Evaluations

2004
Age of Sustainability???
• West 2003 - Risk Assessment, Sustainability, Desertification
• Evaluations not focused on single use• Evaluations strive to incorporate
multiple scales• Upland & Riparian ecosystems often
given equal weight in evaluations
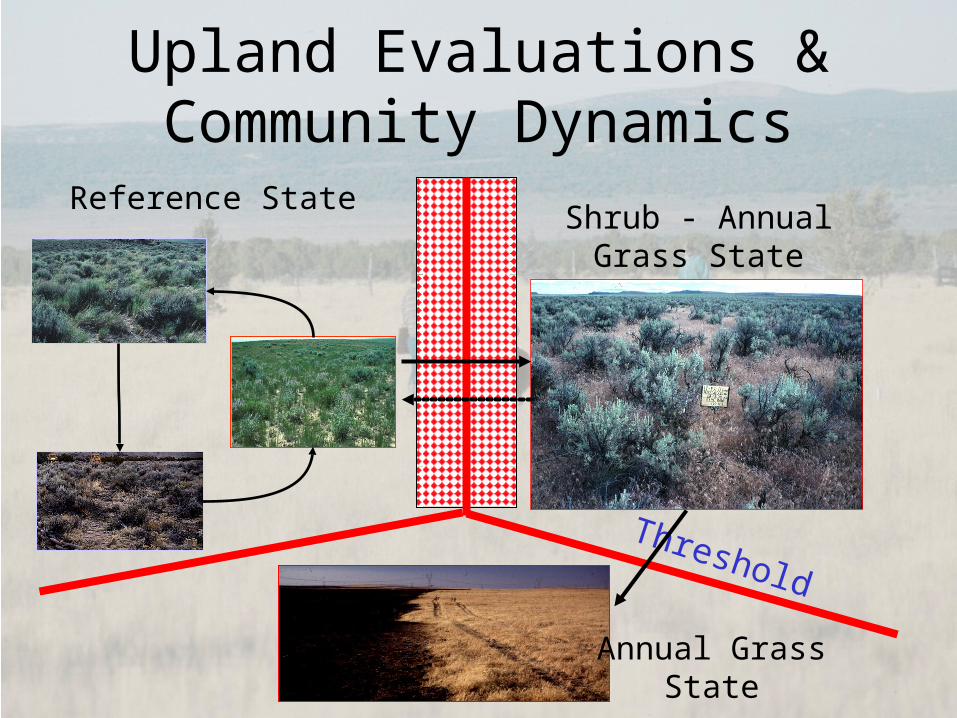
Upland Evaluations & Community Dynamics
Threshold
Reference StateShrub - Annual
Grass State
Annual GrassState
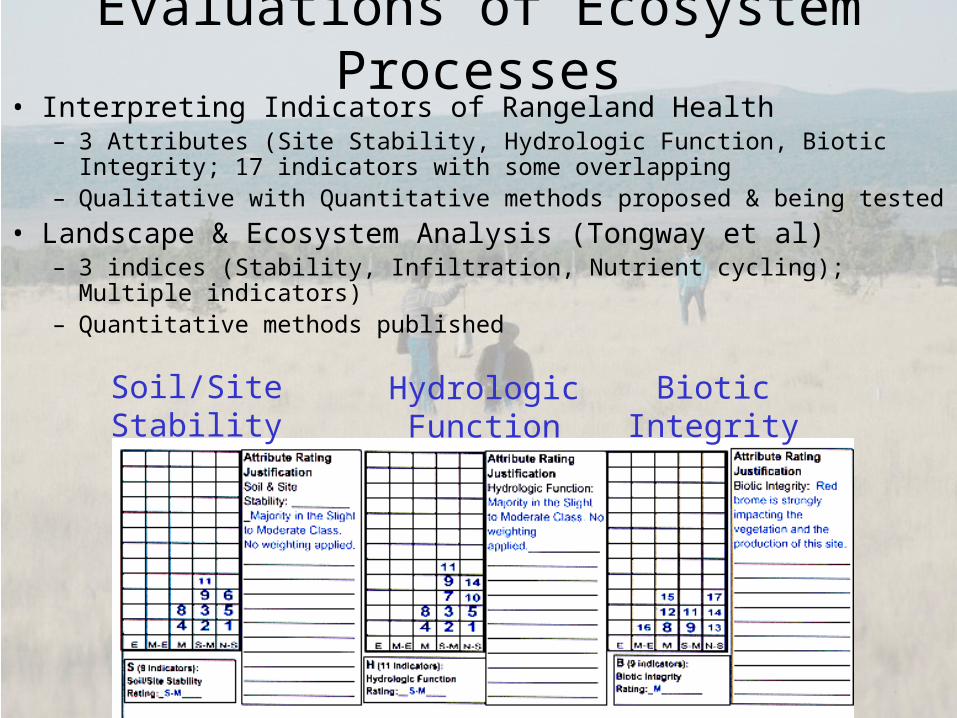
Evaluations of Ecosystem Processes
• Interpreting Indicators of Rangeland Health– 3 Attributes (Site Stability, Hydrologic Function, Biotic Integrity;
17 indicators with some overlapping– Qualitative with Quantitative methods proposed & being tested
• Landscape & Ecosystem Analysis (Tongway et al)– 3 indices (Stability, Infiltration, Nutrient cycling); Multiple
indicators)– Quantitative methods published
Soil/SiteStability
HydrologicFunction
BioticIntegrity
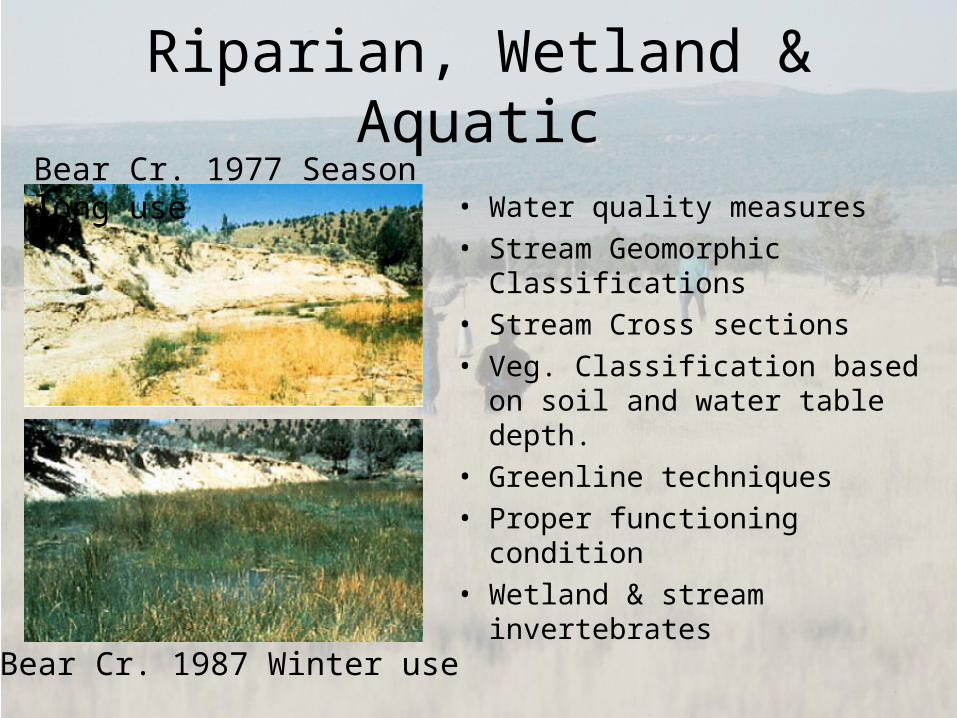
Riparian, Wetland & Aquatic
• Water quality measures• Stream Geomorphic
Classifications• Stream Cross sections• Veg. Classification based on
soil and water table depth.• Greenline techniques• Proper functioning condition• Wetland & stream
invertebrates
Bear Cr. 1977 Season long use
Bear Cr. 1987 Winter use
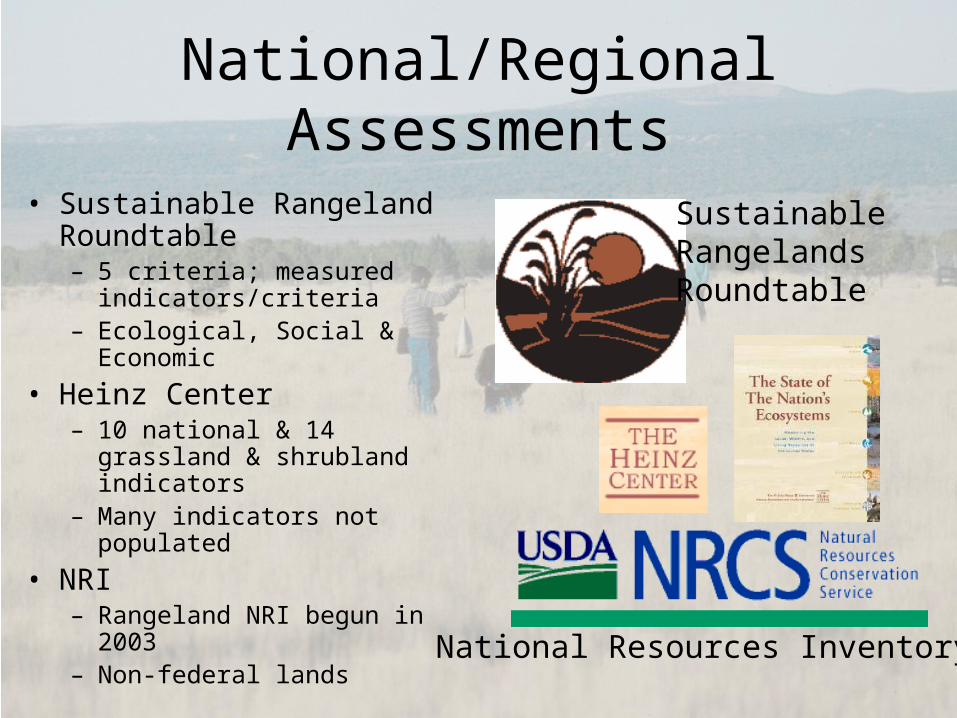
National/Regional Assessments
• Sustainable Rangeland Roundtable– 5 criteria; measured
indicators/criteria– Ecological, Social &
Economic
• Heinz Center – 10 national & 14 grassland
& shrubland indicators– Many indicators not
populated
• NRI– Rangeland NRI begun in
2003– Non-federal lands
National Resources Inventory
SustainableRangelandsRoundtable

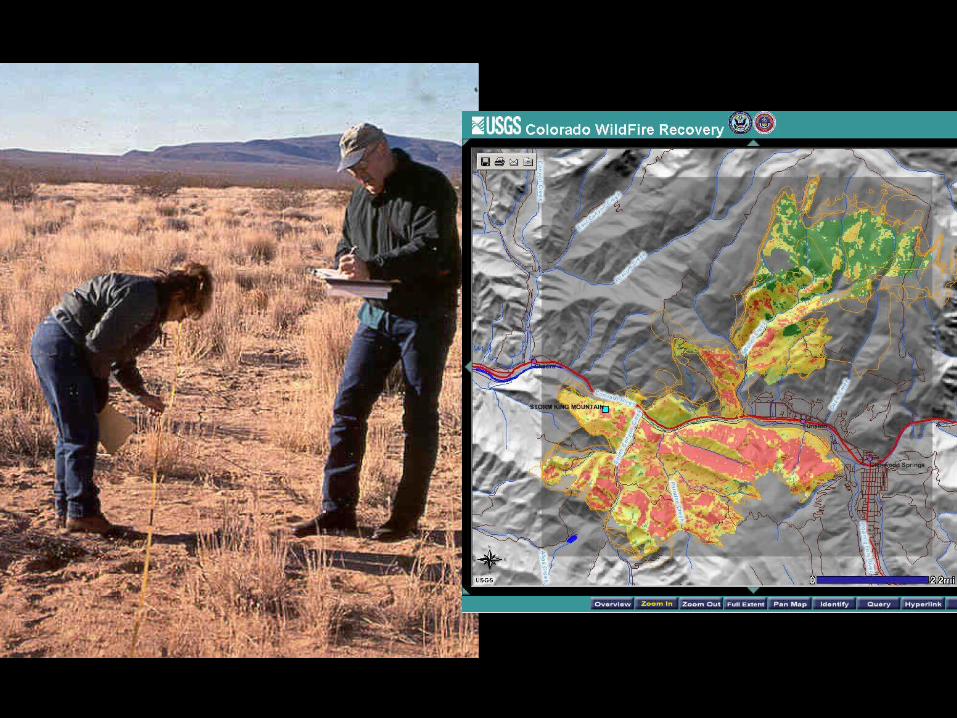
Remote Sensing & GIS
• Combine soil, climate and current vegetation– Large areas– Allows for use of
predictive models• Invasion risk• Erosion potential
• Useful for wildlife habitat assessments– Multiple scales
Wisdom et al. 2003
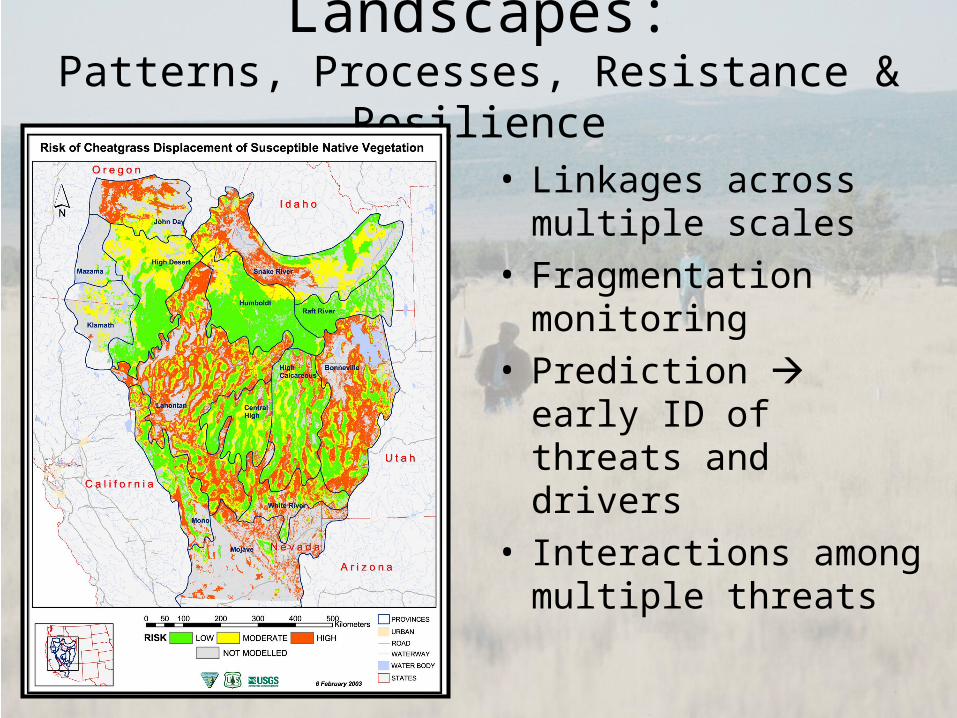
Landscapes:Patterns, Processes, Resistance &
Resilience• Linkages across
multiple scales• Fragmentation
monitoring• Prediction early ID
of threats and drivers
• Interactions among multiple threats
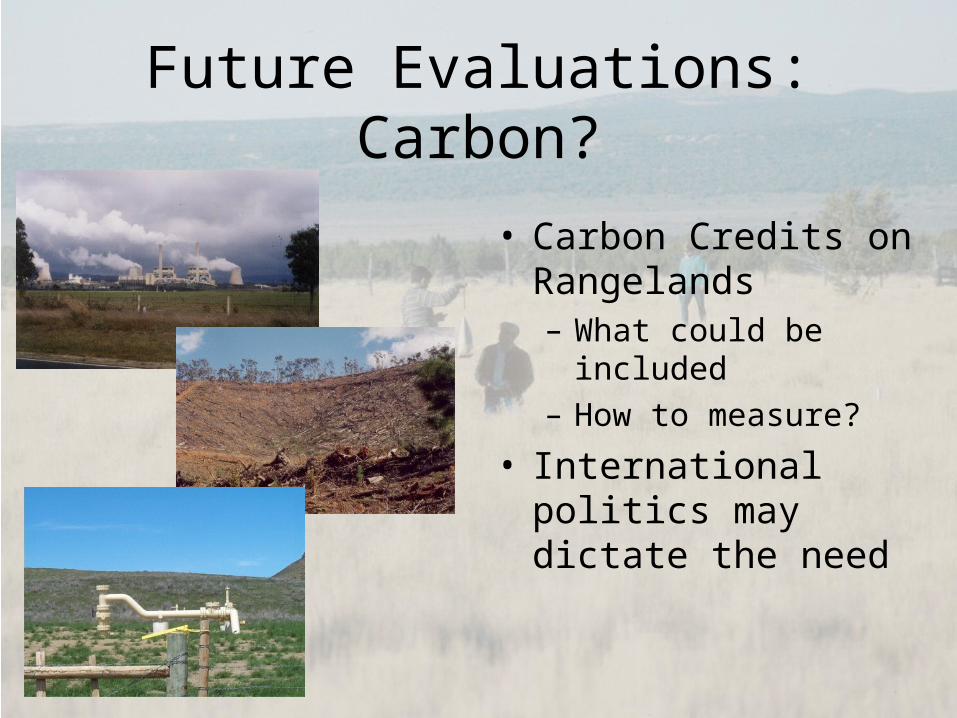
Future Evaluations: Carbon?
• Carbon Credits on Rangelands– What could be
included– How to measure?
• International politics may dictate the need