transition from copper to fiber broadband: the role of dsl ... · the role of dsl speed and...
TRANSCRIPT

Transition From Copper to Fiber Broadband:
the Role of DSL Speed and Switching Costs
Lukasz Grzybowski∗ Maude Hasbi† Julienne Liang‡
September 23, 2016
Abstract
We estimate a mixed logit model using data on choices of broadband technologies by 94,388
subscribers to a single broadband operator in a European country on a monthly basis from
January to December 2014. We find that valuation of DSL connection speed in the range
between 1 and 8 MB/s is very similar. Moreover, in January 2014, the valuation of FttH
connection with speed of 100 MB/s was not much different than of DSL connection with
speed of 1 or 8 MB/s. The valuation however increased over time and in December 2014
it was higher by 59% than of DSL connection with speed of 8 MB/s and by 66% than of
DSL connection with speed of 1 MB/s. The small initial difference in valuation of DSL
and FttH connections may be because basic Internet needs of consumers such as emailing,
reading news, shopping, browsing and even watching videos online can be satisfied with
connection speed below 8 MB/s. We also find that consumers face significant switching costs
when changing broadband tariffs, which are substantially higher when switching from DSL
to FttH technology. According to counterfactual simulations based on our model estimates,
switching costs between technologies are the main factor which slows down transition from
DSL to FttH.
Key Words: FttH, DSL, connection speed, switching costs
JEL Classification: L43,L50, L96
∗Corresponding author: Telecom ParisTech, Department of Economics and Social Sciences, 46 rue Barrault,75013 Paris, France. E-mail: [email protected]†Telecom ParisTech, Department of Economics and Social Sciences, 46 rue Barrault, 75013 Paris, France.
E-mail: [email protected]‡Orange, 78 rue Olivier de Serres, 75505 Paris, France. E-mail: [email protected]
1

1 Introduction
In the last years, the European Commission has been pursuing the objective of providing fixed
broadband Internet access to all households in the European Union. But apart from universal
broadband availability, the Commission also increasingly cares about the quality of access in
terms of broadband speed. According to the Digital Agenda for Europe, by 2020, all EU
households should benefit of at least 30 MB/s connection and at least 50% of EU households
should have adopted 100 MB/s connection or more.1 In September 2016, the Commission further
announced that by 2025 all European households should have access to connections with speed
of at least 100 MB/s. To achieve this objective, the Commission proposed “a new European
Electronic Communications Code including forward-looking and simplified rules that make it
more attractive for all companies to invest in new top-quality infrastructures, everywhere in the
EU, both locally and across national borders.” According to the Commission, these investments
could “boost the GDP of the EU by an additional 910 billion Euros and create 1.3 million new
jobs by 2025”.2 Furthermore, the roll-out of high speed broadband access should enable the
development of new and enhanced digital services, thus raising consumer welfare and increasing
the competitiveness and reach of EU businesses.
Broadband services were originally provided using Digital Subscriber Line (DSL) technology
which relies on copper networks and offers speed up to 8 MB/s and cable modem.3 From
2010 onwards, telecommunications incumbent operators and new entrants in Europe started to
invest in fiber optic networks, which are rolled out up to the customer’s premises (Fiber to the
Home or FttH) and can carry video, data, voice and interactive video-telephone services. FttH
connections should offer speeds of 100 MB/s and more, which match the objectives set out by
the Commission. However, as of June 2015, about 72% of EU households were already connected
to fixed broadband services, of which about 70% used DSL connections.4 The main reason for
such high share of slower DSL connections is that alternative high speed technologies such as
FttH and cable modem are still not available to the majority of EU households. In countries
1“A Digital Agenda for Europe,” European Commission, COM(2010) 245.2Source: “State of the Union 2016: Towards a Better Europe - A Europe that Protects, Empowers and
Defends”3The highest speed of DSL connection is 8 MB/s. ADSL2+ and VDSL provide higher speed in the range
between 8 MB/s and 50MB/s for premises close to the exchange. Thus, these advanced technologies are notavailable to all consumers and especially when the copper line has poor quality.
4Source: European Commission 2015 Digital Scoreboard
2
where cable coverage is similar to DSL both technologies have comparable market shares.5
Since the liberalization of fixed-line telecommunications markets in 1998, the policy and aca-
demic debates focused on how to regulate access to fixed broadband infrastructure owned by
the previous monopolists and incentivize firms to invest in high speed broadband networks. But
the relatively small share of high speed broadband technologies may be influenced by needs and
preferences of consumers with respect to Internet access and by difficulties to switch to other
broadband technologies. First, DSL users may not be aware at all which broadband technology
they currently use to access Internet and how quality of connection would change if they switched
from DSL to FttH or cable modem. With this respect broadband technologies may resemble
experience goods. Second, there may be substantial switching costs between technologies due
to transaction costs, opportunity cost of time and other, which may hold back consumers from
changing tariffs, operators and adopting higher-speed technology. Third, the price difference be-
tween DSL and FttH services may be too high compared to the benefits perceived by consumers
to justify switching. Finally, the presence of indirect network externalities may also slow down
fiber adoption. On the one hand, consumers will switch from copper to fiber technology if they
can access new online content and services. On the other hand, new online content and services
will be developed only if there are sufficiently many consumers with high speed broadband con-
nections.6 For these reasons, it may be a challenge to achieve on time the objectives set out by
the Commission. According to the EU Digital Single Market Report, in December 2014, only
26% of fixed broadband subscriptions had speeds over 30 MB/s and 9% over 100 MB/s.
In this paper, we analyze the role of connection speed and switching costs between tariffs and
technologies in the transition from DSL to FttH. More specifically, we focus on the consumers’
choices of broadband tariffs based on DSL and FttH networks when both technologies are avail-
able at consumer’s premises. We use information on broadband technologies used by 94,388
subscribers to a single broadband operator in a European country on a monthly basis from
January to December 2014. We estimate a mixed logit model of demand for broadband tariffs
5As of December 2014, only 6% of households had access to fiber, 19% to cable broadband and 4% to otherfixed broadband technologies. At the same time, about 59% of households had access to DSL, with large differencesacross Member States determined by the development of fixed-line infrastructure. Historically, Eastern Europeancountries had poorer fixed-line infrastructure and have lower DSL coverage nowadays, compared to almost fullcoverage in most Western European countries. Source: 2015 EU Digital Single Market Report
6Baranes (2014) analyzes theoretically interplay between network investment and content quality on theInternet.
3

in dependence on tariff characteristics including price and speed of DSL connections, which is
calculated using information on copper line loss. In addition, we consider that consumers may
face frictions when changing tariffs and technologies due to switching costs which may therefore
slow down transition from copper to fiber technology. We use the estimated model to conduct
counterfactual simulations, which illustrate the relative importance of broadband speed and
switching costs for consumer choices of DSL and FttH connections.
We find that consumers face significant switching costs when changing broadband tariffs
and technologies. Switching costs are substantially higher when consumers switch from DSL to
FttH tariffs, which may be due to additional costs needed to set up the first FttH connection.
In particular, a consumer needs to make an appointment with an engineer who must visit the
premises to set up a connection. Our counterfactual simulation shows that adoption of FttH,
which stands at 29%, would be higher by about 25 percentage points in the last period in the
data in the absence of additional switching costs from DSL to FttH technology. In the absence
of switching costs between tariffs the share of FttH connection would not change at all, while
in the absence of both tariff and technology switching costs it would be higher by about 62
percentage points reaching adoption share of 91%.
Furthermore, we find that the valuation of speed in the range of 1 to 8 MB/s is very similar,
which may be because basic Internet needs of consumers such as emailing, reading news, shop-
ping, browsing and even watching videos online can be satisfied with connection speed within
this range. Surprisingly, the initial valuation of FttH speed of 100 MB/s was not much different
from 8 MB/s but increased over time. In January 2014, the first month of our data, the valuation
of FttH connection with speed of 100 MB/s was higher by only 3% than the valuation of DSL
connection with speed of 8 MB/s and was higher by 7% than the valuation of DSL connection
with speed of 1 MB/s. In December 2014, the last month of our data, the valuation of FttH
connection with speed of 100 MB/s was higher by 59% than of DSL connection with speed of 8
MB/s and was higher by 66% than of DSL connection with speed of 1 MB/s. Increasing valua-
tion over time reflects growing need for high speed connections, which may be due to availability
of new online services and marketing of FttH connections. However, besides fast changes over
time, the ratio of speed valuations in the last month of the data remains far below the ratio of
speed values.
We use the model to conduct a number of counterfactual simulations which reveal that the
4

speed of DSL connections in the range between 1 and 8 MB/s has no impact on the transition
from DSL to FttH in the presence of switching costs between tariffs. Assuming that speed
of FttH connections is 100 MB/s, the take-up of FttH would not change at all if speed of
all DSL connections varied between 1 MB/s and 50 MB/s. Also, in the absence of switching
costs, the take up of FttH would remain almost unchanged if speed of all DSL connections
varied between 1 MB/s and 8 MB/s, compared to the benchmark case without switching costs.
Moreover, relative to the benchmark case, the share of FttH connections would be lower only by
14 percentage points, if speed of all DSL connections increased to 50 MB/s. These counterfactual
simulations suggest that switching costs between technologies are the main factor which slows
down transition from DSL to FttH.
Due to lack of detailed consumer-level information on technology choices over time, the
literature on adoption of broadband technologies relied mainly on aggregate country-level data.
For instance, Distaso et al. (2006) and Bouckaert et al. (2010) use data on EU and OECD
countries respectively to analyze the role of inter- and intra-platform competition for broadband
diffusion.7 Dauvin and Grzybowski (2014) study the same question using more detailed NUTS 1
regional data for the EU countries. Among few studies which focus on fiber adoption, Wallsten
and Hausladen (2009) use data for 27 EU countries in years 2002-2007 and conclude that the
adoption of Fttx technology is lower in countries in which local loop unbundling (LLU) is more
effective.8 More recently, Briglauer (2014) uses data for 27 EU countries in years 2004-2013 and
finds that more effective regulatory-induced service-based competition has a negative impact on
Fttx subscriptions.
There is also a growing body of literature studying substitution between broadband tech-
nologies based on individual-level data. For instance, Cardona et al. (2009) use survey data
of households in Austria to estimate discrete choice models for Internet access through DSL,
cable and mobile broadband and conclude that there is substitution between fixed and mobile
broadband. Grzybowski et al. (2015) estimate a mixed logit model for households’ choices of
broadband technologies in Slovakia and use the estimates of price elasticities to conclude that
mobile broadband should be included in market definition for DSL. In another paper, Srinuan
7Inter-platform competition happens when entrants build their own infrastructure, while intra-platform com-petition happens when entrants lease access to incumbents’ facilities via local loop unbundling.
8Local loop unbundling is the regulatory process of allowing multiple telecommunications operators to useconnections from the telephone exchange to the customer’s premises.
5
et al. (2012) use discrete choice model and survey data for Sweden and find that mobile broad-
band and fixed broadband technologies are close substitutes when they are locally available.
There are also a few studies which analyze the migration from old to new technologies. For
instance, Ida and Kuroda (2006) use survey data and estimate discrete choice model to analyze
migration from narrowband to broadband in Japan. In another paper also for Japan, Ida and
Sakahira (2008) analyze migration from DSL to FttH technology. They identify income, service
usage such as motion-picture viewing, and type of residence as primary determinants of FttH
subscriptions. They also conclude that there is a significant lock-in effect in technology adoption
but they study inter-temporal choice dependence using survey data from a single time period.
In this paper, we analyze the role of switching costs in the adoption of broadband technologies
following the approach in Grzybowski and Liang (2015). They estimate a mixed logit model using
data on subscribers to mobile services from a single European operator and find that there are
substantial switching costs between tariffs which reduce consumer surplus. Instead, in this paper
we use a sample of subscribers to fixed broadband services. Some of them use quadruple play
tariffs which bundle fixed and mobile services. Our paper is also related to studies which analyze
the role of speed of broadband connections. For instance, Rosston, Savage and Waldman (2010)
use discrete choice experiments to estimate the marginal willingness to pay for improvement
in broadband services in the US in 2003 and 2010. They show that customers’ willingness to
pay for speed is rather low and increases with education, income and on-line experience. A US
household is willing to pay 3$ more in order to enjoy ultra-fast broadband rather than basic
broadband. In another paper, LaRose et al. (2014) find a positive effect of experience on speed
valuation, which confirms that broadband technology resembles experience good.
The remainder of the article is organised as follows. Section 2 presents the data used in
the estimation. Section 3 introduces the empirical model. Section 4 presents the main results.
Section 4.1 presents the counter-factual simulations results. Finally, Section 5 concludes.
2 The Data
In this analysis we use two unique data sets, which were made available to us by a European
telecommunications operator which provides both fixed and mobile services. The first database
includes information on fixed broadband tariffs used by about 10 million customers from the
6

whole customer base on monthly basis from January 2014 to December 2014. Next, we kept only
consumers with premises connected to fiber network, i.e., consumers who are eligible to have
FttH access. We then randomly drew 100,000 consumers. Consumers who left the operator in a
given month were replaced by new arrivals in the same number. We lost a number of consumers
during data cleaning, mainly those using older broadband and mobile tariffs for which we do not
have information. The final sample consists of 94,388 consumers. These customers subscribed
to one of the operator’s broadband offers: (i) a ‘naked’ Internet access offer; (ii) ‘double play’
offer which includes Internet access and fixed telephony over IP (IP Telephony); (iii) ‘triple
play’ offer which includes Internet access with IP Telephony and television over IP (IPTV); or
(iv) ‘quadruple play’ offer which includes IP Telephony, IPTV and access to mobile services.
Moreover, we have information on whether a consumer kept his fixed-line connection for voice
calls (PSTN), in which case he pays extra for it. For each consumer we also have information
on the municipality of the premises where he lives. For each quadruple play consumer we know
the remaining commitment period in months.
For 58,455 customers in this sample we have information on the copper line quality in terms
of the copper line loss measured in decibel as of December 2010 and December 2013.9 The
copper line loss determines the speed of DSL connection which in general may take approximate
values of 1, 2, 5, 7 and 8 MB/s.10 Importantly, the price for DSL access does not depend on
speed. Besides, the speed of FttH connection is approximately 100 MB/s and is not dependent
on the distance from the consumer’s house to the exchange.
The second database includes information on: (i) all the new fixed broadband offers based
on DSL and FttH technologies which were available in each month during the period of our
analysis and (ii) old tariffs which were not available anymore in the period of our analysis to
which consumers subscribed before. For each fixed broadband offer, we have information on
price and other attributes. For quadruple play offers, the attributes include services which are
available on mobile phones. In particular, we have information on voice and data allowance,
whether handset subsidy is included in the offer and what is the contractual commitment length.
9Broadband signals from the exchange suffer attenuation as they travel along the copper line from the exchangeto customer’s house, which reduces the speed of DSL access. In general, the longer is the distance from customer’shouse to the exchange, the higher is the copper line loss. The copper line loss ranges from 1.5dB to 75dB with amean value of 27dB.
10In this analysis we ignore the fact that some consumers who live close to the exchange may use ADSL2+and VDSL connections which provide speed between 8 MB/s and 50 MB/s.
7

We also know whether the offer can only be purchased on the operator’s website. The information
on available tariffs is used to create choice set for each consumer.
These two data sets are completed with additional municipality-level information. For each
municipality, we know whether there is a cable network available which was upgraded to FttLA
(Fiber to the Last Amplifier) and is able to provide high speed broadband connection of above
30 MB/s. This information was extracted from the websites of cable operators and is merged
with the consumer-level data using unique municipality codes. We also extracted information
on the availability of other fiber operators in the municipalities. But since they are available in
the same municipalities in which our operator deployed FttH, this information is not useful in
the estimation.
The Choice Set
Our modeling approach is closely related to Grzybowski and Liang (2015) who study the role
of switching costs in consumer choices of mobile telecommunications services. We borrow from
their paper the description of choice set, switching costs and econometric model.
Modeling consumers’ decisions by means of discrete choice requires definition of choice set.
We construct the choice set for each month in the following way. ‘Old’ consumers, who were
subscribers to broadband services of our operator already in the first month of the data, can
decide to: (i) keep their old tariff; (ii) switch to a new tariff from the list of offers available in
a given month; (iii) leave their current operator’s services. ‘New’ consumers in the first period
do not have in the choice set option (i) to keep the old tariff. Consequently, the choice set is
different for most ‘old’ consumers because of the old tariff, but is the same for all consumers
who are ‘new’ in a given month.
We determine the set of new tariffs in each month using the subscriptions database. We
consider a tariff to be new whenever in a given month there was at least one ‘new’ consumer
who selected this tariff or at least one ‘old’ consumer who switched to it. Otherwise, the tariff is
considered as old and not available in a given month. Hence a new tariff in one month becomes
an old and unavailable tariff in the next month if there are no ‘new’ consumers who choose
it or ‘old’ consumers who switch to it. The total number of unique new tariffs in the time
period considered is 228 out of which 139 are quadruple play tariffs. The number of completely
new tariffs introduced ranges between 108 and 139 per month. The remaining tariffs to which
8

consumers subscribe are considered to be ‘old’ tariffs. There were in total 122 unique ‘old’ tariffs
used by consumers in our sample during 2014.
A consumer’s choice set consists of all the tariffs which are offered by the operator each
month, including the tariff which he used in the previous period but may not be available to
others. However, since consumers may not be aware of all the tariffs which are on offer, an
alternative approach is to limit the choice set of each consumer by drawing a number of tariffs
randomly from all which are available in the current month. Due to a large size of our sample
and choice set we estimate a model which consists of 4-5 choice alternatives. ‘Old’ consumers
who do not switch tariff have the following choices: (i) their ‘old’ tariff; (ii) ‘new’ DSL tariff
which is randomly drawn from the list of offers available in a given month; (iii) ‘new’ FttH tariff
which is randomly drawn from the list of offers available in a given month; (iv) outside option to
leave the operator. Importantly, the new tariff selected by the ‘old’ consumers who switch tariff
in a given month and ‘new’ ones must be in their choice set.11 Thus, ‘old’ consumers who switch
have in the choice set as 5th choice alternative, the ‘new’ tariff to which they switch. ‘New’
consumers, on the other hand, have in their choice set: (i) selected ‘new’ tariff; (ii) ‘new’ DSL
tariff which is randomly drawn from the list of offers available in a given month; (iii) ‘new’ FttH
tariff which is randomly drawn from the list of offers available in a given month; (iv) outside
option to leave the operator.
In general, consumers who do not opt for fixed-mobile bundles, i.e., quadruple play tariffs,
may combine broadband services from our operator with mobile services from our operator or
competitors. These services may be either prepaid or post paid. Moreover, consumers who
choose option (iv) leaving our provider may also mix and match broadband and mobile services
from other operators.
The utility which a consumer derives from these tariffs depends on a set of attributes. The
attributes of broadband only tariffs are: (i) the list price per month; (ii) access to the Internet
via DSL or FttH technology; (iii) the commitment length; (iv) fixed-line PSTN connection. The
attributes of quadruple play tariffs are: (i) the list price per month; (ii) access to the Internet via
DSL or FttH technology; (iii) the commitment length; (iv) whether a handset subsidy is offered
11We also estimated a model with choice set including all ‘new’ tariffs available in a given month which greatlyexpands the size of data. We were able to estimate multinomial logit model which yields almost identical results,except for the coefficient of switching dummy which is greater in magnitude. However, the size of data does notallow estimating mixed logit model.
9

or a SIM card only without a subsidy; (v) whether voice minutes are unlimited and, if not, what
is the volume of minutes included; and (vi) the volume of mobile data in GBs included. In the
case of DSL, the additional information is the connection speed, which is determined by the
copper line loss of consumer’s connection. We construct a set of dummy variables for discrete
tariff characteristics and otherwise use continuous variables. Table (1) shows summary statistics
for ‘new’ and ‘old’ tariffs which are used by consumers in the sample.
Switching Costs
Each consumer can: (i) stick to their current tariff and avoid switching costs; (ii) migrate to a
new tariff with the same operator bearing some switching costs; (iii)) stop using their tariff and
leave for another operator, in which case there are also some switching costs to bear.
Switching costs cause an inertia towards keeping a current plan, even though alternative
tariffs may be more attractive in terms of characteristics and prices. When a consumer decides
to migrate from their current tariff to a new one, the utility gain must compensate the disutility
associated with switching costs, and similarly when a consumer chooses to leave for another
operator. To account for this, we define three types of switching costs variables in the following
way. First, the switching costs dummy takes value zero when a consumer considers choosing
the same tariff as in the previous month and one for all alternative tariffs available in a given
month. This switching dummy is interpreted as the disutility from switching to an alternative
tariff, to which we refer as switching costs between tariffs. Second, the switching costs dummy
for leaving the operator takes value zero for the choice of all tariffs, including the one selected
before, and one for the choice of outside option which is leaving the operator. The lack of precise
information about what consumers do when they choose the outside option causes a problem
with the identification of the costs of switching to the outside option. This is because a dummy
variable for switching to the outside option is equivalent to a dummy variable for the valuation
of the outside option. Hence, this dummy variable represents a combination of disutility from
switching and the utility which a consumer gets from this option. The interpretation of this
dummy variable as switching costs is not appropriate and instead we call it leaving dummy.
Third, consumers who did not have FttH before may have higher switching costs because a visit
from a technician is needed to set up the first fiber connection. There may be also additional
costs for FttH users who decide to switch back to DSL. We refer to these additional costs as
10

switching costs between technologies.
In the case of switching to alternative tariffs, since there are no tariff dummy variables used
in the estimation, the switching costs dummy may also include the utility from these alternative
tariffs. However, if tariff attributes which we use in the estimation fully represent the utility of
the tariff, the coefficient on the switching dummy can be interpreted as switching costs. The
consumer database includes information on tariff used by a consumer in each month. It also
includes the length of the remaining commitment period in months in the case of quadruple play
tariffs, which may influence the ability of the consumer to switch tariff or to leave the operator.
In general, consumers can freely switch tariffs during their commitment period.
Another problem with the identification of switching costs are unobserved time-persistent
preferences. Following Heckman (1981), consumer behavior may be state dependent because of
true and spurious factors, where true state dependency is a consequence of all observable factors,
including switching costs and spurious state dependency results from persistent heterogeneity
in preferences for brands. Consumers may continue using the same tariff because it better fits
their individual tastes. When spurious state dependency is ignored, the parameters representing
switching costs may be overestimated, i.e., state dependency in choices of tariffs appears to be
only due to switching costs. We allow for unobserved time-persistent individual preferences by
means of mixed logit estimation for panel data. We use two random coefficients in the estimation
on price and switching costs.
The total number of tariff switches made by consumers in our sample in 2014 is 46,760 out
of 992,550 monthly tariff choice observations, which represents 4.7%. There is some variation in
the number of switches per month ranging between 3.3% and 5.5%. Table 3 shows the number of
switchers in the database, which indicates that 60% never switched a tariff, 32% switched once,
7% twice and 1% three times or more. These numbers suggest that switching tariffs during the
period of one year is relatively frequent but less common than in the case of mobile services, as
reported in Grzybowski and Liang (2015).
3 Econometric Model
We estimate discrete choice model, where in a given month each individual chooses tariff which
maximizes his utility from the choice set described above. We use standard linear utility spec-
11

ification which depends on tariff characteristics and observable and unobservable individual
characteristics. We account for the heterogeneity in preferences using random coefficients on
price and switching costs dummy. The utility of individuals i = 1, ..., N derived from tariff
j = 1, ..., J in month t is given by:
Uijt = x′jtβ − αipjt + s′ijktγi + εijt = Vijt + εijt. (1)
where the price of tariff is denoted by pjt, and αi is the individual-specific valuation of price.
Note that all consumers are presented with the same prices of tariffs which are independent of
usage. In the case of broadband only tariffs, the vector x′jt includes the following variables: (i)
a dummy for DSL broadband; (ii) a dummy for FttH broadband; (iii) connection speed; (iv)
dummies for 12 and 24 months contracts; (v) a dummy for fixed-line PSTN connection. In
the case of quadruple play tariffs, the following variables are included: (i) a dummy for DSL
broadband; (ii) a dummy for FttH broadband; (iii) connection speed; (iv) a dummy for handset
subsidy; (v) a dummy for web only offer without commitment; (vi) dummies for 12 and 24
months contracts; (vii) a dummy for unlimited voice minutes; (viii) mobile data included in the
offer.
The vector of switching dummies is denoted by s′ijkt and coefficients γi represent the disutility
from switching which approximates switching costs. As discussed in the previous section, we
consider two types of switching dummies. The first one takes value zero if consumer i in the
previous month t − 1 used alternative k = j and otherwise value one when k 6= j. The second
one takes value zero for the choice of any tariff and one for the choice of outside option, which
is leaving the operator. This is disutility or benefit from leaving the operator. We also allow
for additional switching costs when consumers consider switching to other technology. For users
of quadruple play tariffs switching costs are also allowed to vary in relation to the number of
commitment months left. We discussed the identification of switching costs in the previous
section.
Finally, εijt is the individual-specific valuation for tariff j at time t, i.e., the “logit error
term”. It is assumed to be identically and independently distributed over tariffs and individuals
according to type I extreme value distribution. The random coefficients (αi, γi)′ can be written
as: (α, γ)′ + νi, where (α, γ) are mean valuations and νi ∼ N(0,Σ) is randomly drawn vector
12

from normal distribution with Σ being a diagonal matrix elements of which represent standard
deviations around the mean valuations. In our empirical analysis there are no observable indi-
vidual characteristics which influence the valuation of tariff attributes because such information
is confidential.
An individual i chooses in month t tariff j with the highest utility among all the available
alternatives, i.e., if Uijt = maxn∈Cit Uint, where Cit is individual i’s choice set in month t. The
expression for the probability that individual i makes a sequence of tariff choices is standard as
well as estimation strategy by means of simulation, as shown in Grzybowski and Liang (2015).
The algorithm for estimating a mixed logit model is explained in detail in Train (2003) .12 After
the estimation, we conduct counterfactual simulations and compute changes in consumer surplus
after removal of switching costs and changes in speed of DSL connections (see Small and Rosen
(1981) for the consumer surplus formula).
4 Estimation Results
The estimation results for mixed logit model are shown in Table 5. We estimate three model
specifications: (i) without speed of connections but with DSL and FttH dummy variables; (ii)
with speed of connections in logarithm and (iii) with a set of dummy variables for the speed of
connections. The speed of DSL connection depends on copper line loss and is the same for all
DSL tariffs in the choice set of an individual consumer. It varies across consumers with the range
of possible values is 1, 2, 5, 7 and 8 MB/s, for which dummy variables are constructed. The
speed of FttH connection is assumed to be 100 MB/s for all consumers. The estimation results
are insensitive with respect to the assumption on the speed of FttH connection of 100 MB/s,
which we tested using alternative speed values of 50 and 200 MB/s.13 We cannot estimate a
model which includes both the connection speeds and technology dummy variables because of
collinearity. The first estimation is conducted for a sample of 94,388 consumers and the other
two for a sample of 58,455 consumers due to missing data on the speed of DSL connections for
the remaining consumers.
12We estimate the mixed logit model using Stata procedure mixlogit with 50 Halton draws. See Hole (2007)for estimation details.
13The log-likelihood value is also lower for models with FttH speed of 50 MB/s and 200MB/s than with 100MB/s.
13

In the first estimation without connection speed, consumers have a positive valuation of DSL
and FttH connections relative to the choice of the outside option. The valuation is higher for
FttH, which is due to higher connection speed. But the valuation of FttH connection may be
also influenced by marketing activities and other factors. Moreover, the valuation depends on
whether consumers live in areas in which cable broadband is available. The availability of cable
broadband reduces the valuation of both DSL and FttH. This may be due to a higher valuation
of the outside option in these geographic areas. Consumers who live in these areas and opt to
leave our operator can get better deals in terms of connection speed and other services. In the
second estimation, with the log of speed and the log of speed interacted with time trend, both
variables are highly significant. Consumers have positive valuation of speed which diminishes
for higher speed values due to logarithmic specification. Moreover, the value of speed increases
over time, which may be due to increasing availability of online services which require high
speed connections. In the third estimation, we use a set of speed dummy variables instead of
log of speed. In addition, these dummy variables are interacted with time trend. The parameter
estimates on all speed dummy variables are very similar, which suggests that consumers have
almost the same valuation of DSL connections with speed of 1, 2, 5, 7 and 8 MB/s. Surprisingly,
the valuation of speed of 100 MB/s is not much higher in the first month in the data.
In February 2014, the second month of our data, the valuation of FttH connection with
speed of 100 MB/s was (8.929 + 0.551 ∗ 2 − 9.748)/9.748 = 3% higher than the valuation of
DSL speed of 8 MB/s and 7% higher than the valuation of DSL speed of 1 MB/s. In December
2014, the last month of our data, the valuation of FttH connection of 100 MB/s was 59% higher
than the valuation of DSL speed of 8 MB/s and 66% higher than the valuation of DSL speed
of 1 MB/s. The interaction term of dummy variable for FttH speed of 100 MB/s with time
trend is significant and positive, while it is insignificant for DSL speed dummy variables. Thus,
the valuation of high speed access increases over time, which may reflect growing demand for
Internet-based multimedia applications, such as online streaming, data cloud, IPTV and other
bandwidth intensive applications. However, besides fast changes over time, the ratio of speed
valuations in the last month of the data remains far below the ratio of speed values. Thus,
consumers have diminishing returns to speed, which may be due to the fact that many key
online activities such as emailing, reading news, shopping, browsing and even watching videos
does not require speed above 8 MB/s.
14

The other coefficients are in general significant with anticipated signs. In particular, the
price coefficient is significant and negative. The estimate of price coefficient may be biased if
consumers who are heavy Internet users tend to choose more expensive FttH tariffs rather than
slower and cheaper DSL tariffs. We mitigate this problem by estimating mixed logit model
and allowing for consumer-specific unobserved price responsiveness. We observe that consumers
differ with respect to price sensitivity since the standard deviation on the price coefficient is
significant for the first and third estimations.
The valuation of the contract length is different for triple play and quadruple play tariffs.
For triple play tariffs, consumers have a negative valuation of 12-month contracts but they
positively value 24-month contracts relative to no commitment. The positive valuation may
be due to the fact that these contracts are targeted at business and self-employed consumers
including tailored features such as dedicated professional portals, significant data storage, fixed
IP address and so on. For quadruple play tariffs, consumers have a negative valuation of 12-
month contracts relative to no commitment, while the coefficient on 24-month is insignificant.
Moreover, consumers have negative valuation of PSTN as a component of triple play offers.
Next, quadruple play tariffs with terminal subsidy are less valued on average. In practice, it
is more costly to purchase a subsidized handset, for which customers pay each month during
the length of their contract, than to purchase a handset without subsidy. Finally, tariffs with
unlimited phone calls are more valued as well as tariffs with higher mobile data allowance.
We find that consumers face significant switching costs between tariffs, which increase when
the remaining commitment period is longer. Moreover, there are additional switching costs
between technologies, from DSL to FttH and the other way around, which in absolute value
are much higher than switching costs between tariffs. As we discussed earlier, the additional
switching cost may be stemming from the fact that appointment with an engineer is needed to
set up the first fiber connection. As shown in Table 3, there are some consumers who switch back
to DSL. Based on information from industry experts, this is due to dissatisfaction with FttH
connection resulting from noisiness of the modem or aesthetic reasons. Switching costs from
FttH to DSL tariffs are also much higher than between tariffs based on the same technology.
We also find that switching costs to FttH significantly decrease in area in which there is upgraded
cable. This may be due to intense marketing campaign in these areas since the operator tries to
convince consumers to switch from DSL to FttH technology not to lose them to cable offers of
15

competitors. These marketing campaigns make consumers better informed about the availability
and benefits which fiber brings in terms of higher speed. We also observe that consumers have
different switching costs since the standard deviation on the coefficient of switching costs is
significant for all three estimations.
4.1 Counterfactual Simulations
There is an ongoing debate on how to incentivize development of fiber networks, in which one
of the key issues is the substitution between DSL and FttH technologies. We use the model
to conduct a series of counterfactual simulations to contribute to this debate. In particular,
we analyze the role of connection speed, price and switching costs in the transition from DSL
to FttH technology. Price and speed differentiate the commercial offer of both technologies, so
we should understand how much premium are consumers willing to pay for high speed FttH
connection. A related question is whether DSL operators should upgrade connections to VDSL
or ADSL+ technologies with speed between 8 and 50 MB/s in areas in which FttH will not be
deployed anytime soon. The opinions on this issue are mixed. The argument against is that
VDSL may delay deployment of fiber network. The argument in support is that higher VDSL
speed has an immediate positive effect on welfare and increases consumer awareness of speed,
which may stimulate further migration to high speed FttH technology. Moreover, for rapid
transition process, the price difference should also take into consideration the magnitude of
switching costs between tariffs and technologies. We found that there are substantial switching
costs which may hold consumers back from changing tariffs, operators and from adopting FttH
technology. Thus, to assess the role of speed and price for technology transition without the
interference of switching costs, we need to simulate outcomes in the absence of switching costs.
We conduct the following counterfactual simulations. First, we assess the role of switching
costs. The market shares of FttH are predicted by setting different switching costs to zero and
holding prices and speeds unchanged. Second, we analyze the role of connection speed in the
presence and absence of switching costs. For these two cases, we predict market shares of FttH
for different values of speed of DSL connections in the range between 1 MB/s and 8 MB/s.
We also make predictions of FttH shares for speed of DSL connections of 50 MB/s, which is
16
achievable by VDSL or ADSL+ technology.14 Third, we analyze the role of price difference
between DSL and FttH tariffs.
In the first counterfactual, we assume that there are no additional switching costs to FttH
technology by setting their coefficient to zero. In the second counterfactual, we assume that
there are no switching costs between tariffs but there are additional switching costs to FttH and
DSL technologies. In the third counterfactual, we assume that there are no switching costs at
all. In the current base case, the penetration of FttH in the sample of consumers is 29%. The
penetration of FttH would increase to 54% in the first counterfactual, would stay at 29% in
the second counterfactual and would increase to 91% in the third counterfactual. The average
consumer surplus would increase by 14.9 Euros in the first case, 8.45 Euros in the second case
and 44.4 Euros in the third case. Based on these estimates we can conclude that switching costs
between technologies have the greatest impact and slow down the transition process from DSL
to FttH. Switching costs between tariffs, which may be due to transaction costs, uncertainty and
lack of information also play a role but in combination with switching costs between technologies.
Next, we simulate the shares of FttH connections when speed of all DSL connections is
downgraded or upgraded in the presence of switching costs. The possible DSL speed values are
1, 2, 5, 7, 8 MB/s. Table 4 shows that most DSL consumers have access to speed of 5 MB/s and
above. As shown in Table 6, compared to the base case in December 2014, the share of FttH
connections would not change at all for speed of all DSL connections ranging between 1 and 8
MB/s. Even if speed of all DSL connections would increase to 50 MB/s, which can be achieved
by VDSL or ADSL+ technologies, the share of FttH connections would remain unchanged. As
shown in Table 7, degrading DSL speed to 1 MB/s would cause an average loss in consumer
surplus of 4.4 Euros and upgrading speed to 8 MB/s would result in an average gain in consumer
surplus of 1.75 Euros. Furthermore, upgrading DSL speed to 50 MB/s would result in an average
gain in consumer surplus of 21.1 Euros. On this basis, we can conclude that changing speed of
DSL connections in the presence of switching costs will have no effect on the adoption of FttH
technology but offering consumers higher speed will increase their welfare.
High switching costs may explain why there is no effect of DSL speed on FttH adoption.
We repeat the counterfactual simulations but set all switching costs to zero before changing
14This counterfactual scenario is not very realistic because VDSL and ADSL+ technologies are only availableto consumers living very close to the exchange.
17

speed of all DSL connections. The share of FttH connections is not influenced by DSL speed
in the range between 1 and 8 MB/s, as compared to the case without switching costs. Only
when the speed of all DSL connections increases to 50 MB/s, the share of FttH connections
is lower by 14 percentage points than in the benchmark case without switching costs. Thus,
the speed of DSL slows down diffusion of FttH only for speed which is achievable by VDSL
or ADSL+ technologies. At the same time, the average consumer surplus in the absence of
switching costs with DSL speed of 1 MB/s is smaller by about (44.4 - 43.4) = 1.0 Euros than
the average consumer surplus in the benchmark case without switching costs, while for DSL
speed of 8 MB/s there is a gain of (44.9 - 44.4) = 0.5 Euros. Finally, for DSL speed of 50 MB/s
we get an average gain in consumer surplus of (53.4 - 44.4) = 9.0 Euros.
Finally, we analyze how price difference between DSL and FttH tariffs, which is about 5
Euros, influences the share of FttH connections. We find that if prices of FttH tariffs were 5
Euros lower, the share of FttH connections would remain unchanged in the presence of switching
costs. In the absence of technology switching costs, the share of FttH connections would increase
by 30 percentage points to 59%, and in the absence of all switching costs, it would increase by 64
percentage points to 93%. Thus, matching prices of FttH and DSL increases the share of FttH
connections only by 5 percentage points relative to the benchmark in the absence of technology
switching costs and only by 2 percentage points in the absence of all switching costs.
Overall, our counterfactual simulations illustrate that the values of DSL speed in the range
between 1 and 8 MB/s has almost no impact on consumers decisions to adopt FttH technology.
Only an increase in DSL speed to 50 MB/s, which can be available to some consumers via VDSL
or ADSL+ technology, would decrease the share of FttH connections by 14 percentage points
but in the absence of switching costs. At the same time, there is a large gain in consumer
surplus from increasing DSL speeds. The key factor which slows down transition from DSL to
FttH are additional switching costs between technologies. We also find that there are significant
switching costs between tariffs. In the absence of additional switching costs to FttH technology,
the share of FttH connections would increase by about 25 percentage points, while eliminating
only switching costs between tariffs would not increase FttH adoption at all. In the absence of
all switching costs, FttH share would increase from 29% to 91%.
18

5 Conclusions
The roll-out of high-speed Internet is one of the flagship initiatives of Europe 2020 strategy
proposed by the European Commission in 2010 with the objective to reap the benefits of a
digital single market for households and firms. In particular, according to the Digital Agenda
for Europe, by 2020, all EU households should benefit of at least 30 MB/s connection and at
least 50% of EU households should have adopted 100 MB/s connection or more. Moreover, in
September 2016, the Commission announced that by 2025 all European households should have
access to connections with speed of at least 100 MB/s. Such speeds of data transmission are not
feasible using DSL technology which relies on copper networks belonging to former monopolists,
while as of 2014, DSL was used by 59% EU households connected to Internet.
In this paper, we focus on demand factors which may postpone the adoption of high speed
broadband, which are consumer switching costs between tariffs and low valuation of high con-
nection speed. We analyze the impact of these factors on FttH adoption by estimating mixed
logit model based on monthly data on tariff choices made by customers of a single European
telecommunications operators between January and December 2014. Our analysis shows there
are significant switching costs between tariffs and technologies. In particular, switching costs
from DSL to FttH technology slow down the transition process. These costs may be due to
the time and effort needed to set up the first fiber connection. In particular, a consumer needs
to make appointment with an engineer who must visit the premises to set up a connection.
Switching costs between tariffs which may be due to transaction costs, uncertainty and lack
of information also play a role but in combination with switching costs between technologies.
Thus, even if firms deploy fiber networks, the take up of FttH connections by consumers may
be slow.
Furthermore, we find that the valuation of DSL speed in the range of 1 to 8 MB/s is very
similar, which may be explained by the fact that basic Internet needs of consumers such as
emailing, reading news, shopping, browsing and even watching videos online can be satisfied
with connection speeds below 8 MB/s. Surprisingly, the valuation of FttH speed of 100 MB/s
is not much different than the valuation of DSL speed of 8 MB/s but increases over time. In
February 2014, the second month of our data, the valuation of FttH speed of 100 MB/s was
3% higher than the valuation of DSL speed of 8 MB/s and 7% higher than the valuation of
19

DSL speed of 1 MB/s. In December 2014, the last month of our data, the valuation of FttH
connection with speed of 100 MB/s was 59% higher than the valuation of DSL speed of 8 MB/s
and 66% higher than the valuation of DSL speed of 1 MB/s. The increasing valuation over time
may reflect growing need for high speed connections due to availability of new online services.
But besides fast changes over time, the ratio of speed valuations in the last month of the data
remains far below the ratio of speed values.
Our findings show that to achieve the objectives of the Digital Agenda for Europe, there
is need to reduce consumer switching costs between technologies and tariffs and to convince
consumers that they need speed of 100 MB/s or above. If there is a lack of interest on the
side of consumers to give up their slower DSL connections and make a move to faster FttH
technology, also firms will have lower incentives to invest in the deployment of FttH.
20

Bibliography
Baranes, E., 2014. “The interplay between network investment and content quality: Implica-
tions to net neutrality on the Internet” Information Economics and Policy, 28, pp.57-69.
Bouckaert, J., van Dijk, T. and F. Verboven, 2010. “Access Regulation, Competition, and
Broadband Penetration: An International Study” Telecommunication Policy, 34, pp.661-
671.
Briglauer, W., 2014. “The Impact of Regulation and Competition on the Adoption of Fiber-
Based Broadband Services: Recent Evidence from the European Member States,” Journal
of Regulatory Economics, 46, pp.51-79.
Cardona M., Schwarz A., Yurtoglu, B.B. and Ch. Zulehner, 2009. “Demand Estimation and
Market Definition for Broadband Internet Services,” Journal of Regulatory Economics,
35(), pp.70-95.
Dauvin, M. and L. Grzybowski, 2014. “Estimating broadband diffusion in the EU using NUTS
1 regional data,” Telecommunications Policy, 38(1), pp.96-104.
Distaso, W., Lupi, P. and F.M. Manenti, 2006. “Platform Competition and Broadband Uptake:
Theory and Empirical Evidence from the European Union,” Information Economics and
Policy, 18, pp. 87-106.
Grzybowski, L. and J. Liang, 2015. “Estimating demand for fixed-mobile bundles and switching
costs between tariffs,” Information Economics and Policy, 33, pp.1-10.
Grzybowski, L., Nitsche, R., Verboven, F. and L. Wiethaus, 2014. “Market Definition for
Broadband internet in Slovakia – Are Fixed and Mobile Technologies in the Same Market?
” Information Economics and Policy, 28, pp.39-56
Heckman, J., 1981. “Statistical Models for Discrete Panel Data,” C.F. Manski and D. McFad-
den, eds. Structural Analysis of Discrete Data with Econometric Applications, Cambridge,
MA: The MIT Press, pp.179-195.
Hole, A.R., 2007. “Fitting Mixed Logit Models by Using Maximum Simulated Likelihood,”
Stata Journal, 7(3), pp.388-401.
21

Ida, T. and T. Kuroda, 2006. “Discrete Choice Analysis of Demand for Broadband in Japan,”Journal
of Regulatory Economics, 29(1), pp.5-22.
Ida, T. and K. Sakahira, 2008. “Broadband migration and lock-in effects: Mixed logit model
analysis of Japan’s high-speed Internet access services,”Telecommunications Policy 32(9-
10), pp.615-625.
LaRose, R., Bauer, J.M., DeMaagd, K., Chew, H.-E., Ma, W., and Y. Jung. 2014. “Public
Broadband Investment Priorities in the United States: An Analysis of the Broadband
Technology Opportunities Program,” Government Information Quarterly, 31, pp.53-64.
Rosston, G., Savage, S.J., and D.M. Waldman, 2010. “Household Demand for Broadband
Internet Service,” Federal Communications Commission.
Small, K.A. and H.S. Rosen, 1981. “Applied Welfare Economics with Discrete Choice Models,”
Econometrica, 49, pp.105–30.
Srinuan, P., Srinuan, C. and E., Bohlin, 2012 , Fixed and Mobile Broadband Substitution in
Sweden,” Telecommunications Policy, 36, pp. 237-251.
Train, K., 2003. “Discrete Choice Methods with Simulation,” Cambridge University Press,
Cambridge.
Wallsten, S. and S. Hausladen, 2009. “Net Neutrality, Unbundling, and Their Effects on
International Investment in Next-Generation Networks,” Review of Network Economics,
8, Art. 6.
22

Appendix
Table 1: Descriptive statistics: old and new tariffs
Old tariffs
Variable Mean Std. Dev. Min. Max. N
Monthly fee (Euros/m) 62.16 25.67 21 141 122Triple DSL 0.39 0.49 0 1 122Triple FttH 0.07 0.26 0 1 122Quadruple DSL 0.34 0.48 0 1 122Quadruple FttH 0.2 0.4 0 1 122Handset subsidy 0.32 0.47 0 1 122Unlimited voice 0.23 0.42 0 1 122Mobile data allowance (GB) 0.66 1 0 6 122PSTN 0.14 0.35 0 1 122Web only 0 0 0 0 122
New tariffs
Variable Mean Std. Dev. Min. Max. N
Monthly fee (Euros/m) 62.96 26.53 10 147 228Triple DSL 0.33 0.47 0 1 228Triple FttH 0.05 0.21 0 1 228Quadruple DSL 0.35 0.48 0 1 228Quadruple FttH 0.26 0.44 0 1 228Handset subsidy 0.47 0.5 0 1 228Unlimited voice 0.43 0.5 0 1 228Mobile data allowance (GB) 1.62 2.53 0 10 228PSTN 0.14 0.35 0 1 228Web only 0.02 0.13 0 1 228
Table 2: Number of consumers switching tariffs between January and December 2014
Switches Consumers %
0 56452 60%1 30500 32%2 6242 7%3 1023 1%4 149 0%5 21 0%6 1 0%
Total 94388 100%
23

Table 3: Number of switches between types of tariffs between January and December 2014
From/To Triple DSL Quadruple DSL Triple FttH Quadruple FttH Leaving
Triple DSL 11508 2173 6873 616 562Quadruple DSL 27 8486 21 5195 36
Triple FttH 1033 9 2878 2041 213Quadruple FttH 12 596 12 5345 6New consumers 191 79 405 117 0
Table 4: Copper line loss
Copper line loss Basic DSL speed Consumers
60 dB - 75 dB < 1 Mb/s 100645 dB - 60 dB 2 Mb/s 623630 dB - 45 dB 5 Mb/s 1416415 dB - 30 dB 7 Mb/s 23952
< 15dB 8 Mb/s 13097
58455
24

Table 5: Estimation results
Est. I Est. II Est. III
Mean Time SD Mean Time SD Mean Time SD
Price -0.070*** 0.025*** -0.014*** -0.000 -0.056*** -0.020***(0.001) (0.000) (0.000) (0.000) (0.001) (0.000)
Contract 12 TP -0.384*** 0.581*** -0.367***(0.013) (0.013) (0.016)
Contract 24 TP 6.071*** 4.601*** 5.131***(0.035) (0.028) (0.040)
Contract 12 QP -1.082*** -2.576*** -2.756***(0.055) (0.042) (0.048)
Contract 24 QP -0.140** -1.143*** -1.666***(0.065) (0.057) (0.065)
Subsidy 0.210*** -0.726*** -0.009(0.047) (0.050) (0.058)
Unlimited 1.480*** 0.670*** 0.206***(0.032) (0.029) (0.028)
Data mobile 0.370*** 0.074*** 0.311***(0.006) (0.007) (0.008)
PSTN -0.665*** 0.970*** -0.475***(0.015) (0.015) (0.017)
Switching -3.233*** -1.192*** -3.812*** -1.177*** -3.423*** -1.127***(0.013) (0.015) (0.016) (0.018) (0.016) (0.018)
Switching to DSL -3.914*** -2.368*** -4.609***(0.232) (0.411) (0.413)
Switching to FttH -11.595*** -16.747*** -11.641***(0.582) (1.005) (1.002)
Switching to FttH (cable zone) -10.659*** -14.042*** -9.856***(0.230) (0.272) (0.264)
Switching commitment -0.131*** -0.108*** -0.125***(0.001) (0.001) (0.001)
Leaving commitment -0.079*** 0.192*** -0.073***(0.007) (0.012) (0.009)
DSL TP 10.297***(0.096)
DSL TP (cable zone) 10.300***(0.093)
DSL QP 7.637***(0.105)
DSL QP (cable zone) 7.407***(0.101)
FttH TP 10.644***(0.108)
FttH TP (cable zone) 10.642***(0.099)
FttH QP 6.925***(0.118)
FttH QP (cable zone) 7.079***(0.109)
DSL TP+QP -0.000(0.011)
FttH TP+QP 0.517***(0.013)
Log speed 0.710*** 0.252***(0.011) (0.003)
Speed DSL 1 MB/s 9.381*** -0.015(0.310) (0.046)
Speed DSL 2 MB/s 9.686*** -0.013(0.160) (0.023)
Speed DSL 5 MB/s 9.578*** 0.011(0.131) (0.018)
Speed DSL 7 MB/s 9.580*** 0.034**(0.121) (0.016)
Speed DSL 8 MB/s 9.748*** 0.007(0.133) (0.018)
Speed FttH 100 MB/s 8.929*** 0.551***(0.118) (0.016)
Observations 3,998,727 2,483,988 2,483,988
Standard errors in parentheses: *** p < 0.01, ** p < 0.05, * p < 0.125
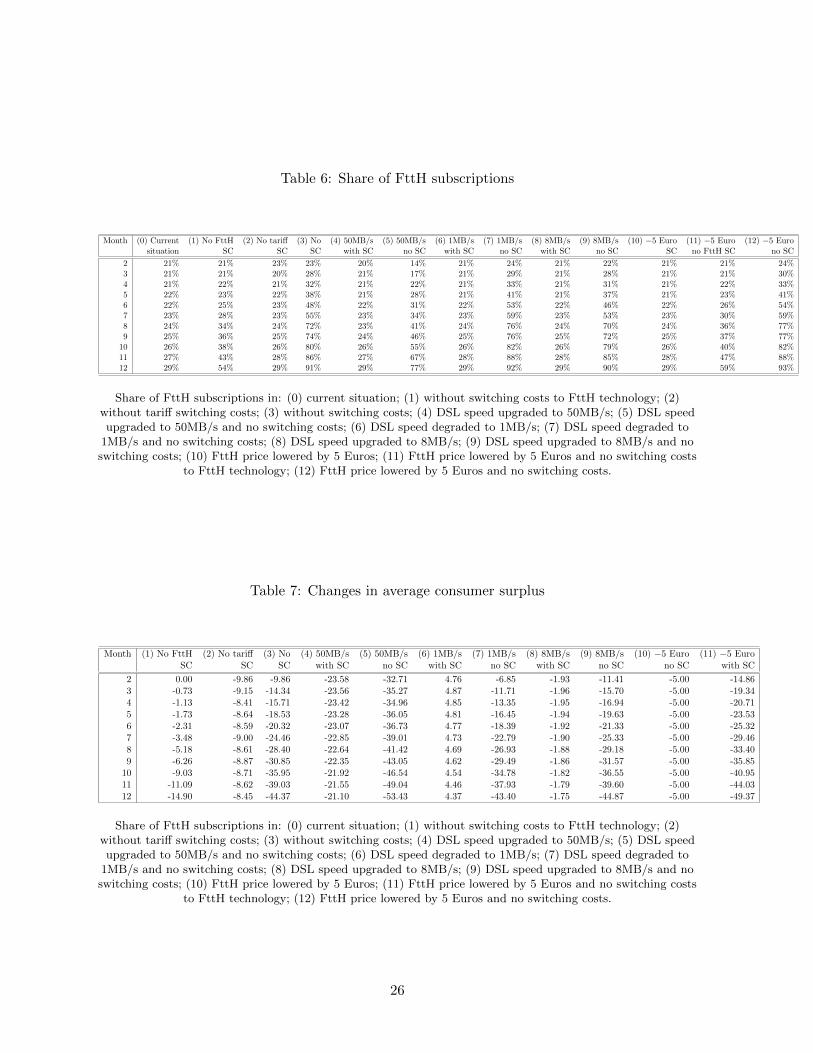
Table 6: Share of FttH subscriptions
Month (0) Current (1) No FttH (2) No tariff (3) No (4) 50MB/s (5) 50MB/s (6) 1MB/s (7) 1MB/s (8) 8MB/s (9) 8MB/s (10) −5 Euro (11) −5 Euro (12) −5 Eurosituation SC SC SC with SC no SC with SC no SC with SC no SC SC no FttH SC no SC
2 21% 21% 23% 23% 20% 14% 21% 24% 21% 22% 21% 21% 24%3 21% 21% 20% 28% 21% 17% 21% 29% 21% 28% 21% 21% 30%4 21% 22% 21% 32% 21% 22% 21% 33% 21% 31% 21% 22% 33%5 22% 23% 22% 38% 21% 28% 21% 41% 21% 37% 21% 23% 41%6 22% 25% 23% 48% 22% 31% 22% 53% 22% 46% 22% 26% 54%7 23% 28% 23% 55% 23% 34% 23% 59% 23% 53% 23% 30% 59%8 24% 34% 24% 72% 23% 41% 24% 76% 24% 70% 24% 36% 77%9 25% 36% 25% 74% 24% 46% 25% 76% 25% 72% 25% 37% 77%
10 26% 38% 26% 80% 26% 55% 26% 82% 26% 79% 26% 40% 82%11 27% 43% 28% 86% 27% 67% 28% 88% 28% 85% 28% 47% 88%12 29% 54% 29% 91% 29% 77% 29% 92% 29% 90% 29% 59% 93%
Share of FttH subscriptions in: (0) current situation; (1) without switching costs to FttH technology; (2)without tariff switching costs; (3) without switching costs; (4) DSL speed upgraded to 50MB/s; (5) DSL speedupgraded to 50MB/s and no switching costs; (6) DSL speed degraded to 1MB/s; (7) DSL speed degraded to
1MB/s and no switching costs; (8) DSL speed upgraded to 8MB/s; (9) DSL speed upgraded to 8MB/s and noswitching costs; (10) FttH price lowered by 5 Euros; (11) FttH price lowered by 5 Euros and no switching costs
to FttH technology; (12) FttH price lowered by 5 Euros and no switching costs.
Table 7: Changes in average consumer surplus
Month (1) No FttH (2) No tariff (3) No (4) 50MB/s (5) 50MB/s (6) 1MB/s (7) 1MB/s (8) 8MB/s (9) 8MB/s (10) −5 Euro (11) −5 EuroSC SC SC with SC no SC with SC no SC with SC no SC no SC with SC
2 0.00 -9.86 -9.86 -23.58 -32.71 4.76 -6.85 -1.93 -11.41 -5.00 -14.863 -0.73 -9.15 -14.34 -23.56 -35.27 4.87 -11.71 -1.96 -15.70 -5.00 -19.344 -1.13 -8.41 -15.71 -23.42 -34.96 4.85 -13.35 -1.95 -16.94 -5.00 -20.715 -1.73 -8.64 -18.53 -23.28 -36.05 4.81 -16.45 -1.94 -19.63 -5.00 -23.536 -2.31 -8.59 -20.32 -23.07 -36.73 4.77 -18.39 -1.92 -21.33 -5.00 -25.327 -3.48 -9.00 -24.46 -22.85 -39.01 4.73 -22.79 -1.90 -25.33 -5.00 -29.468 -5.18 -8.61 -28.40 -22.64 -41.42 4.69 -26.93 -1.88 -29.18 -5.00 -33.409 -6.26 -8.87 -30.85 -22.35 -43.05 4.62 -29.49 -1.86 -31.57 -5.00 -35.85
10 -9.03 -8.71 -35.95 -21.92 -46.54 4.54 -34.78 -1.82 -36.55 -5.00 -40.9511 -11.09 -8.62 -39.03 -21.55 -49.04 4.46 -37.93 -1.79 -39.60 -5.00 -44.0312 -14.90 -8.45 -44.37 -21.10 -53.43 4.37 -43.40 -1.75 -44.87 -5.00 -49.37
Share of FttH subscriptions in: (0) current situation; (1) without switching costs to FttH technology; (2)without tariff switching costs; (3) without switching costs; (4) DSL speed upgraded to 50MB/s; (5) DSL speedupgraded to 50MB/s and no switching costs; (6) DSL speed degraded to 1MB/s; (7) DSL speed degraded to
1MB/s and no switching costs; (8) DSL speed upgraded to 8MB/s; (9) DSL speed upgraded to 8MB/s and noswitching costs; (10) FttH price lowered by 5 Euros; (11) FttH price lowered by 5 Euros and no switching costs
to FttH technology; (12) FttH price lowered by 5 Euros and no switching costs.
26