transit feasibility study - outulsagrad.ou.edu/studio/tcctransit/transit_study.pdftcc transit...
TRANSCRIPT

Tulsa Community CollegeTransit Feasibility Study
Copyright by Nathan J. Kuntz 2009All Rights Reserved.

Report by Nathan Kuntz
The University of OklahomaGraduate College
Tulsa Community College Transit Feasibility Study
A Professional ProjectSubmitted to the Graduate Faculty
in partial fulfillment of the requirements for thedegree of
Master of Science in Architectural Urban Studies
By
Nathan J. KuntzTulsa, Oklahoma
2009
A Professional Project approved for theCollege of ArchitectureUrban Design Studio
By
Shawn Michael Schaefer, ChairShowa Omabegho, Ph.D
Hans-Peter WachterChristina Hoehn
Copyright by Nathan J. Kuntz 2009All Rights Reserved.

Table of ContentsNathan Kuntz would like to thank thefollowing:
Report by Nathan Kuntz
Acknowledgements
Abstract.................................................................4Schedule................................................................5Guideline/Needs Assessment..................................6Public Transportation..............................................7Tulsa Community College overview.........................8Tulsa Transit Overview...........................................14Case Studies.........................................................17TCC Transit Survey...............................................24TCC Transit Design...............................................32Grants and Financing.............................................46Financial Estimates................................................47Transit Benefits/Environment..................................49Concepts..............................................................51Significance...........................................................54Recommendations.................................................55References............................................................57Appendix..............................................................60
Tulsa Community CollegeTulsa TransitBob Bourne, Principal, Bourne Transit Consulting, LLCSteven Cox, Tulsa Community College, Assistant Director of Facilities MaintenanceLiann Alfaro, Tulsa Transit Transportation PlannerShawn Schaefer, AIA, NCARB, OUUDS Director
Urban Design StudioUniversity of OklahomaCollege of Architecture
3
Abstract
Tulsa Community College
Report by Nathan Kuntz
This study explores the feasibility of Tulsa Community College implementing atransit service system to conduct routes that serve all TCC’s campuses, andfeasibly, neighboring partner campuses.
My research involved case studies and personal interviews to provide anunderstanding of transit operations. I specifically studied how universitiesimplement transit systems and their general operation costs.
Methodology used to determine if a demand was present for TCC transitservice was best served through a campus-wide survey. This survey relates totransit as well as transit needs assessment which help determine specific needsof TCC. The survey was posted for two months on TCC’s website and wasavailable to all website users.
Initial survey analysis indicated a demand for transit service. Additional in-depthsurvey data analysis helped design transit topology and route implementation.
My study also included transit facility design, financial estimates, and innovativetransit concepts unique to TCC and the greater Tulsa area.
4
Project Schedule
Research and Design
Report by Nathan Kuntz
Current Transit Systems Project Objectives Future Needs andSolutions
Feasibility Analysis
Defining Transit Systems
Research
Impact on Society
TCC Survey
Route Development
Design Process
Data Management
Development Iterations
Long‐range Plan
Design Transit Manual
Grants and Financing
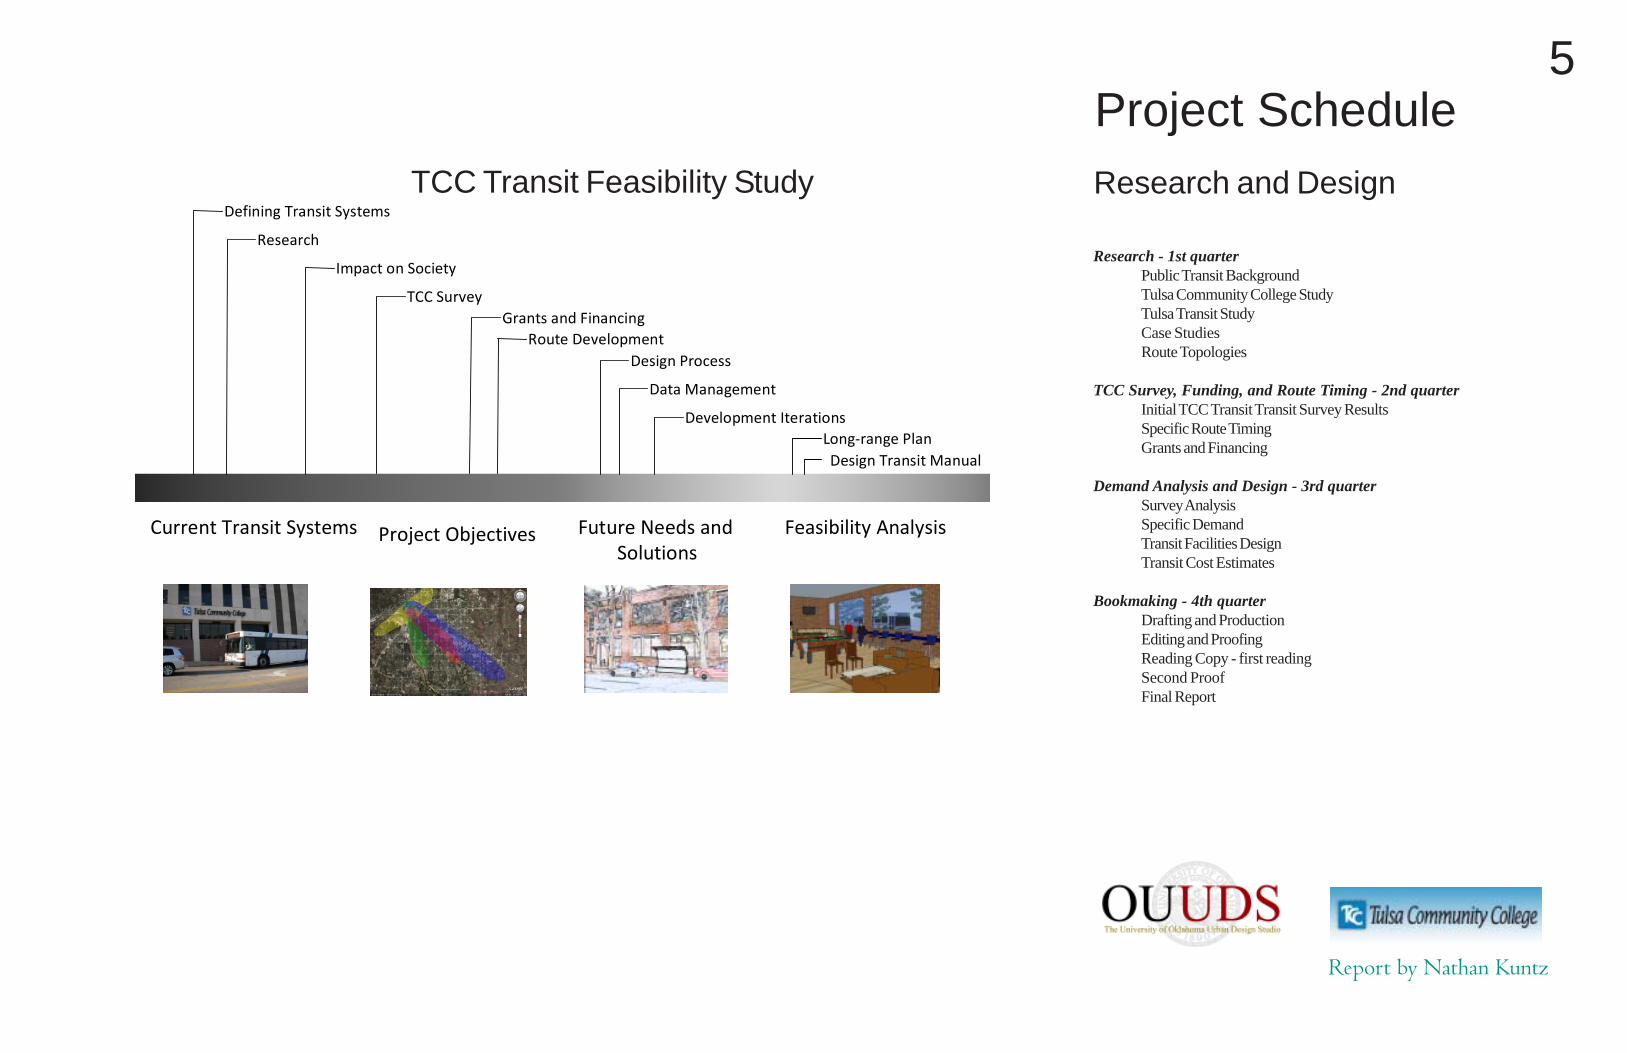
Research - 1st quarterPublic Transit BackgroundTulsa Community College StudyTulsa Transit StudyCase StudiesRoute Topologies
TCC Survey, Funding, and Route Timing - 2nd quarterInitial TCC Transit Transit Survey ResultsSpecific Route TimingGrants and Financing
Demand Analysis and Design - 3rd quarterSurvey AnalysisSpecific DemandTransit Facilities DesignTransit Cost Estimates
Bookmaking - 4th quarterDrafting and ProductionEditing and ProofingReading Copy - first readingSecond ProofFinal Report
TCC Transit Feasibility Study
5
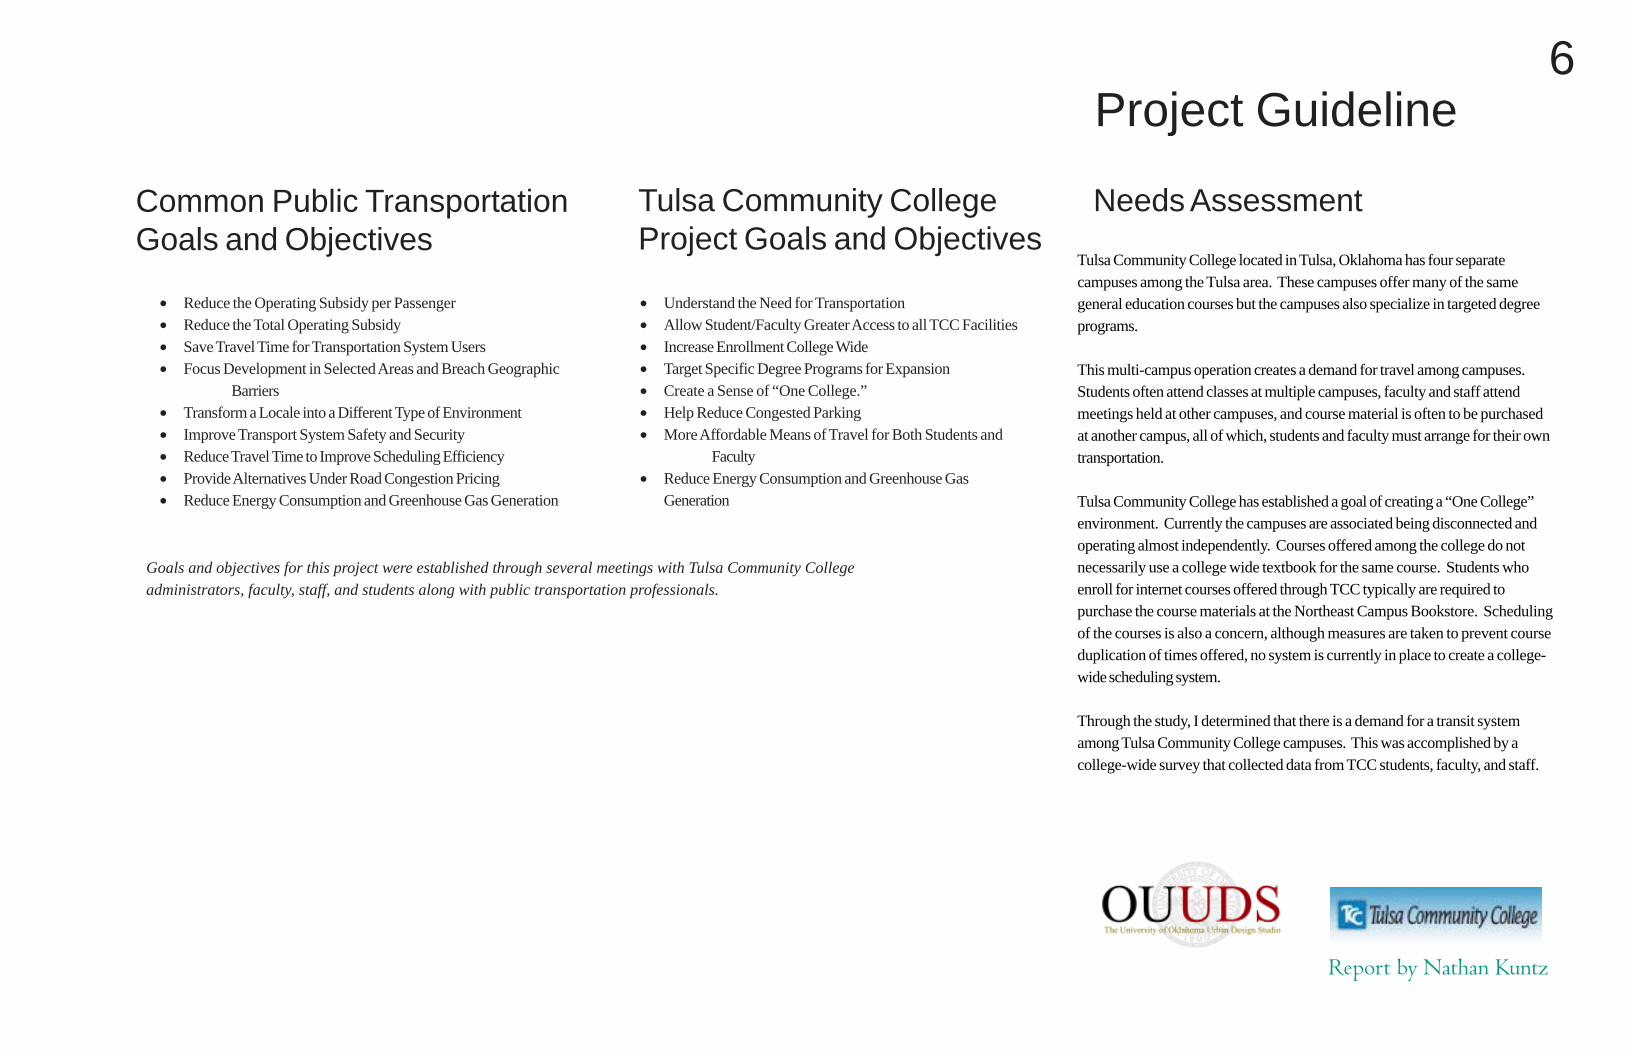
Goals and objectives for this project were established through several meetings with Tulsa Community Collegeadministrators, faculty, staff, and students along with public transportation professionals.
Project Guideline
• Reduce the Operating Subsidy per Passenger• Reduce the Total Operating Subsidy• Save Travel Time for Transportation System Users• Focus Development in Selected Areas and Breach Geographic
Barriers• Transform a Locale into a Different Type of Environment• Improve Transport System Safety and Security• Reduce Travel Time to Improve Scheduling Efficiency• Provide Alternatives Under Road Congestion Pricing• Reduce Energy Consumption and Greenhouse Gas Generation
Report by Nathan Kuntz
Common Public TransportationGoals and Objectives
• Understand the Need for Transportation• Allow Student/Faculty Greater Access to all TCC Facilities• Increase Enrollment College Wide• Target Specific Degree Programs for Expansion• Create a Sense of “One College.”• Help Reduce Congested Parking• More Affordable Means of Travel for Both Students and
Faculty• Reduce Energy Consumption and Greenhouse Gas
Generation
Tulsa Community CollegeProject Goals and Objectives
Needs Assessment
Tulsa Community College located in Tulsa, Oklahoma has four separatecampuses among the Tulsa area. These campuses offer many of the samegeneral education courses but the campuses also specialize in targeted degreeprograms.
This multi-campus operation creates a demand for travel among campuses.Students often attend classes at multiple campuses, faculty and staff attendmeetings held at other campuses, and course material is often to be purchasedat another campus, all of which, students and faculty must arrange for their owntransportation.
Tulsa Community College has established a goal of creating a “One College”environment. Currently the campuses are associated being disconnected andoperating almost independently. Courses offered among the college do notnecessarily use a college wide textbook for the same course. Students whoenroll for internet courses offered through TCC typically are required topurchase the course materials at the Northeast Campus Bookstore. Schedulingof the courses is also a concern, although measures are taken to prevent courseduplication of times offered, no system is currently in place to create a college-wide scheduling system.
Through the study, I determined that there is a demand for a transit systemamong Tulsa Community College campuses. This was accomplished by acollege-wide survey that collected data from TCC students, faculty, and staff.
6

Photo provided by APTA
Public Transportation
Background and Trends
Public transportation has been available since 1826 and occurs throughseveral modes. Travel by boat, rail, bus, and airline are all classified aspublic transportation. Most often though, public transportation is typicallyby bus. Public transportation was at the pinnacle of its ridership numberswith the United States during the 1920s until the end of World War II.The popularity of the personal automobile was soon replacing publictransit modes and reshaping the design of our cities, creating outlyingsuburbs, and in many cases edge cities.
The United States has been affected by the automobile and reluctance touse public transportation systems. The problem lies in destinations too farapart and density levels too low. The result of reliance on automobiles isspecific land use policy and congested cities.
However, in recent years, public transportation has experienced aresurgence brought on by economic factors and increasing environmentalconcerns such as global warming. Studies conducted by theEnvironmental Protection Agency (EPA) and Federal TransitAdministration (FTA) have concluded that public transportation reducescarbon dioxide emissions, saves money, promotes a healthy lifestyle,influences growth patterns, provides mobility of goods and services, andstimulates economic activity.
Report by Nathan Kuntz
Photo provided by UMASS Transit
Photo provided by Federal Transit Administration
Photo provided by California University of Pennsylvania
7

29%
17%43%
11%
Fall 2008 FTE Student Enrollment Statistics
Metro 2,945
NEC 1,752
SEC 4,396
West 1,186
30%
20%
37%
13%
Fall 2008 Student Enrollment Statistics
Metro 7,276
NEC 5,046
SEC 9,089
West 3,129
Data provided by Tulsa Community College
Tulsa Community College
Enrollment Analysis
Tulsa Community College has a total student enrollment for 2008 Fallsemester of 24,540. This number is divided throughout the TCCcampuses with Southeast Campus having the highest student enrollment at9,089, followed by Metro Campus with 7,276, Northeast Campus at5,046, and West Campus being the smallest with a total student enrollmentof 3,129. The TCC Conference Center typically does not conductstudent classes.
Looking at the number of TCC faculty and staff, the numbers reflectstudent enrollment.
Southeast 751Metro 679Northeast 506West 248Conference Center 165
Figure 1: Graph representing TCC student enrollment for the 2008 Fallsemester.
Figure 2: Graph representing TCC full-time student equivalent enrollmentfor the 2008 Fall semester.
Report by Nathan Kuntz
Figure 1
Figure 2
Data provided by Tulsa Community College
8

Metro Campus
Northeast Campus
Southeast Campus
West Campus
Conference Center
1,2121,025
2,315
1,118
398
TCC Parking SpacesFall 2008
Data provided by Tulsa Community College
Tulsa Community College
Metro CampusMetro Campus of Tulsa Community College is located at 909 S. BostonAve, Tulsa, OK within the central business district. This unique locationinside the inner dispersal loop of Tulsa offers a geographical center forTCC campuses and is about 8 blocks away from the Tulsa Transitdowntown bus station.
Metro Campus has the second largest student enrollment of 7,276 for Fall2008. It also has an emphasis on health sciences with academic programssuch as nursing, allied health, and dental hygiene.
TCC’s newest construction at Metro Campus is located directly west ofthe main academic building. This new building is named “the Center ofCreativity,” and will house art and technology divisions.
Report by Nathan Kuntz
Figure 2
Figure 3
Figure 4
Figure 1
Figure 6
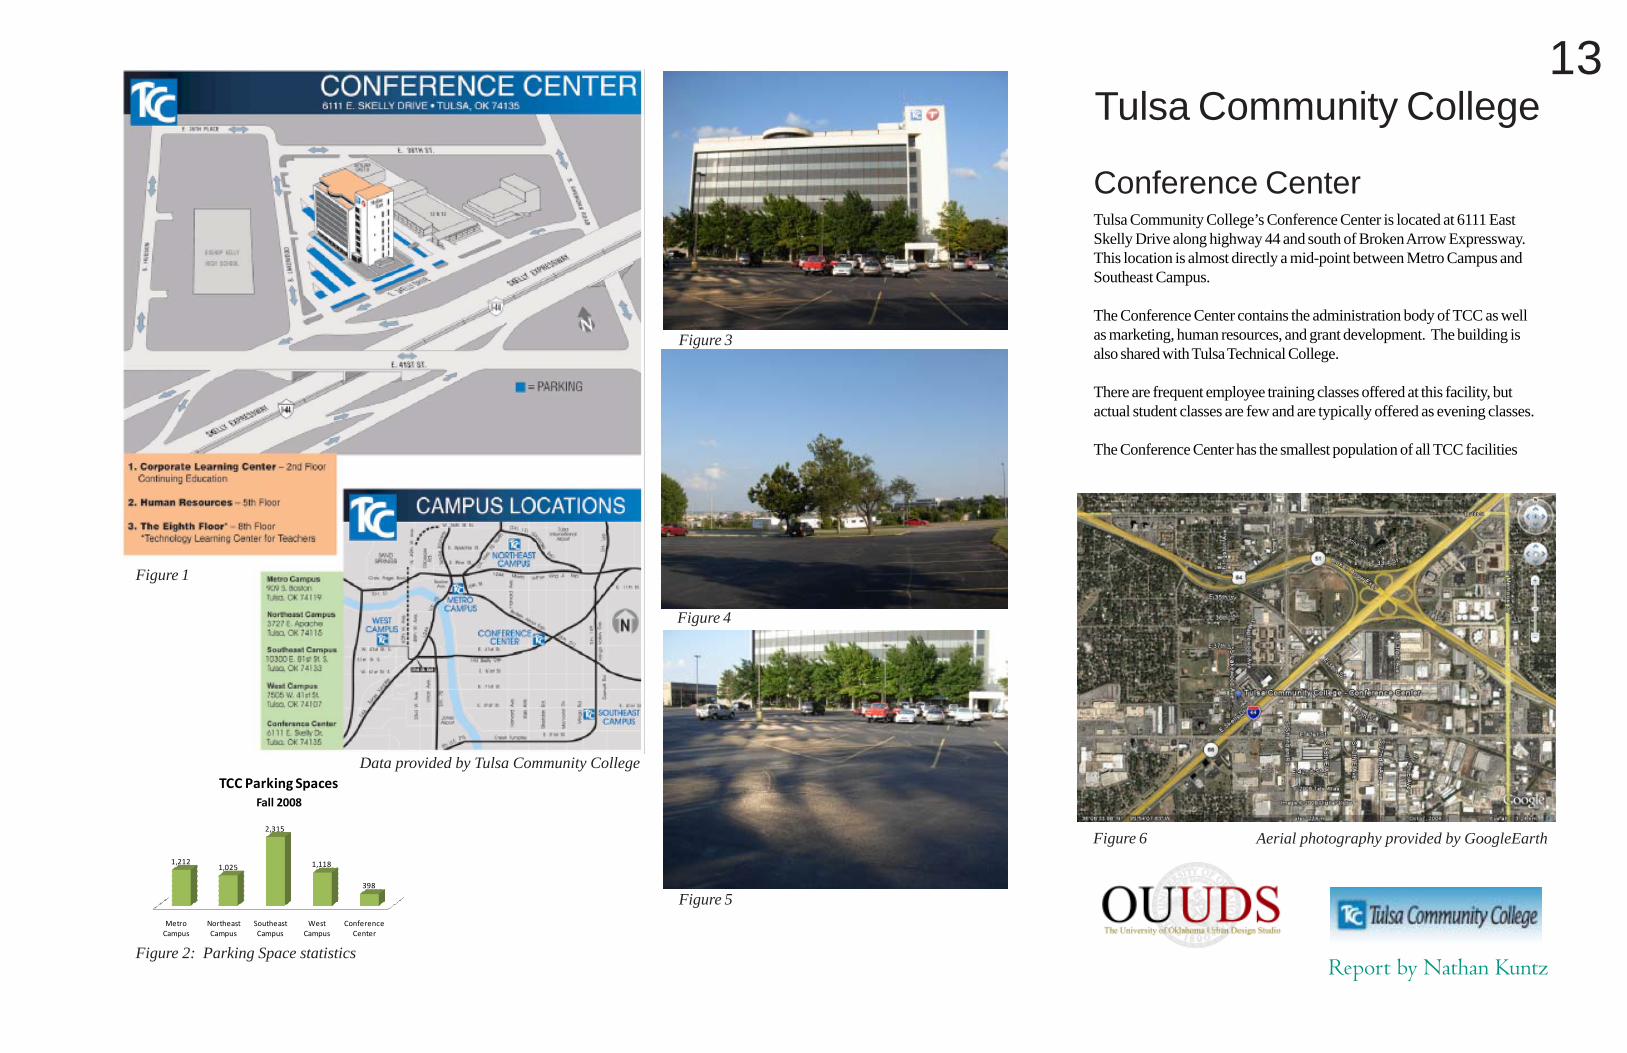
Parking is also a concern for TCC. West Campus and Northeast Campus have ample parkinglots per students and Metro has sufficient of parking as well but struggles with identifying thelocation of serveral parking lots. Southeast Campus has the largest parking concern. Initial siteanalysis does allow for newly contrusted parking lots, along with better design, will help relieveparking issues.Figure 5: Parking Space statistics
Aerial photography provided by GoogleEarth
9
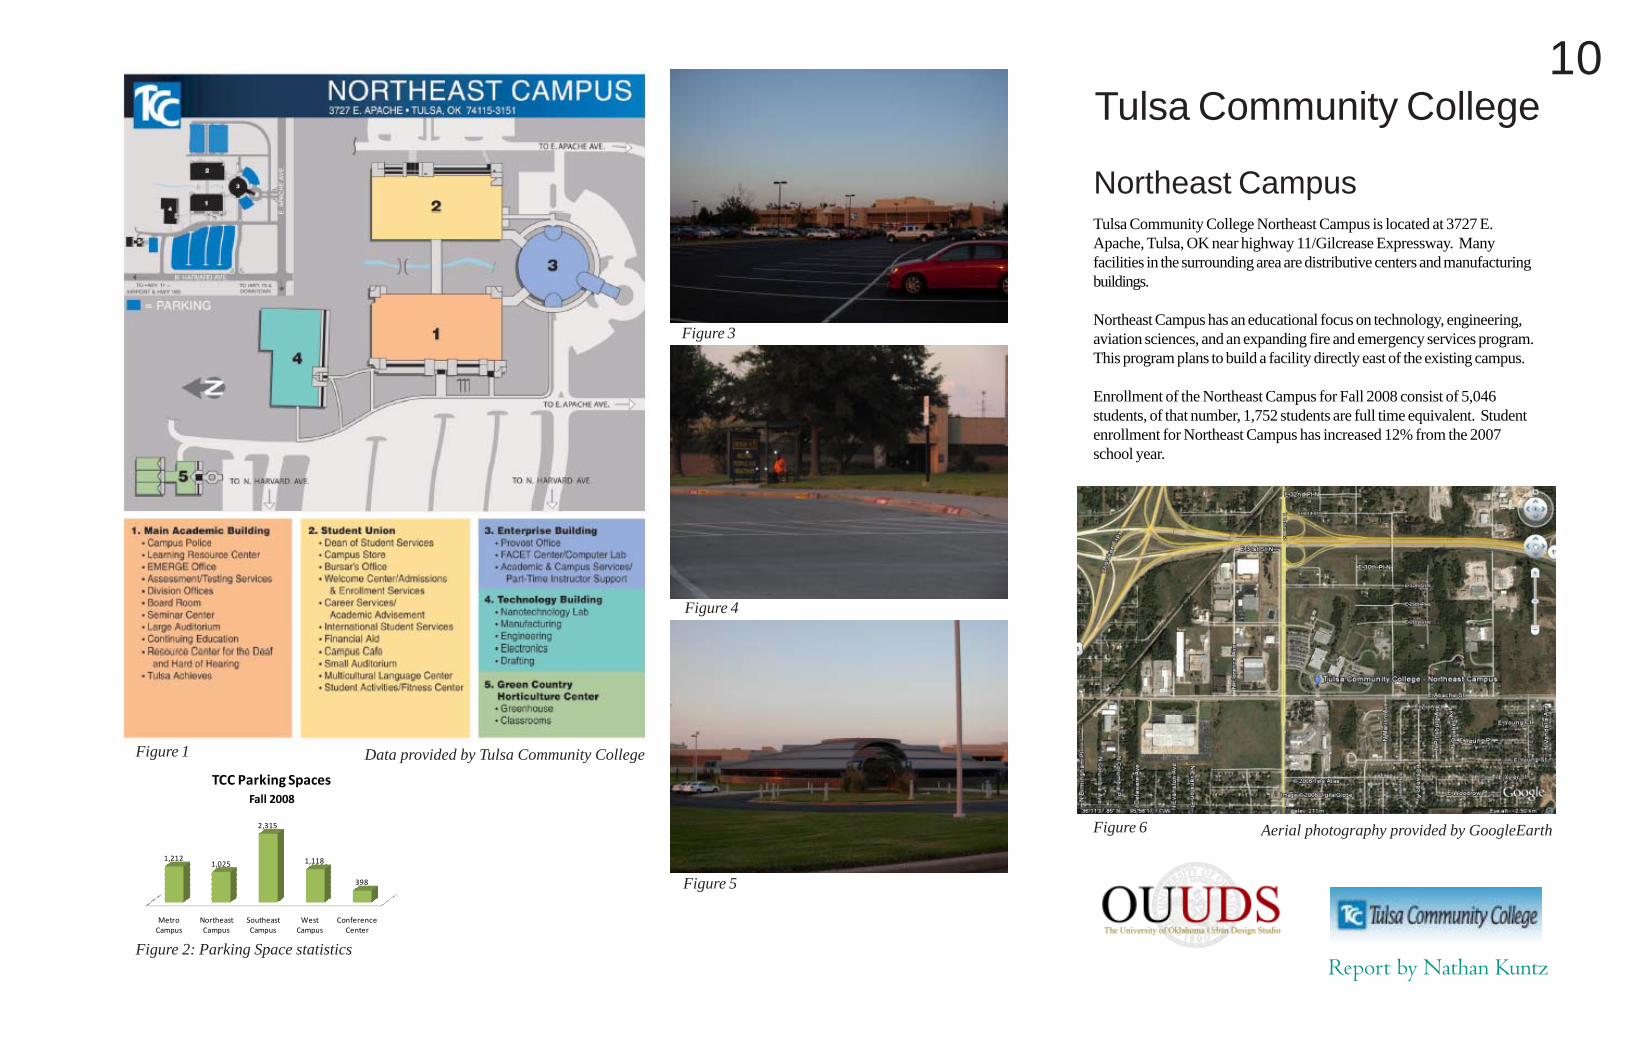
Tulsa Community College Northeast Campus is located at 3727 E.Apache, Tulsa, OK near highway 11/Gilcrease Expressway. Manyfacilities in the surrounding area are distributive centers and manufacturingbuildings.
Northeast Campus has an educational focus on technology, engineering,aviation sciences, and an expanding fire and emergency services program.This program plans to build a facility directly east of the existing campus.
Enrollment of the Northeast Campus for Fall 2008 consist of 5,046students, of that number, 1,752 students are full time equivalent. Studentenrollment for Northeast Campus has increased 12% from the 2007school year.
Tulsa Community College
Northeast Campus
Report by Nathan Kuntz
Metro Campus
Northeast Campus
Southeast Campus
West Campus
Conference Center
1,2121,025
2,315
1,118
398
TCC Parking SpacesFall 2008
Figure 1
Figure 2: Parking Space statistics
Figure 3
Figure 4
Figure 5
Figure 6
Data provided by Tulsa Community College
Aerial photography provided by GoogleEarth
10

Metro Campus
Northeast Campus
Southeast Campus
West Campus
Conference Center
1,2121,025
2,315
1,118
398
TCC Parking SpacesFall 2008
Tulsa Community College
Southeast CampusTulsa Community College Southeast is located at 10300 E. 81st Street,Tulsa, OK. The campus is surrounded by neighborhoods, businesses, andseveral new hotels. This area is one of the fastest growing areas in Tulsa.Directly east is highway 169, a major expressway that flows north/south.
Southeast Campus has the largest student enrollment of 9,089 for the2008 Fall semester. Along with the largest student body, the campus isalso home to VanTrease Performing Arts Center for Education (PACE).This facility is used by TCC’s performing arts programs as well as theCollege’s Signature Symphony. PACE has seating for 1,500 people.Southeast Campus also has a large number of academic programs offered.
Parking at Southeast Campus is a major concern. Reports show that lotsare frequently 90-95% full. With 2,315 parking spaces and studentenrollment for Fall 2008 at 9,089, that leaves the parking spaces ratioroughly at 4:1, excluding faculty and staff parking.
Report by Nathan Kuntz
Data provided by Tulsa Community College
Figure 1
Figure 2: Parking Space statistics
Figure 3
Figure 4
Figure 5
Figure 6 Aerial photography provided by GoogleEarth
11

Metro Campus
Northeast Campus
Southeast Campus
West Campus
Conference Center
1,2121,025
2,315
1,118
398
TCC Parking SpacesFall 2008
This is typical text for captions and footnotes below images.
Tulsa Community College
West Campus
West Campus is located at 7505 W. 41st Street, Tulsa, OK. This locationis targeted toward serving communities of Sand Springs, Sapulpa,Glenpool, and other communities located west side of the Arkansas river.
This is the newest TCC Campus and is currently adding onto the Scienceand Mathematics division. West Campus has the fewest students enrolledfor Fall 2008 semester at a total of 3,129.
The College’s Veterinary degree program is offered only at the WestCampus. The campus also hosts programs such as Child Developmentand Hospitality and Gaming Operations programs.
Currently, there are no bus routes serving West Campus.
Report by Nathan Kuntz
Data provided by Tulsa Community CollegeFigure 1
Figure 2: Parking Space statistics
Figure 3
Figure 4
Figure 5
Figure 6 Aerial photography provided by GoogleEarth
12
Metro Campus
Northeast Campus
Southeast Campus
West Campus
Conference Center
1,2121,025
2,315
1,118
398
TCC Parking SpacesFall 2008
Data provided by Tulsa Community College
Tulsa Community College
Conference CenterTulsa Community College’s Conference Center is located at 6111 EastSkelly Drive along highway 44 and south of Broken Arrow Expressway.This location is almost directly a mid-point between Metro Campus andSoutheast Campus.
The Conference Center contains the administration body of TCC as wellas marketing, human resources, and grant development. The building isalso shared with Tulsa Technical College.
There are frequent employee training classes offered at this facility, butactual student classes are few and are typically offered as evening classes.
The Conference Center has the smallest population of all TCC facilities
Report by Nathan Kuntz
Figure 1
Aerial photography provided by GoogleEarth
Figure 2: Parking Space statistics
Figure 4
Figure 3
Figure 5
Figure 6
13

Tulsa Transit
Current Conditions
Report by Nathan KuntzData provided by the Metropolitan Tulsa Transit Authority
43%
34%
5%
1%
14%
3%0%
Tulsa Transit Funding(in thousands)
City of Tulsa ‐ $1,388
Federal Grants ‐$1,083State Grants ‐ $150
Other Grants ‐ $38
Fare Revenues ‐ $449
Advertising Revenues ‐$104Other Revenues ‐ $15
Established in 1968 Tulsa Transit has approximately 180 employees governedby a seven member board appointed by the mayor. The mission statement ofTulsa Transit is to offer a premier transit service that is safe, professional,efficient, reliable, and accessible.
For specific Tulsa Transit routes currently serving TCC campuses refer toappendix page 60.
Figure 3
Figure 2
Figure 1
14
Figure 4: Graph displaying Tulsa Transit fundingData provided by Tulsa Transit

Tulsa Transit
Survey
Metropolitan Tulsa Transit Authority recently conducted a survey open tothe public. This survey was composed of specific transit related questionsalong with demographic questions to gain a better understanding of who isusing Tulsa Transit and how can Tulsa Transit could be improved. I haveselected a few survey questions along with the results. Questions listed hererelate to the Tulsa Community College transit feasibility study by providingcommon issues and current rider demographics.
The most common request listed through the survey is to increase routefrequency, in turn, shortening headways. This is a major factor on ridershipnumbers.
This survey also shows that the majority of riders are required to take twobus routes before reaching their final destination. Relating to headway times,this again is another player on whether or not people choose to ride the bus.Other results posted show the average age of riders and why they typicallyride the bus.
Figure 1: Graph depicting that the majority of Tulsa Transit riders typicallyneed to take more than one bus to reach their final destination.
Figure 2: Analysis of most common bus trip among Tulsa Transit riders.
Figure 3: When asked Tulsa Transit riders what improvements you wouldlike to see, 43% responded that they would like to see more frequency ofbus trips.
Figure 4: Graph portraying age distribution of Tulsa Transit riders.
Report by Nathan Kuntz
How many bus routes do you normally take toget to your final destination?
What is the purpose of your most common bustrip?
Which one improvement would you like tosee? Your age?
Data provided by Metropolitan Tulsa Transit AuthorityFigure 4Figure 3
Figure 1 Figure 2
15
TCC ridership
student enrollment Fall 2008 ‐ 24,540
student bus tickets sold per month ‐ 70
Data provided by the Metropolitan TulsaTransit Authority and Tulsa CommunityCollege
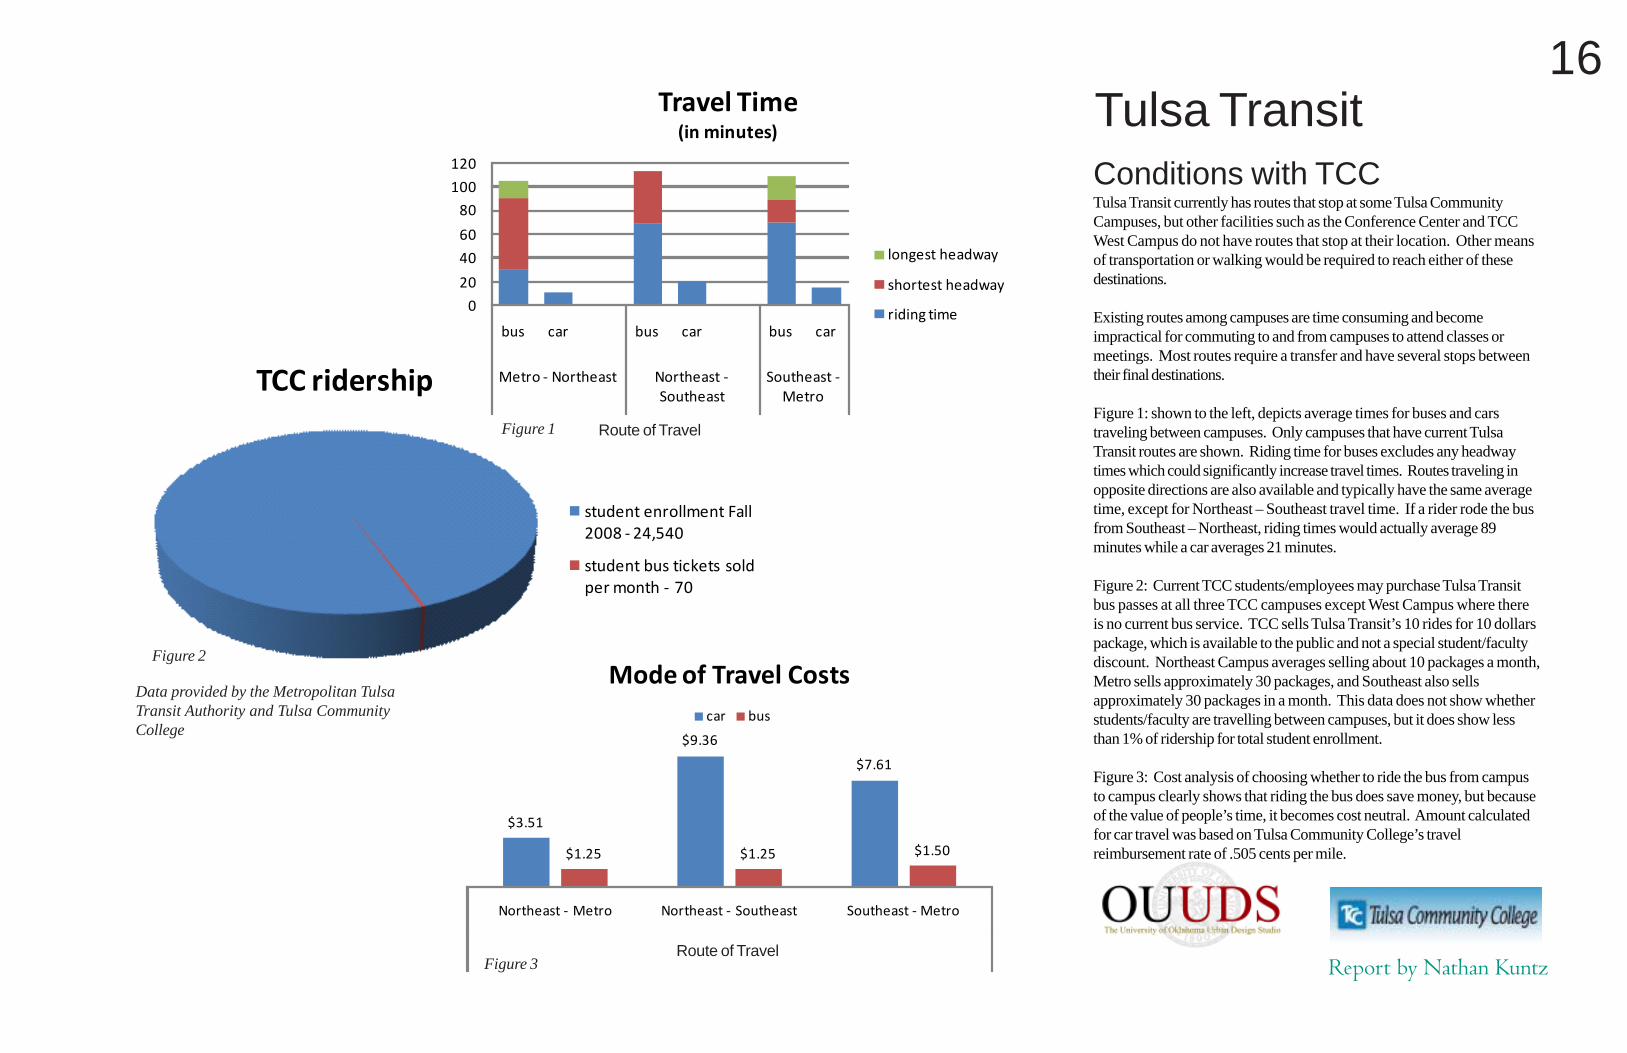
Tulsa TransitConditions with TCCTulsa Transit currently has routes that stop at some Tulsa CommunityCampuses, but other facilities such as the Conference Center and TCCWest Campus do not have routes that stop at their location. Other meansof transportation or walking would be required to reach either of thesedestinations.
Existing routes among campuses are time consuming and becomeimpractical for commuting to and from campuses to attend classes ormeetings. Most routes require a transfer and have several stops betweentheir final destinations.
Figure 1: shown to the left, depicts average times for buses and carstraveling between campuses. Only campuses that have current TulsaTransit routes are shown. Riding time for buses excludes any headwaytimes which could significantly increase travel times. Routes traveling inopposite directions are also available and typically have the same averagetime, except for Northeast – Southeast travel time. If a rider rode the busfrom Southeast – Northeast, riding times would actually average 89minutes while a car averages 21 minutes.
Figure 2: Current TCC students/employees may purchase Tulsa Transitbus passes at all three TCC campuses except West Campus where thereis no current bus service. TCC sells Tulsa Transit’s 10 rides for 10 dollarspackage, which is available to the public and not a special student/facultydiscount. Northeast Campus averages selling about 10 packages a month,Metro sells approximately 30 packages, and Southeast also sellsapproximately 30 packages in a month. This data does not show whetherstudents/faculty are travelling between campuses, but it does show lessthan 1% of ridership for total student enrollment.
Figure 3: Cost analysis of choosing whether to ride the bus from campusto campus clearly shows that riding the bus does save money, but becauseof the value of people’s time, it becomes cost neutral. Amount calculatedfor car travel was based on Tulsa Community College’s travelreimbursement rate of .505 cents per mile.
Report by Nathan Kuntz
$3.51
$9.36
$7.61
$1.25 $1.25 $1.50
Northeast ‐ Metro Northeast ‐ Southeast Southeast ‐Metro
Cost
Mode of Travel Costs
car bus
0
20
40
60
80
100
120
bus car bus car bus car
Metro ‐ Northeast Northeast ‐Southeast
Southeast ‐Metro
Travel Time(in minutes)
longest headway
shortest headway
riding time
Route of Travel
Route of TravelFigure 1
Figure 2
Figure 3
16

Images and data provided by West Virginia University; availablefrom http://transportation.wvu.edu; Internet accessed 28 July 2008
Case Studies
West Virginia University
West Virginia University is located among the hills nearby Morgantown,WV to the east and the Monongahela River to the west. This uniquegeographic layout required some different transit strategies and designs.
The most definable difference is in the college’s famous Personal RapidTransit (PRT) system. The PRT system has been established for over 30years and has recently celebrated its 70 millionth passenger. The PRTsystem is computer automated and runs on electric motors. Students/faculty simply swipe the WVU ID card and the computer driven PRT carwill arrive within five minutes.
West Virginia University also offers a campus bus which serves campusroutes, but also shares a station with the local transit service inMorgantown. At this shared bus station, riders may transfer to differentroutes throughout the city of Morgantown.
The most common route topology for West Virginia University is a looproute. WVU had experimented with a few linear routes but this resulted inservice problems. Plus, the loop system is better suited for serving areaswith limited resources and can cover a greater area. The negative of theloop route is the longer headways.
The payment method for students using both the campus bus service andthe PRT system is a transportation fee of $72 per semester.
Future plans of the Parking and Transit Services of WVU is to finishconstruction of the “Intermodal Transportation Center.” This facility willhouse 500 parking spaces, bike lockers, showers, and operate both busroutes from Morgantown and WVU campus routes.
Report by Nathan Kuntz
Figure 1: WVU campus transit map
Figure 4: PRT system
Figure 5
Figure 6
Figure 2: WVU transit bus Figure 3
17

Data and images provided by the University of Oklahoma; available from http://cart.ou.edu/about.html; Internet accessed 19 Sept 2008
Case Studies
University of Oklahoma
The University of Oklahoma has a partnership with the Cleveland AreaRapid Transit (CART) that provides the City of Norman with a publictransit system.
The CART system is comprised of five City of Norman routes, threeUniversity of Oklahoma routes, Sooner Express, and a few othercommuter routes.
CART first formed the partnership with the University of Oklahoma in1980 to help relieve parking and traffic congestion on campus. The initialsystem design was to simply be a “park and ride” design (Kris Glen,Cleveland Area Rapid Transit).
However, over the years, the University of Oklahoma has expanded itspartnership with CART. New routes were developed to serve as a transitsystem on campus rather than to and from campus.
Operating costs for university routes have typically cost one million dollarsper year. Again, recent economic factors have led to sharp increases inoperating costs, specifically cost of fuel. Student fees cover about 50% ofoperating cost and are paid through a $1.50/credit hour fee. CART alsoreceives sources from federal, state, and local grants.
The university routes are all loop routes. This route topology is bettersuited for lower density areas and is capable of covering greater areas.The drawback to loop topology are longer headways, poorer frequency,and reduced efficient.
Future improvements for CART include three new buses that operate onCompressed Natural Gas (CNG), fast fueling stations, and use of bio-diesel for current buses.
Report by Nathan Kuntz
Figure 1: University of Oklahoma transit bus
Figure 2 Figure 3 Figure 4
18

Data provided by the Chicago TransitAuthority and the University of Chi-cago; http://facilities.uchicago.edu/transparking/transportation/index.shtml: Internet accessed 19 Sept.2008.
Case Studies
University of Chicago
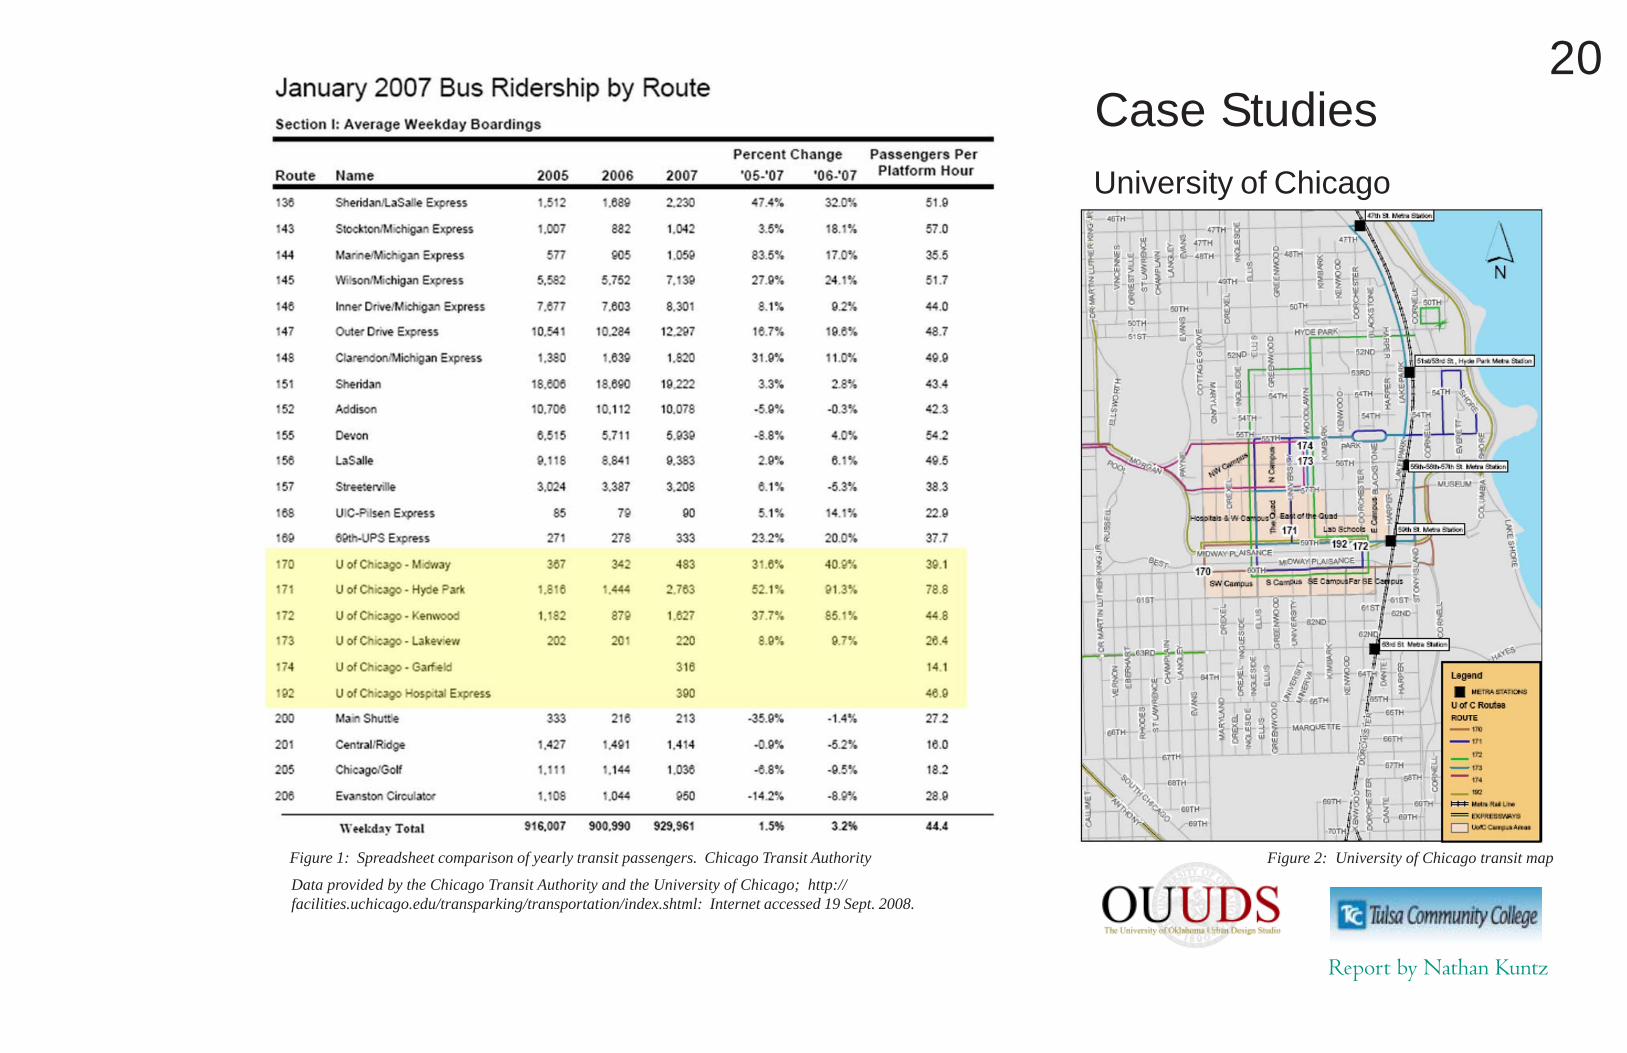
The University of Chicago has a contract with Chicago Transit Authority(CTA). This contract allows for both university use and general publicuse, although CTA does operate six routes specifically for the University ofChicago.
Students of the University of Chicago pay a transportation fee calculatedby a per semester rate. This allows students/faculty to ride any CTA busby showing their University of Chicago ID card. Cash fare for nonuniversity adults is $2.00 per ride.
Routes on the university are all loop topology for greater area coverage.Even though these are loop routes, headway for most routes average 10minutes.
With the addition of the University of Chicago routes, we can see a sharpincrease in ridership by comparing past ridership data. Unofficial reportssuggest that ridership for 2008-2009 fiscal year is projected to be evenhigher. This steep increase in ridership numbers is most likely a result ofrising fuel cost.
No specific plans are in place to convert current buses, which operate ondiesel, to CNG or other forms of alternative fuels for CTA.
Report by Nathan KuntzFigure 1: Transit Schedule at the University of Chicago
19
Case Studies
University of Chicago
Times Roman is the typical text font for the body of text in the text column.
Report by Nathan Kuntz
Data provided by the Chicago Transit Authority and the University of Chicago; http://facilities.uchicago.edu/transparking/transportation/index.shtml: Internet accessed 19 Sept. 2008.
Figure 2: University of Chicago transit mapFigure 1: Spreadsheet comparison of yearly transit passengers. Chicago Transit Authority
20

Data and images provided by the Universityof Iowa, Cambus; available from http://www.uiowa.edu/~cambus/; Internet; ac-cessed 22 Sept. 2008.
Case Studies
University of IowaThe University of Iowa operates a transit system named “Cambus.”Cambus is entirely university owned and operated. The Cambus systemhas 165 employees and almost all of them are students. This pool ofstudent employees helps to dramatically reduce operating costs(McClatchey, Brian. Cambus Manager, University of Iowa).
Cambus coordinates its routes with local transit systems by sharing acommon bus stop in downtown Coralville.
• Transit system was implemented in 1972• Operating costs for fiscal year 2008 - $38/hour per bus• Operates mainly loop routes• 10-15 minute headways• Student fees - $20/semester ($10 summer semester) for full-time
studentso No costs to public on campus
• Ridership – 3.7 million during fiscal year 2008o Students account for 75% of ridership
• Fundingo 40% - Student feeso 20% - State formula fundingo 10% - Federal Transit Authorityo 30% - Parking fees
• Use of alternative fuels – currently operating on 10% biodiesel fuelo Plans to convert to 20% biodiesel fuel soon.
Increasing fuel costs have hampered efforts to convert to alternative fuelsand other general operational costs. Fuel costs several years agoaccounted for around 8% of operating costs, but now account for over20% of operating costs.
Report by Nathan Kuntz
Figure 3
Figure 4
Figure 5
Figure 1: University of Iowa bus at night
Figure 2: University of Iowa campus transit map
21

Data and images provided by Oklahoma State University; http://www.osu-tulsa.okstate.edu/services/shuttle.asp: Internet accessed 19 Sept. 2008.
Case Studies
Oklahoma State University
Oklahoma State University began in 1997 operating two buses contractedfrom First Capital Trolley from Guthrie, Oklahoma. By 2002 the OSUshuttle system ridership had grown to over 200,000 and several newbuses have entered service. (Singleton, Steve. Assistant Manager, OSUTransit)
The OSU shuttle is partnered with the community of Stillwater, Oklahomaoffering both on and off campus services.
• Transit system was implemented in 1997• Operates mainly linear routes (recently converted from loop
routes)• Average of 15 minute headways• Fees -Student voted $2 per credit hour transit fee; $.50/ride for
general public• Ridership – 560,262 boardings in 2005• Funding - Use of federal funding from grants 5311 (less than
50,000 population) and 5309 (purchase buses, bike racks, busstops)
• Use of alternative fuels – currently using diesel with plans toconvert to CNG
Report by Nathan Kuntz
Figure 3: OSU bus shelter with solar panelFigure 1: OSU bus outfitted with bike rack
Figure 4
Figure 2: OSU campus transit map
22

This is typical text for captions and footnotes below images.
Case Studies
Oklahoma State University
Oklahoma State University offers a shuttle system from OSU Stillwatercampus to OSU Tulsa campus. This system operates on differentheadway times adjusted for peak demand times. The payment method isalso different from the on-campus system. Reservations must be madethrough OSU transit center ahead of time and ridership fees are $7.00 forstudents one-way and $13.00 for faculty/staff one-way.
This trip from Stillwater to Tulsa or vice-versa is approximately 70 milesand takes about one hour and 15 minutes.
Report by Nathan Kuntz
Tulsa to Stillwater
Depart Tulsa Arrive Stillwater5:30 a.m. 6:45 a.m.7:00 a.m. 8:15 a.m.7:30 a.m. 8:45 a.m.9:00 a.m. 10:15 a.m.12:30 p.m. 1:45 p.m.2:30 p.m. 3:45 p.m.4:30 p.m. 5:45 p.m.*7:30 p.m. *8:45 p.m.*10:30 p.m. *11:45 p.m.
Stillwater to Tulsa
Depart Stillwater Arrive Tulsa5:30 a.m. 6:45 a.m.7:15 a.m. 8:30 a.m.10:45 a.m. 12:00 p.m.12:30 p.m. 1:45 p.m.2:30 p.m. 3:45 p.m.4:30 p.m. 5:45 p.m.5:30 p.m. 6:45 p.m.*7:30 p.m. *8:45 p.m.*10:30 p.m. *11:45 p.m.
Data and images provided by Oklahoma State University; http://www.osu-tulsa.okstate.edu/services/shuttle.asp: Internet accessed 19 Sept. 2008.
Figure 2
Figure 1
Figure 3
Aerial photography provided by GoogleEarth
23

Transit Survey
Tulsa Community CollegeAn online survey was posted on the Tulsa Community College websiteregarding a proposed TCC transit service. This survey was availableduring November and December of 2008. The survey consisted of 24questions and asked a range of transit questions.
This survey was developed by sampling past university transit surveys suchas the one from the University of Chicago along with specific questionstailored to the needs of Tulsa Community College. The survey was alsomodeled after the Tulsa Transit survey.
The survey resulted in 1,228 views and 595 participants providing crucialdata regarding the transit study.
Report by Nathan Kuntz
Figure 2: Tulsa Community College website. www.tulsacc.edu
Chart created by Zipsurvey.com Figure 1: TCC Transit Survey Results
Questions 1-5 gathered demographicdata from both the faculty and students.This determination would later be ableto separate specific groups and identifydeveloping themes and patterns interms of transit needs and requests.
Other questions targeted the campusmost often attended, which campus arider travels to if traveling amongcampuses, current mode oftransportation, and amount of traveltime.
24

Transit Survey
Tulsa Community College
Report by Nathan Kuntz
The survey’s initial results indicate the premise that there is a demand for atransit system at Tulsa Community College and students and faculty alike arewilling to pay for the service.
Also, the data represents a need for TCC students to have access to othercolleges within Tulsa, while large majorities of TCC students/faculty believe aroute to the conference center is unnecessary.
Chart created by Zipsurvey.com
Chart created by Zipsurvey.com Figure 1: TCC Transit Survey Results
Figure 2: TCC Transit Survey Results
Questions 6-12 cover thebasis for the overalldemand for a transit systemamong TCC campuses.Question six specificallyaddresses the question“would you use theservice?” The result of thisquestion responded in 58%of the particpantsanswering “yes.”
Question 7 was designed todetermine the specificdemand among campuses.The largest percentage ofpeople would prefer a routelinking the Metro Campusand Southeast Campus.
Other questions weretargeted toward routedesign and financialestimates/payment methods.
25

Transit Survey
Tulsa Community College
Report by Nathan Kuntz
Chart created by Zipsurvey.com
Questions 16 and 17 from the survey asked in which city you currently reside and its zipcode. This dataprovided insight into where the majority of students and faculty live and what campus they traveling to.Analysis of this data would prove that the two largest survey participants bodies reside by Metro campus andSoutheast campus.
Chart created by Zipsurvey.comFigure 1: TCC Transit Survey Results Figure 2: TCC Transit Survey Results
26

Transit Survey
Tulsa Community College
The typical time which students are on campus is also a consideration
when determining peak times of the transit system. Results indicate the
majority of students are on campus from 7:00 am to approximately 1:00
pm Monday through Friday. Very few students are on campus during
weekends and would not attain target transit operating ridership.
Report by Nathan Kuntz
Chart created by Zipsurvey.com
Chart created by Zipsurvey.com Figure 1: Results of TCC Transit Survey
Figure 2: Results of TCC Transit Survey
27

Transportation to campus
0 20 40 60 80 100 120 140 160 180 200
Carpool
Drive by yourself
Ride a bike
Ride a bus
Ride a motorcycle
Walk
number of responses
part-time student
part-time employee
full-time student
full-time employee
Transit Survey
Tulsa Community CollegeUsing statistical software (SPSS) I was obtained more value from thesurvey by identifying specific groups and trends that developed throughoutparticipant’s responses.
Figure 1: using SPSS I determined how much money students would bewilling to pay to ride a bus one way compared to faculty.
Figure 2: a break down of how students and faculty typically travel tocampus.
Figure 3: a specific look at how full time students typically travel tocampus.
The data indicates that the vast majority of TCC students and faculty drivethemselves when traveling to campus.
Report by Nathan Kuntz
How much would you be willing to pay per ride?
How do you typically travel to campus?
0 10 20 30 40 50 60 70 80
$0.00
$0.50
$1.00
$1.50
$2.00
More than $2.00
part-time student
part-time employee
full-time student
full-time employee
Figure 2: Graph displaying how TCC faculty and students typically get to campus
Figure 3: Analysis of how full-time students travel to campus
Full-time student mode of transit
Figure 1: Graph depicting the amount TCC participants would be willing to pay.
Carpool
Drive by yourself
Ride a bike
Ride a bus
Ride a motorcycle
Walk
28

Travel between campuses
0 10 20 30 40 50
Metro
Northeast
Southeast
West
West
Southeast
Northeast
Metro
Transit Survey
Tulsa Community College
Report by Nathan Kuntz
How long does it take you to travel to campus by yourself?
How long does it take you to typically travel to campus?
Which campus would you prefer a route to?
0
50
100
150
200
250
Less than10
minutes
11-20minutes
21-30minutes
31-40minutes
41-50minutes
51-60minutes
More thanone hour
Drive by yourself
Ride a bus
Time frames for TCC students and faculty arriving at campus have a widevariety, but the most common travel time is around 10 to 30 minutes.As a general rule of thumb, public transportation systems operate about twiceas long as it would take a person to drive to their destination and still havepositive ridership. Students are more likely to wait a little longer for publictransportation than most general public.
Target goal for a transit system would be to operate a system with a 45 minuteheadway. This target time would be about double the travel time to drive, butstill be efficient enough to encourage ridership.
Figure 1: this chart depicts demand from one campus to another. The strongestroute demand is from Southeast Campus to Metro Campus while the secondstrongest demand is vice versa.
Figure 1: Results of TCC Transit Survey.Analysis of responses that depict need forroute between campuses. The highestdemand for a TCC route between cam-puses is linking the Southeast Campus toMetro Campus.
Figure 2: Line graphdisplaying amount oftravel time by carcompared to use ofcurrent Tulsa Transitroutes. The majority ofsurvey respondents totravel to campus by carwhile only a few travelto campus by bus.
Figure 3: Analysis of typical traveltime by single occupancy vehicles
Less than 10 minutes
11-20 minutes
21-30 minutes
31-40 minutes
41-50 minutes
51-60 minutes
More than one hour
29

Transity Survey
Tulsa Community College
Report by Nathan Kuntz
Would you ride a TCC transit bus?
Would you ride a TCC transit bus?
Taking a closer look at the specific question “would you ride a TCC transit bus”the number of “yes” responses were the largest at Metro Campus. MetroCampus is the second largest campus in student enrollment. It is also possiblethat my influence at the Metro Campus has encouraged a larger representation ofthe Metro Campus than there would have been without my influence.
However, with that aside, Metro Campus and Southeast Campus have the twolargest raw data counts for responding “yes.” Logically, this could lead to theconclusion that if only two campuses were to be connected by a transit service,that a Metro and Southeast connection would be the best utilized.
On the other hand, if you take the total number of those who responded “yes”and normalized this figure by the actual number of respondents at each campus,results indicated West Campus may actually have the highest demand for a transitservice. Following closely behind West Campus in specific demand by campus,the Northeast Campus shows a high percentage of those who responded “yes” toI would ride a TCC transit bus.
For the scenario of establishing one route to connect two campuses, the challengeis to determine which campuses would be best served by a connecting route.Which factor determines where a route should be located, absolute values orspecific demand?
Figure 2: Graph displaying thesame data from question #6 butnormalized by campus size. Thisdata determines that West Campushas the highest percentage ofdemand than any other campus.
Figure 1: Graph displaying rawcounts of the TCC survey question#6, “would you ride a TCC transitbus,” by campus
30
campus raw counts
0 20 40 60 80 100 120 140
Metro
Northeast
Southeast
West
Not sure
No
Yes
campus percentage
0% 10% 20% 30% 40% 50% 60% 70%
Metro
Northeast
Southeast
West
Not sure
No
Yes

Tulsa Community College
Transit Survey
Report by Nathan Kuntz
Raw counts of survey participants by zipcode
Survey participants normalized by zipcode population
Maps shown here are similar to charts from “would you ride a TCC transit bus”question. In this case, I have represented the survey by zipcode and mappedcounts of each respondent using GIS.
Figure 1: this image is the raw count of participant numbers in which zipcodethey reside. Note the fact that the largest percentage is in South Tulsa nearSoutheast Campus, TCC’s largest campus.
Figure 2: this image is survey respondents number normalized by actual zipcodepopulation. From this map, it is determined that a larger majority of people nearWest Campus have taken the transit survey.
Figure 3: word cloud image depicting which zipcodes occurred most frequentlyin aspect to its size.
Image created using http://www.wordle.net/
Figure 1
Figure 2
Figure 3
31

Aerial photography provided by google earth
Route Design
TCC Route Topologies
Figure 1: Single Loop Topology:This map displays the general design concept ofusing a single loop topology to connect all TCCcampuses.
Report by Nathan Kuntz
Figure 2: Dual Loop Topology:This map provides the general design concept fordeveloping a dual loop route system to connect allTCC campuses.
Figure 3: Hub and Spoke Topology:This map depicts routes serving all TCC campusesusing a hub and spoke system with TCC MetroCampus serving as the system hub.
Figure 4: Point-to-Point Topology:Map portrayal of all TCC Campuses served bytransit routes on a point-to-point system.
Figure 5: Full Mesh Topology:Conceptual diagram of all TCC campuses beingserved by a full mesh topology
Figure 6: Trunk and Feeder Topology:Map depicting a general design for a trunk andfeeder topology applied to all TCC campuses.
32

This is typical text for captions and footnotes below images.
Tulsa Area Colleges
Oklahoma State University - Tulsa
Oklahoma State University is located in the historic Greenwood District ofTulsa north of downtown. OSU Tulsa has offered classes at this locationsince 1982. The college has more than 2,600 students attending and offersseveral transfer options with Tulsa Community College.
University of Oklahoma - Tulsa
Northeastern State University -Broken Arrow
University of Tulsa
Oral Roberts University
Report by Nathan Kuntz
University of Oklahoma – Tulsa is located at 41st and Yale. This campus isknown as Schusterman Center. The OU-Tulsa Campus has an emphasison Health Sciences and tends to offer more graduate level courses.However, many TCC students enrolled in Allied Health Program plan tocontinue their education at OU-Tulsa, specifically in the PharmacyProgram.
Founded in 1894, the University of Tulsa has a total enrollment of 4,165students and has been ranked among the top 100 colleges by U.S. Newsand World Report. TU offers 59 undergraduate, 33 graduate, and 9 doc-toral programs.
Oral Roberts University is located in south Tulsa on 263 acres. Programsoffered are 65 undergraduate, 14 masters, and 2 doctoral. Business is thelargest program at ORU. Current total enrollment for credit hour during Fallof 2008 is 3,067.
Located in Broken Arrow, one of the fastest growing cities in Okla-homa, Broken Arrow campus is an extension of the Tahlequah basedcampus. NSU-Broken Arrow shares many transfer programswith TCC such as Hospitality and Gaming program.
Langston University - TulsaLangston University has three campuses in Oklahoma, includingLangson, Oklahoma City, and Tulsa. The Langston TulsaUniversity is located adjacent to OSU-Tulsa Campus in theGreenwood District. Tulsa Community College and LangstonUniversity operate a 2+2 program geared toward education.Students enrolled in this program receive an Associate’s Degreeat TCC, then attend Langston University for their Bachelor’s.
Aerial photography provided by Google Earth
33
Aerial photography courtesy of google earth
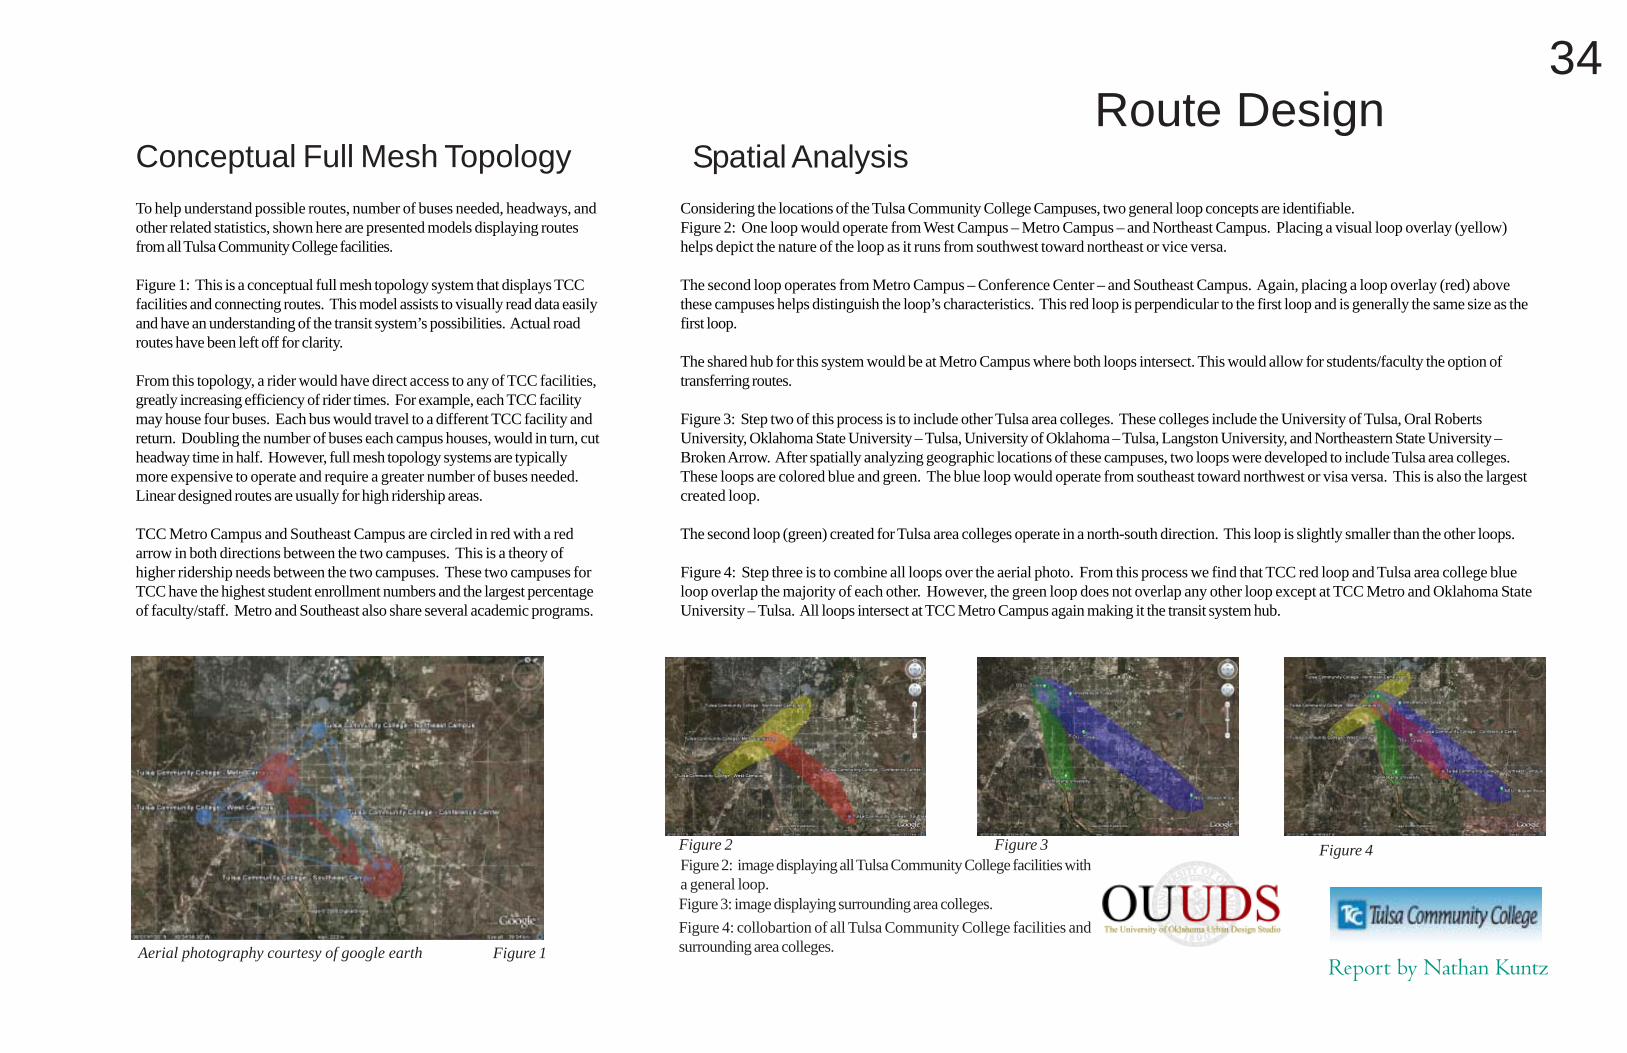
Route DesignConceptual Full Mesh Topology
To help understand possible routes, number of buses needed, headways, andother related statistics, shown here are presented models displaying routesfrom all Tulsa Community College facilities.
Figure 1: This is a conceptual full mesh topology system that displays TCCfacilities and connecting routes. This model assists to visually read data easilyand have an understanding of the transit system’s possibilities. Actual roadroutes have been left off for clarity.
From this topology, a rider would have direct access to any of TCC facilities,greatly increasing efficiency of rider times. For example, each TCC facilitymay house four buses. Each bus would travel to a different TCC facility andreturn. Doubling the number of buses each campus houses, would in turn, cutheadway time in half. However, full mesh topology systems are typicallymore expensive to operate and require a greater number of buses needed.Linear designed routes are usually for high ridership areas.
TCC Metro Campus and Southeast Campus are circled in red with a redarrow in both directions between the two campuses. This is a theory ofhigher ridership needs between the two campuses. These two campuses forTCC have the highest student enrollment numbers and the largest percentageof faculty/staff. Metro and Southeast also share several academic programs.
Report by Nathan Kuntz
Spatial Analysis
Considering the locations of the Tulsa Community College Campuses, two general loop concepts are identifiable.Figure 2: One loop would operate from West Campus – Metro Campus – and Northeast Campus. Placing a visual loop overlay (yellow)helps depict the nature of the loop as it runs from southwest toward northeast or vice versa.
The second loop operates from Metro Campus – Conference Center – and Southeast Campus. Again, placing a loop overlay (red) abovethese campuses helps distinguish the loop’s characteristics. This red loop is perpendicular to the first loop and is generally the same size as thefirst loop.
The shared hub for this system would be at Metro Campus where both loops intersect. This would allow for students/faculty the option oftransferring routes.
Figure 3: Step two of this process is to include other Tulsa area colleges. These colleges include the University of Tulsa, Oral RobertsUniversity, Oklahoma State University – Tulsa, University of Oklahoma – Tulsa, Langston University, and Northeastern State University –Broken Arrow. After spatially analyzing geographic locations of these campuses, two loops were developed to include Tulsa area colleges.These loops are colored blue and green. The blue loop would operate from southeast toward northwest or visa versa. This is also the largestcreated loop.
The second loop (green) created for Tulsa area colleges operate in a north-south direction. This loop is slightly smaller than the other loops.
Figure 4: Step three is to combine all loops over the aerial photo. From this process we find that TCC red loop and Tulsa area college blueloop overlap the majority of each other. However, the green loop does not overlap any other loop except at TCC Metro and Oklahoma StateUniversity – Tulsa. All loops intersect at TCC Metro Campus again making it the transit system hub.
Figure 2: image displaying all Tulsa Community College facilities witha general loop.Figure 3: image displaying surrounding area colleges.
Figure 4: collobartion of all Tulsa Community College facilities andsurrounding area colleges.Figure 1
Figure 4Figure 3Figure 2
34

Route Design
Tulsa Community College
Report by Nathan Kuntz
This map (figure 1) presents general routes Tulsa Transit operates that wouldintersect with a proposed route from TCC’s Southeast Campus and MetroCampus.
The orange line represents TCC transit route between southeast and metrocampuses, while highlighted green circles indicate where the TCC route wouldintersect with Tulsa Transit routes. These areas could serve as additional stopsto allow greater public access to the route if deemed necessary by the FederalTransit Administration in conjunction with TCC forming a partnership withTulsa Transit.
However, if TCC independently operates the transit system, a few additionalstops along this route should be considered to grant access to the nearbyconference center and greater public accessibility.
Many university transit systems that are independently operated also strive tomaintain a positive working relationship with the existing local transit authority.Having two transit systems in place does not always mean a direct competitionwill exist. The two systems have an opportunity to complement one anotherand create nodes that allow passengers to transfer buses allowing greateraccess to destinations and making public transit system more effective.
Figure 1Aerial photography provided by GoogleEarth
Figure 1: displays proposed TCC route (orange) and intersecting current Tulsa Transit routes. Although these routesintersect, the proposed TCC route travels on the expressway while Tulsa Transit routes utilize mostly arterial streets.Therefore, necessary adjustments would need to be included in route design to ensure that patrons for both TCC Transitsystem and Tulsa Transit would have a safe environment for bus transfers.
35
Route Topologies
Single Loop
Report by Nathan Kuntz
Aerial photo provided by GoogleEarth
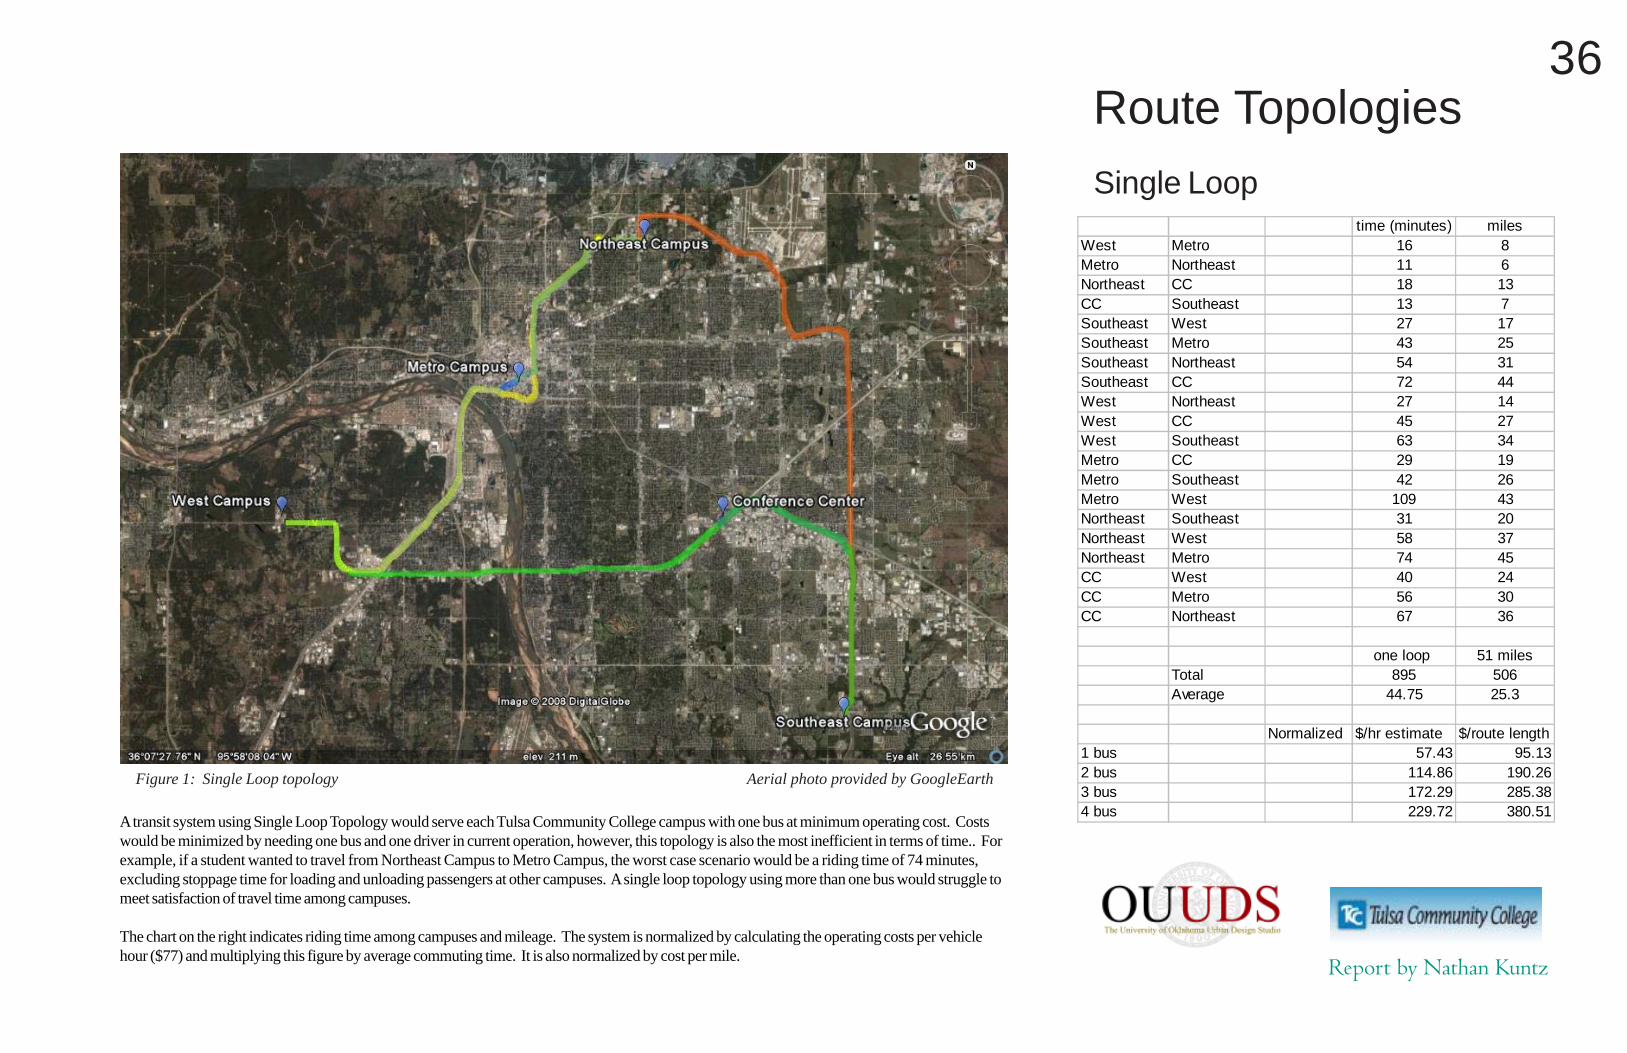
A transit system using Single Loop Topology would serve each Tulsa Community College campus with one bus at minimum operating cost. Costswould be minimized by needing one bus and one driver in current operation, however, this topology is also the most inefficient in terms of time.. Forexample, if a student wanted to travel from Northeast Campus to Metro Campus, the worst case scenario would be a riding time of 74 minutes,excluding stoppage time for loading and unloading passengers at other campuses. A single loop topology using more than one bus would struggle tomeet satisfaction of travel time among campuses.
The chart on the right indicates riding time among campuses and mileage. The system is normalized by calculating the operating costs per vehiclehour ($77) and multiplying this figure by average commuting time. It is also normalized by cost per mile.
Figure 1: Single Loop topology
36
time (minutes) milesWest Metro 16 8Metro Northeast 11 6Northeast CC 18 13CC Southeast 13 7Southeast West 27 17Southeast Metro 43 25Southeast Northeast 54 31Southeast CC 72 44West Northeast 27 14West CC 45 27West Southeast 63 34Metro CC 29 19Metro Southeast 42 26Metro West 109 43Northeast Southeast 31 20Northeast West 58 37Northeast Metro 74 45CC West 40 24CC Metro 56 30CC Northeast 67 36
one loop 51 milesTotal 895 506Average 44.75 25.3
Normalized $/hr estimate $/route length1 bus 57.43 95.132 bus 114.86 190.263 bus 172.29 285.384 bus 229.72 380.51
Route Topologies
Dual Loop
Report by Nathan Kuntz
Aerial photo provided by GoogleEarth
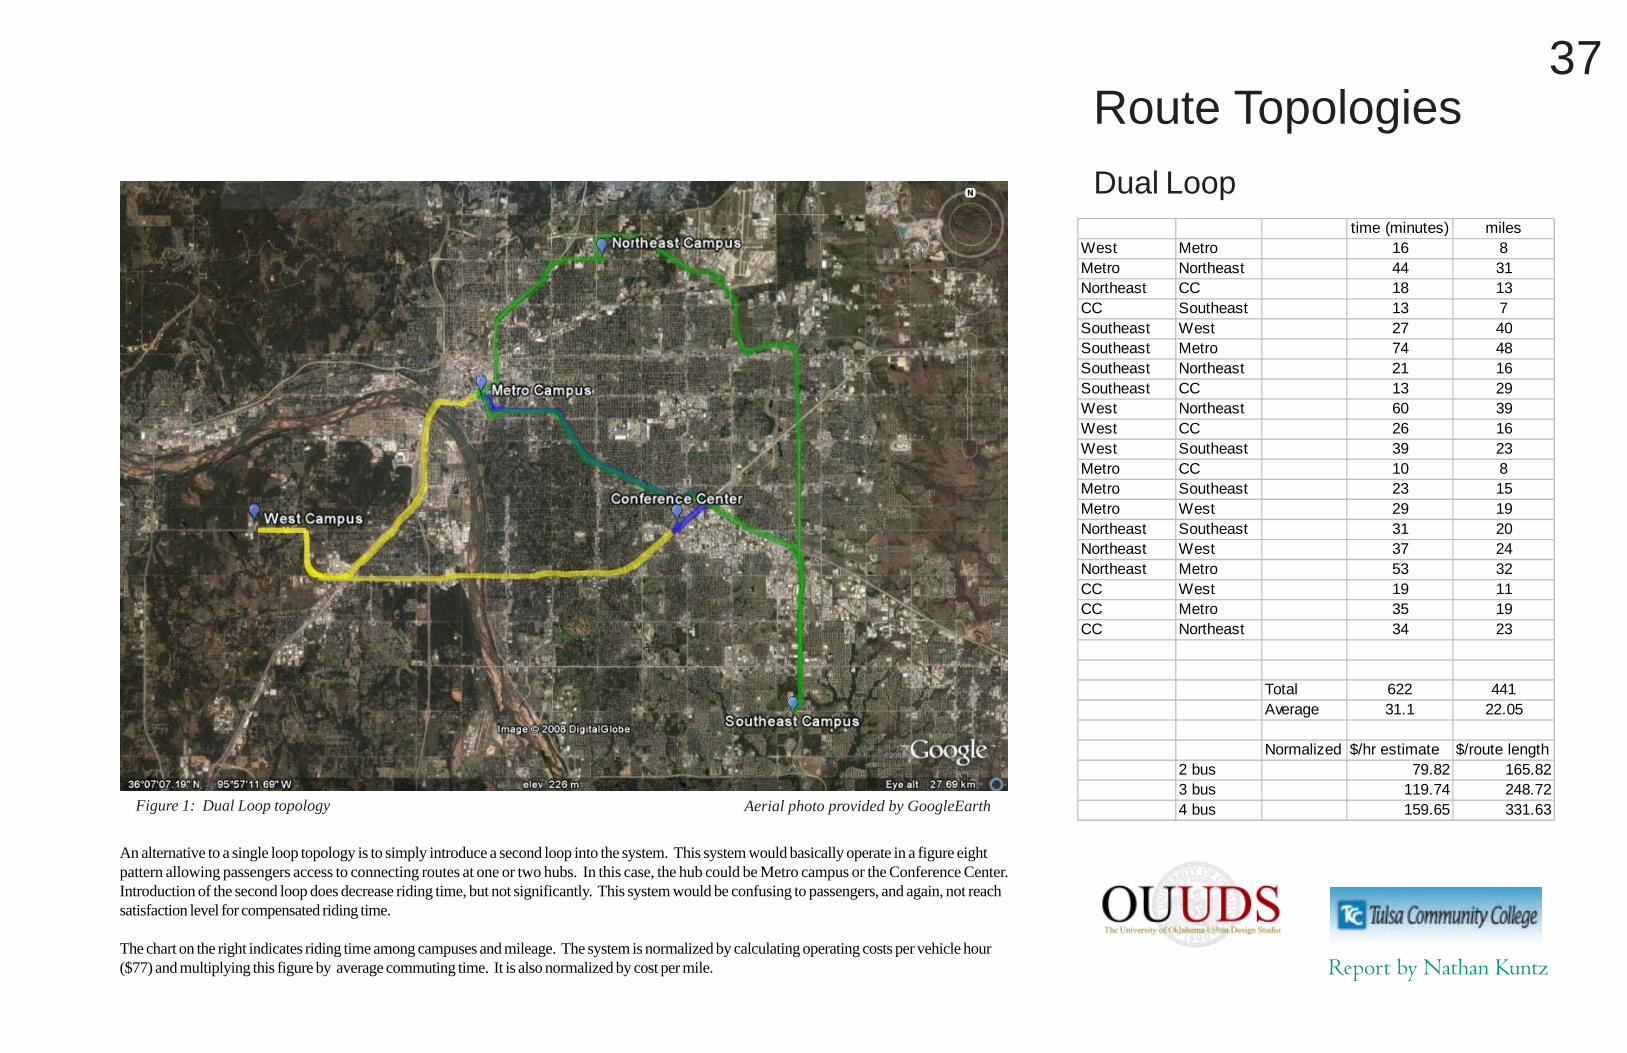
An alternative to a single loop topology is to simply introduce a second loop into the system. This system would basically operate in a figure eightpattern allowing passengers access to connecting routes at one or two hubs. In this case, the hub could be Metro campus or the Conference Center.Introduction of the second loop does decrease riding time, but not significantly. This system would be confusing to passengers, and again, not reachsatisfaction level for compensated riding time.
The chart on the right indicates riding time among campuses and mileage. The system is normalized by calculating operating costs per vehicle hour($77) and multiplying this figure by average commuting time. It is also normalized by cost per mile.
Figure 1: Dual Loop topology
37
time (minutes) milesWest Metro 16 8Metro Northeast 44 31Northeast CC 18 13CC Southeast 13 7Southeast West 27 40Southeast Metro 74 48Southeast Northeast 21 16Southeast CC 13 29West Northeast 60 39West CC 26 16West Southeast 39 23Metro CC 10 8Metro Southeast 23 15Metro West 29 19Northeast Southeast 31 20Northeast West 37 24Northeast Metro 53 32CC West 19 11CC Metro 35 19CC Northeast 34 23
Total 622 441Average 31.1 22.05
Normalized $/hr estimate $/route length2 bus 79.82 165.823 bus 119.74 248.724 bus 159.65 331.63
Route Topologies
Hub & Spoke - Metro Campus
Report by Nathan Kuntz
Aerial photo provided by GoogleEarth
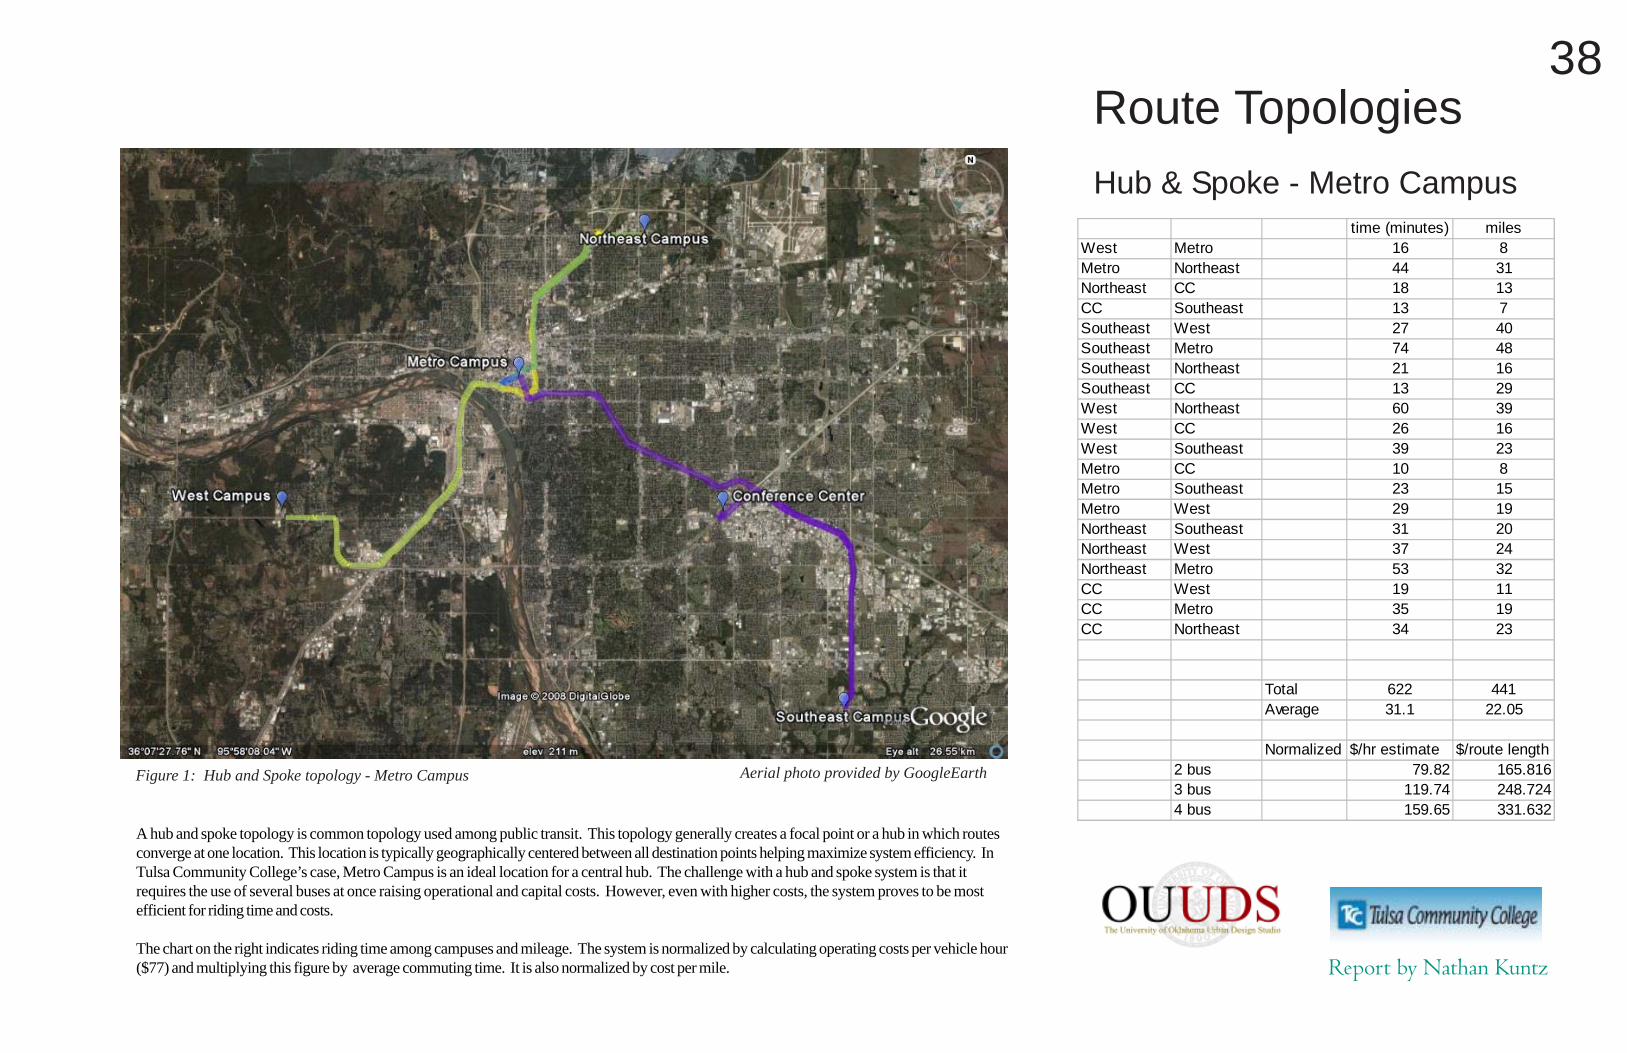
A hub and spoke topology is common topology used among public transit. This topology generally creates a focal point or a hub in which routesconverge at one location. This location is typically geographically centered between all destination points helping maximize system efficiency. InTulsa Community College’s case, Metro Campus is an ideal location for a central hub. The challenge with a hub and spoke system is that itrequires the use of several buses at once raising operational and capital costs. However, even with higher costs, the system proves to be mostefficient for riding time and costs.
The chart on the right indicates riding time among campuses and mileage. The system is normalized by calculating operating costs per vehicle hour($77) and multiplying this figure by average commuting time. It is also normalized by cost per mile.
Figure 1: Hub and Spoke topology - Metro Campus
38
time (minutes) milesWest Metro 16 8Metro Northeast 44 31Northeast CC 18 13CC Southeast 13 7Southeast West 27 40Southeast Metro 74 48Southeast Northeast 21 16Southeast CC 13 29West Northeast 60 39West CC 26 16West Southeast 39 23Metro CC 10 8Metro Southeast 23 15Metro West 29 19Northeast Southeast 31 20Northeast West 37 24Northeast Metro 53 32CC West 19 11CC Metro 35 19CC Northeast 34 23
Total 622 441Average 31.1 22.05
Normalized $/hr estimate $/route length2 bus 79.82 165.8163 bus 119.74 248.7244 bus 159.65 331.632

Route Design
MC Hub and Spoke - Timing
Report by Nathan Kuntz
Expected travel time is a critical factor in route planning especially in hub andspoke systems where routes are dependent on each other. In thisdemonstration of route times, students may be transferring buses to ride toanother campus. A layover time at Metro campus must be established for thisto occur.
Travel time from Metro to Northeast is the shortest riding time and can serveas a buffer route to buses that are struggling to stay on time.Traveling from Metro Campus to either West or Southeast campus is relativelyequal riding time.
Figure 1: Map displaying estimated route travel time by bus for MetroCampus and West Campus connection.
Figure 2: Map displaying estimated route travel time by bus for MetroCampus and Northeast Campus connection. Note that this route is theshortest route for time and mileage.
Figure 3: Map displaying estimated route travel time by bus for MetroCampus and Southeast Campus connection. This route is the longest mileagebut utilization of expressways keeps travel time relatively similar as the routeconnecting Metro and West campuses.
Figure 4: Map portraying overall transit scheme for travel time.
Figure 1 Figure 2
Figure 3 Figure 4
39

Route Topologies
Hub & Spoke - Southeast
Report by Nathan Kuntz
Aerial photo provided by GoogleEarth
One scenario for a hub and spoke system would be to establish the hub at Southeast Campus. The reason for doing so is that Southeast campushas the largest student and faculty population. Perhaps the system could be better utilized if all routes were directed inbound and outbound from thislocation. The challenge with this topology is that this significantly raises riding time and result in poor ridership. Also, this system is less efficientfiscally.
The chart on the right indicates riding time among campuses and mileage. The system is normalized by calculating operating costs per vehicle hour($77) and multiplying this figure by average commuting time. It is also normalized by cost per mile.
Figure 1: Hub and Spoke topology - Southeast Campus
40
time (minutes) milesWest Metro 43 30Metro Northeast 37 29Northeast CC 34 23CC Southeast 13 24Southeast West 27 17Southeast Metro 16 13Southeast Northeast 21 16Southeast CC 13 7West Northeast 48 33West CC 40 24West Southeast 27 17Metro CC 29 20Metro Southeast 16 13Metro West 43 30Northeast Southeast 21 16Northeast West 48 33Northeast Metro 37 29CC West 40 24CC Metro 29 20CC Northeast 34 23
Total 616 441Average 30.8 22.05
Normalized $/hr estimate $/route length
4 bus 158.11 331.63

Route Topologies
Full Mesh
Report by Nathan Kuntz
A full mesh topology is a system that creates routes to every destination point from any point of origin. This is the most efficient system for ridingtime, but is exceedingly expensive to operate. Generally speaking, only transit systems that have very large ridership numbers and are well funded,can financially operate a full mesh topology. Tulsa Community College would need a minimum of 16 buses in operation to use a full mesh topologyand student ridership would have to be extremely high.
The chart on the right indicates riding time among campuses and mileage. The system is normalized by calculating operating costs per vehicle hour($77) and multiplying this figure by average commuting time. It is also normalized by cost per mile.
Aerial photo provided by GoogleEarthFigure 1: Full Mesh topology
41
time (minutes) milesWest Metro 16 8Metro Northeast 11 6Northeast CC 18 13CC Southeast 13 7Southeast West 27 17Southeast Metro 16 13Southeast Northeast 21 16Southeast CC 13 7West Northeast 23 13West CC 19 11West Southeast 27 17Metro CC 10 8Metro Southeast 16 13Metro West 16 8Northeast Southeast 21 13Northeast West 23 13Northeast Metro 11 6CC West 19 11CC Metro 10 8CC Northeast 18 13
Total 348 221Average 17.4 11.05
Normalized $/hr estimate $/route length
9 bus 200.97 373.93
Detailed Route Design
Tulsa Community College
Report by Nathan Kuntz
Aerial photo provided by GoogleEarth
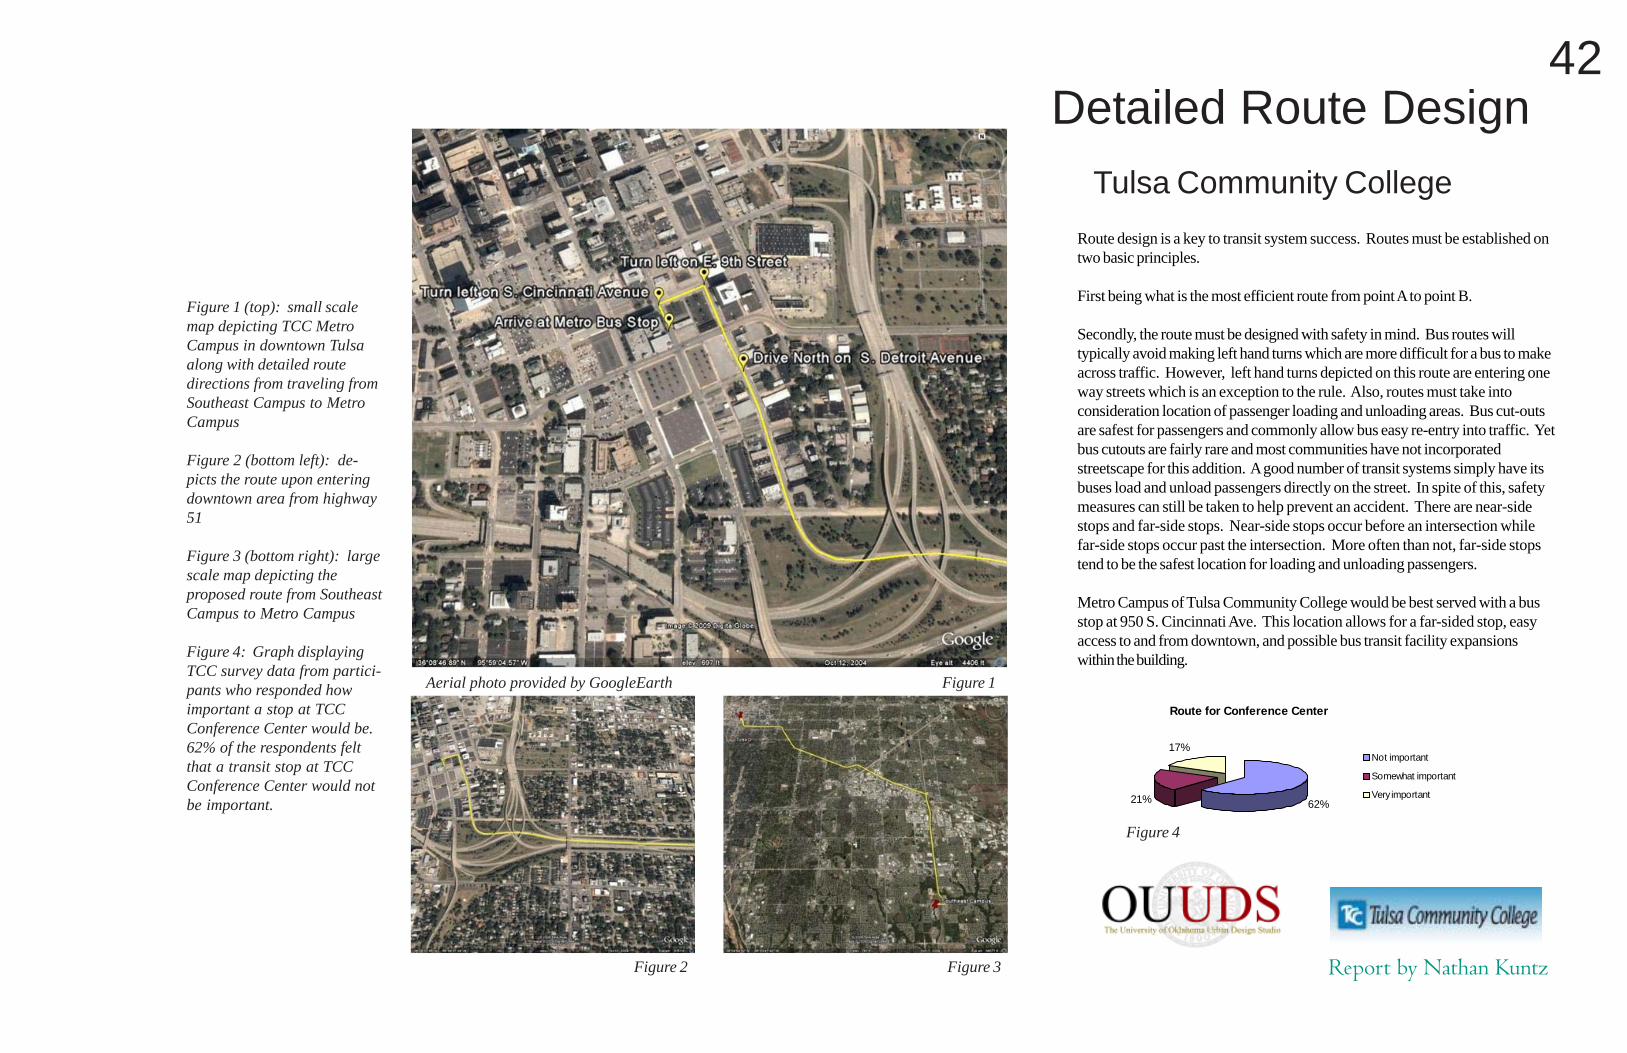
Route design is a key to transit system success. Routes must be established ontwo basic principles.
First being what is the most efficient route from point A to point B.
Secondly, the route must be designed with safety in mind. Bus routes willtypically avoid making left hand turns which are more difficult for a bus to makeacross traffic. However, left hand turns depicted on this route are entering oneway streets which is an exception to the rule. Also, routes must take intoconsideration location of passenger loading and unloading areas. Bus cut-outsare safest for passengers and commonly allow bus easy re-entry into traffic. Yetbus cutouts are fairly rare and most communities have not incorporatedstreetscape for this addition. A good number of transit systems simply have itsbuses load and unload passengers directly on the street. In spite of this, safetymeasures can still be taken to help prevent an accident. There are near-sidestops and far-side stops. Near-side stops occur before an intersection whilefar-side stops occur past the intersection. More often than not, far-side stopstend to be the safest location for loading and unloading passengers.
Metro Campus of Tulsa Community College would be best served with a busstop at 950 S. Cincinnati Ave. This location allows for a far-sided stop, easyaccess to and from downtown, and possible bus transit facility expansionswithin the building.
Figure 1 (top): small scalemap depicting TCC MetroCampus in downtown Tulsaalong with detailed routedirections from traveling fromSoutheast Campus to MetroCampus
Figure 2 (bottom left): de-picts the route upon enteringdowntown area from highway51
Figure 3 (bottom right): largescale map depicting theproposed route from SoutheastCampus to Metro Campus
Figure 4: Graph displayingTCC survey data from partici-pants who responded howimportant a stop at TCCConference Center would be.62% of the respondents feltthat a transit stop at TCCConference Center would notbe important.
Figure 4
Figure 1
Figure 2 Figure 3
Route for Conference Center
62%21%
17%Not important
Somewhat important
Very important
42
Report by Nathan Kuntz
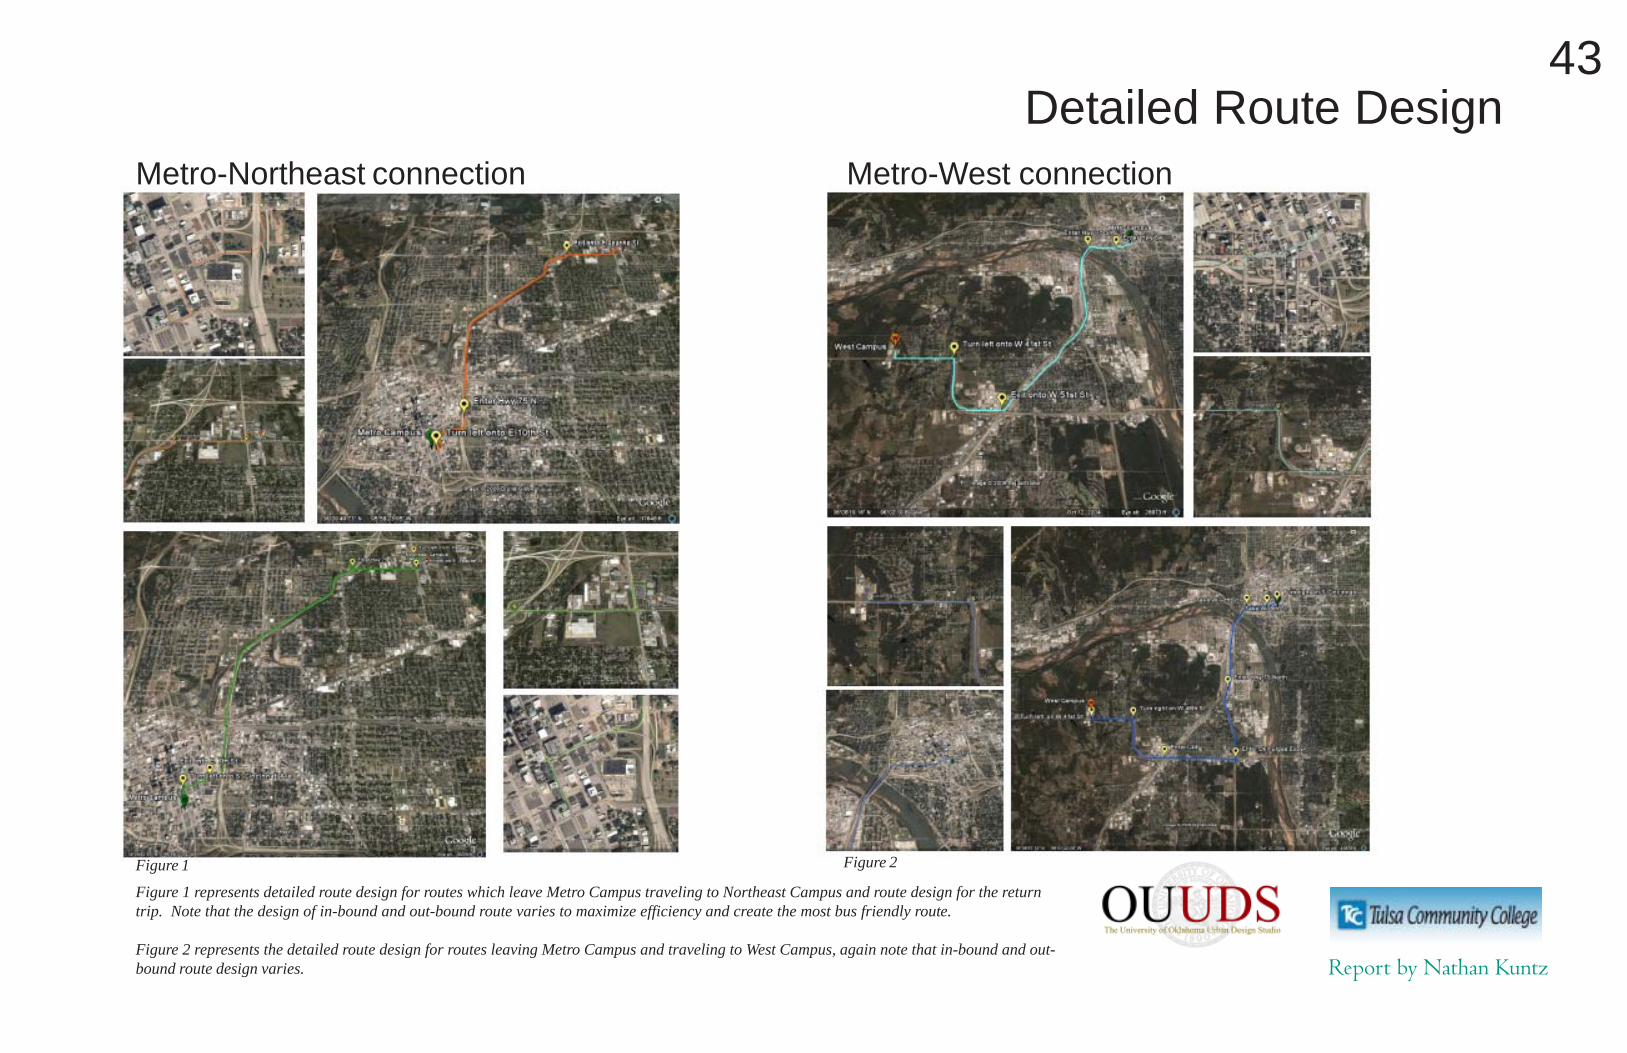
Detailed Route Design
Figure 1 represents detailed route design for routes which leave Metro Campus traveling to Northeast Campus and route design for the returntrip. Note that the design of in-bound and out-bound route varies to maximize efficiency and create the most bus friendly route.
Figure 2 represents the detailed route design for routes leaving Metro Campus and traveling to West Campus, again note that in-bound and out-bound route design varies.
Metro-Northeast connection Metro-West connection
Figure 1 Figure 2
43
Bus Shelter Architecture
Tulsa Community College
Report by Nathan Kuntz
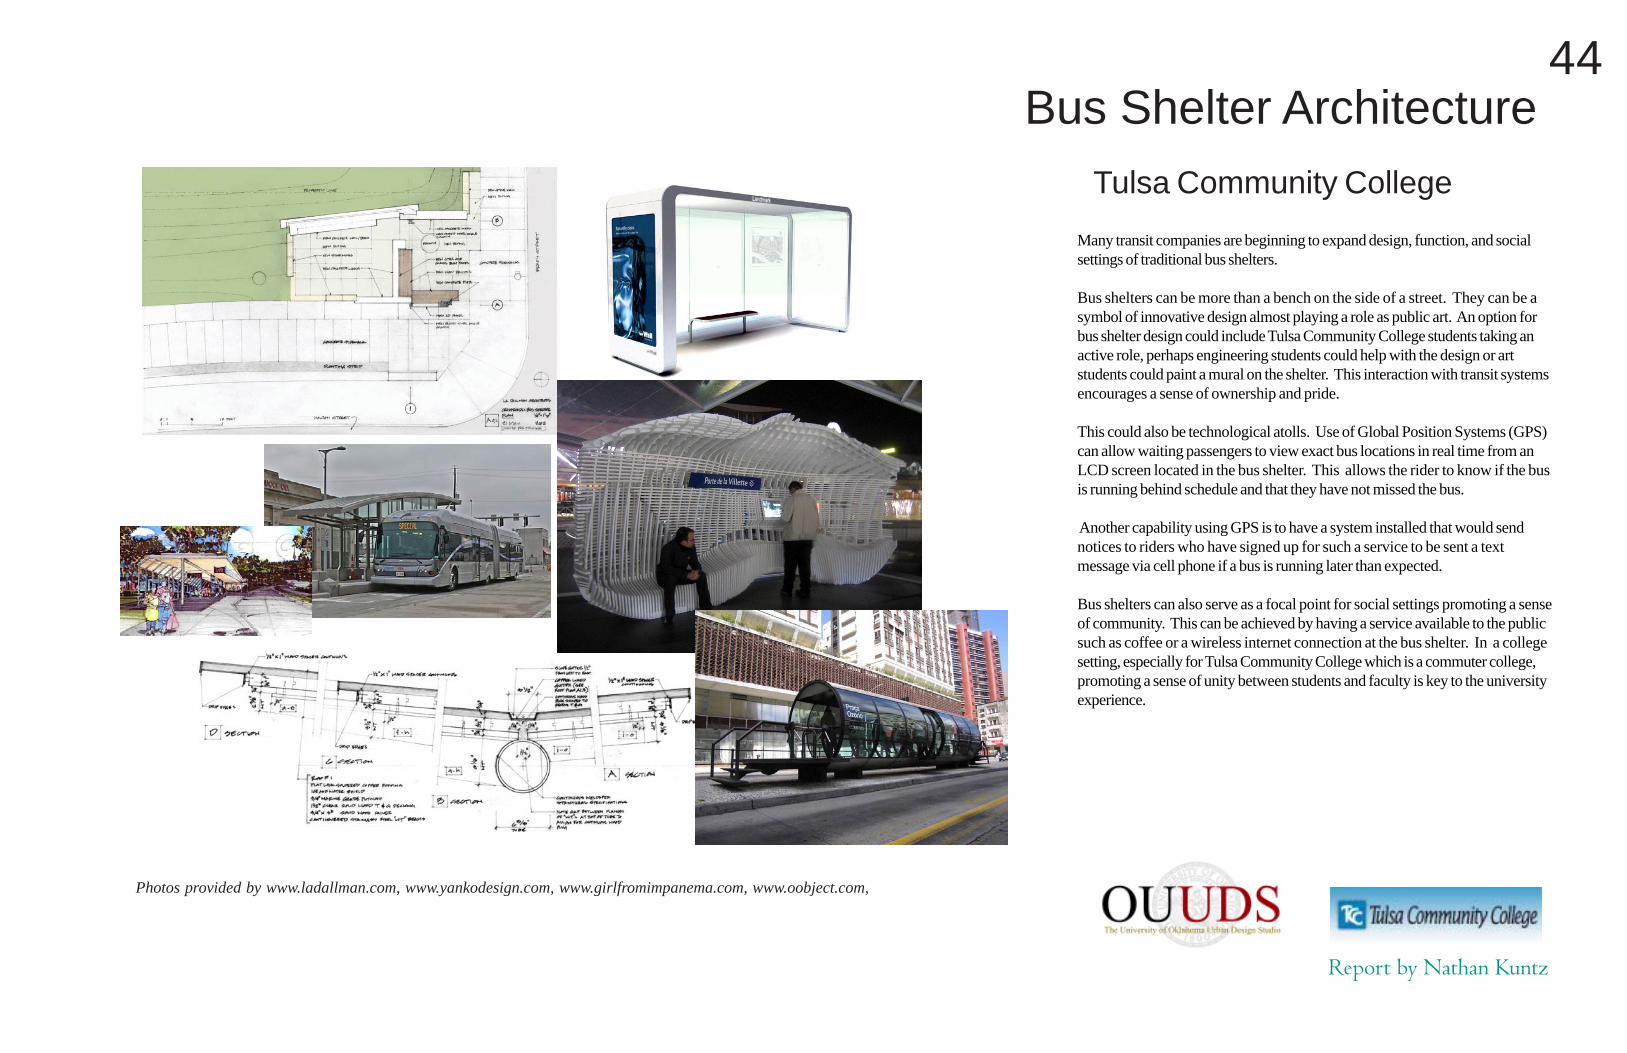
Many transit companies are beginning to expand design, function, and socialsettings of traditional bus shelters.
Bus shelters can be more than a bench on the side of a street. They can be asymbol of innovative design almost playing a role as public art. An option forbus shelter design could include Tulsa Community College students taking anactive role, perhaps engineering students could help with the design or artstudents could paint a mural on the shelter. This interaction with transit systemsencourages a sense of ownership and pride.
This could also be technological atolls. Use of Global Position Systems (GPS)can allow waiting passengers to view exact bus locations in real time from anLCD screen located in the bus shelter. This allows the rider to know if the busis running behind schedule and that they have not missed the bus.
Another capability using GPS is to have a system installed that would sendnotices to riders who have signed up for such a service to be sent a textmessage via cell phone if a bus is running later than expected.
Bus shelters can also serve as a focal point for social settings promoting a senseof community. This can be achieved by having a service available to the publicsuch as coffee or a wireless internet connection at the bus shelter. In a collegesetting, especially for Tulsa Community College which is a commuter college,promoting a sense of unity between students and faculty is key to the universityexperience.
Photos provided by www.ladallman.com, www.yankodesign.com, www.girlfromimpanema.com, www.oobject.com,
44

Bus Shelter Location
Tulsa Community College
Report by Nathan Kuntz
Bus shelter location at TCC has an important role to allow easy access to thetransit system. Not only should bus shelters be easy to access for students andfaculty, but buses themselves should have easy access on and leaving campuses.
Only Metro Campus proved to be a challenge in locating a proper location for abus shelter and bus stop. Other campuses had clear advantages anddisadvantages for a bus shelter location.
Figure 1: Proposed bus shelter location atTCC Northeast Campus. This proposed loca-tion utilizes front entry on the east side ofcampus orientated to student services. Thislocation would provide easy entrance and exitof Northeast campus in a well lit, safe environ-ment. Tulsa Transit currently uses the same busshelter location.
Figure 2: Proposed bus shelter location atTCC West Campus. This proposed locationutilizes main entry on the south side of campus. This location would provide a safe, easyentrance and exit of West Campus. Design ofthe entry road at West Campus provides wideturns excellent for bus travel, addition oflimited parking with the entrance loop wouldbe beneficial.
Figure 3: Recommended bus shelter locationfor TCC Metro Campus is along S. CincinnatiAve. on the east side of campus. This locationprovides the easiest path for buses to enter andleave the area downtown Tulsa. This locationalso would provide patrons opportunity to waitinside and view arrival of a transit bus duringinclement weather.
Figure 4: Proposed location of the bus shelterat TCC Southeast Campus would be the northside of campus in the circle drive. This wouldprovide a safe loading and unloading passengerarea and easy access on and off campus. Thecircle drive has a sharp turning radius but useof a cutaway bus would provide a solution.
45

Grants & Financing
Federal Transit Administration
• Metropolitan & Statewide Planning (5303,5304,5305)
• Large Urban Cities (5307)
• Clean Fuels Grant Program (5308)
• Major Capital Investment (New Starts & Small Starts(5309)
• Bus and Bus Facilities (5309,5318)
• University Transportation Centers Program (TEA-215505)
• Job Access and Reverse Commute Program (5316)
Report by Nathan Kuntz
Photo provided by FTA via www.kcata.org
Grants at Federal and State levels are typically awarded to local transit authorities as well as independent operators. The Federal TransitAdministration (FTA) is a major contributor of transit related grants. The FTA is a division of U.S. Department of Transportation headquarteredin Washington, DC.
The FTA provides eligible transit agencies with grant monies totaling more than $10 billion for transportation projects. At the local level, the FTAprovides both capital and operational costs authorizing purchases of new buses, route planning, bus facilities, and more recently, environmentaladjustments for public transit. With the addition of the American Recovery and Reinvestment Act (ARRA) FTA expects to see additionalfunding for transportation. The FTA distributes financial awards in accordance to Safe, Accountable, Flexible, Efficient Transportation EquityAct: A Legacy for Users (SAFETEA-LU.)
SAFETEA-LU authorizes specific dollar amounts for each program. Each yearCongress provides an annual appropriation which funds the programs specifiedin SAFETEA-LU. Upon receiving this appropriation, FTA apportions and allocatesthese funds according to formulas and earmarks. These FTA apportionmentsare published annually in the Federal Register. (www.fta.dot.gov/grants_financing.html)
Upon receiving a grant, the grantee is responsible for adherence to FTA grant guidance. Safeguard regulate awarded monies and ensure thatgrantees use the money as specified. The grantee is subject to oversight by the FTA.
Photo and Data provided by FTA
46

Potential ridership
20%
27%53%
No
Not sure
Yes
Total student enrollment = 24,540Total employees = 2,349
Total = 26,889
Scenarios:
$1/semester fee (everyone) = $26,889
$5/semester fee (students only) = $122,700$5/semester fee (everyone) = $134,445
$10/semester fee (students only) = $245,400$10/semester fee (everyone) = $268,890
TCC Transit Fee Estimates
Financial Estimates
Report by Nathan Kuntz
TCC Transit Fees
47
To support a transit system, I recommend that Tulsa Community Collegeestablish a transit fee to finance a TCC transit service.
This transit fee would be a $5 fee assessed to everyone. Students will have anadditional fee in their tuition costs while TCC faculty and staff will have the feededucted from their paycheck. TCC manages the parking fee in a similarmanner.
A proposed $5 fee is less than typical transit fees at other universities; however,TCC does not require the same amount of overhead as large transit services.TCC Transit fee would be affordable while providing financial support to TCCTransit.
This $5 fee is estimated to equal $134,445/semester. If TCC were to form apartnership with Tulsa Transit, this fee would cover the estimated transit costsand Tulsa Transit would heavily subsidize the purchase of new buses and busshelters. On the other hand, if TCC were to implement their own transitservice, the fee would not initially cover the costs. I recommend TCC explorethe possibility of receiving grant money from the Federal Transit Administration,specifically grants directed toward transit start-up and university transit.According to estimated TCC Transit operating costs, a $5 fee would pay forthe initial startup costs in about four years. At this point, a TCC Transit feewould be able save funds for purchase of new equipment and maintenance.
Figure 2: Enrollment and employee totals with transit feeestimates
Figure 1: Data from TCC Transit survey
Figure 1: Graph depicting data from TCC Transit survey that asked, “if a transit service wereavailable, would you use the service?” 53% of respondents said “yes,” and another 27% answered“maybe.”
Figure 2: Chart showing current enrollment and employee totals at Tulsa Community College. Thischart also shows scenarios on estimated transit fee totals depending on the dollar amount of transitfees.
Financial Estimates
Report by Nathan Kuntz
Figure 1:
0 10 20 30 40 50 60 70 80
$0.00
$0.50
$1.00
$1.50
$2.00
More than $2.00
part-time student
part-time employee
full-time student
full-time employee
TCC Operates transit system ‐ using cutaway buses
Capital CostsLow High
Cost per bus (new) 60,000 - 150,000 3 buses = 180,000 450,000Average lifespan of bus 6 years =10,000/year
Cost per bus (used) 25,000 - 80,000 75,000 240,000Bus shelter 20,000 - 50,000 each 60,000 150,000Bus StorageBike Racks
Estimated Total (new)on a two bus system for two semesters 240,000 600,000
Estimated Total (used) on a two bus system for two semesters 135,000 390,000
Operational CostsLow High
Contract maintenance 1 bus @ $70/hourFuel per semester 2,500 - 4,000 36,000 42,000
One bus at $2/gallon averaging 12 mpgDrivers salary $28,000 - $33,000 84,000 99,000
13-15$/hour + taxes, health insuranceStudent drivers
cheaper optionInsurance per year 9,000 - 10,000/bus 27,000 30,000SupervisorTelephone
Estimated Total on a two bus system for two semesters 147,000 171,000
Estimated Total Costs on a two bus system for two semesters 387,000 771,000
1 bus @ $45/hour FTA will pay 80-83% cost of new busFTA will pay 80% cost of shelters
1 bus @ 8 hrs/day = $3601 bus for 1 week(5 days) = $1,8001 bus for 16 wks = $28,800
2 buses @ 8 hrs/day = $7202 buses for 1 wk(5 days) = $3,6002 buses for 16 wks = $57,600
3 buses @ 8 hrs/day = $1,0803 buses for 1 wk(5 days) = $5,4003 buses for 16 wks = $86,400
6 buses for 16 wks = $172,800
Estimated cost on 2 bus system for two semesters $115,200
TCC and Tulsa Transit form partnership
Figure 2:
Figure 3:
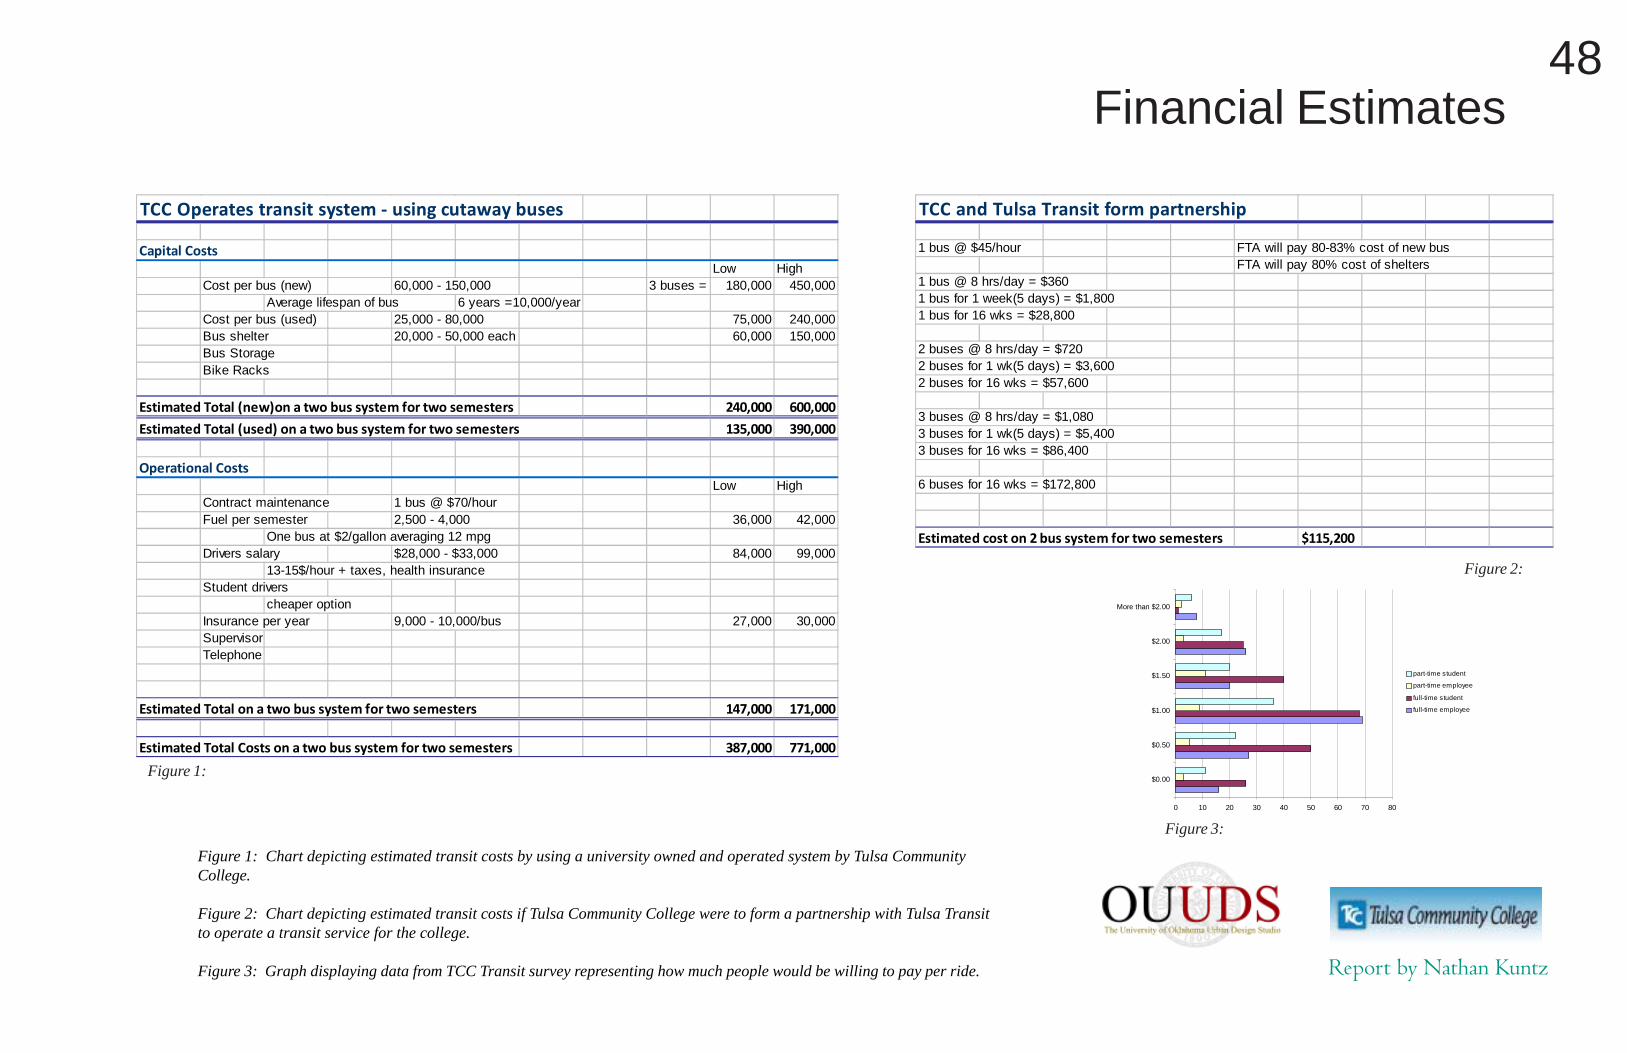
Figure 1: Chart depicting estimated transit costs by using a university owned and operated system by Tulsa CommunityCollege.
Figure 2: Chart depicting estimated transit costs if Tulsa Community College were to form a partnership with Tulsa Transitto operate a transit service for the college.
Figure 3: Graph displaying data from TCC Transit survey representing how much people would be willing to pay per ride.
48

Reasons for riding
0 20 40 60 80 100 120 140 160 180
full-time employee
full-time student
part-time employee
part-time student
number of responses
Access to other classes offered from differentcampuses
Support eco-friendly means of transportation
Save money
Benefits
Tulsa Community College
Report by Nathan Kuntz
Figure 1: Data provided by U.S. Department of Transportation, Federal Transit Administration
Studies have proven how effective a well utilized transit system can be to helpreduce carbon dioxide (CO2) emissions. Shown here, are several visuals todemonstrate large sources of CO2 emissions, advantages that publictransportations have, and CO2 emission comparisons.
Figure 5: This graph is generated from data from the Tulsa CommunityCollege transit survey, the question asked is, “what would be your reason forusing the TCC transit system.” TCC full time employees chose “support eco-friendly means of transportation” for the most common choice. Overall, thenumber one reason for using the system would be to save money, butenvironmental reasons are a close second.
Figure 2: Data provided by U.S. Departmentof Transportation, Federal Transit Adminis-tration Figure 3: Data provided by U.S. Department of Trans-
portation, Federal Transit Administration
Figure 4: Data provided by U.S. Department of Transportation, Federal Transit Administration
Figure 5: Results of TCC Transit survey
49

Environment
Tulsa Community College
Report by Nathan Kuntz
If Tulsa Community College were to implement a transit service using twobuses connecting each campus in a hub and spoke system with Metro Campusoperating as the hub, substantial CO2 emissions could be eliminated.
For one day, if TCC operated this transit service at full capacity for two busesconnecting each campus, the total saved pounds of CO2 would be just shy of18,000 pounds of CO2.
If the system operated at capacity for Fall and Spring semesters, total savedemissions would be well over 2,800,000 pounds of CO2.
Figure 3
Figure 1
Figure 2
Figures 1,2, and 3: Spread-sheets depicting estimatedamount of CO2 emissionssaved by using the proposedTCC transit system amongcampuses. These figures arebased on the possibility that25 people could ride on a busand that there would be twobuses for each TCC route.The following calculationsdetermine riding time anddistance in miles. With thisdata we can determine howmany cars would essentiallybe removed from the road ifstudents and faculty were touse TCC Transit service.
According towww.coloradotrees.org, “asingle mature tree can absorbcarbon dioxide at a rate of48 lbs./year.” According tothese estimates, using a TCCtransit system operating atfull capacity for one yearcould essentially be equal tohaving an additional 58,330mature trees in Tulsa.
50

Concepts
Wind Power
Report by Nathan Kuntz
Photo provided by cnet; www.news.cnet.com
Wind energy has been growing increasingly popular and economically feasibleduring the past few years. In fact, “Oklahoma Wind Power Initiative”established in 2000, contains goals and objectives set to encourage use of windpower and educate the public in long-term benefits.
One potential concept for use of wind energy at TCC is to create an innovativesystem that could recharge batteries of a hybrid diesel-electric bus. ThomasHenderson, Assistant Professor of Electronics at TCC, has established aprogram at Northeast Campus that focuses on wind energy and its potential.This concept idea would be a very beneficial learning research tool for studentsand researchers.
If one 15 kW, horizontal wind turbine were erected at the Northeast Campus itis expected to generate enough energy to recharge the batteries on a singlehybrid diesel-electric bus overnight. One turbine of this power costs around$25,000 and can be as tall as 20 meters.
There are increasing number of schools in the United States that haveimplemented wind turbines to help reduce utility costs and allow students handson experience of how wind can produce energy. Most schools using windturbines are extremely pleased with their system and are looking forward toexpanding programs.
Figure 1: Conceptual model portraying a wind turbine at TCC Northeast Campus
If this concept were to be implemented, not only would it be a valuable asset to TCC, but it could also help improve infrastructure.If an excess amount of energy were created by using a wind turbine, TCC could use this energy to power facilities among Northeastcampus. Another alternative would be to sell excess energy to local generation plants.
51
Concepts
Riding Experience
Report by Nathan Kuntz
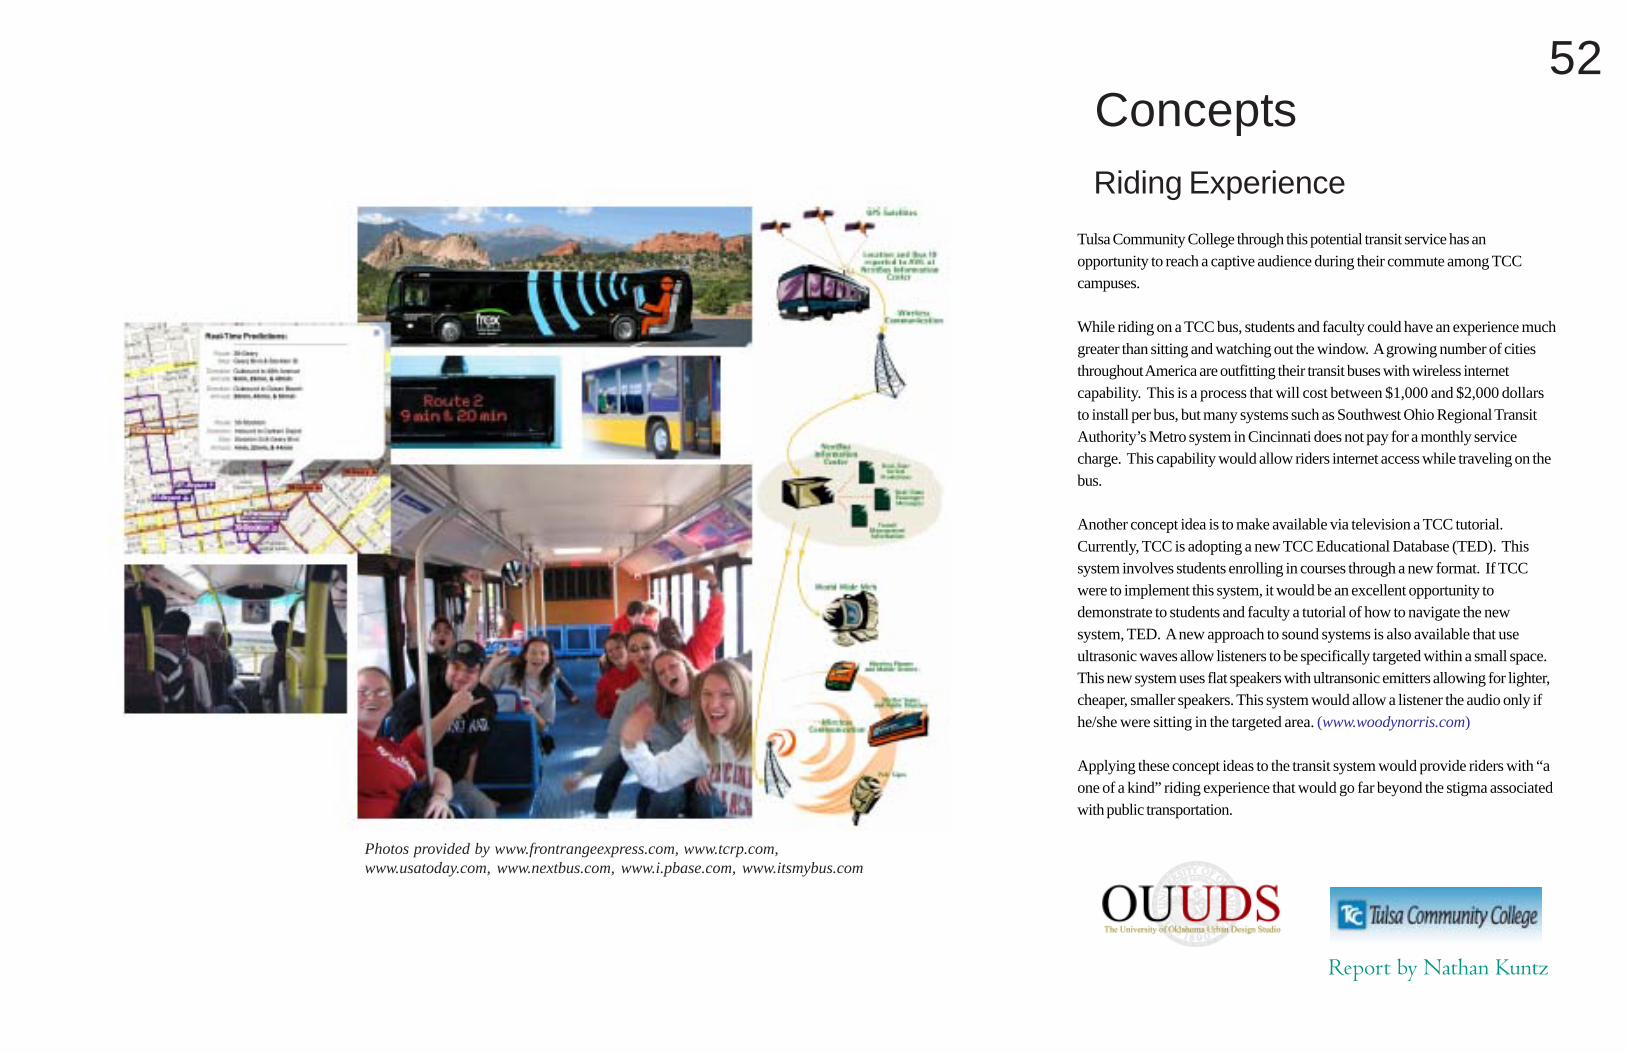
Tulsa Community College through this potential transit service has anopportunity to reach a captive audience during their commute among TCCcampuses.
While riding on a TCC bus, students and faculty could have an experience muchgreater than sitting and watching out the window. A growing number of citiesthroughout America are outfitting their transit buses with wireless internetcapability. This is a process that will cost between $1,000 and $2,000 dollarsto install per bus, but many systems such as Southwest Ohio Regional TransitAuthority’s Metro system in Cincinnati does not pay for a monthly servicecharge. This capability would allow riders internet access while traveling on thebus.
Another concept idea is to make available via television a TCC tutorial.Currently, TCC is adopting a new TCC Educational Database (TED). Thissystem involves students enrolling in courses through a new format. If TCCwere to implement this system, it would be an excellent opportunity todemonstrate to students and faculty a tutorial of how to navigate the newsystem, TED. A new approach to sound systems is also available that useultrasonic waves allow listeners to be specifically targeted within a small space.This new system uses flat speakers with ultransonic emitters allowing for lighter,cheaper, smaller speakers. This system would allow a listener the audio only ifhe/she were sitting in the targeted area. (www.woodynorris.com)
Applying these concept ideas to the transit system would provide riders with “aone of a kind” riding experience that would go far beyond the stigma associatedwith public transportation.
Photos provided by www.frontrangeexpress.com, www.tcrp.com,www.usatoday.com, www.nextbus.com, www.i.pbase.com, www.itsmybus.com
52

Concepts
TCC Metro Campus Transit Cafe
Report by Nathan Kuntz
An innovative design and operational change may include establishmentssuch as a TCC Transit Café.
This idea would use the current under-utilized student lounge and gamingroom, SC-110, a large room on the building’s east side first floor. Here, atthe TCC Transit Café, students, faculty, and general public may gather andenjoy a cup of coffee and a healthy snack while waiting for bus service.This facility may bring more students and faculty together and perhapspromote a sense of community and belonging among TCC students andfaculty.
The TCC Transit Café would have wireless access available along withtelevision monitors tracking incoming and outbound buses grantingstudents the ability to know where buses are and if they may be behind orahead of schedule.
Another advantage of the TCC Transit Café is its location. Riders wouldbe able to wait inside the building in a comfortable environment especiallyduring inclement weather and be able to view through east facing windowswhen the bus has arrived.
This concept of a TCC Transit Café is an excellent opportunity toencourage student collaboration, hold student functions, and have apositive social influence within the community.
Figure 1: TCC Transit Cafe
Figure 2: TCC Transit Cafe Figure 3: TCC Transit Cafe
Figure 1: A view looking northeast frominside the TCC Transit Cafe provides aclear view of arriving buses
Figure 2: Facing northwest toward theentrance and exit of the TCC TransitCafe
Figure 3: Looking south toward the bararea of the TCC Transit Cafe andamenities
53

Significance
Report by Nathan Kuntz
A Tulsa Community College transit service would have a dramatic impact within TCC itself involving granting students and faculty an alternativemode of transportation among campuses, access to classes, along with alleviating parking congestion.
However, this transit system could also have an impact beyond Tulsa Community College. With the average college student age around 20 yearsold, this younger generation may become comfortable and more adept to public transit. This will instill a shift in public opinion of publictransportation. One reason that people are reluctant to use public transportation is that they don’t know how. If we encourage the youngergeneration to use public transportation, we may be able to become less and less dependent upon personal automobiles.
Another large scale impact of a transit system is the environment. Several studies have concluded that using public transportation can dramaticallyreduce production of CO2 gases. As students are becoming increasingly involved in the “green movement,” the opportunity to participate activelyin “going green” through transit ridership could become important. Recommending that TCC buses be equipped with bike racks would allowstudents who live near one campus to ride their bike to the campus nearest them and then travel with their bike by a TCC transit bus to theircampus destination. This addition may allow students an option to eliminate the need for a car entirely.
The riding experience itself may have significant impact. I recommend that TCC take the opportunity to reach riders while in transit. Thisinvolves creating a “bus learning environment.” Riders would be able to view educational videos on a wide range of subjects. For example,there could be a TCC website tutorial, how to enroll using TCC’s new educational database, or a Microsoft Word tutorial. This is an opportunityTCC has to easily reach a captive audience. Also, a recent trend is to outfit buses with wireless internet capabilities. With wireless internetavailable to riders using the transit system, it would help improve overall opinions of transit service and draw larger ridership. Technologicalimprovements have also been applied to public transportation. Global Positioning System (GPS) are being used for bus tracking. This bustracking can be displayed by a monitor at the bus shelter or send a text message to riders alerting them of possible bus delays.
Granting public access to TCC Transit would be a valuable opportunity for TCC to support Tulsa and surrounding areas. Core values of TCCstate the importance of student success, excellence, stewardship, innovation, and diversity, all of which, can be improved by using a TCC Transitsystem.
54
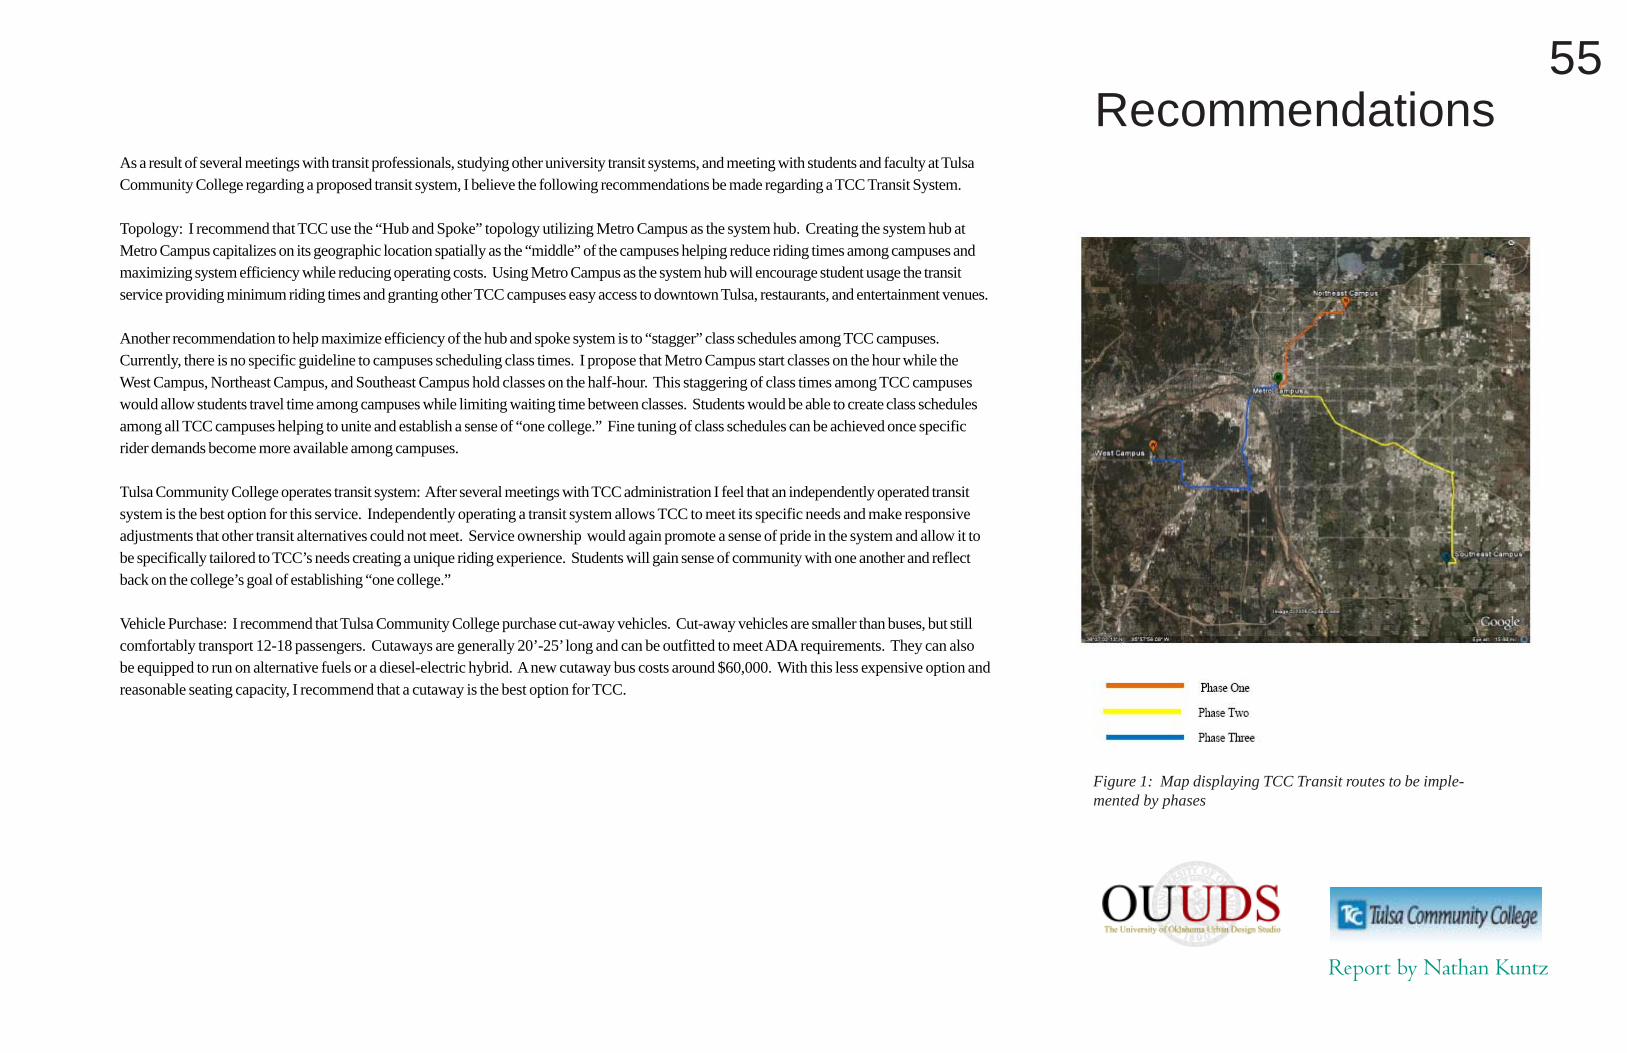
Recommendations
Report by Nathan Kuntz
Figure 1: Map displaying TCC Transit routes to be imple-mented by phases
As a result of several meetings with transit professionals, studying other university transit systems, and meeting with students and faculty at TulsaCommunity College regarding a proposed transit system, I believe the following recommendations be made regarding a TCC Transit System.
Topology: I recommend that TCC use the “Hub and Spoke” topology utilizing Metro Campus as the system hub. Creating the system hub atMetro Campus capitalizes on its geographic location spatially as the “middle” of the campuses helping reduce riding times among campuses andmaximizing system efficiency while reducing operating costs. Using Metro Campus as the system hub will encourage student usage the transitservice providing minimum riding times and granting other TCC campuses easy access to downtown Tulsa, restaurants, and entertainment venues.
Another recommendation to help maximize efficiency of the hub and spoke system is to “stagger” class schedules among TCC campuses.Currently, there is no specific guideline to campuses scheduling class times. I propose that Metro Campus start classes on the hour while theWest Campus, Northeast Campus, and Southeast Campus hold classes on the half-hour. This staggering of class times among TCC campuseswould allow students travel time among campuses while limiting waiting time between classes. Students would be able to create class schedulesamong all TCC campuses helping to unite and establish a sense of “one college.” Fine tuning of class schedules can be achieved once specificrider demands become more available among campuses.
Tulsa Community College operates transit system: After several meetings with TCC administration I feel that an independently operated transitsystem is the best option for this service. Independently operating a transit system allows TCC to meet its specific needs and make responsiveadjustments that other transit alternatives could not meet. Service ownership would again promote a sense of pride in the system and allow it tobe specifically tailored to TCC’s needs creating a unique riding experience. Students will gain sense of community with one another and reflectback on the college’s goal of establishing “one college.”
Vehicle Purchase: I recommend that Tulsa Community College purchase cut-away vehicles. Cut-away vehicles are smaller than buses, but stillcomfortably transport 12-18 passengers. Cutaways are generally 20’-25’ long and can be outfitted to meet ADA requirements. They can alsobe equipped to run on alternative fuels or a diesel-electric hybrid. A new cutaway bus costs around $60,000. With this less expensive option andreasonable seating capacity, I recommend that a cutaway is the best option for TCC.
55

Recommendations
Report by Nathan Kuntz
Figure 1: Map displaying TCC Transit routes to be imple-mented by phases
Implementation: Implementation of TCC transit would be best served in phases. I recommend that TCC phase the transit system into place.The first phase of the transit system would establish a route between Metro Campus and Northeast Campus and operate on 30 minuteheadways each direction. To achieve this goal, TCC would need three cutaway buses, two cutaways for current operation and another onreserve in case of needed repairs. The reason I recommend a Metro-Northeast connection as phase one is because Northeast Campus is inhigher demand for a transit service, thus being more beneficial to students and persons living nearby Northeast campus.
The second phase would establish a route between Metro Campus and Southeast Campus which would also operate on 30 minute headways.An additional two cutaway buses would be added to the system, and depending upon needed frequency of the reserve bus, another reserve busmay be needed.
The final transit system phase would establish a route between Metro Campus and West Campus. Again this route would operate on 30 minuteheadways in each direction and require the addition of two more cutaway buses and a possible third reserve cutaway. Minimum vehicleoperation for this system would be seven cutaway buses and seven drivers.
Advantages of implementing the TCC transit system in phases would be having the opportunity to forecast ridership with minimum costs.Staggering of the class times among campuses, this would greatly increase the transit systems overall efficiency.
Transit Fee: Financing of the transit system would come from an additional Tulsa Community College fee. This fee would be paid in portion byall TCC members, similar to the parking fee assesment. This transit fee would be five dollars per semester. Current estimates using fall 2008statistics would generate $134,445 per semester. Initial transit system implementation would require subsidizing costs, but would be recoveredquickly while providing TCC members an inexpensive transit service. Riders would have access to all routes by showing their TCC ID card.
Schedule: Route implementation would be a by-semester process. Upon reviewing ridership analysis of the initial route (Metro – Southeast) thesecond phase connecting Metro to Northeast would be established the following semester. This by-semester process would establish routes toall campuses in less than two years duration granting all two-year students at TCC availability of TCC Transit.
Public Ridership: This system would also be available for public use. However, the general public would be assessed an additional parking feeand a separate TCC Transit fee. Opening the system to the public is a great opportunity for TCC to promote their core values and communityoutreach.
Parking: Use of TCC Transit would be beneficial toward relieving parking congestion among TCC parking lots. Many students travel toSoutheast Campus from farther destinations, this excess traveling creates a need for a park-and-ride system. Using the TCC Transit system,students would be able to park at the nearest campus and then ride the transit system to their destination. With most students traveling toSoutheast campus, the use of a park-and-ride system would help reduce parking congestion at this campus.
Student Jobs: Creation of a TCC Transit system would also create opportunity for new jobs at TCC. I recommend that whenever possible,TCC employ students to fill these transit jobs. Whether students are employed as bus drivers, mechanics, or administrative staff, TCC would beable to essentially provide money from the student transit fee back to students while reducing operating costs.
56
References
Report by Nathan Kuntz
Meyer, Michael and Miller, Eric, Urban Transportation Planning, McGraw-Hill Series inTransportation, New York, 2001.A broad overview covering the history of public transportation and its focus on impacts,analysis methods, and evaluation of transportation systems.
Booth Wayne, Colomb, Gregory, and Williams, Joseph, The Craft of Research, The University ofChicago Press, Chicago, 2003.An approach to writing a report and managing your research findings, as well as, where tosearch for your data and writing tips toward your targeted audience.
Dverk, Donna, Architectural Programming, Information Management for Design. John Wiley &Sons, Inc. New York, 1993Methods and examples of conducting architectural programming for research studies so that,improved overall design and user expectations are exceeded.
Map of Tulsa, Oklahoma. Metropolitan Tulsa Area Corporate Limits, Territorial and JurisdictionalLimits. Prepared by INCOG, June 2007.Map of Tulsa and surrounding areas depicting county lines and major roads, railway, andgeographic identifiers.
The Tulsa Area Green Directory, Sustainable Tulsa. 2007A service listing in the Tulsa Area that are geared toward healthy environmental stewardship.
Safdie, Moshe. The City After the Automobile. Westview Press, Boulder, 1997A futuristic vision of how the city will be shaped according to transportation needs, lighting,agriculture and other necessities that have evolved to be more advanced.
Hensher, David and Golob, Thomas. Bus rapid transit systems: a comparative assessment.Transportation. Amsterdam, July 2008. Vol. 35, Iss. 4: pg 501A study over established bus rapid transit systems that examines cost, effectiveness, use, andoperations maintenance.
Sohn, Pam. Chattanooga: Green Report Calls for Transit Options. McClatchy – Tribune BusinessNews. Washington: July, 2008.Current report from Chattanooga’s Green Committee that calls for reduction of carbonfootprint by means of public transit options.
Calthorpe, Peter. The Next American Metropolis, Princeton Architectural Press, New York, 1993Design suggestions for improving the effectiveness and practicality of urban transit systems. Including pedestrianwalkways and parking.
Fulton, William and Calthorpe, Peter. The Regional City, Island Press, Washington D.C. 2001.Discussion of the issues regarding transit systems entering into suburbs and metropolitan areas, focusing more onreasons why transit is needed rather than the “how to.”
Moughtin, Cliff and Shirley, Peter. Urban Design-Green Dimensions, Architectural Press, Massachusetts, 2005.An environmental approach to the necessity of public transit including case studies.
Lotti, Jemina. Tulsa Community College. Personal interview. 26 June 2008.Conversation describing the initial thoughts and goals of the research study for Tulsa Community College and thedata that the college would be willing to share.
Smith, Dane. Sunline Transit Agency. Personal interview. 24 June 2008.Discussion of transit system operation, planning, and cost. A brief overview of data acquisition methods forpredicting ridership. Also discussed alternative fuel use and funding sources.
Armer, Tim. INCOG. Personal interview. 8 July 2008.Meeting in which route management was discussed and possible partnership with Tulsa Transit to service TulsaCommunity College. The use of GIS was also discussed.
Cartwright, Bill. Metro Tulsa Transit Agency. Email. 14 July 2008.Email regarding the use of computer software for demand analysis, past attempts of partnerships with TulsaCommunity College, and operating costs for Tulsa, OK.
Muller, Hugh. Transportation Management and Design, INC. Personal interview. 21 July 2008.Discussed use of HASTUS software as well as fare study research methods and possible case studies with hybridsystems of public and student ridership.
57

References
Report by Nathan Kuntz
58
Federal Transit Administration (June 28, 2006). Grants and Financing. Retrieved February 8, 2009from the website of the United States Department of Transportation, Federal Transit Administration:http://www.fta.dot.gov/grants_financing.htmlFederal Transit Administration’s website which provides general data on available grants and othertransit finances.
Wilson, Nancy. Associated Students of the University of Montana. Personal interview. 3 March, 2009.Discussed how to implement a university owned and operated transit system. Suggested purchaseor lease used buses.
Cox, Steven. Tulsa Community College, Assistant Director of Facilities Maintenance. Several Personalinterviews 2008-2009.Discussions of TCC’s specific needs, transit options, transit facilities, and other general universitytransit options and considerations.
Red Carpet Charters (no date of publication). Travel Quote. Retrieved February 23, 2009 from thewebsite of the Red Carpet Charters: http://www.redcarpetcharters.com/Informational website about estimated costs of contracting a transit service.
Spence, Joe. Director of Physical Plant Administration. Personal interview February 24, 2009.Discussion of the possibility of Northeastern State University contracting a transit company tooperate a proposed transit route.
Daroga, Farhad, City Planner, City of Broken Arrow. Personal Interview February 26, 2009.Discussion of partnership with Tulsa Transit to establish the express route.
Hellman, Chan. Associate Professor, Department of Human Relations. University of Oklahoma. Director,Center of Applied Research for Non-Profit Organizations. Personal Interviews 2008-2009.Discussions involving the use of zipsurvey website, SPSS statistical software, and representation ofsurvey data.
Alfaro, Liann. Tulsa Transit Transportation Planner. Personal Interviews. 2008-2009.Discussions of general Tulsa Transit Operations, scheduling, route planning, and other transitplanning regulations.
University of Chicago, Facilities Services (no date of publication). Transportation and Parking. RetrievedOctober 15, 2008 from the website of University of Chicago: http://facilities.uchicago.edu/transpparking/index.htmlUniversity of Chicago’s transit website providing transit route maps, safety programs, and other basicuniversity transit information.
Hamlin, Ronald. Manage, University of Georgia Campus Transit System. Email. November 7, 2008 andFebruary 23, 2009.Discussions including route planning, fees, student ridership, and future needs of the transit system at theUniversity of Georgia.
U.S. Department of Transportation. Transportation and Climate Change, Clearinghouse. (no date ofpublication). Retrieved March 3, 2009 from the website of U.S. Department of Transportation: http://www.climate.dot.gov/ghg-reduction-strategies/index.htmlEducational website providing information on green house gases (GHG), role of transportation inproduction of CO2 emissions, and strategies to help reduce the release of GHG into the atmosphere.
American Public Transportation Association. Transit Bus Fuels and Air Quality. (published 2003). RetrievedMarch 13, 2009 from the website of APTA: http://apta.com/research/info/briefings/briefing_5.cfmInformational website regarding the use of current fuels and alternative fuels, specifically in the use of largevehicles. Provide additional information on case studies.
U.S. Environmental Protection Agency. (last update: December 6, 2007). Fuels and Fuel Additives. RetrievedMarch 13, 2009 from the website of U.S. EPA: http://www.epa.gov/otaq/regs/fuels/diesel/diesel.htmInformational website regarding the release of CO2 gases, specifically by transit.
Federal Transit Administration (June 28, 2006). Carbon Calculator. Retrieved March 3, 2009 from thewebsite of the United States Department of Transportation, Federal Transit Administration: http://www.fta.dot.gov/planning/planning_environment_8523.htmlWebsite containing a carbon calculator to estimate the release/savings of CO2 gases.

References
Report by Nathan Kuntz
Sunline Transit Agency. Transit Facilities Design Manual. December, 2006. Thousand Palms, CA.Transit Design Manual listing public transportation needs including Transit-Friendly Urban Design,Route design around Streets and Intersections, and recommendations on shelters, bus turnouts,and landscape features.
Marshment, Richard. Professor of Regional and City Planning, University of Oklahoma. Email June-November, 2008.Emails discussing transit cost estimates including “peak vehicle” variables.
Brown, Patricia. Senior Transportation Planner, INCOG. Email. March 12, 2009.Email regarding the proposed TCC transit routes and current transit projects occurring within thegreater Tulsa area.
England, Nick. President of Lasseter Bus & Mobility. Email. July 8, 2008.Email regarding the use of alternative fuels and price quotes for new buses.
Kierig, Hugh. AICP, Director Department of Transportation and Parking. West Virginia University.Email. September-February 2008-09.Emails in regard to WVU transit system’s operating costs, student fees, transit programs,partnership with Morgantown, WV., and transit alternatives such as the Personal Rapid Transit(PRT) system.
Glenn, Kris. Cleveland Area Rapid Transit. Personal interview. September 22, 2008.Conversation discussing the partnership that CART has with the University of Oklahoma-Normanand other general transit operations including costs and route design. Subsequent emails providedphotos and further information about CART.
Singleton, Steve. Assistant Manager, Oklahoma State University Community Transit. Email. September-February 2008-09.Emails discussing OSU transit system general operations and the Stillwater-Tulsa route. Emailsalso included photos of the transit system and facilities.
Henderson, Thomas. Assistant Professor of Electronics. Personal interview. April 1, 2009.Discussion regarding the wind power program at the Northeast Campus of TCC and thepossibility of using wind power to recharge batteries used on an electric bus.
Bourne, Bob. Principal Bourne Transit Consulting, LLC. Personal interviews/emails November-April 2008-09.Discussions involving transit cost estimates, route design, specific needs, analysis of route topologies,TCC needs assessment, and overall project guidance.
McClatchey, Brian. Cambus Manager, Parking and Transportation Department, the University of Iowa.Personal interview/emails 2008-09.
Discussion involving the University of Iowa Cambus operation, including route topologies, studentfees, and student involvement with the transit system. Unique system in that students operate thetransit system almost entirely.
Hodges, Tina. January 2009. Public Transportation’s Role in Responding to Climate Change. U.S. Department ofTransportation, Federal Transit Administration.Article analyzing the effects of using public transit in regard to climate and environmental benefits.
59
McAliney, Mike. Arguments for Land Conservation: Documentation and Information Sources for Land ResourcesProtection, Trust for Public Land, Sacramento, CA, December, 1993. Internet accessed May 1, 2009 fromwebsite www.coloradotrees.org.Informational website about the benefits of planting trees in a suburban environment.

Appendix
Tulsa Transit AuthorityIndependent Study
Report by Nathan Kuntz
60
In partnership with Tulsa Transit, during the spring semester of 2009, I was ableto conduct an independent study to accompany my professional project.Working closely with Mrs. Liann Alfaro, Transportation Planner for TulsaTransit, I was able to learn more about public transit operations.
Liann and I communicated throughout the semester mostly by email andscheduled meetings when necessary. Collaborating with Mrs. Alfaro, I gained abetter understanding of public transit policies, required personal, transitpartnerships, and funding.
Mrs. Alfaro also demonstrated a typical quarterly schedule for Tulsa Transitoperations. This schedule included bus routes (runs), duration of the run, andassignment of bus runs.During spring 2009, Tulsa Transit increased fare rates for regular fixed routesfrom $1.25 to $1.50. During this time, Tulsa Transit held several meetings opento the public regarding the fare increase. I was also able to attend monthlyboard meetings held by Tulsa Transit.
In the course of this study, I was able to apply knowledge gained from myindependent study and relate it toward my professional project with TulsaCommunity College, taking into consideration, scenarios of Tulsa CommunityCollege and Tulsa Transit forming a partnership to operate a transit servicebetween campuses.
I would also like to thank Tulsa Transit, William Cartwright, General Manager,and Liann Alfaro, Transportation Planner for their time and dedication towardmy study.
Image provided by Tulsa Transit

Appendix
Tulsa Transit Authority
Report by Nathan KuntzData provided by Tulsa Transit
Figure 1 Figure 2
Figure 8Figure 7
Figure 6Figure 5Figure 4Figure 3
61
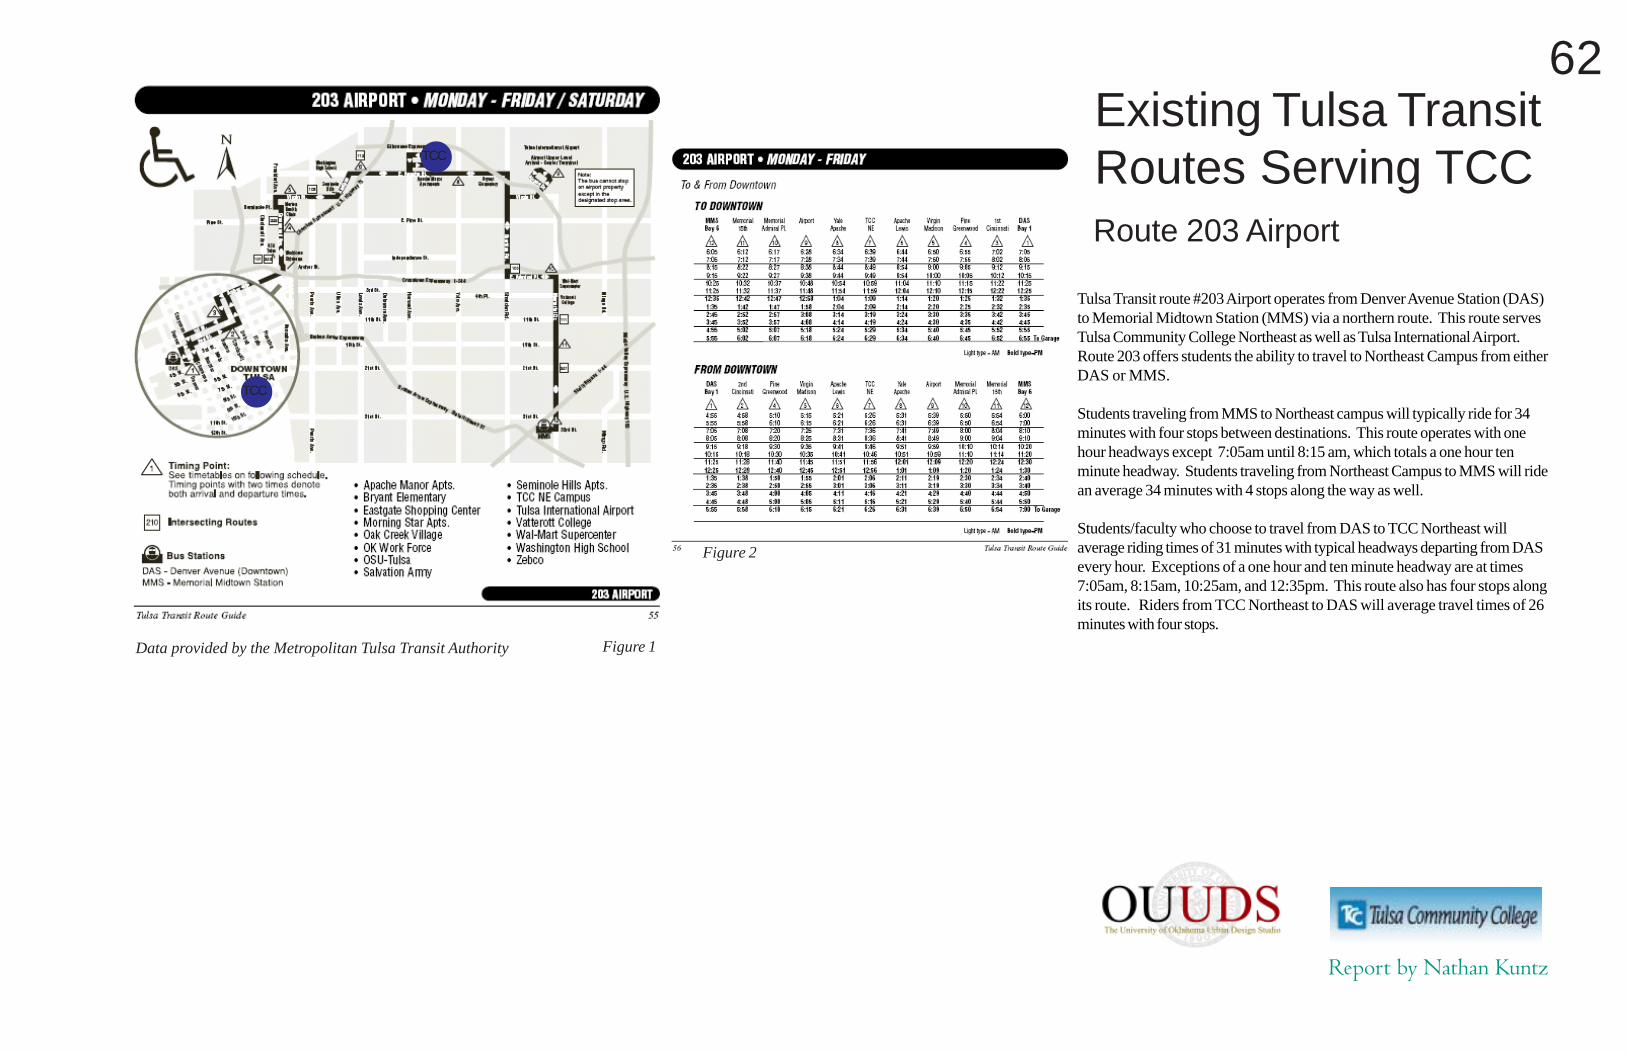
Existing Tulsa TransitRoutes Serving TCCRoute 203 Airport
Report by Nathan Kuntz
Data provided by the Metropolitan Tulsa Transit Authority
Tulsa Transit route #203 Airport operates from Denver Avenue Station (DAS)to Memorial Midtown Station (MMS) via a northern route. This route servesTulsa Community College Northeast as well as Tulsa International Airport.Route 203 offers students the ability to travel to Northeast Campus from eitherDAS or MMS.
Students traveling from MMS to Northeast campus will typically ride for 34minutes with four stops between destinations. This route operates with onehour headways except 7:05am until 8:15 am, which totals a one hour tenminute headway. Students traveling from Northeast Campus to MMS will ridean average 34 minutes with 4 stops along the way as well.
Students/faculty who choose to travel from DAS to TCC Northeast willaverage riding times of 31 minutes with typical headways departing from DASevery hour. Exceptions of a one hour and ten minute headway are at times7:05am, 8:15am, 10:25am, and 12:35pm. This route also has four stops alongits route. Riders from TCC Northeast to DAS will average travel times of 26minutes with four stops.
Figure 2
Figure 1
TCC
TCC
62

Existing Tulsa TransitRoutes Serving TCCRoute 215 15th Street
Report by Nathan Kuntz
Data provided by the Metropolitan Tulsa Transit Authority
Tulsa Transit route #215 15th Street operates Monday through Friday andoffers Saturday routes. This route runs mainly east and west and connectsbetween the Denver Avenue Station (DAS) and Memorial Midtown Station(MMS) along 15th Street. This route does not have a stop at Tulsa CommunityCollege Metro Campus, but has a stop a few blocks away and riders have anoption of choosing a connecting route from DAS that does serve TCC Metro.Route 215 also has fewer stops along its route than some other connectingroutes.
Both routes departing from either DAS or MMS have 35 minute headways andriders in both direction will travel an average of 30 minutes. Traveling fromDAS there are four stops and traveling from MMS there are only 3 stopsbetween DAS and MMS.
Route 215 is an alternative to both route #221 and #251 Fast Track fortraveling from MMS to DAS, but riding time and headways tend to nullify anytime advantages.
Figure 2
Figure 1
TCC
63
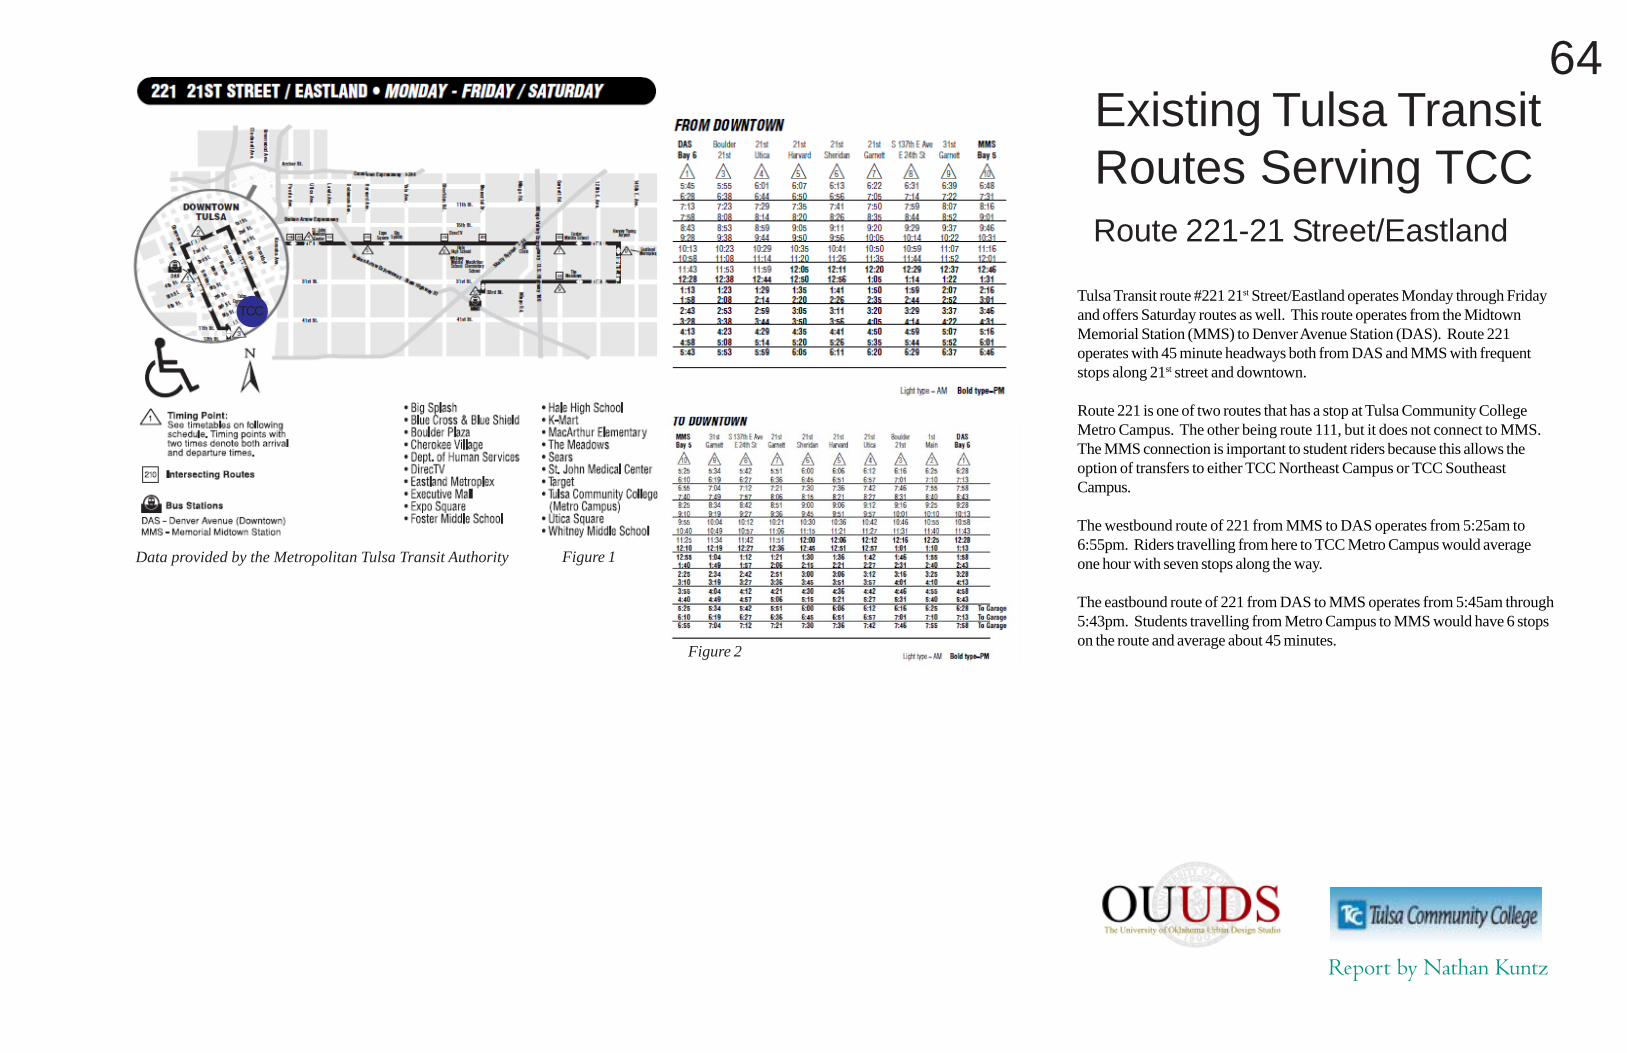
Existing Tulsa TransitRoutes Serving TCCRoute 221-21 Street/Eastland
Report by Nathan Kuntz
Data provided by the Metropolitan Tulsa Transit Authority
Tulsa Transit route #221 21st Street/Eastland operates Monday through Fridayand offers Saturday routes as well. This route operates from the MidtownMemorial Station (MMS) to Denver Avenue Station (DAS). Route 221operates with 45 minute headways both from DAS and MMS with frequentstops along 21st street and downtown.
Route 221 is one of two routes that has a stop at Tulsa Community CollegeMetro Campus. The other being route 111, but it does not connect to MMS.The MMS connection is important to student riders because this allows theoption of transfers to either TCC Northeast Campus or TCC SoutheastCampus.
The westbound route of 221 from MMS to DAS operates from 5:25am to6:55pm. Riders travelling from here to TCC Metro Campus would averageone hour with seven stops along the way.
The eastbound route of 221 from DAS to MMS operates from 5:45am through5:43pm. Students travelling from Metro Campus to MMS would have 6 stopson the route and average about 45 minutes.
Figure 2
Figure 1
TCC
64

Existing Tulsa TransitRoutes Serving TCCRoute 251 Fast Track
Report by Nathan Kuntz
Data provided by the Metropolitan Tulsa Transit Authority
Tulsa Transit offers a Fast Track service from Memorial Midtown Station(MMS) to Denver Avenue Station (DAS) for a slightly increased fee of $0.25.Route 251 Fast Track offers riders the quickest route from MMS to DAS withonly one stop at 1st and Cincinnati. The route operates on the Broken ArrowExpressway /State Highway 51 with travel times averaging 15 minutes eachdirection. Travel times during peak traffic hours are often affected by currenttraffic conditions along this route.
Route 251 Fast Track operates accordingly to peak traffic hours. From MMSto DAS operating times and headways are:
• 5:35am – 8:55am headways are 20 minutes• 8:55am – 2:15pm headways are 40 minutes• 2:15pm – 6:15pm headways are 20 minutes• 6:15pm – 7:35pm headways are 40 minutes
For operating times and headways from DAS to MMS :
• 5:15am – 5:55am headways are 40 minutes• 5:55am – 9:15am headways are 20 minutes• 9:15am – 1:55pm headways are 40 minutes• 1:55pm – 5:55pm headways are 20 minutes• 5:55pm – 7:15pm headways are 40 minutes
Route 251 Fast Track offers students wanting to travel TCC Metro Campusfrom MMS the fastest route but increased fares and headway times may beenough to prevent common ridership. Also, 251 Fast Track does not stop atTCC Metro leaving students the option of walking/biking from DAS to TCCMetro or choosing a connecting route, either 111 or 221 departing DAS.
Figure 2
Figure 1
TCC
65

Route 318 Memorial
Report by Nathan Kuntz
Photo provided by Federal Transit Administration
Existing Tulsa TransitRoutes Serving TCC
Data provided by the Metropolitan Tulsa Transit Authority
Tulsa Transit route #318 Memorial serves Tulsa Community College SoutheastCampus. This route operates Monday-Friday and offers Saturday routes aswell. The route mainly operates north and south along Memorial Drive andconnects Memorial Midtown Station (MMS) to the north and St. FrancisHospital to the South. Northbound routes begin at 5:30 am and operate until7:00 pm. The Southbound route offers buses from 6:13 am until 6:58 pm.These times accommodate typical business hours and peak traffic times.
Tulsa Community College students looking to travel to another TCC campusmust take the southbound bus to St. Francis Hospital, a trip averaging 18minutes with one stop in between, before being able to ride to MMS for aconnecting route. The ride from St. Francis Hospital to MMS takes an averageof 37 minutes with 3 stops along the way.
Students who wish to make this trip from Southeast campus to MMS will ridean average of 55 minutes with a 45 minute headway (interval of time betweenbuses) for time of pick up.
From MMS the student can either travel to TCC Metro Campus or NortheastCampus. If a student is traveling from Memorial Midtown Station to Southeastcampus there are 45 minute headways going southbound on route 318 and takea 35 minute average to arrive at Southeast Campus with 3 stops along theroute.
TCC
Figure 1
Figure 3
Figure 2
66

Appendix
Strategies and Sub-plans
Report by Nathan Kuntz
Maps and Schedules
Maps – Depiction of Tulsa Transit routes including nightline routes, express routes, and inclement weather routes
Schedules – Information regarding Tulsa Transit route numbers and timing. Also includes instructions on how to rideTulsa Transit and schedule adjustments for the holidays.
Detours – Updated webpage regarding real-time Tulsa Transit delays.
BOK Shuttles – Program established to provide free transportation for downtown shuttles during major events at theBOK Center.
Stations – Tulsa Transit operates two bus stations in their dual hub topology to provide the most efficient routes forgreater Tulsa area.
Frequent Destinations – Listing of frequent destinations among the Tulsa area along with the route number whichserves the destination.
Rider Alerts – Updated webpage for real-time rider updates concerning transit changes and route adjustments.
Maps and Schedules
Fares and Passes
Transit Programs
Riding the Bus
67
Appendix
Strategies and Sub-plans
Report by Nathan Kuntz
Fares and Passes
2009 Fare Increase – An increase in Tulsa Transit fare amount. The fare increased from $1.00 to $1.25. This is aresponse to dramatic increases in operational costs. Tulsa Transit also introduced a 7-day unrestricted pass for $12.
Cash Fares: Listing of fixed cash fares on traditional routes and express routes for adults, youth, and children. Alsoincludes discount fares for qualified individuals.
Frequent Rider Discounts: Discount program for individuals who commonly ride Tulsa Transit routes. Use of thisprogram can save up to 20% over normal fares.
Compute Driving Costs: Calculated estimates for potential and current riders of Tulsa Transit to estimate potentialsaved money by using Tulsa Transit.
How to Use Farebox: Detailed instructions on Tulsa Transit’s website on how to use the farebox for ticket purchase.
Employer Bonus Bucks: Program established to encourage Tulsa Transit ridership. Employers may purchase aportion or all of the cost of bus fare and be eligible for a deduction as a business expense.
Reduced Fare: Program to reduce fares for both seniors and persons with disabilities.
Maps and Schedules
Fares and Passes
Transit Programs
Riding the Bus
68

Appendix
Strategies and Sub-plans
Report by Nathan Kuntz
Riding the BusMaps and Schedules
Fares and Passes
Transit Programs
Riding the Bus
Why Ride – Tulsa Transit provides a list of incentives to encourage ridership. The opportunity to save money byusing Tulsa Transit is the main focus, but other incentives including less wear and tear on your personal vehicle, safetyreasons, time used more efficiently, exercise, less stressful, and environmental reasons.
Enjoy the Ride – Additional information on riding the bus, using maps, how to read the schedule, boarding andpayment, bus transfers, and the bike and bus program. Additional information is provided for Tulsa Transit service tonearby cities including Broken Arrow, Jenks, and Sand Springs.
Riding Facts – List of statistics involving employement, ridership numbers, and federal investments toward publictransit nationwide.
Bike and Bus – Program established to allow riders to transport their bicycle while riding the bus. Webpage includesinformation on how to use the bike rides while using Tulsa Transit.
69

Appendix
Strategies and Sub-plans
Report by Nathan Kuntz
Transit ProgramsMaps and Schedules
Fares and Passes
Transit Programs
Riding the Bus
Green Travelor Program – Program established to use a free carpool service.
EZ Rider Rewards – Tulsa Transit’s program to provide discount fares at area businesses. List of area merchants anddiscounts is also provided.
Guaranteed Ride Home – Service provided by Tulsa Transit to provide a ride in case of emergency for valid Expressfare card holders.
Lift Program – Program established by Tulsa Transit to provide paratransit service for persons with disabilities.
Ozone Alert – Environmental program sponsored by Sunoco which provides 50-cent bus rides on Fridays duringOzone Alert Season.
Park and Save – Parking facilities provided free of charge to Tulsa Transit riders to increase access to public transit.
Safe Place – A program established in cooperation with Youth Services of Tulsa to provide kids a ride to a knownlocation if they become lost or feel they are in danger.
Transit Adverstising – Details on how to advertise on Tulsa Transit buses include rates and advertising policy.
Transit Security – Webpage describing security measures currently in place by Tulsa Transit and how transit riders canassist in safety measures.
70