transit and density: atlanta, the united states and...
TRANSCRIPT
Chapter 17
Transit and Density: Atlanta, the United States and Western Europe
Alain Bertaud and Harry W. Richardson
Introduction
The counterpoint to the correlation between low-density sprawl and automobile dependence is that between high density and more transit use. These correlations are in general empirically supported, and while the United States is the exemplar of the first correlation, much of the rest of the world is representative of the second. However, this chapter does not focus on this somewhat banal observation. Rather, it is concerned not with statics but dynamics, not with description but with policy. With special attention to the Atlanta metropolitan area, although the arguments can easily be extended to other US metropolitan areas, the key questions are: Can a city increase transit use and decrease automobile dependence by increasing densities? Or, would an increase in the supply of public transit result in increase densities? Of course, there are important feasibility issues here. How long does it take for a city, via changes in zoning ordinances and other measures, to affect a significant increase in densities? Does a city have access to the fiscal resources (from the local to the Federal) to invest enough in public transit to influence densities?
Background Evidence
The literature on transportation and land use has emphasized the interdependence between the two, and it is a two-way street: transportation can influence urban form, and urban form may affect travel behaviour. However, the benefits from a land use (densification) approach are probably modest. First, the settlement pattern is largely determined so changes in land use are marginal, although there is some debate about how large that margin may be (e.g. in newly developed suburban areas, revitalized core areas and infill development). Second, travel behaviour (although difficult to change in the United States, even with major new transit investments) may be more susceptible to policy interventions than land use preferences. Third, contrary to common belief, any visit to European or Asian cities confirms that compact cities (and their high densities) do not fully mitigate the reliance on automobiles; in fact, automobile dependence is increasing not
2 Urban Sprawl in Western Europe and the USA
declining. This is because for all those who can manage their lives in such an environment without automobiles there are many others who will not. Fourth, both land use changes and transit investments are very costly, the former primarily because of high regulatory costs. Fifth, there is little evidence that higher densities in the United States have had much impact on automobile ownership or vehicle miles travelled, although they might encourage additional non-motorized trips (Boarnet and Crane, 2001).
The case for public transit has been skewed geographically. Newman and Kenworthy (1999), and many others, have largely used statistical data from the world’s largest cities. There are major economies of scale in public transportation, so it is possible to live easily in a large city (like New York, London, Paris, Madrid, Tokyo, Seoul, Hong Kong, Sydney, Rio de Janeiro) without a car, with minor adjustments in lifestyle. But away from a large city, managing without a car requires drastic restrictions in lifestyles, e.g. fulfilling all goals within walking distance or organizing longer trips to fit sporadic public transit schedules. American planners often refer reverentially to Europe with its compact cities and its pro-transit policies. Yet in the small towns of many European countries (such as France, Spain and Italy), buses are very rare, usually empty, and schedules are infrequent (typically 5 buses per day, and none in the evening). The obvious conclusion is that a life based on public transit is barely viable outside the largest cities, unless one’s daily life pattern can be limited to within the boundaries of a walkable small town or village. Also, public transit is not free from negative environmental impacts. Furthermore, despite the high gasoline prices ($55 per fill-up on a compact car), very severe traffic congestion, and high parking fees ($2.60 per hour, even in some small towns), Europeans continue to drive: The obvious reason is that mobility is a prized asset.
Nevertheless, empirical evidence and the results of a large number of studies suggest that there is strong positive correlation between population density and transit use. The higher the density, the higher the transit use. However, variables other than density – culture, household income, the design and location of transit lines, the management efficiency of transport companies, government transport policies, including subsidies – certainly also influence transit use. The correlation does not imply causality. The relationship between density and transit use in various cities of the world has been documented by Newman and Kenworthy (1989) and Kenworthy and Laube (1999).
Kenworthy established that there is a strong positive correlation between density and transit use among world cities and a strong negative correlation between auto travel per capita and density. But the correlation does not imply that in a given city an increase in density would necessarily result in an increase in transit use or that an increase in transit supply would increase density and transit use. A significant increase in average density in built-up areas is a phenomenon which has yet to be observed in large cities, looking back over the past 50 years.
Pickrell (1999) reviewed five studies based on US cities and controlling for variables such as income, household size and transit services and found that, while density affects travel behaviour, the changes are extremely small for densities
Transit and Density 3
below 20 people per hectare and that behavioural changes resulting in an increase of transit use become significant only in urban areas with densities at or above 40 people per hectare. One of the studies showed that if residential densities in US cities were increased by 50% from their 1990 means of 14 p/ha to a hypothetical 21 p/ha, it would reduce car travel by less than 3%.
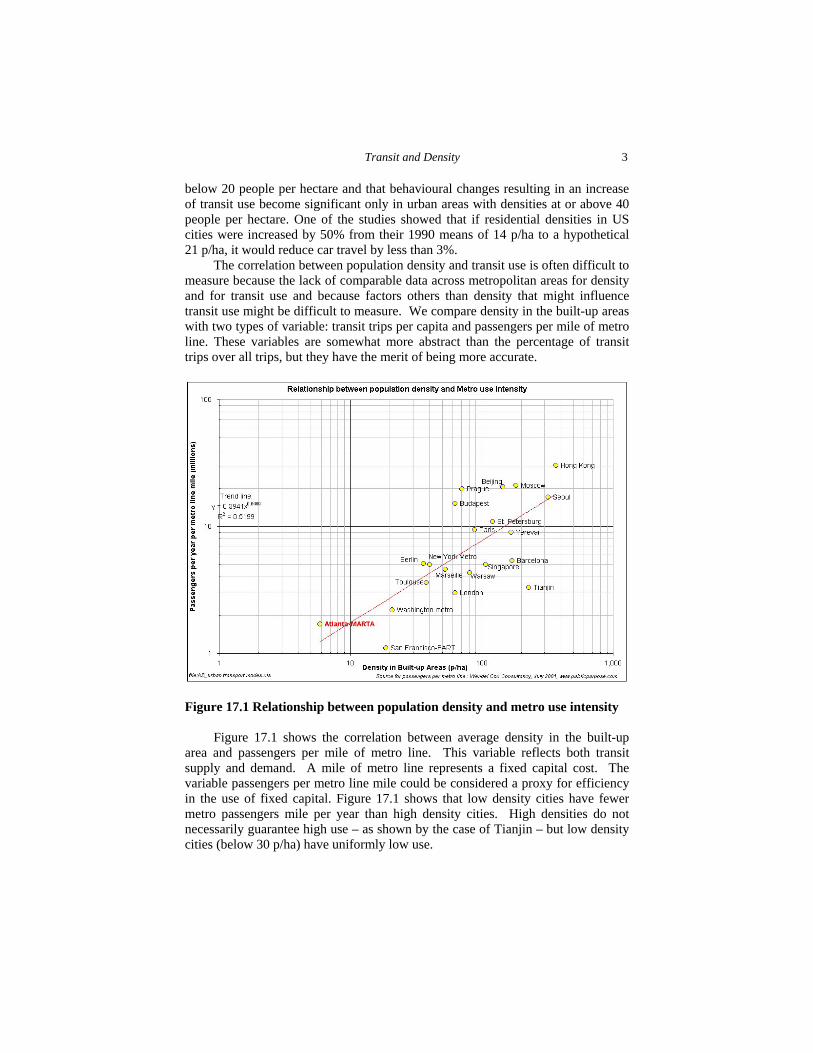
The correlation between population density and transit use is often difficult to measure because the lack of comparable data across metropolitan areas for density and for transit use and because factors others than density that might influence transit use might be difficult to measure. We compare density in the built-up areas with two types of variable: transit trips per capita and passengers per mile of metro line. These variables are somewhat more abstract than the percentage of transit trips over all trips, but they have the merit of being more accurate.
Figure 17.1 Relationship between population density and metro use intensity Figure 17.1 shows the correlation between average density in the built-up
area and passengers per mile of metro line. This variable reflects both transit supply and demand. A mile of metro line represents a fixed capital cost. The variable passengers per metro line mile could be considered a proxy for efficiency in the use of fixed capital. Figure 17.1 shows that low density cities have fewer metro passengers mile per year than high density cities. High densities do not necessarily guarantee high use – as shown by the case of Tianjin – but low density cities (below 30 p/ha) have uniformly low use.
4 Urban Sprawl in Western Europe and the USA
If we compare population density in the built-up area and transit trips per capita per year globally, we find that low density cities (below 30 people per hectare) have a very low demand for transit (below 70 trips per year or about 7 percent of all trips). Atlanta with about 40 trips per year per capita shows a relatively high demand given its very low density. This would suggest that transit trips in Atlanta are unlikely to increase much in the future as the transit system seems to have already attracted the maximum number of transit passenger compatible with its current densities.
The under-utilization of the existing transit network in low density cities suggests that low density might be associated with low demand. In other words, there may be a density below which transit becomes impractical for most travellers compared to alternative means of transportation.
Cities with low average densities (below 30 people per hectare [p/ha]) have low transit use, i.e. in these cities transit trip represents less than 10% of all trips. By contrast, cities with densities above 30 people per hectare tend to have higher transit use. For example, a very high density city like Hong Kong (370 p/ha) has a very high transit use: 85% of all trips are made by transit. It is no accident that one of the densest cities in the world is the only one to have been able to develop and operate its metro without subsidies.
While empirical evidence shows a strong correlation between density and transit use, it is important to know whether causality exists and why there might be a density threshold below which transit is ineffective. If a city’s density is below this threshold, it could not hope to increase the share of transit trips significantly without first increasing its density.
Two principles govern this discussion. First, there is a minimum density threshold below which transit is neither practical for users nor efficient for suppliers. Second, even small densities increases at the city level are very difficult to achieve via non-coercive policies alone in a market economy. In practical terms, this means that cities with densities below the threshold are unlikely to be ever able to have a significant share of all trips using transit. However, even cities with densities above the threshold may not generate a significantly higher number of transit trips. Other variables such as the quality of transit services and cultural behaviour may be more important than density.
This issue is important because many urban planners are convinced that the low transit use typical of most North American cities is because of an inadequate supply of transit services rather than spatial incompatibility. If there is a minimum density threshold below which transit is not viable, then planned capital investments in both light and heavy rail will be squandered in cities that are below this threshold.
While there is no clear causal correlation between population densities and transit share, there are well documented empirical thresholds of densities below which transit is unpractical for users and financially unsustainable for operators. In other words, the lower the density the more difficult it is for transit to operate. However, high density does not in itself guarantee a high transit share. Atlanta’s average built-up density of six people per hectare is well below the various density
Transit and Density 5
thresholds suggested by most transit operators and researchers. The literature review conducted by Holtzclaw (1990) on transit and density suggests that there exists a density threshold of about 30 people per hectare (p/ha) for intermediary bus service, 35 p/ha for light rail and 50 p/ha for metro.
Population density is not the only factor affecting transit operation; the spatial concentration of jobs and people is certainly as important in determining the viability of transit. The city centre of traditional European and Asian cities is usually the place where the major number of jobs, retail space and cultural amenities are found. The steep density gradients of European and Asian cities point to the primacy of the city centre as a focal point for the majority of transit trips. It is easier for transit operators to operate transit lines with multiple origins (the suburbs) and one destination (the city centre). It is much more difficult to operate transit routes linking multiple origins to multiple destinations, as recognized by Cervero (1998), one of the strongest advocates of transit. In most “transit cities” the trips toward the centre are mainly by transit while suburb to suburb trips are by car. While rail mass transit, commuter trains, metro, and light rail are well adapted to monocentric cities, buses are the only transit mode which makes sense in a polycentric city where jobs are dispersed throughout the metropolitan area. The more dispersed the jobs, the fewer the passengers per route, the smaller the capacity of the required buses. At very low densities and with very high job and residence dispersion, the only bus size that makes sense may be a one-person bus, in other words, the solo-driven car.
A related issue is whether transit investments might promote more compact urban development. Most, but not all, of the new rail transit developments are radial systems that either terminate or pass through the CBD. Some argue that this might help to promote downtown or inner-city development around rail stations, and thereby increasing densities. This might happen on a micro scale, e.g. moderate-size infill development. Also, although there was a modest revival in both population and employment in a few downtowns among large U.S. metropolitan areas in the 1990s (e.g. Denver, Seattle; Birch, 2002), the more successful were not rail cities. Empirical research by Ihlanfeldt and Bollinger (1997) found little evidence of nonresidential land use impacts around Atlanta around MARTA’s (Metropolitan Atlanta Regional Transit Authority) rail stations. Furthermore, in a much earlier theoretical analysis, Capozza (1973, 1976) argued that a subway accelerates suburbanization by increasing accessibility to downtown (i.e. declining transportation costs pushed the equilibrium location further out). This may be less true now than then, however, because job decentralization has reduced the impact of accessibility to the CBD as an influence on land values.
Finally, a major concept linking transportation and high density is transit-oriented developments (TODs). The key idea is to promote both residential and commercial development around transit terminals (usually, but necessarily, rail) to reduce auto dependence and promote mixed land uses in a denser urban environment (Cervero, 1998). There are many successful examples in East Asia and, to a lesser extent, Western Europe, but experience in the United States has been much less favourable. A major obstacle is the very low transit share of
6 Urban Sprawl in Western Europe and the USA
personal trips (about 1.6 percent, according to the 2001 National Household Travel Survey; Pucher and Renne, 2003) and the appeal of TOD locations to prior transit riders (more than two-fifths of those choosing to live or work in TODs). But there are other difficulties, such as pre-existing land uses with both redevelopment and large-scale land assembly being hard to implement and the fiscal impacts being problematic (Boarnet and Compin, 1999). Prospects for TODs in the United States are brighter on greenfield sites with new rail stations.
The Atlanta Case
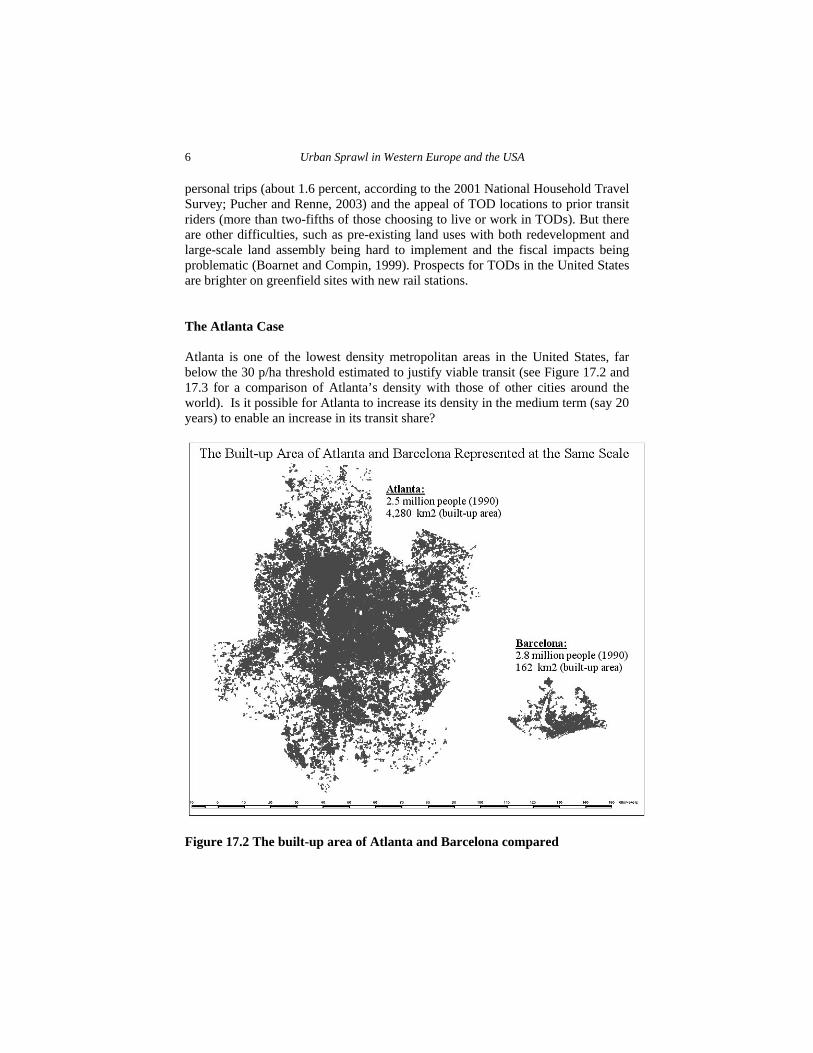
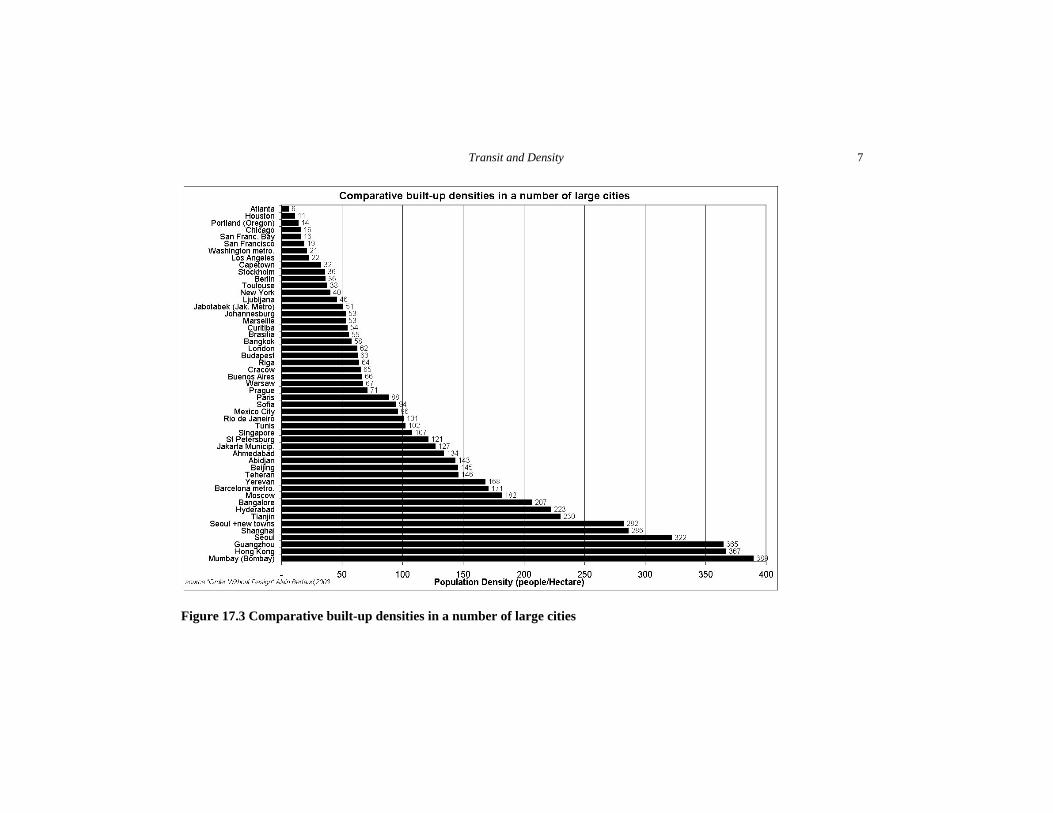
Atlanta is one of the lowest density metropolitan areas in the United States, far below the 30 p/ha threshold estimated to justify viable transit (see Figure 17.2 and 17.3 for a comparison of Atlanta’s density with those of other cities around the world). Is it possible for Atlanta to increase its density in the medium term (say 20 years) to enable an increase in its transit share?
Figure 17.2 The built-up area of Atlanta and Barcelona compared
Transit and Density 7
Figure 17.3 Comparative built-up densities in a number of large cities
8 Urban Sprawl in Western Europe and the USA
i. Could Atlanta density ever reach 30 p/ha?
As suggested above, some planners argue that urban densities would rise if the supply of transit services were increased and if land use legislation were amended to allow higher densities. Increasing transit supply would raise density, which in turn would increase demand and viability, creating a virtuous circle. This could be possible for cities which are close to the density threshold. In the case of Atlanta, this proposition is not credible.
As we have argued, empirical evidence suggests that the density threshold to operate transit on a sizable scale is around 30 people per hectare. However, most US cities are so much below this threshold that it is impossible for them to attain this density, even in the long run.
To illustrate this point, let us look at two possible scenarios to increase density over the period 1990-2010.
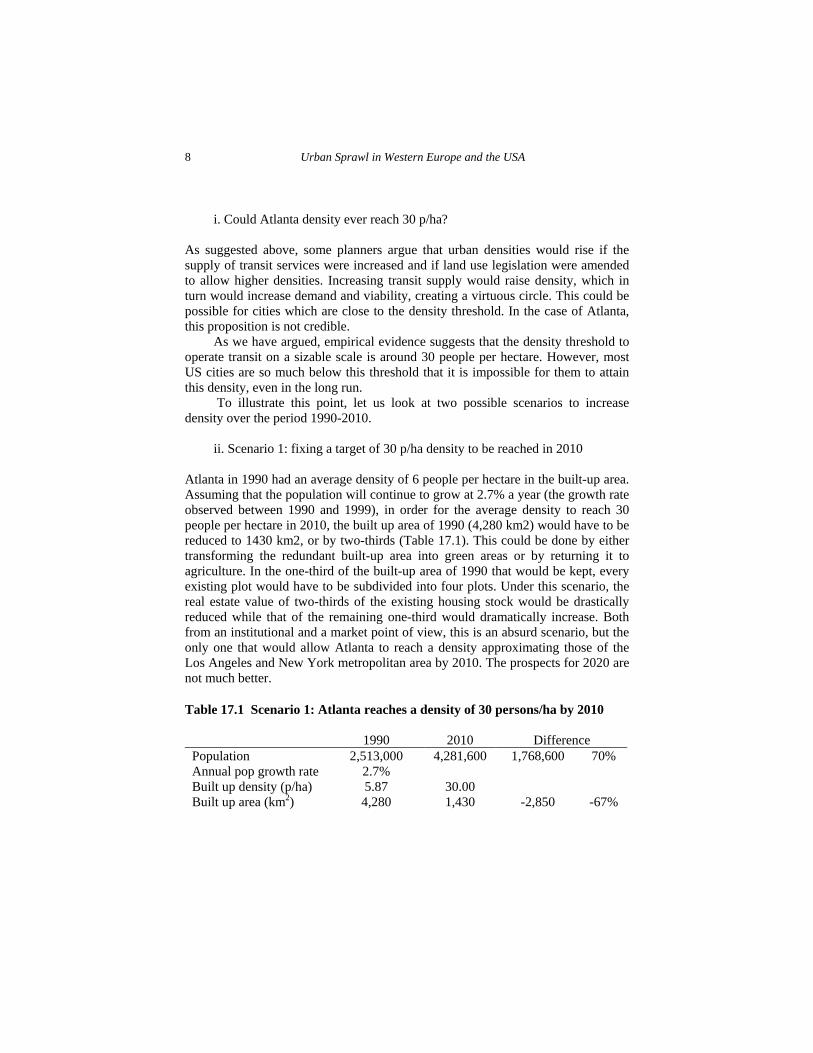
ii. Scenario 1: fixing a target of 30 p/ha density to be reached in 2010
Atlanta in 1990 had an average density of 6 people per hectare in the built-up area. Assuming that the population will continue to grow at 2.7% a year (the growth rate observed between 1990 and 1999), in order for the average density to reach 30 people per hectare in 2010, the built up area of 1990 (4,280 km2) would have to be reduced to 1430 km2, or by two-thirds (Table 17.1). This could be done by either transforming the redundant built-up area into green areas or by returning it to agriculture. In the one-third of the built-up area of 1990 that would be kept, every existing plot would have to be subdivided into four plots. Under this scenario, the real estate value of two-thirds of the existing housing stock would be drastically reduced while that of the remaining one-third would dramatically increase. Both from an institutional and a market point of view, this is an absurd scenario, but the only one that would allow Atlanta to reach a density approximating those of the Los Angeles and New York metropolitan area by 2010. The prospects for 2020 are not much better.
Table 17.1 Scenario 1: Atlanta reaches a density of 30 persons/ha by 2010
1990 2010 Difference Population 2,513,000 4,281,600 1,768,600 70% Annual pop growth rate 2.7% Built up density (p/ha) 5.87 30.00 Built up area (km2) 4,280 1,430 -2,850 -67%
Transit and Density 9
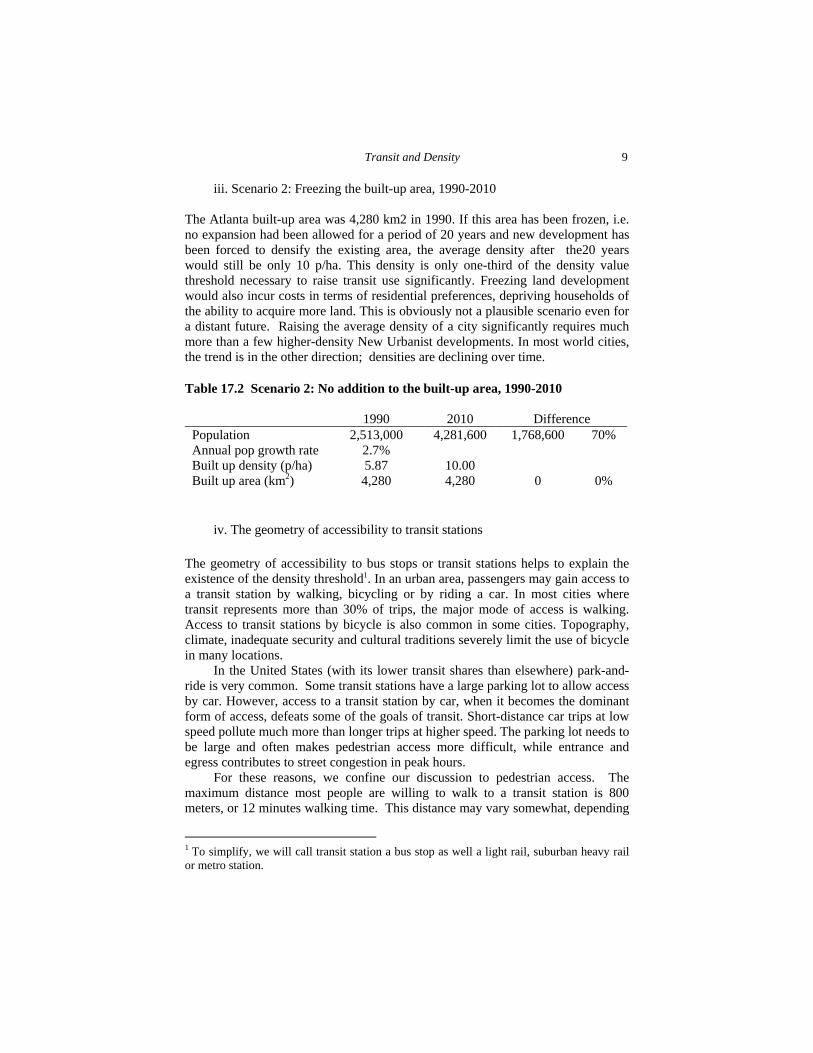
iii. Scenario 2: Freezing the built-up area, 1990-2010
The Atlanta built-up area was 4,280 km2 in 1990. If this area has been frozen, i.e. no expansion had been allowed for a period of 20 years and new development has been forced to densify the existing area, the average density after the20 years would still be only 10 p/ha. This density is only one-third of the density value threshold necessary to raise transit use significantly. Freezing land development would also incur costs in terms of residential preferences, depriving households of the ability to acquire more land. This is obviously not a plausible scenario even for a distant future. Raising the average density of a city significantly requires much more than a few higher-density New Urbanist developments. In most world cities, the trend is in the other direction; densities are declining over time.
Table 17.2 Scenario 2: No addition to the built-up area, 1990-2010
1990 2010 Difference
Population 2,513,000 4,281,600 1,768,600 70% Annual pop growth rate 2.7% Built up density (p/ha) 5.87 10.00 Built up area (km2) 4,280 4,280 0 0%
iv. The geometry of accessibility to transit stations The geometry of accessibility to bus stops or transit stations helps to explain the existence of the density threshold1. In an urban area, passengers may gain access to a transit station by walking, bicycling or by riding a car. In most cities where transit represents more than 30% of trips, the major mode of access is walking. Access to transit stations by bicycle is also common in some cities. Topography, climate, inadequate security and cultural traditions severely limit the use of bicycle in many locations.
In the United States (with its lower transit shares than elsewhere) park-and-ride is very common. Some transit stations have a large parking lot to allow access by car. However, access to a transit station by car, when it becomes the dominant form of access, defeats some of the goals of transit. Short-distance car trips at low speed pollute much more than longer trips at higher speed. The parking lot needs to be large and often makes pedestrian access more difficult, while entrance and egress contributes to street congestion in peak hours.
For these reasons, we confine our discussion to pedestrian access. The maximum distance most people are willing to walk to a transit station is 800 meters, or 12 minutes walking time. This distance may vary somewhat, depending
1 To simplify, we will call transit station a bus stop as well a light rail, suburban heavy rail or metro station.
10 Urban Sprawl in Western Europe and the USA
on variables like climate, culture and income. The area within 800 meters walking distance may differ, depending on street layout.
The largest possible catchment area within 800 meters distance is 128 hectares, regardless of the shape of the market area (circle, diamond, hexagon, etc.). Other arrangements, with stations closer together but transit lines further apart, reduce the size of the catchment area. The constraint imposed by geometry on transit accessibility cannot be overcome. To be accessible by walking, the market area of transit stations cannot be more than 128 hectares and stations cannot be farther apart than 1600 meters. The distance between parallel transit lines cannot be more than 800 meters if stations are 1600 meters distant. To be accessible to everyone there should be about 2.5 bus stops or stations per square kilometre and about 1.6 kilometres of transit line per square kilometre. The geometric constraints are the same regardless of density. The consequences of different densities on the viability of transit capital and operation costs is obvious. If transit has to be developed within walking distance of all households, Atlanta would have to build 3,400 km. of lines (see below).
Other US Examples
Portland, Oregon
Portland, Oregon, is a very special case in the United States, renowned for its growth management regime (especially its urban growth boundary), its regional planning agency (Portland Metro), and its pro-transit policies. We will illustrate the Portland situation via a comparison with Los Angeles.
The comparison that many find hard to believe is that Portland, despite more than two decades of planning to increase densities, is very low density compared to Los Angeles. The 2000 urbanized area information has not yet been released, but the 1990 data show 3,021 persons per square mile in Portland and 5,801 persons per square mile in Los Angeles. Much is made of the high densities in the NE 23rd Avenue Census tract in Portland, yet its 2000 density (22,683 persons per square mile) is only 24 percent of Los Angeles’ densest Census tract (Vermont/Normandie/3rd/5th at 94,450 persons per square mile). The NE 23rd Avenue area is closer to Interstate 205 than the light rail system (MAX), and its restaurants and shops depend more on cars than on transit riders and pedestrians. Finally, if you compare either the one percent or the 10 percent densest areas in Los Angeles with those in Portland, Los Angeles is three times denser.
We would expect that Portland’s growth management regime would have reduced the rate of land consumption in the Portland metropolitan region. Proportionately, more urban land was absorbed in Portland than in Los Angeles percentage-wise in each five-year period between 1982 and 1997 (the years are dictated by the dates of the National Resources Inventory database), but the gap widened in the later years. In 1982-87 urban developed land increased by 10.1 percent in Portland, 7.3 percent in Los Angeles; in 1987-92 the numbers were 12.8
Transit and Density 11
percent and 11.9 percent; finally, in 1992-1997 Portland’s urban land consumption increased by 19.4 percent compared with 6.5 percent in Los Angeles.2 Over the period as a whole (1982-97), Portland’s density fell by 11.3 percent, while that of Los Angeles increased by 2.8 percent (Fulton, Pendall et al., 2001). In parentheses, comparing the Census years of 1980 and 2000, among the large metropolitan areas, only Los Angeles and Phoenix experienced increasing densities; everywhere else densities declined. The national picture augurs poorly for transit expansion in the United States.
When we compare the two metropolitan areas’ highway systems, Portland has 2.8 times more road length per capita than Los Angeles and 50 percent more freeway capacity per capita. In the 1990s, VMT per capita increased much faster in Portland than in Los Angeles and road congestion increased two-and-a-half times faster (although the level of congestion remains higher in Los Angeles). Also, commuting times are about 25 percent shorter in Portland, primarily a consequence of its smaller geographical size, although they are increasing much faster.
Despite the pro-transit policies of Portland Metro over a long period (the Metropolitan Transportation Authority [MTA] in Los Angeles has also been very pro-rail in recent years, but hobbled by insufficient resources), it does not have much of a transit advantage. Both Portland and Los Angeles have transit boardings per capita above the national average, ranked 11th and 12th respectively. Over the past two decades, there has been a modest increase in ridership in Portland, reflecting its aggressive light rail expansion. In Los Angeles, on the other hand, transit ridership declined, in part because of fare increases but primarily because of bus service cutbacks as resources were diverted to the much more expensive rail projects. Nevertheless, the transit share remains less than two percent of total trips in both regions.
Another interesting point is a comparison between Atlanta, a prime focus of this chapter and Portland (Antonelli, 2000, p. 150). Although Atlanta is even more sprawling than Portland with 65 percent of the latter’s density, its core public transit ridership per capita is about 90 percent higher (relatively high given its low density, as suggested above), and its highway construction has been 45 percent lower since 1982. The increase in road congestion has been comparable in the two metropolitan regions. This is less an endorsement of Atlanta than an indictment of Portland’s false claims.
The light-rail evidence for both Portland and Los Angeles is very similar. The MAX route expands from downtown to Gresham in the East and, more recently, to Hillsborough in the West; a 5-mile spur to the airport has recently opened; a cross-river extension to Vancouver in Clark County, Washington, is currently stalled. In Los Angeles, the Blue Line from Long Beach to Los Angeles is operative, while its extension to Pasadena (the Gold Line) is about to open. The Green Line runs from Norwalk in the East to Redondo Beach in the west, stopping two miles short of the airport! There is also a heavy rail line (a subway, the Metro) from downtown to North Hollywood (a dog-leg line turning west to Western Avenue before it turns 2 Advance data from the National Resources Inventory kindly provided by Henry Bogusch.
12 Urban Sprawl in Western Europe and the USA
north). There are also several radial peak-hour trains to suburban nodes (Metrolink) that run on pre-existing rights of way. The important point is that both these “systems” are much less than comprehensive rail systems and do not provide region-wide coverage like those of Tokyo, Seoul, Paris, London and some other major cities. This is an inevitable product of low densities; at current construction costs, it is too expensive to build a rail system that could build a significant rail transit share. In other words, Atlanta’s problem is not unique.
In both Portland and Los Angeles, rail captured most of their riders from the buses, not surprisingly given that parallel express bus services were closed down. Also, new trips were generated, but the modal shift from cars was minimal in both cases. In both metropolitan regions, the design made it difficult to add to capacity via new cars, a problem already visible in Los Angeles’ Blue Line that has more or less reached its capacity ridership. Even close to capacity, the capital and operating costs per trip on the Blue Line are huge relative to the fare.3 The capacities of both systems are minimal compared with adding another freeway lane. In Portland, in particular, highway congestion has deteriorated as MAX service has increased.
A particularly aspect of the transit story in Portland is its contribution to transit-oriented development, especially the jewel in the crown, Orenco Station. Orenco Station (the name dates from early in the century when the streetcar system was running) is located 15 miles west of downtown on the Western corridor of the MAX light rail line to Hillsboro (Bae, 2002). It was built with light rail access as its primary amenity. Yet only 20 percent of its residents regularly use the MAX light-rail service because the trip to downtown Portland it takes twice as long by MAX as by the private automobile.
It is too soon to assess whether Orenco Station will be a success. It offers several housing types at relatively high densities by U.S. standard (6.6 dwelling units per acre for single-family homes and 22.6 multiple dwelling units per acre) in an up-scale neighbourhood. However, most of the housing is too far north of the rail station, in some cases a mile away, nearer to the new commercial retail strip than to the station itself. Furthermore, the freeway is only two miles away. A survey of residents found that only one in six used transit more than twice a week. Some commuters walk to the nearby high-tech worksites of Intel, NEC, Fujitsu and Toshiba. There is little parking near the station (except for a 150-car lot for transit carpoolers), few homes are within convenient walking distance and the feeder bus system provides infrequent service from the more distant access points. Yet rail ridership is increasing faster than population growth and housing close to the stations commands a price premium, so the jury is still out.
3 For a relatively early but detailed comparison see Richmond (1998). An interesting finding of his analysis is that the cost per ride on MAX is similar to that on buses, whereas in Los Angeles the cost per ride on both the Blue and the Red Lines is many times higher than on the buses.
Transit and Density 13
Minneapolis, Minnesota
A light rail project is being built parallel to Hiawatha Avenue in Minneapolis. It is a North-South link of 11.5 miles with 14 stations (most of them in downtown). It will run from downtown to the airport4 and the Mall of America (the largest shopping mall in the United States). There are no other rail projects on the horizon, so a rail system is out of the question. This projected is located in one of the lowest-density metropolitan areas in the United States, a less than ideal location for rail. Moreover, the direction of development in Minneapolis is East-West whereas the rail line is on a North-South axis. This is probably one of the least cost-effective rail projects among a sea of cost-ineffective projects. Why did it ever get underway? Perhaps, the bandwagon effect. Every respectable large metropolitan area needs the prestige of a rail project. Also, the flow of Federal funds is difficult to turn down. At a critical juncture, Jessie Ventura, the maverick former Governor and a one-time professional wrestler, threw in his support.
The line will be a boon for out-of-town business persons, travelling from the airport to downtown, and tourists visiting the Mall of America, undoubtedly Minnesota’s most important tourist attraction. Whether it will have any appeal to local residents is debatable, unless there is a very efficient feeder bus system. Park and ride facilities are planned at only two stations, Fort Schnelling and the Mall of America. It is difficult to conceive of much appeal to the Mall shoppers; given the habits of American shoppers, carrying large shopping bags and tolerating a modal transfer seems unattractive compared to driving to the Mall with its ample park. Combine the average service speed of 22 mph with the fact that most Twin City residents would have to take a feeder bus to ride the train (with all the time losses that modal shifts involve), and most people will choose to drive. Ted Mondale, the head of the Board, has touted transit-oriented development, but it is difficult to identify the stations where land uses could dramatically change given that all but two of the stations are in downtown or at the airport and the Mall.
International Comparisons Background It is well known that cities outside the United States, especially in Asia, but even in Europe are much more compact (Newman and Kenworthy, 1999). They also have much higher public transit and non-motorized mode shares, so the inference is that automobile dependence and density are strongly and negatively correlated. There is nothing wrong with this empirical observation, but its interpretation has to be handled with some caution. First, there is a difference between levels and trends. The negative relationship between automobile use and compactness is much more 4 For some obscure reason (perhaps the power of the taxi lobby), the Green Line in Los Angeles stops two miles short of the airport.

14 Urban Sprawl in Western Europe and the USA
convincing in cross-sectional terms. But the rates of growth in automobile ownership in Europe and Asia are much faster than in the United States, typically twice as fast but often more than that (e.g. in Japan). The differential is much higher than can be explained by the acceleration of decentralization trends in these countries, so clearly there are other forces at work besides urban form. For example, per capita income growth rates have also been higher in many countries than in the United States, and there is a perennial debate about the relative importance of income and urban form as determinants of automobile use (Ingram and Liu, 1999).
Second, the relative price of transportation modes has to be taken into account, and gasoline prices in the United States are typically about one-third of those in Newman and Kenworthy’s comparison cities.
Third, choosing rail as a mode is a function of the geographical coverage of the regional transit system, and many cities outside the United States have had large rail systems in place for many years. Most United States cities either have truncated rail systems (e.g. one or two corridors) or no rail at all. The consequences are much more a reflection of public investment policy than urban form.
Fourth, Newman and Kenworthy (1999) also make a major point about shorter commuting distances in cities outside the United States (approximately 8 kilometres in Asia, 10 kilometres in Europe and 13 kilometres in Australia compared to 15 kilometres in the United States). However, distance travelled is far less important than travel time. Travel times are comparable in both compact and dispersed cities, as a result of average travel speeds being much faster in dispersed cities because of less congestion and more reliance on the faster modes. Thus, the length-of-commute advantages of the more compact cities outside the United States are eroded by their slower travel speeds.
Fifth, the contrast between sprawling America and compact Europe (and, to a lesser extent, compact Asia) is narrowing rather than widening, despite major differences in public policies (Nivola, 1999). Take France, for example. Lifestyle preferences favour a quasi-rural life close to a big city (Prud’homme and Nicot, 2003), not only Paris but also other large cities (e.g. Lyon, Marseilles, Bordeaux). Because of the limitations of public transit services outside the large urban cores (except for inter-city rail service), this lifestyle can be accommodated only via the private automobile. Atlanta and Barcelona Compared
To understand better why density is important in transit, let us use compare Atlanta with Barcelona. Barcelona is a reasonably representative example of many large European cities, where transit represents a significant share of daily trips. Atlanta and Barcelona have similar populations (close to three million), both cities have emerged as regional economic dynamos in their regions, and both cities were recent Olympic Games hosts. However, the spatial structures of the two cities are very different: the average built-up density of Barcelona metropolitan area (171 p/ha) is 28 times larger than Atlanta’s (6 p/ha); see Figure 17.2 for a comparison of
Transit and Density 15
the relative sizes of Atlanta and Barcelona. This implies that in Atlanta the area covered by the transport network has to be 28 larger than in Barcelona to move the same number of people. The metro network in Barcelona is 99 kilometres long with 60 percent of the population living less than 600 meters from a metro station. Atlanta’s metro network is 74 kilometres long (about one-quarter shorter than in Barcelona), but only 4 percent of the population live within 800 meters from a metro station. We should not be surprised if in Atlanta only 4.5 percent of trips are made by transit vs. 30 percent in metropolitan Barcelona where the high density also facilitates an impressive 8 percent of all trips to be pedestrian.
Hypothetically, suppose that the city of Atlanta wanted to provide its population with the same metro accessibility that exists in Barcelona i.e. 60 percent of the population within 600 meters from a metro station. Atlanta would have to build an additional 3,400 kilometres of metro tracks and about 2,800 new metro stations. This huge new capital investment would allow Atlanta’s MARTA to potentially transport the same number of people that Barcelona does with only 99 kilometres of tracks and 136 stations. The effect of density on the viability of transit is far from trivial. This example illustrates the severe constraints that low density imposes on transit viability. This comparison has been about metro track length and rail stations but a comparison between bus lines length and the number of bus stops in Barcelona and Atlanta would yield similar results. With its low densities, it is not surprising that Atlanta is encountering difficulties in developing viable transit, i.e. a transit system that is convenient for the consumer and financially feasible for the operator. Empirical evidence confirms that there is a density threshold below which it becomes impossible to provide transit service. The United States and the United Kingdom
Research by Giuliano and Narayan (2003) shows that distance travelled per day for both work trips and nonwork trips decline with increasing density in both the United States and the United Kingdom (by approximately one-third comparing the lowest with the highest densities, by somewhat more in the case of US nonwork trips. Regardless of densities, distance travelled per day is longer for both types of trips in the United States than in the United Kingdom (by 15-20 percent in the United States for worktrips and by 33-50 percent for nonwork trips). There are many explanations for the US-UK differentials such as income, car ownership rates (especially age-specific rates), the price of motoring, the extent of mixed land uses and, of course, the extent of public transit. The modal shares of all trips (according to the large sample survey data of Giuliano and Narayan (2002) were 6.6 percent for buses, 1.6 percent for rail, and 32.3 percent for non-motorized modes (bicycling and walking) in the United Kingdom, approximately five, three and five times the shares in the United States. When disaggregated by trip type, transit and non-motorized modes accounted for 45 percent of non-work trips in the United Kingdom, but only 8.3 percent of trips in the United States; private car use drops off only very modestly in the United States comparing work and nonwork trips from 93.2 percent to 88.7 percent (Giuliano and Narayan, 2003).
16 Urban Sprawl in Western Europe and the USA
A stimulus for the survey research by Giuliano and Narayan was that almost all prior comparisons were based on national data. This highlights the importance of geographical scale. Although their research suggested that metropolitan size did not influence travel behaviour, there can be little doubt that intrametropolitan differences are sizeable, with more transit use in core areas, while in lower-density peripheral areas automobiles will rule. Metropolitan average densities and travel mode shares can be very misleading. As an example, in Central and Inner London, 60.3 percent of commuting trips are by public transit, while in Outer London and the rest of the Greater London region 73.8 percent of trips are by private vehicles (Giuliano, 1998). Residential densities in Central London (despite the dominance of commercial development) are 8-plus times higher than those in Outer London (Richardson, Bae and Baxamusa, 2000, Table 2). Although this is possibly an extreme example, it illustrates the dangers of metropolitan-wide generalization.
In making comparisons between the United States and the United Kingdom (or other Western European countries), we must be careful about drawing false interpretations from the shorter trip distances in Europe. The shorter distances are almost fully offset by slower travel speeds. For example, comparing the denser London with the more dispersed metropolitan areas of the United States, round-trip average commuting times are 54.4 and 58.4 minutes respectively while average travel speeds are 15.4 mph and 29.5 mph respectively (Giuliano and Narayan, 2002). The two major factors in the slower travel speeds in the United Kingdom are road congestion in high-density areas and longer door-to-door travel times with public transit (more because of access walking time than onboard line-haul times). The Netherlands
A classic, if descriptive, study of the Netherlands by Clark and Kupers-Linde (1994) compared commuting patterns in Los Angeles and the much higher-density Randstaad region. Despite the differences in density, the greater reliance on transit and especially non-motorized modes in the Netherlands, such as bicycling, and vastly different policy environments with respect to both transit and automobile use, the trends were remarkably similar: more job dispersal and a modest increase in commuting length. Increasing polycentricity in Europe will continue to undermine transit use and expand reliance on the automobile even in relatively dense areas and in pro-transit policy environments. Seattle and Oslo
The cities are similar in size, although the Seattle metropolitan region is more than three times the size of that of Oslo, and car ownership rates are not very different (83 percent in Oslo vs. 96 percent in Seattle). Despite the fact that Seattle has four times the transit route length, boardings are less than two-thirds of those in Oslo. Transit use in Oslo is 15 percent of trips, only 4 percent in Seattle; walking in Oslo is 22 percent of trips, only 5 percent in Seattle; and bicycling is 6 percent of trips in Oslo, and only 0.5 percent in Seattle. This is simply one of endless pairwise
Transit and Density 17
examples. Comparing any US city (with the exceptions of New York and Chicago) with any European city would show similar results.
Conclusions The empirical evidence of an association between low-density settlement patterns and a high reliance on automobiles on the one hand and between high-density environments and more transit use on the other is firmly established. This chapter is more interested in the dynamics, especially in a policy context, than in the static relationship. Similarities and contrasts between the United States and Western Europe provide a backdrop to this discussion. Many in the planning profession in the United States believe that densification strategies can induce more transit use or, alternatively, investing in more transit will result in higher densities. They look to Europe as a model for this strategy, even though the policy environments are very different (Nivola, 1999). Unfortunately, the facts are against them. Certainly, transit shares are higher in Europe, especially in or close to core cities where densities are higher. But the trends indicate convergence between the United States and Western Europe, with the automobile share rising in the latter despite higher densities and very strong pro-transit policies. Also, all the efforts to promote more transit in the United States have, according to the 2001 NHTS survey, resulted in a declining transit share. The reasons are clear. While you can introduce higher densities in micro-environments, especially if you implement draconian changes in zoning ordinances, making region-wide density changes is like trying to turn an aircraft carrier around. Alternatively, as the Atlanta-Barcelona example illustrates, the investments in public transit required to generate European levels of transit shares are impossibly infeasible. Of course, you make changes at the margin. But the overall assessment is unequivocal. Whatever problems, real or imagined, might be associated with sprawl in the United States, the transit-high density remedy is bound to fail. An intelligent reading of the European experience makes this obvious, despite contrary conclusions drawn by the less well informed. Almost all US cities are caught in a low-density trap from which there is no escape via pipedreams, fantasies or even forceful policies. References Antonelli, A. (2000), ‘Lessons from the Atlanta Experiment’, in J. Shaw and R. Utt (eds), A
Guide to Smart Growth. Washington, D.C.: The Heritage Foundation, pp. 135-152. Bae, C.-H. C. (2002), ‘Orenco Station, Portland, Oregon: A successful transit oriented
development experiment?’, Transportation Quarterly, vol. 56, no. 3, pp. 9-18. Birch, E. (2002), ‘Having a Longer View on Downtown Housing’, Journal of the American
Planning Association, vol. 68, no. 1, pp. 5-21. Boarnet, M, and N. Compin (1999), ‘Transit-oriented Development in San Diego County:
The Incremental Implementation of a Planning Idea’, Journal of the American Planning Association, vol. 65, no. 1, pp. 80-95.
18 Urban Sprawl in Western Europe and the USA
Boarnet, M. and R. Crane (2001), Travel by Design: The Influence of Urban Form on Travel. New York: Oxford University Press.
Capozza, D. (1976), ‘Land Use in a City with Two Transport Modes’, Southern Economic Journal, vol. 42, pp. 442-450.
_____ (1973), ‘Subways and Land Use’, Environment and Planning, vol. x, no. x, pp. 555-576.
Cervero, R. (1998), The Transit Metropolis: A Global Inquiry. Washington, D.C.: Island Press.
Clark, W. and Kupers-Linde, M. (1994), ‘Commuting in Restructuring Urban Regions’, Urban Studies, vol. 31, no. 3, pp. 465-84.
Giuliano, G. (1998), ‘Urban Travel Patterns’, in B. Hoyle and R. Knowles, (eds), Modern Transportation Geography. 2nd edition. Chichester, UK: John Wiley & Sons.
_____ and D. Narayan (2003), “A Comparison of Work and Nonwork Travel: The US and Great Britain.” Paper presented at the NECTAR Conference #7, Umea, Sweden, June.
_____ and D. Narayan (2002), “Another Look at Travel Patterns and Urban Form: The US and Great Britain,” Urban Studies, vol. 40, no. 11, forthcoming.
Holtzclaw, J. (1990 or1994?), Using Residential Patterns and Transit to Decrease Auto Dependence and Costs. Washington, D.C.: Natural Resources Defense Council.
Ihlanfeldt, K. and C. Bollinger (1997), ‘The Impact of Rapid Rail Transit on Economic Development: The Case of Atlanta's MARTA’, Journal of Urban Economics, vol. 42. no. x, pp.xx-xx.
Ingram, G.K. and Z. Liu (1999), ‘Determinants of Motorization and Road Provision’, in J. Gomez-Ibanez, W. Tye and C. Winston (eds), Essays in Transportation Economics and Policy: A Handbook in Honor of John R. Meyer. Washington, D.C.: The Brookings Institution.
Kenworthy, J. and Laube, F. (1999), An International Sourcebook of AutomobileDependence in Cities, 1960-1990 (with Newman, P., Barter, P., Raad, T., Poboon, C., and Guia, Jr., B.). Boulder: University Press of Colorado.
Newman, P. and J. Kenworthy (1999), Sustainability and Cities: Overcoming Automobile Dependence. Washington, DC: Island Press.
Newman, P. and Kenworthy, J. (1989), ‘Gasoline Consumption and Cities: A Comparison of U.S. Cities with a Global Survey’, Journal of the American Planning Association, vol. 55, Winter, pp. 24-37.
Nivola, P. (1999) Laws of the Landscape: How Policies Shape Cities in Europe and America. Washington, D.C.: Brookings Institution Press.
Pickrell, D. (1999), Urban Rail Travel Projects: Forecast Versus Actual Ridership and Costs. Washington, D.C.: US Department of Transportation, Urban Mass Transit Administration.
Pucher, J. and J.L. Renne (2003), ‘Socioeconomics of Urban Travel: Evidence from the 2001 NHTS’, Transportation Quarterly, vol. 57, no.3.
Prud’homme, R. and B.-H. Nicot (2003), ‘Urban sprawl in France in Recent Decades’, in C.-H.C. Bae and H.W. Richardson, eds., Sprawl in Western Europe and the United States. London: Ashgate.
Richardson, H.W., C-H.C. Bae and M. Baxamusa (2000), ‘The Compact City in Developing Countries,” in M. Jenks and R. Burgess, (eds), Compact Cities: Sustainable Urban Forms for Developing Countries. London: Spon Press.
Richmond, J. (1998), New Rail Transit Investment: A Review. Cambridge, Mass.: Taubman Center for State and Local Governments, John F. Kennedy School of Government, Harvard University, June.

Transit and Density 19