transient three-dimensional modeling of soil water and...
TRANSCRIPT
Plant and Soil202: 281–293, 1998.© 1998Kluwer Academic Publishers. Printed in the Netherlands.
281
Transient three-dimensional modeling of soil water and solute transportwith simultaneous root growth, root water and nutrient uptake
F. Somma, J.W. Hopmans1∗ and V. Clausnitzer1Hydrology Program, Dept. of Land, Air and Water Resources (LAWR) University of California, Davis, CA 95616USA (∗corresponding author)
Received 23 November 1997. Accepted 26 May 1998
Key words:leaching, nutrient uptake, root growth
Abstract
A three-dimensional solute transport model was developed and linked to a three-dimensional transient model forsoil water flow and root growth. The simulation domain is discretized into a grid of finite elements by which thesoil physical properties are spatially distributed. Solute transport modeling includes passive and active nutrientuptake by roots as well as zero- and first-order source/sink terms. Root water uptake modeling accounts for matricand osmotic potential effects on water and passive nutrient uptake. Root age effects on root water and nutrientuptake activity have been included, as well as the influence of nutrient deficiency and ion toxicity on root growth.Examples illustrate simulations with different levels of model complexity, depending on the amount of informationavailable to the user. At the simplest level, root growth is simulated as a function of mechanical soil strengthonly. Application of the intermediate level with root water and nutrient uptake simulates the influence of timingand amount of NO3 application on leaching. The most comprehensive level includes simulation of root and shootgrowth as influenced by soil water and nutrient status, temperature, and dynamic allocation of assimilate to rootand shoot.
Introduction
The efficiency in the utilization of below-ground re-sources by the root system plays an important role indetermining crop yield (Andren et al., 1993). Nutri-ents and other soluble substances move to roots bydiffusion and mass flow induced both by soil water andnutrient status and by root water and nutrient uptake.However, the extent and shape of the root system andtheir changes with time also play a major role in de-termining uptake patterns. Therefore, along with thecharacteristics of the soil nutrient supply, it is impor-tant to understand root growth dynamics and activity(van Noordwijk and de Willigen, 1991).
Nutrient uptake efficiency can be important also inexplaining changes in the chemistry of both soils anddrainage waters. Processes like soil salinization and
∗ Email: [email protected]
ion accumulation in the soil to toxic levels are affectedby plant evapotranspiration and root uptake. Throughthe process of root uptake, plants can remove salineand/or toxic ions from the soil. For example, Ben-Asher (1994) modeled Se uptake by selected plantspecies, determining the maximum Se concentrationallowed for Se-resistant plant growth and evaluatingthe efficiency of Se removal through uptake.
Surveys on fertilization practices during the past40 years have demonstrated a steady yearly increase inthe total amounts of fertilizers used. For example, therate of N application to corn fields in the United Stateshas increased 5 times more than the corresponding Ncontent in harvested corn grains, indicating that N islost mainly through other pathways such as microbialand chemical activities and leaching. A fine-tuningof fertilizer application is crucial for both economi-cal and environmental reasons. Near-maximum crop
282
production can be achieved while simultaneously re-ducing farming costs and decreasing leaching of agri-cultural chemicals from the root zone (Shaviv andMikkelsen, 1993).
Thus, an improved understanding of shoot-root-soil relationships has become essential in modernagriculture. Uptake of chemicals by the root systemdepends mainly on two factors. These are the charac-teristics of the root system (e.g. morphology, growthrate, nutrient absorption rate) and the interaction of thechemical species with the soil and the soil-water sup-ply (e.g. soil adsorption, mass transport, diffusion). Inrecent years, several mathematical models have beendeveloped to simulate root growth and its interactionwith both the soil water and nutrient supply. However,most of these models have used simplified forms ofthe equations describing soil water flow and solutetransport, and have failed to address issues which mayplay a key role in a more realistic description of shoot-root-soil continuum, such as effects of root age anddecay on water and solute uptake, solute-uptake mech-anisms, soil physical variability, transient soil waterflow, and soil-solution chemistry.
Modeling root nutrient uptake started with simula-tion of mass flow and diffusion of nutrients to a singleroot, approximated by a cylinder of constant radius,solving a simple form of the convection-dispersionequation for a circular geometry (Passioura and Frère,1967) considering water but no nutrient uptake. Nyeand Marriott (1969) included nutrient uptake, usinga Michaelis-Menten type boundary condition at thesoil-root interface, and explored the sensitivity of thesolution to changes in some of the equation para-meters (i.e. diffusion coefficient, soil buffer capacity,root absorbing power and nutrient flux at the root sur-face), whereas Barley (1970) simulated uptake in asystem of irregular, parallel roots. Later models haveincluded root competition (Baldwin et al., 1973) androot growth (Claassen and Barber, 1976; Barber andCushmann, 1981), but the root system was modeledonly in terms of root length per unit depth, and noattention was paid to the interaction between three-dimensional distribution of the roots and water andsolute transport patterns. Advances have also beenmade in the modeling of root growth, including the an-alytical approach of Hackett and Rose (1972a, b), thenumerical simulations of Lungley (1973), the three-dimensional simulation models of Diggle (1988) andPages et al. (1989), and the stochastic approach ofJourdan et al. (1995).
Coupling of such efforts as presented above hasled to models capable of simulating various aspects ofroot-soil dynamics. Models have been developed fo-cusing on the transport and uptake of highly immobilenutrients transported mainly by diffusion (Silberbushand Barber, 1984; Amijee et al., 1991) or mobile nu-trients such as nitrate moving through the soil mainlyby mass flow. Jones et al. (1991) simulated one-dimensional root growth of a user-selected crop asinfluenced by soil physical properties, soil water andnutrient content, and temperature. Clausnitzer andHopmans (1994) simulated three-dimensional root ar-chitecture and the interaction between root growthand soil-water movement, emphasizing the effects ofsoil strength on root growth, whereas Benjamin et al.(1996) modeled the influence of rooting patterns onroot-water uptake and leaching in two dimensions.
The objective of this study was to develop a tran-sient model for the simultaneous dynamic simulationof water and solute transport, root growth, and rootwater and nutrient uptake in three dimensions. Thethree-dimensional water flow and root growth modelby Clausnitzer and Hopmans (1994) was expanded tosimulate solute transport and nutrient uptake, and theinteraction between plant growth and nutrient concen-tration, thus providing a tool for studying the dynamicrelationships between changing soil-water and nu-trient status and root activity. The model presentedoffers the most comprehensive approach to date in themodeling of the dynamic relationship between root ar-chitecture and soil domain. The convection-diffusionequation used for modeling of nutrient transport wasconsidered in its most complete form, thus allowinga realistic description of solute fate in the soil do-main. Root water uptake is computed as a function ofmatric and osmotic potential, whereas absorption ofnutrients by the roots can be calculated as a result ofpassive and active (Michaelis-Menten) uptake mecha-nisms. Uptake and respiration activities can vary alongthe root axis and among roots as a result of rootage. Genotype-specific and environment-dependentroot growth processes are described using empiricalfunctions, the latter designed to be easily modified,thus allowing the user to test different formulationsand/or introduce new relationships. Although this pa-per describes the essential features of the model, itssize and complexity force us to refer to the report bySomma et al. (1997) for a complete description of themodel.

283
Model description
The finite-element model (FEM) simulates the growthand activity of a root system as a function of localsoil water and nutrient conditions. The domain, treatedas a continuum for the modeling of root growth, isdiscretized into a rectangular grid of finite elements,which serves to describe the spatial distribution ofsoil physical properties and as a framework for themodeling of transient water flow and solute transport.The FEM adjusts simulation time increments based onconvergence of the flow and transport model solutionand on root growth time intervals.
Root growth is simulated starting from a germi-nated seed or using a root system already developedin an earlier simulation. Roots "grow" at user-definedtime intervals with a new segment added to the apex ofeach growing root. The model tracks each segment byrecording its topological position within the root sys-tem and its spatial location within the model domain,as well as its age, mass and surface area.
At the present stage, the water flow and solutetransport model interacts with root growth at one ofthree different levels of increasing complexity, de-pending on the simulation objective or how muchinformation is available to the user. These levels are:root growth as a function of soil strength and nu-trient concentration, without root water and nutrientuptake (level 1); root growth with potential transpi-ration defined as a function of time, with or withoutnutrient uptake (level 2); and root growth with dy-namic assimilate allocation to shoot and root, with or
Table 1. Model options for simulation of root growth withoutsolute transport modeling (a) and with solute transport modeling(b).
Simulation levels
Features 1a 1b 2a 2b 3a 3b
Water flow X X X X X X
Soil strength X X X X X X
Soil temperature X X X X X X
Ion deficiency/toxicity X X X X X X
Water uptake X X X X
Osmotic potential X X X X
Root aging and decay X X X X
Nutrient uptake X X
Soil strength effects on X X
plant growth
Concentration effects on X
plant growth
without nutrient uptake (level 3). Table 1 summarizesthe options available at each simulation level.
Mass-balance calculations were included for bothwater flow and solute transport to: (i) evaluate the per-formance of the numerical solution schemes, and (ii)provide quantitative information on water and nutrientinput, root uptake, and water and nutrient leaching.Two different root-water extraction functions havebeen included in the model, with the possibility oftaking into account osmotic potential effects on waterand passive nutrient uptake. The model simulates root-age effects on root water and nutrient uptake, as wellas the influence of nutrient deficiency or ion toxicityon root growth.
The model source code is almost entirely basedon the FORTRAN77 standard, and has been testedfor Microsoft FORTRAN Powerstation on a PC. Uponrequest, the code can be obtained from the authors,together with a user manual describing in detail thestructure of the model, the input and output re-quirements and the pre- and postprocessing software(Somma et al., 1997).
Mathematical formulation
Soil water flow
Numerous studies have been published addressingdifferent issues in the modeling water flow in the un-saturated zone using the Richards (1931) equation. Acomprehensive review was published Milly (1988),whereas Mariño and Tracy (1988) offered a reviewof root-water uptake modeling in combination withRichards equation solutions.
The model by Clausnitzer and Hopmans (1994)uses a finite-element, Picard time-iterative numericalscheme (Vogel, 1987; Simûnek et al., 1992) to solveRichards’ equation for soil water pressure headh [L](negative in unsaturated porous media) in multipledimensions:
∂θ
∂t= ∂
∂xi
[K
((KA
ij
∂h
∂xj+KA
i3
)]− S (1)
where θ [L3L−3] is volumetric soil-water content,tis time, K[LT −1] is the unsaturated soil hydraulicconductivity, KA
ij is the generic component of thedimensionless anisotropy tensor for the unsaturatedconductivity (i, j = 1,2,3), xi is the spatial coordi-nate (L), andS[L3L−3T−1] is the sink term to accountfor root water uptake. Choice of boundary conditions
284
has been expanded to include a unit hydraulic gra-dient condition at the bottom boundary, in additionto user-specified, time-varying source/sink volumetricflow rate and pressure head boundary conditions.
Solute transport
A finite-element model was developed to solve thethree-dimensional form of the convection-diffusionequation for solute concentrationc[ML−3], derivedfrom Šimunek et al. (1992):
∂θc
∂t+ ρk∂c
∂t= ∂
∂xi
(θDij
∂c
∂xj
)−
∂qic
∂xi+ µwθc+ µsρkc + γwc + γsρ − S′c (2)
whereρ[ML−3] is the soil bulk density,k [L3M−1]is the linear adsorption coefficient,Dij [L2T−1] is thegeneric component of the dispersion coefficient tensor,qi [LT−1] is the volumetric flux component in thei-thdirection,µw[T−1] andµs [T−1] are the first-order rateconstants for the liquid and solid phase respectively,γw [ML−3T−1] and γs [T−1] are the zero-order rateconstants for the liquid and solid phase respectively,and S′C [ML−3T−1] is the sink term to account forroot solute uptake. The four zero- and first-order rateconstants account for reactions of the solute in thedissolved or adsorbed phase, such as microbial degra-dation, volatilization and precipitation. Simultaneousnumerical solutions of Eq. (1) and (2) in its vari-ous forms have been presented by Tracy and Mariño(1989) and many others.
For the present model, spatial integration of Eq.(2) was performed using the Galerkin finite-elementapproach with linear basis functions, while time deriv-atives were approximated using the finite-differencemethod. Details about the main steps in the numeri-cal solution of Eq. (2) can be found in Somma et al.(1997). Numerical oscillations of the solution due tothe spatial or temporal resolution of the FEM schemewere avoided by reducing the simulation time stepbased on the product of the Peclet and the Courantnumbers as in Perrochet and Berod (1993). To ver-ify the mathematical accuracy of the solute transportmodel, simple scenarios where simulated in one, twoand three dimensions, and solutions were comparedto analytical solutions reported by van Genuchten andAlves (1982), Javandel et al. (1984), and Leij andBradford (1991).
Water and solute mass balance
To evaluate the accuracy of the numerical solutionscheme, water and solute mass balances are computedat each time step, following Šimunek et al. (1992). Aspart of the mass balance, the absolute cumulative errorin the soil water mass balance,aw [L3], betweent = t0andt = t1, is calculated from:
aw = Vt1 − Vt0 +∫ t1
t0
TaLt1dt −∫ t1
t0
∑n�
Qndt
(3)
whereVt1, andVt0 [L3] denote the volumes of waterin the simulation domain at timest1 (current simu-lation time) and at the beginning of the simulation,respectively. The third term accounts for the cumula-tive volume of water [L3] extracted by the root system,Ta [L3L−3T−1] being the uptake rate, andLt1, [L3]the volume of soil occupied by the root system at timet1. The fourth term accounts for the cumulative vol-ume of water [L3] leaving or entering the flow domainthrough the boundaries and the internal sources/sinks.Similarly, the absolute cumulative error in the solutemass balance, ac [M], is calculated as:
ac = Mt1 −Mt0 +∫ t1
t0
∑n�
QTn dt −M0−M1−Mr
(4)
whereMt1 [M] and Mt0 [M] refer to the total massof solute in the simulation domain at timest1 andt0, respectively, and the third term represents the netcumulative mass of solute [M] moving through thedomain boundaries and the internal sources and sinks.M0 [M] and M1 [M] denote the mass of solute re-moved from the domain by zero-order and first-orderreactions, respectively, andMr [M] corresponds to themass of solute removed by the root system.
Root growth
Root growth is simulated as a function of mechanicalsoil strength, soil temperature and solute concentra-tion. Root axes are generated at user-defined times.Branching time and spacing are described by user-defined functions of root age and branching order(Clausnitzer and Hopmans, 1994).
An impedance factor,imps, is calculated for eachgrowing root apex as a function of the local soilstrength conditions at each timet to reduce the lengthof the growing segment from its potential (unimpeded)
285
value. The impedance factor varies linearly betweenzero (soil strength at which growth ceases completely)and unity (unimpeded growth). An option is avail-able to account for the effects of soil temperatureon root growth using the impedance functionimpt ,which varies between zero (temperature at which rootgrowth ceases) and unity (optimal root growth temper-ature), and is described by a modified sine-wave shape(Clausnitzer and Hopmans, 1994).
Root growth rates are unaffected by nutrient avail-ability as long as the latter is maintained within anoptimal concentration range (coptmin ≤ c ≤ coptmax).Because optimal range and minimum and maximumconcentration are both genotype- and nutrient-specific,nutrient-concentration effects were simulated using apiecewise linear impedance function,impc [–]. Thefunction varies linearly between zero (c ≤ cmin orcmax ≤ c, no growth) and unity (optimal concentra-tion range, no impedance). Thus, at each growth eventthe actual length of the root segment added to eachapex is obtained multiplying the unimpeded lengthwith the three current values of the impedance fac-tors impc, imps, and impt . As nutrient uptake bythe roots is not considered at this level of simula-tion, solute transport is not influenced by the presenceof the root system, but is included in the simulationto determine nodal values of the impedance func-tion impc. Alternatively, the nutrient concentrationeffects on root growth can be evaluated by specifyinga time-independent concentration distribution.
Bloom et al. (1993) concluded that root biomassproduction of field-grown tomatoes is optimal at in-termediate levels of soil nitrate and ammonia whenall other growth-controlling parameters (water supply,temperature, other nutrient availability) are nonlimit-ing. Insufficient nutrient supply significantly reducesplant transpiration and photosynthesis (Stark, 1992).Root biomass and growth rate decrease if the nutrientssupply is inadequate (de Willigen and van Noordwijk,1987; Bloom et al., 1993; Shedley et al., 1995). Thus,root growth increases as more nitrogen is available.However, excessive nutrient availability can also ham-per plant growth through several mechanisms. Forexample, Bloom et al. (1993) hypothesized that in thepresence of high levels of soil nitrogen root growthbecomes carbohydrate-limited. Similar findings werereported by Shedley et al. (1995) for eucalyptus.Wheeler and Power (1995) studied the toxic effectsof increasing concentration of trace minerals (Mn, Zn,Cu, B, Fe, Ga, La) in soil solution on wheat.
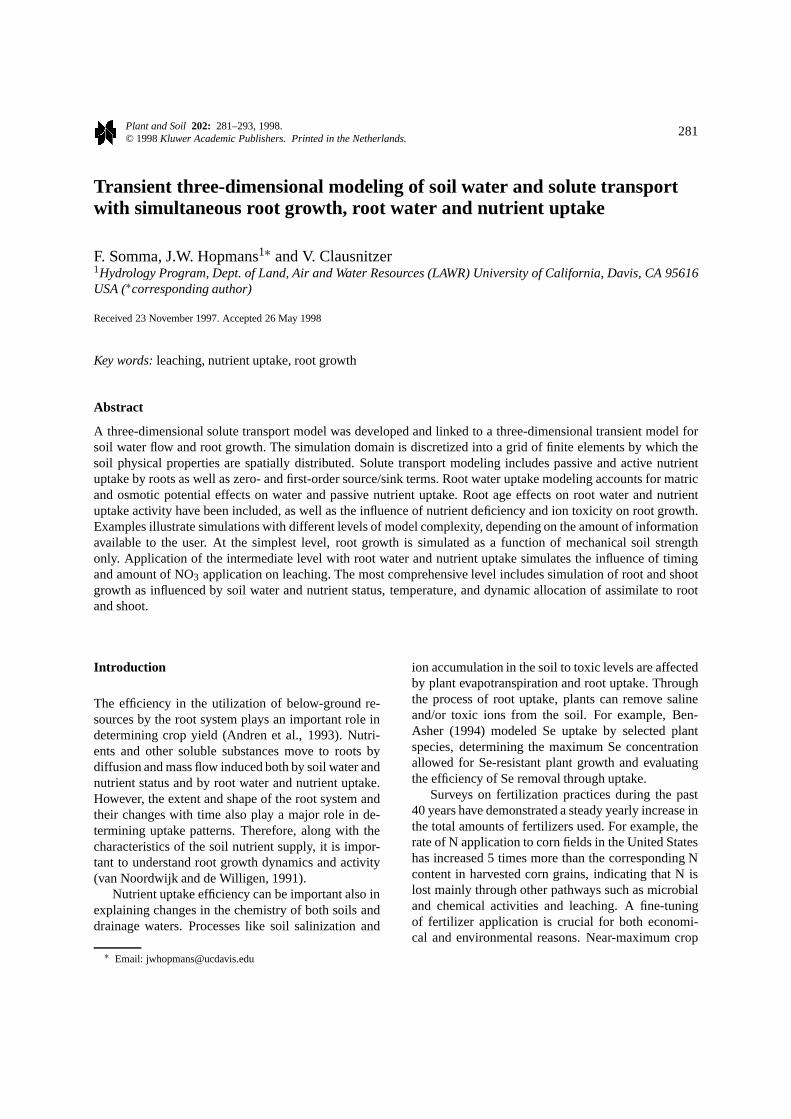
Figure 1. Water and nitrogen application regime for the ‘level 1’simulation.
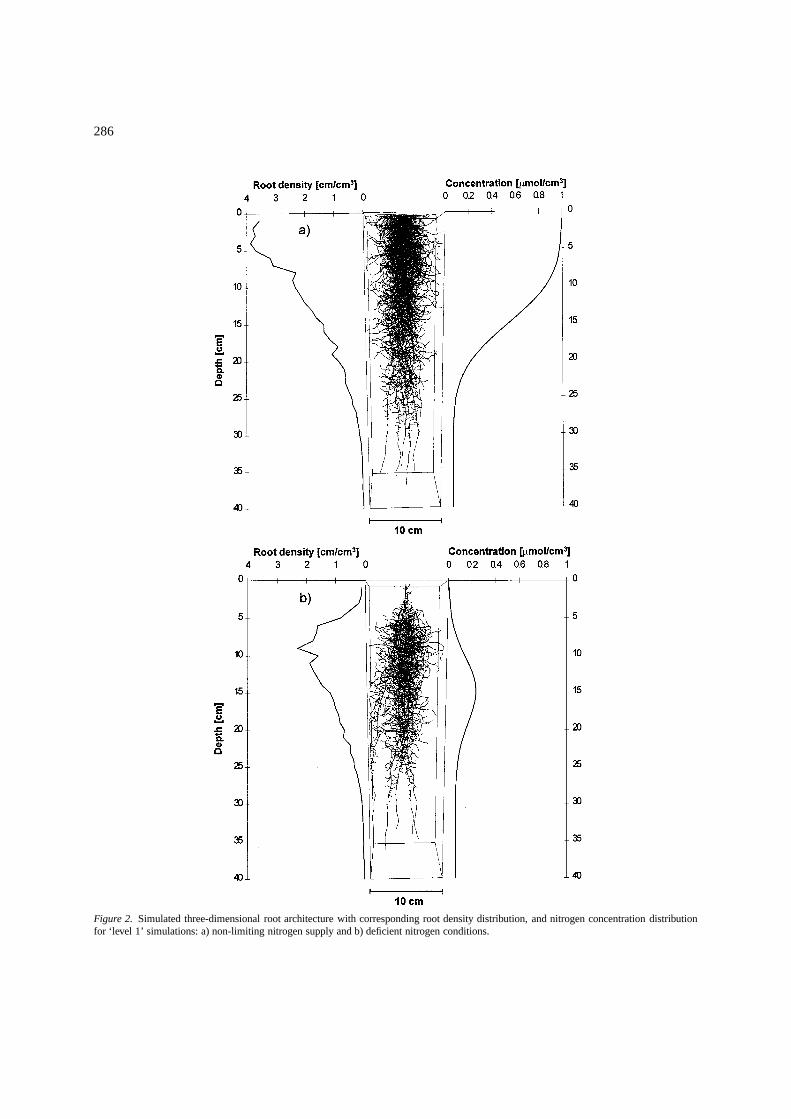
Drew et al. (1975) showed that increasing nutrientsupply for only part of the root system of a barley plantincreases root growth locally when the rest of the rootsystem is subjected to limited nutrient concentrations.Such effects were simulated with a ‘level 1’ option togrow barley with two different N application regimes,using the simulation control parameters and soil hy-draulic and solute transport parameters presented inTable 2 and Appendix I, respectively. Root growth pa-rameters are presented in Appendix I. Soil temperaturewas assumed to be optimal.
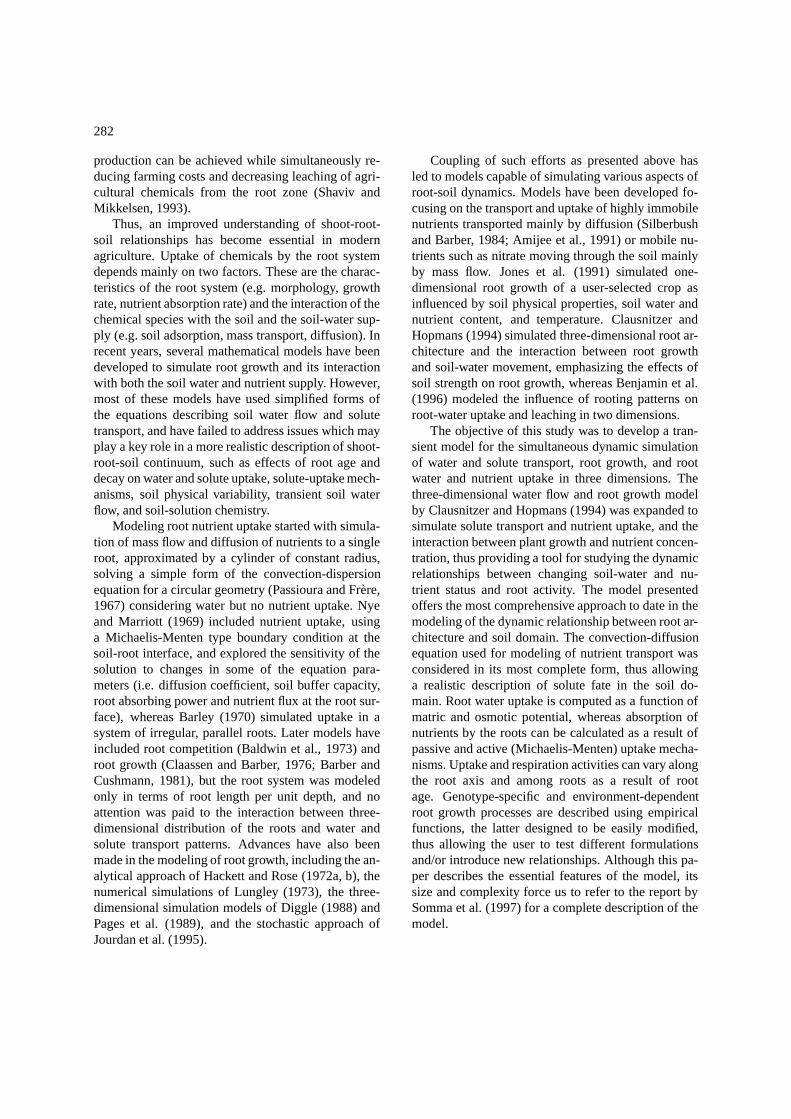
Both water and NO3-N were supplied through adripper, simulated by five nodes at the center of theupper boundary of the simulation domain. For each ofthose nodes, water flow and solute transport boundaryconditions (water flux,Qw [cm3/h], and concentra-tion, c [µmol/cm3], respectively) are presented inFigure 1, whereas initial conditions are presented inAppendix I. A no-flow boundary condition was ap-plied to all the other boundary nodes. Figures 2a and2b show the simulated root system grown under non-limiting and deficient NO3-N supply, respectively. Thefigure presents conditions at the end of the growthperiod (25 days). In both cases the soil-water con-tent was such that soil strength did not limit rootgrowth. Root density is presented to the left of eachroot system, whereas the NO3-N concentration profileis shown at the right. In the example of Figure 2a,NO3-N was applied continuously with the irrigationwater throughout the growth period. The predictedN-concentration was higher in the upper part of thesimulation domain, decreasing downwards. Similarly,the predicted root density decreased with increasingdepth. In Figure 2b, NO3-N was applied only dur-ing a limited time interval at the beginning of thegrowth period (the first 150 hours). Once N applica-tion stopped, the subsequent irrigation by the drippermoved the N plume downwards, causing a greater root
286
Figure 2. Simulated three-dimensional root architecture with corresponding root density distribution, and nitrogen concentration distributionfor ‘level 1’ simulations: a) non-limiting nitrogen supply and b) deficient nitrogen conditions.

287
Table 2. Simulation control parameters for simulation levels ‘1’, ‘2’ and ‘3’
Figure
1,2 3,4,5 6
Simulation level: 1 2 3
Domain size [cm]: 10×10×40 10×10×30 10×10×40
Number of nodes: 11×11×41 11×11×31 11×11×41
Root growth time step [h]: 12 12 12
Simulation end time [h]: 600 600 600
density in the central part of the root zone where theNO3-N content was higher. Indeed, the higher pre-dicted root density in the center of the root system wasfostered by the higher N amount transported down-wards earlier in the simulation, thus explaining theslight offset between root density and N concentra-tion peaks. Thus, the downward movement of the Nplume promoted root development at increasing depth,but resulted in a smaller average root density thanfor the nonlimiting-N case (0.664 cm/cm3 versus 1.25cm/cm3).
Water and solute uptake
The effects of soil salinity on root growth, root wa-ter uptake and plant transpiration have been exten-sively studied. Maas and Hoffman (1977) concludedthat crops tolerate salinity up to a threshold level,above which plant yield decreases approximately lin-early with increasing salt concentration. Al-Khafafet al. (1990) studied the response of barley rootand shoot growth for various levels of water and/orsalinity stress. They concluded that increasing thesoil-water osmotic potential reduced evapotranspira-tion and growth, and causes significant variations inthe soil water content distribution. Schmidhalter andOertli (1991) conducted similar studies on carrots, andconcluded that yield decreases linearly with increasingsoil salinity for non-limiting water supply conditions.Transpiration rates were affected only at the highestsalinity levels, but water stress reduced nutrient uptakedue to transport limitations in the soil and restrictedroot development.
The sink termS(x, y, z, t) in Eq. (1) is computedfrom:
S(x, y, z, t) = α(x, y, z, t)β ′(x, y, z, t)Tpot (5)
whereβ ′ is the normalized nodal value ofβ
β ′ = β(x, y, z)∫D β(x, y, z)dD
(6)
andD denotes integration over the complete soil do-main. The set of nodal sink-term valuesS(x, y, z, t)was calculated at each time step as in Clausnitzer andHopmans (1994). However, the localized form of thewater-extraction functionα(x, y, z, t) [–], accountingfor the local influence of soil-water potential on rootwater uptake rate, was replaced to include the effectsof osmotic potential on root water uptake. The nodalvalues ofα(x, y, z, t) in the present model were calcu-lated using the expression proposed by van Genuchten(1987), considering the combined effects of matric andosmotic potential on water uptake rate:
α(x, y, z, t) = 1
[1+ (h/h50)p1] ∗ [1+ (π/π50)p2](7)
whereh50 andπ50 are the soil-water pressure head andthe osmotic head at which the uptake rate is reducedby 50%, respectively, andp1, andp2 are fitting para-meters, assumed to be 3 (van Genuchten and Gupta,1993). Alternatively, if solute effects are not consid-ered, the option is provided to account for pressurehead effects only, by using either a simplified form ofEq. (7) or the expression by Feddes et al. (1978) usedin Clausnitzer and Hopmans (1994).
Distribution of potential root water uptake siteswithin the soil domain is lumped into nodal values of afunctionβ(x, y, z, t) [–]. To construct the set of nodalβ-values, first the finite element that surrounds eachroot segment is identified. To each of its eight cornernodes a value is contributed, which is equal to the in-verse distance between the center of the segment andthe respective corner, and proportional to the segmentlength. At any time theβ-value of a particular node

288
will increase as the number of active root segmentsand their respective lengths within its neighboring el-ements increase, and the distances from the elementnodes to the centerpoints of those segments decrease.To account for root-age effects on water uptake (Hen-riksen et al., 1992; Lazof et al., 1992), piecewise linearweighting functions are defined, which allow for vari-ations in root water uptake for each branch segmentdepending on age and branching order. Depending onthe current value of its weighting factor (between unityand zero), each segment in the root system can fullycontribute to, or be partially or totally excluded fromuptake.
If solute transport is included in the simulation,root solute uptake is lumped into nodal values of thesink termS′(x, y, z, t) of Eq. (2):
S′ = δS + (1− δ)A (8)
whereδ [–] is a partition coefficient with a value be-tween 0 and 1. The first term of the right-hand sidedescribes passive nutrient uptake (S is calculated ac-cording to Eq. (5)). The second term simulates activenutrient uptake. Experimental results (Kochian andLucas, 1982; Siddiqi et al., 1990) have shown that thekinetics of active uptake can be described by the sumof a Michaelis-Menten component (Barber, 1984) anda linear component (Kochian and Lucas, 1982):
A = ( VmaxKm + c + f )Rd (9)
whereVmax [ML−2T−1] is the maximum nutrient up-take rate, Km [ML−3] the Michaelis-Menten constant,Rd [L2L−3] the rooting density, andf [LT−1] is afirst-order rate coefficient.
The rooting-density function Rd is computed ateach time step from:
Rd(x, y, z, t) = T σ ′(x, y, z, t) (10)
whereT [L2] is the total root surface area andσ ′ [L−3]is a function describing the current distribution of po-tential solute-uptake sites within the domain. The totalroot surface areaT is obtained from:
T =∑
ti =∑
Li(2πri) (11)
whereti [L2] is the root segment surface area for eachsegmenti, Li [L] is the segment length, andri [L]is the segment radius (assumed constant within eachsegment), calculated from the mass-per-unit-length (as
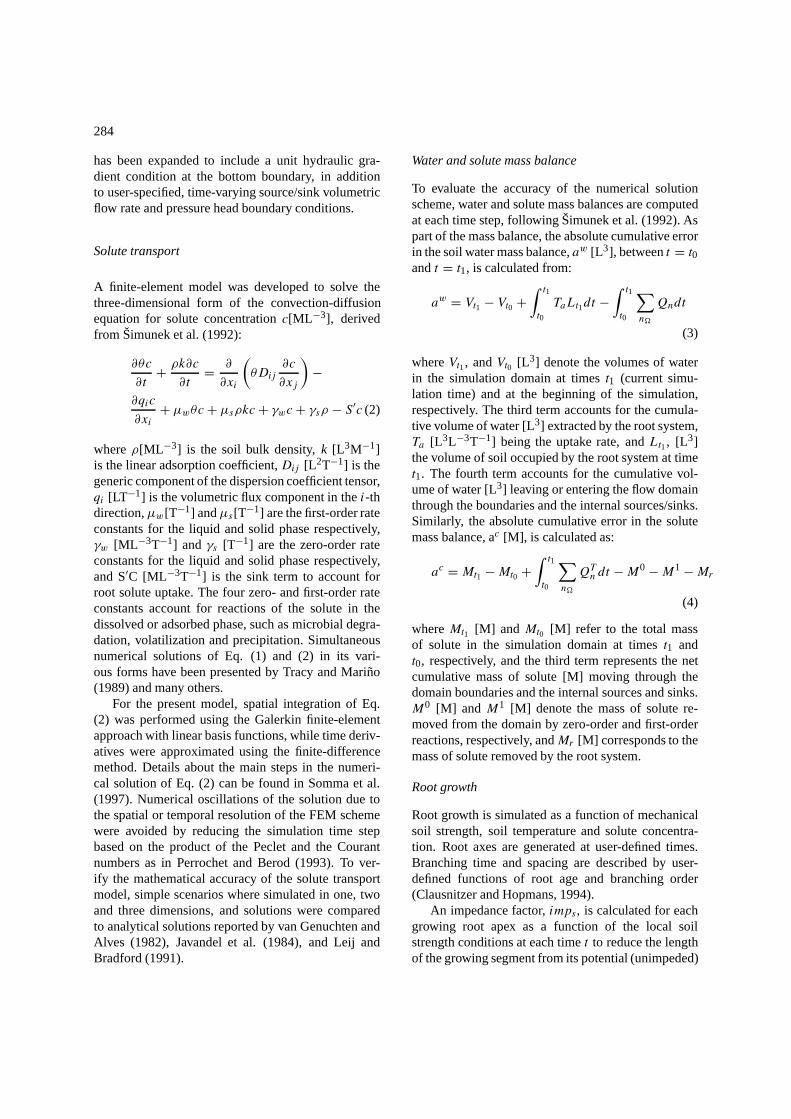
Figure 3. Water and nitrogen application regime for the ‘level 2’simulation.
a function of soil strength) and the dry root density,as specified in the input. The functionσ ′ is computedsimilar to theβ ′ function in Eq. (6), except that nodalvalues are proportional to the surface area rather thanthe segment length.
Using a ‘level 2’ simulation including nutrienttransport and uptake (δ = 1 in Eq. (8)), barley rootgrowth was simulated for a period of 25 days withthe irrigation schedule presented in Figure 3. Ini-tial conditions and soil hydraulic, solute-transport androot-growth parameters are presented in Appendix I,while simulation control parameters are presented inTable 2. Soil temperature was assumed to be optimal.In this example, both water and NO3-N were appliedthrough a dripper, simulated by five nodes at the centerof the upper boundary of the simulation domain. Aunit-gradient boundary condition was imposed at thedomain bottom.
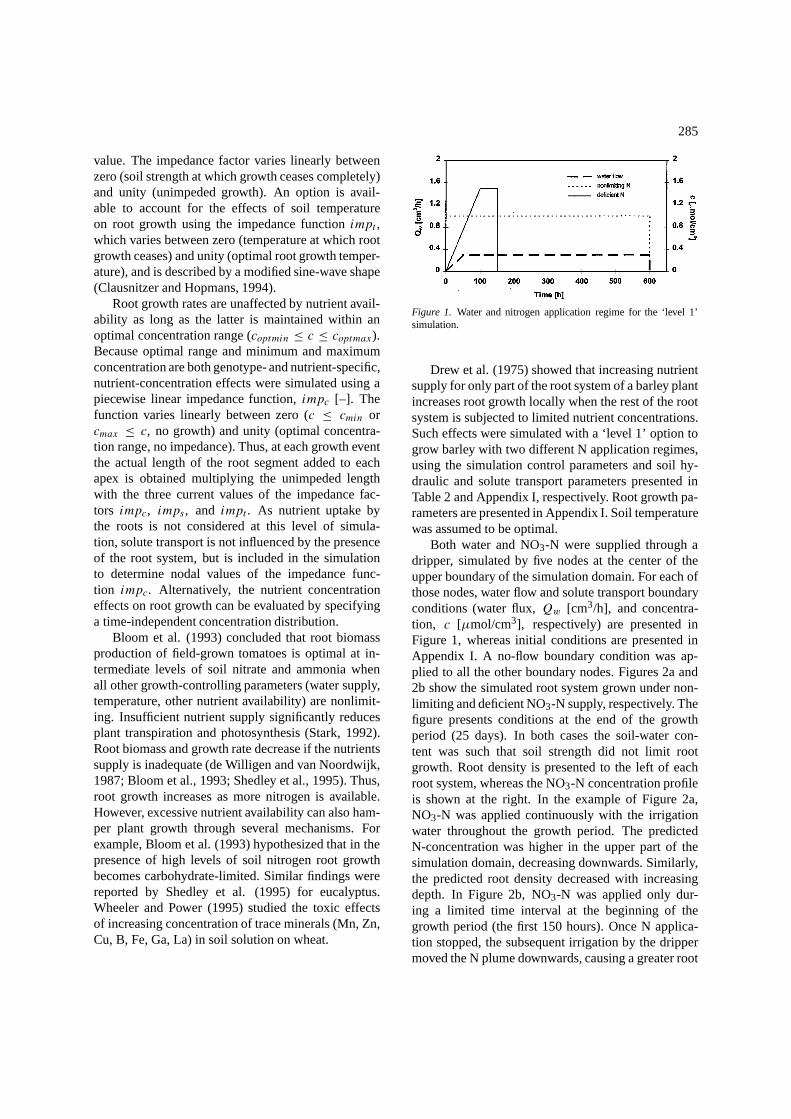
The results in Figure 4 were obtained by supplyingthe same total amount of NO3-N (225µmol) in bothsimulations; however, the distribution in time of theapplied fertilizer was different between the two cases(see Fig. 3). The predicted root system and the cor-responding uptake intensity (µmol/cm3h) of Fig. 4awere obtained by applying NO3-N with each irriga-tion event (nonlimiting N). In this case the N supplyis sufficient throughout the growth period and the rootsystem presents a regular growth pattern. For the rootsystem and corresponding N-uptake intensity in Fig-ure 4b, N was applied only with the first two irrigationevents. For this case, when all the nitrogen enters thedomain during the first 200 h of the simulation, muchof the applied N moves down and is leached out of thedomain before it can be taken up by the roots. Growthis hampered by lack of nutrient supply and roots aresparser, but reach a greater depth driven by the movingNO3-N plume. Figures 5a and 5b present the cumula-tive mass balance (µmol) for both simulations. The

289
Figure 4. Simulated root system and nutrient uptake rate(µmol/cm3h) for: a) sufficient and b) deficient nitrogen supply.
Figure 5. Total amount of N in the domain (STORE), cumulativeamount of N entering the domain through the dripper (INPUT), cu-mulative amount of N removed by the root system (UPTAK), andcumulative amount of N leached (DRAIN) for nonlimiting (a) anddeficient (b) N supply.
cumulative mass of N being applied to the root system(INPUT) by the end of growth period (25 days) wasidentical in both cases. However, for the case of uni-formly distributed nitrogen application the mass of Npresent in the domain (STORE) remained fairly con-stant (Fig. 5a), while for the deficient N case STOREdecreased rapidly after the first two N applicationsdue to leaching (DRAIN) caused by subsequent waterapplications (Fig. 5b). Consequently, total N uptake(UPTAK) was also significantly lower for the deficientN case (15µmol versus 50µmol of the nonlimiting-Ncase).
Shoot and root growth
At the most complex simulation level (‘level 3’) shootgrowth is modeled along with root growth, providedthat sufficient information is available to the user. Theeffects of solute concentration on plant growth can betaken into account if solute transport and root nutrientuptake are included in the simulation.

290
Potential root and shoot growth is based on four"potential-growth" parameters, each described by apiecewise linear function of time: (1) potential transpi-ration rate per unit leaf area,Tpot /LA, which allowscalculation of potential transpiration as a function ofthe current leaf area; (2) water-use efficiency, W,defined as dry mass gained per amount of water tran-spired; (3) root/shoot allocation ratio of new assimilateR, which partitions the biomass between the shoot andthe roots; and (4) increase in leaf area per incrementalincrease of new shoot dry mass. The latter parameteris needed to compute the leaf area increment from theamount of biomass allocated to the shoot, and drivesplant transpiration.
Biomass allocated to shoot creates increasing leafarea at each simulation time step. However, biomassallocated to roots is accumulated and distributed toroots only during root growth events. At those times, atentative segment length is calculated for each grow-ing apex as in ‘level 1’ and ‘2’ simulations, i.e. asa function of the local soil strength, temperature andnutrient concentration conditions. The segment lengththus obtained is then adjusted according to the amountof biomass allocated to roots. If the assimilate allo-cated is smaller than the potential need, the length ofall new growing segments is scaled back accordingly.Surplus assimilate is assumed to be exuded by the rootsystem.
In addition to the existing stress factors describingthe effects of soil strength on the three plant growthparametersTpot /LA, W andR, new factors were in-troduced to account for plant stress due to limitingor toxic solute concentration levels. While the effectof solute concentration on each of these parametershas been described by Schmidhalter and Oertli (1991),Stark (1992), and Ericsson (1995), the combined ef-fects and the interaction with other stress causes (soilstrength, water deficiency, and temperature) are stilluncertain. To allow complete flexibility in the test-ing of the relationships between different stresses, andto maintain consistency with the approach adoptedby Clausnitzer and Hopmans (1994) for soil strengthstress, the above mentioned factors were described bypiecewise linear functions of relative stress, the latterin turn being also described by a piecewise linear func-tion of solute concentration. When both soil strengthand solute concentration affect the three growth para-meters, only the most limiting stress-adjustment factoris used for biomass calculations (Jones et al., 1991).
A ‘level 3’ simulation was performed for non-limiting N supply and deficient N supply scenarios.
Figure 6. Simulated barley growth curves with: a) nonlimiting ni-trogen supply and: b) deficient nitrogen supply. Experimental pointsindicate data reported by Drew and Saker (1975).
The same simulation parameters and boundary con-ditions where assumed as in the ‘level 1’ simulation.Plant growth parameters are presented in AppendixI. Shoot and root growth curves are shown in Figure6a (nonlimiting N supply) and 6b (deficient N sup-ply), along with the experimental data points reportedby Drew and Saker (1975) for barley. Although themodel approximates the experimental data better forthe nonlimiting N supply than for deficient supply,the agreement between simulation and measurementis satisfactory.
Conclusion
The model presented in this paper allows the simulta-neous, dynamic simulation of root growth and waterand solute transport and uptake in three dimensions.Transient root growth processes are simulated by dis-cretizing in time (roots grow at user-defined timesteps), and space (at each growth event a new seg-ment is added to each growing root). The length ofthe segment and its direction are a function of local

291
soil environmental conditions. Complexity of the soilfactors influencing plant transpiration and root growthand uptake can vary depending on the informationavailable to the user. A mechanistic approach, includ-ing empirical functions, has been adopted to describeflow and transport and interactions with root and shootgrowth.
The intended purpose for the presented model is toprovide a tool for studying the interactive relationshipsbetween changing soil-water and nutrient status androot activity. Extensions to the Clausnitzer and Hop-mans (1994) model include simulation of solute trans-port and root solute uptake, and effects of additionalenvironmental stresses on root growth and activity, in-cluding osmotic potential, nutrient deficiency, and iontoxicity. Root uptake is considered using an empiricalmacroscopic approach, as opposed to a formulationwhere local water-potential and nutrient-concentrationgradients are the driving forces. However, reducedlocal water and/or nutrient uptake by root decay andaging is compensated for by enhanced uptake by theremainder of the root system. The authors understandthe limitations of the model, including the lack of rootcompetition in its formulation, and suggest that muchexperimental work is needed to provide the model withthe correct parameter values and functional relation-ships. The flexible structure of the model and easyaccessibility of its components should make it a usefulworkbench for hypothesis testing.
Appendix I
Initial conditions
At the beginning of each simulation the soil was athydraulic equilibrium, with a pressure head of – 420cm at the soil surface. The NO3-N concentration was0.06µmol/cm3 throughout the soil domain for the ex-amples of Figures 2 and 6, and 0.1µmol/cm3 for theexample in Figures 4 and 5.
Soil hydraulic and solute transport parameters
Residual volumetric water contentθr and saturatedvolumetric water contentθs as well as fitting pa-rametersa and n, necessary for the description ofthe soil water retention and conductivity curves (vanGenuchten, 1980) are reported in Table 3. In thesame table are also presented the molecular diffusioncoefficient Dd and the longitudinal and transverse dis-persivities,DL andDT respectively, necessary for the
Table 3. Soil hydraulic and solute transport parameters for simu-lation levels ‘1’, ‘2’ and ‘3’
Figure
Soil 1,2 3,4,5 6 Solute
hydraulic transport
parameters parameters
θr : 0 0 0 ρ[g/cm3]: 1.53
θs : 0.55 0.55 0.55 Dd [cm2/h]: 0.0684
a[cm−1]: 0.003 0.003 0.003 DL[cm]: 0.5
n : 3.0 3.0 3.0 DT [cm]: 0.1
Ks [cm/hr]: 0.75 0.5 0.75
calculation of the components of the dispersion tensorDij , (Šimunek et al., 1992) presented in Eq. (2).
Root growth parameters
See Table 4.
Plant growth parametersThe following parameters were used in the ‘level 3’simulation presented in Figure 6: Basic (i.e., no stress)plant functions:– Potential transpiration rate per leaf area: 0.01 cm3
H2O/cm2 leaf area/hr– Water use efficiency: 0.00535 g/ cm3 H2O– Root/shoot allocation ratio: 0.62
Soil strength stress factor functions– Transpiration reduction factor due to relative
stress: interpolated between 0.96 at zero stress and0.625 at relative stress equal to 1.0
– Water use efficiency factor due to relative stress:equal to one at all stress levels
– Root/shoot ratio factor due to relative stress: inter-polated between 1 at zero stress and 1.2 at relativestress equal to 1.0Relative stress defined as a function of soil
strength: interpolated between 0 at 1.5 MPa and 1 at5.3 MPaSolute concentration stress factor functions– Transpiration reduction factor due to relative
stress: equal to one for all concentrations– Water use efficiency factor due to relative stress:
interpolated between 1 at zero stress and 0.1 atrelative stress equal to 1.0
– Root/shoot ratio factor due to relative stress: inter-polated between 1 at relative stress equal to 0.5 and2 at relative stress equal to 1.0
292
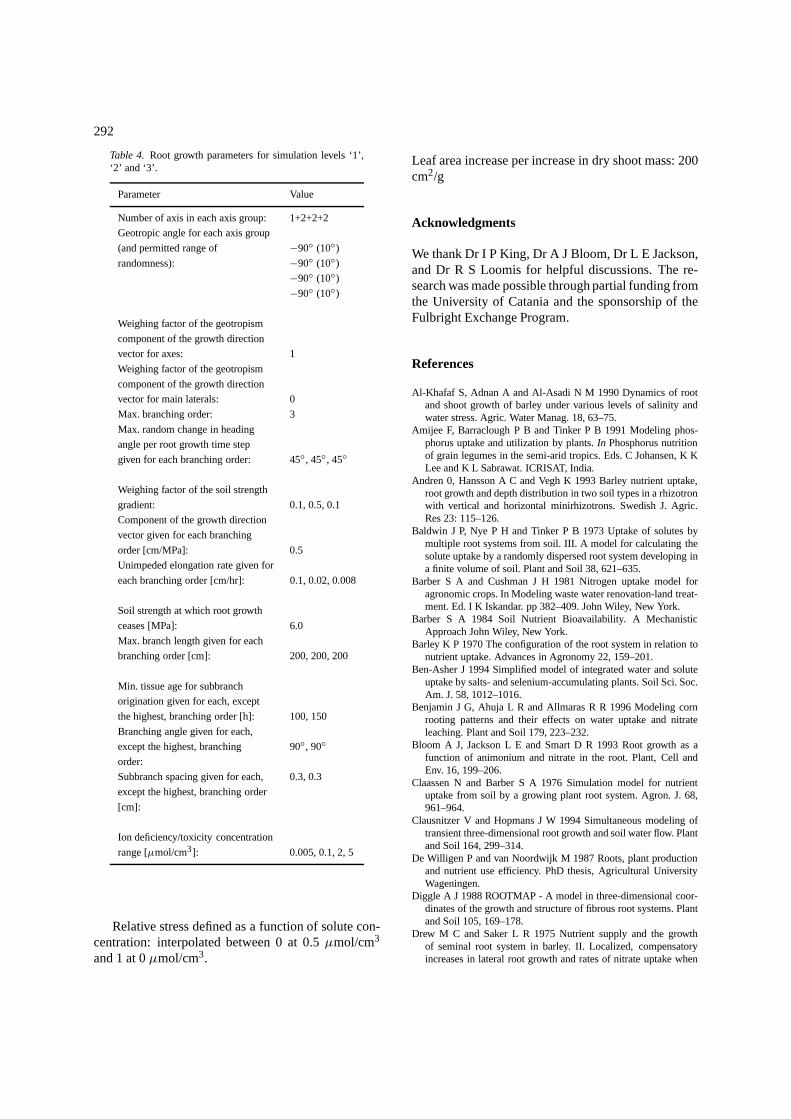
Table 4. Root growth parameters for simulation levels ‘1’,‘2’ and ‘3’.
Parameter Value
Number of axis in each axis group: 1+2+2+2
Geotropic angle for each axis group
(and permitted range of −90◦ (10◦)randomness): −90◦ (10◦)
−90◦ (10◦)−90◦ (10◦)
Weighing factor of the geotropism
component of the growth direction
vector for axes: 1
Weighing factor of the geotropism
component of the growth direction
vector for main laterals: 0
Max. branching order: 3
Max. random change in heading
angle per root growth time step
given for each branching order: 45◦, 45◦, 45◦
Weighing factor of the soil strength
gradient: 0.1, 0.5, 0.1
Component of the growth direction
vector given for each branching
order [cm/MPa]: 0.5
Unimpeded elongation rate given for
each branching order [cm/hr]: 0.1, 0.02, 0.008
Soil strength at which root growth
ceases [MPa]: 6.0
Max. branch length given for each
branching order [cm]: 200, 200, 200
Min. tissue age for subbranch
origination given for each, except
the highest, branching order [h]: 100, 150
Branching angle given for each,
except the highest, branching 90◦, 90◦order:
Subbranch spacing given for each, 0.3, 0.3
except the highest, branching order
[cm]:
Ion deficiency/toxicity concentration
range [µmol/cm3]: 0.005, 0.1, 2, 5
Relative stress defined as a function of solute con-centration: interpolated between 0 at 0.5µmol/cm3
and 1 at 0µmol/cm3.
Leaf area increase per increase in dry shoot mass: 200cm2/g
Acknowledgments
We thank Dr I P King, Dr A J Bloom, Dr L E Jackson,and Dr R S Loomis for helpful discussions. The re-search was made possible through partial funding fromthe University of Catania and the sponsorship of theFulbright Exchange Program.
References
Al-Khafaf S, Adnan A and Al-Asadi N M 1990 Dynamics of rootand shoot growth of barley under various levels of salinity andwater stress. Agric. Water Manag. 18, 63–75.
Amijee F, Barraclough P B and Tinker P B 1991 Modeling phos-phorus uptake and utilization by plants.In Phosphorus nutritionof grain legumes in the semi-arid tropics. Eds. C Johansen, K KLee and K L Sabrawat. ICRISAT, India.
Andren 0, Hansson A C and Vegh K 1993 Barley nutrient uptake,root growth and depth distribution in two soil types in a rhizotronwith vertical and horizontal minirhizotrons. Swedish J. Agric.Res 23: 115–126.
Baldwin J P, Nye P H and Tinker P B 1973 Uptake of solutes bymultiple root systems from soil. III. A model for calculating thesolute uptake by a randomly dispersed root system developing ina finite volume of soil. Plant and Soil 38, 621–635.
Barber S A and Cushman J H 1981 Nitrogen uptake model foragronomic crops. In Modeling waste water renovation-land treat-ment. Ed. I K Iskandar. pp 382–409. John Wiley, New York.
Barber S A 1984 Soil Nutrient Bioavailability. A MechanisticApproach John Wiley, New York.
Barley K P 1970 The configuration of the root system in relation tonutrient uptake. Advances in Agronomy 22, 159–201.
Ben-Asher J 1994 Simplified model of integrated water and soluteuptake by salts- and selenium-accumulating plants. Soil Sci. Soc.Am. J. 58, 1012–1016.
Benjamin J G, Ahuja L R and Allmaras R R 1996 Modeling cornrooting patterns and their effects on water uptake and nitrateleaching. Plant and Soil 179, 223–232.
Bloom A J, Jackson L E and Smart D R 1993 Root growth as afunction of animonium and nitrate in the root. Plant, Cell andEnv. 16, 199–206.
Claassen N and Barber S A 1976 Simulation model for nutrientuptake from soil by a growing plant root system. Agron. J. 68,961–964.
Clausnitzer V and Hopmans J W 1994 Simultaneous modeling oftransient three-dimensional root growth and soil water flow. Plantand Soil 164, 299–314.
De Willigen P and van Noordwijk M 1987 Roots, plant productionand nutrient use efficiency. PhD thesis, Agricultural UniversityWageningen.
Diggle A J 1988 ROOTMAP - A model in three-dimensional coor-dinates of the growth and structure of fibrous root systems. Plantand Soil 105, 169–178.
Drew M C and Saker L R 1975 Nutrient supply and the growthof seminal root system in barley. II. Localized, compensatoryincreases in lateral root growth and rates of nitrate uptake when
293
nitrate supply is restricted to only part of the root system. J. Exp.Bot. 26, 79–90.
Ericsson T 1995 Growth and shoot: root ration of seedlings inrelation to nutrient availability. Plant and Soil 168–169, 205–214.
Feddes R A, Kowalik P J and Zaradny H 1978 Simulation offield water use and crop yield. Simulation Monographs, Pudoc,Wageningen, The Netherlands.
Hackett C and Rose D A 1972a A model of the extension andbranching of a seminal root of barley, and its use in studyingrelations between root dimensions. I. The model. Aust. J. Biol.Sci. 25, 669–679.
Hackett C and Rose D A 1972b A model of the extension andbranching of a seminal root of barley, and its use in studying re-lations between root dimensions. II. Results and inferences frommanipulation of the model. Aust. J. Biol. Sci. 25, 681–690.
Henriksen G H, Raman D R, Walker L P and Spanswick R M1992 Measurement of net fluxes of ammonium and nitrate atthe surface of barley roots using ion-selective microelectrodes:II. Patterns of uptake along the root axis and evaluation ofthe microelectrode flux estimation technique. Plant Physiol. 99,734–747.
Javandel I, Doughty C and Tsang C F 1984 Groundwater transport:handbook of mathematical models. A.G.U. Water ResourcesMonograph No. 10, Washington, D.C.
Jones C A, Bland W L, Ritchie J T and Williams J R 1991 Sim-ulation of root growth.In Modeling Plant and Soil Systems.ASA-CSSA-SSSA Agronomy Monograph no. 31.
Jourdan C, Rey H and Guédon Y 1995 Architectural analysis andmodeling of the branching process of the young oil-palm rootsystem. Plant and Soil 177, 63–72.
Kochian L V and Lucas W J 1982 Potassium transport in corn roots.I. Resolution of kinetics inot a saturable and linear componentPlant Physiol. 70, 1723–1731.
Lazof D B, Rufty T W and Redinbaugh M G 1992 Localiza-tion of nitrate absorption and translocation within morphologicalregions of the corn root. Plant Physiol. 100, 1251–1258.
Leij F J and Bradford S A 1991 3DADE: a computer programfor evaluating three-dimensional equilibrium solute transport inporous media. U.S. Salinity Laboratory Research Report No.134, Riverside, Ca.
Lungley D R 1973 The growth of root systems - A numericalcomputer simulation model. Plant and Soil 38, 145–159.
Maas E V and Hoffman G J 1977 Crop salt tolerance - Currentassessment. J. of Irrig. and Drain. Engrg. 103, 115–134.
Mariño M A and Tracy J C 1988 Flow of water through root-soilenvironment. J. of Irrig. and Drain. Engrg. 114, 588–604.
Milly P C D 1988 Advances in modeling of water in the unsaturatedzone. Transport in Porous Media 3, 491–514.
Nye P H and Marriott F H C 1969 A theoretical study of the dis-tribution of substances around roots resulting from simultaneousdiffusion and mass flow. Plant and Soil 3, 459–472.
Pages L, Jordan M O, and Picard D 1989 A simulation model of thethree-dimensional architecture of the maize root system. Plantand Soil 119, 147–154.
Passioura J B and Frére M H 1967 Numerical analysis of convectionand diffusion of salutes to roots. Aust. J. Soil Res. 5, 149–159.
Perrochet P and Berod D 1993 Stability of the standard Crank-Nicholson-Galerkin scheme applied to the diffusion-convectionequation: some new insights. Water Resour. Res. 29(9), 3291–3297.
Richards LA 1931 Capillarity conduction of liquids through porousmedia. Physics 1, 318–333.
Schmidhalter U and Oertli J J 1991 Transpiration/biomass ratio forcarrots as affected by salinity, nutrient supply and soil aeration.Plant and Soil 135, 125–132.
Shaviv A and Mikkelsen R L 1993 Controlled-release fertilizers toincrease efficiency of nutrient use and minimize environmentaldegradation - A review. Fert. Res. 35, 1–12.
Shedley E, Dell B and Grove T 1995 Diagnosis of nitrogen defi-ciency and toxicity of Eucaliptus globulus seedlings by foliaranalysis. Plant and Soil 177, 183–189.
Siddiqi M Y, Class AD M, Ruth T J and Rufty T W 1990 Studies ofthe uptake of nitrate in barley: 1. Kinetics of13NO3-influx. PlantPhysiol. 93, 1426–1432.
Silberbush M and Barber S A 1984 Phosphorus and potassium up-take of field-grown soybean cultivars predicted by a simulationmodel. Soil Sci. Soc. Am. 3. 48, 592–596.
Šimunek J, Vogel T and van Genuchten M Th 1992 The SWMS_2Dcode for simulating water flow and solute transport in two-dimensional variably saturated media, V.1.1. Research ReportNo. 126, U.S. Salinity Lab, ARS USDA, Riverside, Ca..
Somma F, Clausnitzer V and Hopmans J W 1997 An algorithm forthree-dimensional simultaneous modeling of root growth, tran-sient soil water flow, and transport and uptake, V.2.1. Land, Airand Water Resources Paper No. 100034, Univ. of California,Davis.
Stark N 1992 The effects of water and multi-nutrient stress on xylemsap chemistly, photosynthesis and transpiration of seedlings oftwo Eucalypts. Trees 6, 7–12.
Tracy J C and Mariño M A 1989 Solute movement through root-soilenvironment. J. of Irrig. and Drain. Engrg. 115, 608–625.
Van Genuchten, M. Th. 1980 A closed-form equation for predict-ing the hydraulic conductivity of unsaturated soils. Soil Sci. Soc.Am. J. 44, 892–898.
Van Genuchten, M. Th. and Alves W J 1982 Analytical solutionsof the one-dimensional convective-dispersive solute transportequation. USDA Technical Bulletin No. 1661.
Van Genuchten, M. Th., 1987, A numerical model for water andsolute movement in and below the root zone, Research ReportNo. 121, U.S. Salinity Lab, ARS USDA, Riverside, Ca..
Van Genuchten M Th and Gupta S K 1993 A reassessment of thecrop tolerance response function. 3. Indian Soc. Soil Sci. 4, 730–737.
Van Noordwijk M and de Willigen P 1991 Root function in agri-cultural systems.In Plant roots and their environment. Eds. BL McMichael and H Persson. pp 381–395. Elsevier SciencePublishers.
Vogel T 1987 SWM II- numerical model of two-dimensional flowin a variably saturated porous medium. Research Report No. 87,Wageningen Agricultural Univ., The Netherlands.
Wheeler D M and Power I L 1995 Comparison of plant uptake andplant toxicity of various ions in wheat. Plant and Soil 172, 167–173.
Section editor: B E Clothier