transient electrochemical heat transfer modeling and
TRANSCRIPT

1
Transient Electrochemical Heat Transfer Modeling and Experimental Validation of a Large Sized LiFePO4/Graphite Battery
S. Panchal*1, I. Dincer1, M. Agelin-Chaab1, R. Fraser2, and M. Fowler3
1 Department of Automotive, Mechanical & Manufacturing Engineering, Faculty of Engineering & Applied Science, University of Ontario Institute of Technology, 2000 Simcoe Street North, Oshawa, Ontario, Canada, L1H 7K4 2 Mechanical and Mechatronic Engineering Department, University of Waterloo, 200 University Avenue West,
Waterloo, Ontario, Canada, N2L 3G1 3 Chemical Engineering Departments, University of Waterloo, 200 University Avenue West, Waterloo, Ontario,
Canada, N2L 3G1 *Corresponding Author’s Telephone: +1-519-722-4420
*Corresponding Author’s Email: [email protected], [email protected]
Abstract
Measurement and modeling of thermal performance in lithium-ion battery cell is crucial which directly
affects the safety. Even though the operation of a lithium-ion battery cell is transient phenomena in most
cases, most available thermal models for lithium-ion battery cell predicts only steady-state temperature
fields. This paper presents a mathematical model to predict the transient temperature distributions of a large
sized 20Ah-LiFePO4 prismatic battery at different C-rates. For this, the Lithium-ion battery was placed in
a vertical position on a stand inside the lab with an ambient air cooling and the battery is discharged under
constant current rate of 1C, 2C, 3C, and 4C in order to provide quantitative data regarding thermal behaviour
of lithium-ion batteries. Additionally, IR images are taken for the same battery cell during discharging.
Model predictions are in good agreement with experimental data and also with an IR imaging for
temperature profiles. The present results show that increased C-rates results in increased temperature on
the principle surface of the battery.
Keywords: Heat transfer; thermal analysis; Lithium-ion battery; electrochemical model; ANSYS.
1. Introduction
The automotive industry has been forced to move towards sustainable vehicles such as electric vehicles
(EVs), hybrid electric vehicles (HEVs), plug-in hybrid electric vehicles (PHEVs), and fuel cell vehicles
(FCVs) to alleviate the environmental issues. These days, lithium-ion batteries are gaining widespread
acceptance in the development of EVs, HEVs, and PHEVs [1]. Their extensive usage is due to: 1) high
specific energy and power densities [2, 3]; 2) high nominal voltage and low self-discharge rate [4]; and 3)
long cycle-life and no memory effect [5]. To extend the life of battery, precautions must be taken during
discharging and charging since, for example exceeding voltage, current or power limits may result in battery
cell damage. The possibility of thermal runaways also occurs if care is not properly taken [6, 7]. Moreover,
The final publication is available at Elsevier via http://dx.doi.org/10.1016/j.ijheatmasstransfer.2017.03.005 © 2017. This manuscript version is made available under the CC-BY-NC-ND 4.0 license http://creativecommons.org/licenses/by-nc-nd/4.0/

2
lithium-ion polymer batteries must be carefully monitored and managed (electrically and thermally) to
avoid safety (inflammability) and performance related issues [8, 9, 10, 11, 12].
There are various papers in the open literature available for battery thermal modeling, using different
approaches such as artificial neural network [13, 14, 15], finite element model (FEM) [16, 17] or lumped
parameter model (LPM) [18], linear parameter varying (LPV) model [19], or partial differential equation
(PDE) model [20], CFD models [21, 22, 23, 24, 25, 26]. Battery modeling based on electrochemical
equations provides a deep understanding of the physical and chemical process inside the battery which
makes it useful when designing a cell, but high computational time makes these models improper for
applications with high dynamics. The first electrochemical modeling approach to porous electrodes with
battery applications was presented by Newman and Tiedemann in 1975 [27]. In the porous electrode theory,
the electrode is treated as a superposition between the electrolytic solution and solid matrix. The matrix
itself is modeled as microscopic spherical particles where lithium ions diffuse and react on the surface of
the sphere. This approach was expanded to include two composite models and a separator by Fuller et al.
in 1994 [28]. This model was later adapted for Ni-MH batteries [29] , and then lithium-ion batteries [30].
Li et al. [22] studied physics-based CFD simulation of a lithium-ion battery with the drive cycle of FUDS
and used Newman’s pseudo-2D (P2D) porous electrode model for a large sized lithium-ion battery. They
also addressed two major problems to implement such models in the electrochemical-thermal coupled
battery simulation. The first was how to use such an electrode-scale model in a large scale simulation and
the second was how to make the physics-based model cost-efficient in a CFD simulation. In their study, to
address the first technical issue, they used the multi-scale multi-dimensional approach (MSMD), and to
address the second issue, they used a linear approximation.
Majdabadi et al. [31] built up a physics-based model to anticipate the thermal and electrical performance
of a LiFePO4 battery under different operating conditions. They simplified Newman's full-order porous-
electrode model at the electrode-level by using polynomial approximations for electrolyte variables, while
at the molecule level, a multi-particle model featuring variable solid-state diffusivity was utilized. The
computational time was reduced by almost one order of magnitude when contrasted with the full-order
model without sacrificing the preciseness of the results. Their model was general and can be utilized to
expedite the simulation of any composite electrode with active-material particles of non-uniform properties
(e.g., contact resistance, size).
Mastali et al. [32] similarly developed an electrochemical-thermal model of a commercial
Graphite/LiFePO4 prismatic cell (20 Ah capacity) using FORTRAN code. They conducted the validation
against the experimental data for charge/discharge rates varying from 1C to 5C. Physics-based one-

3
dimensional electrochemical models were coupled with charge conservation and heat diffusion equations
to describe the electrochemical and thermal variable distributions throughout the battery domain. All the
electrochemical properties of the graphite and LiFePO4 electrodes were obtained from half-cell simulations
performed on the same electrode materials.
Xu et al. [33] built up a pseudo 3D electro-chemical-thermal model for a large sized prismatic LiFePO4
battery during the discharge process by coupling the mass, charge, and energy conservations, and the cell
electrochemical kinetics. They studied both the electrochemical and thermal performance of the battery.
Their model treated the battery with the current collecting tabs as 3D and the local cell units as 1D. They
also introduced a consistency index describing the SOC distributions among 1D cell units. This index was
utilized to explore the effects of the tab arrangement on the consistency of the battery cell. They similarly
found that the location of the current collecting tabs (of the negative and positive) on the prismatic battery
had a great impact on the distributions of its potential and local reaction rates, which therefore affect the
rate of heat generation, and subsequently the distribution of temperature inside the battery.
Additionally, Yang et al. [34] performed an examination of the uneven discharging and aging as a result of
the difference in temperature among the parallel-connected battery cells. They built a thermal–
electrochemical model for the parallel-connected battery pack and found that, at a higher temperature, the
cell encounters a bigger current in the early discharging process before around 75% of DOD for the parallel-
connected cells. Their simulations also demonstrated that the temperature difference between the parallel-
connected battery cells incredibly aggravates the irregularity discharge between the cells, which accelerated
the losses of the battery pack capacity. For the pack with parallel-connected batteries, the rate of capacity
loss approximately increased linearly as the difference in temperature between each cell increased.
Huo et al. [35] also presented a 3D model of the thermal performance of a lithium-ion battery. The effect
of the discharge conditions on the thermal behavior was determined by utilizing the FEM. They analyzed
the dynamic thermal behavior by utilizing various drive cycles and concluded that, natural convection was
adequate to keep the temperature at 25°C.
Lastly, Lai et al. [36] also built up a pseudo two-dimension (P2D) electrochemical model combined with a
3D heat transfer model. Their numerical model solved conservation of energy throughout the battery by
considering the sources of heat generation; for example, electrochemical reactions, active polarization, and
ohmic losses. Their outcomes showed an identical behavior of the temperature profile with thermal imaging
and voltage distribution. They additionally found that the heat generation of the current collectors and
separator was generally lower in magnitude, demonstrating little effect on temperature changes. The

4
reversible heat variations on the positive side affected the aggregate reversible heat, while the negative
irreversible heat had a predominant position in the total irreversible heat.
Infra-red (IR) imaging technique is also an excellent tool for the temperature measurement on the surface
of an object. It provides several advantages over other types of temperature sensors. It is basically non-
contact and also gives very helpful details of the surface being studied [37]. Some examples are:
Streza et al. [38] used an IR camera (FLIR 7200 series) to capture the thermal images of lead-acid batteries
to investigate the distribution of current in the electrodes. They designed a special cell (14 cm x 14 cm)
with electrodes in direct contact with an air. The information was extracted during the discharge process by
analysis of the heat dissipation in the electrode. The effect of the current in the metallic grid can be de-
convoluted by the total heat generated in the electrode by numerical processing of the temperature profile
on the surface of an electrode. Their proposed method had the potential to become an important tool in
optimising electrode geometry because of its simplicity and effectiveness.
Bazinski et al. [39] also utilized a combined method of thermography technique along with a closed-form
lumped capacitance model (LCM) in order to predict the heat generation inside the 14.5 Ah lithium-ion
phosphate pouch cell. They used a FLIR A320 IR thermal camera to capture the images at high discharge
rates of 1C, 2C, 3C, and 5C, as well as at a low discharge rate of C/4. The authors found that, at lower C-
rate, the temperature is uniform while at higher C-rates localized hot spots developed in the cell and the
spatial temperature were not uniform.
2. Experimental Set-up and Procedure
The battery test set-up is shown in Figure 1 (a). A 20 Ah prismatic lithium-ion pouch type battery cell was
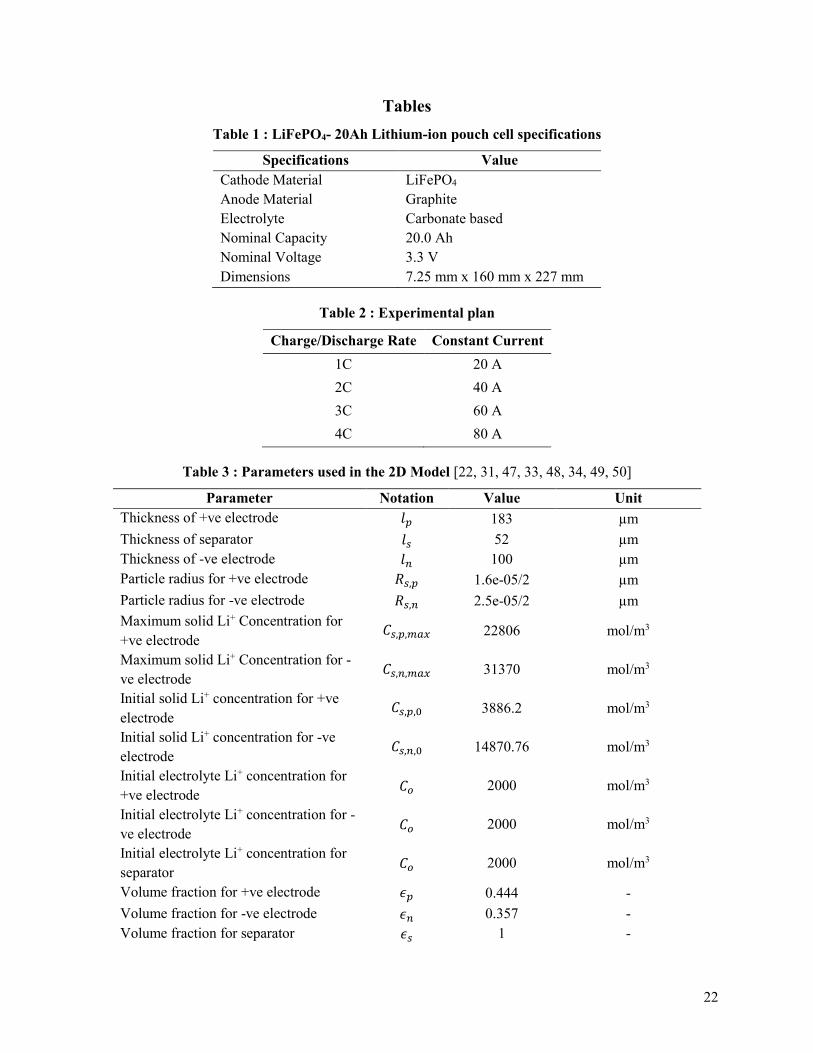
used for the test measurements and subsequent model validation. Table 1 tabulates the cell specifications.
For an ambient air cooling method, the lithium-ion battery was placed in a vertical position on a stand inside
the lab where the temperature was 22°C. The test bench consists five components: load box, charging unit,
LabVIEW, National Instrument (NI) temperature measurement device, Computer 1 and Computer 2. Four
different discharge rates (constant current) were selected: 1C, 2C, 3C, and 4C. The charge rate (constant
current-constant voltage) was 1C. The experimental plan is shown in Table 2. XBL 50-150-800 Dynaload
load box with a maximum capacity of 800 W was used to discharge the battery cell. TDK-Lambda power
supply with a capacity of maximum 20 V and 40 A was used to charge the battery cell. Heavy duty copper
cables were used to connect battery cell with load box and charging unit through a 100 A fuse. T-type
thermocouple used to measure the temperature was connected to NI temperature measurement device,

5
which is further connected to the computer. LabVIEW 8.2 software was used to control and operate the NI
temperature measurement device at the computer.
The experimental set-up during IR imaging is shown in Figure 1 (b). Flir Therma CAM S60 camera was
used in order to capture the IR images of the battery during discharging. This thermal camera has a 320 x
240 detector, standard temperature range 0 − 500°C and an accuracy of 2 % (typically 2°C). The sensor is
able to detect temperature variances as small as 0.06°C. The camera was positioned on a tripod outside the
enclosing box and pointed such that the detector viewed only the battery. For IR imaging experiments, first,
the charging was performed on the battery until the battery reached a fully charged state. Second, when the
battery was fully charged, the camera was oriented in a level position and pointed such that it viewed only
the surface of the battery. Settings in the camera were prepared to record images at 20 second intervals once
underway. Third, discharge current rate was modified in the battery cycling stand computer, and the internal
clocks on the camera and computer were synchronized. The battery discharge and camera recording were
then activated simultaneously.
3. Model Development
This model is basically a Newman’s pseudo two dimensional (P2D) for a large sized prismatic lithium-ion
battery. In this model, the physics-based two-dimensional electrochemical models are combined with the
charge conservation and heat diffusion equations throughout the battery domain in order to calculate the
temperature distributions. The governing equations and boundary conditions, along with the parameters
used for the model development and material properties, are presented. The utilized physics-based two-
dimensional models accurately predict the behavior of the negative and positive electrodes considering the
material phase-change inside the active electrode particles and the particle-size distribution observed in
scanning electron microscope (SEM) images of electrodes. This approach provides the opportunity of
precisely studying even the particle-level phenomena effects on the prismatic cell electrochemical-thermal
behaviors. The developed model for the 20 Ah prismatic battery cell is compared against the experimental
data for the temperature distribution on the surface of the prismatic cell during discharge at 2C, 3C, and
4C.
3.1 Geometry and Meshing
The Newman P2D model, initially presented by Doyle at el. [40, 28] and utilized by different researchers
[41, 42], separates the battery into the particle and electrode domains. In the particle domain, the
conservation of lithium is solved. The particles are usually considered to be spherical and Fick’s law
governs the particle lithium diffusion. In the electrode domain, the conservation of charge in the solid-phase
and electrolyte, as well as the conservation of mass in the electrolyte, is solved. This model, based on the

6
principles of transport phenomena, electrochemistry, and thermodynamics, is introduced by couple
nonlinear partial differential equations (PDEs) in x, r, and t that can take from a second to a minute for
simulation. This model expands on the ohmic porous-electrode model by including diffusion in electrolyte
and solid phases, as well as Butler-Volmer kinetics. Doyle created a P2D model based on a concentrated
solution theory to describe the internal behavior of a lithium-ion sandwich consisting of positive (+) and
negative (-) electrodes, a separator and current collector. This physics-based model is by far the most used
by battery researchers and solves for the electrolyte concentration, electrolyte potential, solid state potential,
and solid state concentration within the porous electrodes and electrolyte concentration, and electrolyte
potential within the separator.
Figure 2 is a schematic diagram of lithium-ion battery cell configuration for the pseudo-two dimensional
multi-particle model [33]. During the discharge process, lithium diffuses to the surface of the negative-
electrode particles and undergoes an electrochemical reaction. This reaction releases an electron and
transfers lithium to the electrolyte phase. The lithium-ions diffuse and conduct through the electrolyte
solution to the positive electrode, where a similar reaction transfers lithium to the positive solid phase.
Lithium is stored inside the positive electrode particles until the cell is later recharged. The lithium-ion
transport phenomena in the porous electrode and active particle material can be described by the charge
and mass conservation laws. Charge conservation governs the electrolyte phase potential and the solid phase
potential, ∅𝑒 and ∅𝑠, while mass conservation governs the electrolyte phase concentration and the solid
phase concentration, 𝐶𝑒 and 𝐶𝑠.
The geometry of a large sized 20 Ah-LiFePO4 battery used to verify the model results is shown in Figure 3
(a) and the actual cell is presented in Figure 3 (b). The current collecting tabs of the prismatic battery cell
are also considered and the dimensions of the battery cell along with tabs also appears in Figure 3 (a). The
studied prismatic cell includes a number of individual cells connected in parallel. Each cell contains a
negative electrode, a separator, and a positive electrode, surrounded on either side by the current collectors.
In the prismatic cell studied in this paper, the negative and positive electrodes active materials are made
from graphite and LiFePO4, respectively. Copper is used as the negative current collector and aluminum as
the positive current collector. This cell includes 48 individual cells, resulting in a 20 Ah nominal capacity.
In order to decrease the material demand and reduce the electrical losses, current collectors are covered by
electrode materials on both sides. Therefore, the number of aluminum current collectors for 48 cells is 24,
while there are 24 copper collectors since copper collectors are on each end of the stack. All the layers are
then enclosed in a separator sheet and a casing covers all.

7
3.2 Governing Equations and Boundary Conditions
In this section, all governing equations for charge conservation in solid phase, charge conservation in
electrolyte phase, lithium conservation in solid phase, lithium conservation in electrolyte phase, and the
Butler-Volmer equation are described with their boundary conditions.
1.2.1. Charge conservation in solid phase
The charge conservation equation in the solid electrode material is governed by Ohm’s law [22, 43]:
∇(𝜎𝑒𝑓𝑓 ∇∅𝑠 ) − 𝑗𝐿𝑖 = 0 (1)
in other words,
𝜕
𝜕𝑥(𝜎𝑒𝑓𝑓
𝜕∅𝑠
𝜕𝑥) = 𝑗𝐿𝑖 (2)
− 𝜎−𝑒𝑓𝑓 (
𝜕∅𝑠
𝜕𝑥)
𝑥=0=
𝐼
𝐴 and + 𝜎+
𝑒𝑓𝑓 (𝜕∅𝑠
𝜕𝑥)
𝑥=𝐿=
𝐼
𝐴 (3)
(𝜕∅𝑠
𝜕𝑥)
𝑥=𝑙𝑛
= 0 and (𝜕∅𝑠
𝜕𝑥)
𝑥=𝑙𝑛+𝑙𝑠
= 0 (4)
where 𝜎𝑒𝑓𝑓 is the effective conductivity of the solid phase. 𝜎+ and 𝜎− are effective electrical conductivity
for the positive and negative electrodes. ∅+ and ∅− are the phase potential positive and negative electrodes.
𝑙𝑛 is the length of the negative electrode, 𝑙𝑠 is the length of the separator, 𝑙𝑝 is the length of the positive
electrode. 𝐿= 𝑙𝑛 + 𝑙𝑠 + 𝑙𝑝 is the overall length.
1.2.2. Charge conservation in electrolyte phase
The charge conservation in the electrolyte solution is expressed as [22, 43]:
∇(𝑘𝑒𝑓𝑓∇∅𝑒) + ∇(𝑘𝐷𝑒𝑓𝑓
∇ ln 𝑐𝑒) + 𝑗𝐿𝑖 = 0 (5)
in other words,
𝜕
𝜕𝑥(𝑘𝑒𝑓𝑓
𝜕∅𝑒
𝜕𝑥) +
𝜕
𝜕𝑥(𝑘𝐷
𝑒𝑓𝑓 𝜕 ln 𝑐𝑒
𝜕𝑥) = − 𝑗𝐿𝑖 (6)
(𝜕∅𝑒
𝜕𝑥)
𝑥=0= 0 and (𝜕∅𝑒
𝜕𝑥)
𝑥=𝐿= 0 (7)

8
where 𝑘𝑒𝑓𝑓 is the effective diffusional conductivity called the Burggeman relation and is given by 𝑘𝑒𝑓𝑓 =
𝑘𝜖𝑒𝛽, where 𝛽 is the Burggeman porosity exponent. 𝑘𝐷
𝑒𝑓𝑓 is the effective ionic conductivity, given by:
𝑘𝐷𝑒𝑓𝑓 =
2𝑅𝑇𝑘𝑒𝑓𝑓
𝐹 (𝑡+
0 − 1) (1 +𝑑 ln 𝑓±
𝑑 ln 𝐶𝑒) (8)
where 𝑓± is the molecular activity coefficient of the electrolyte, also called the electrolyte activity
coefficient. 𝜖𝑒 is the volume fraction of the electrolyte phase in the electrode, 𝑅 is the universal gas constant
with a value of 8.3143 kJ/kg mole. K. 𝐹 is the Faraday’s constant and its value is 96485 Columb/mole. 𝑡+0
is the transfer number of lithium-ion. 𝐶𝑒 is the concentration of lithium in the electrolyte phase.
1.2.3. Lithium conservation in solid phase
The material balance for lithium-ions in an active solid material particle is governed by Fick’s second law
in spherical coordinate [22, 44]:
𝜕𝐶𝑠
𝜕𝑡−
𝐷𝑠
𝑟2
𝜕
𝜕𝑟(𝑟2
𝜕𝐶𝑠
𝜕𝑟) = 0 (9)
with boundary conditions’
𝐷𝑠 (𝜕𝐶𝑠
𝜕𝑟)
𝑟=0= 0 and −𝐷𝑠 (
𝜕𝐶𝑠
𝜕𝑟)
𝑟=𝑅𝑠
=𝑗𝐿𝑖
𝑎𝑠𝐹 (10)
where 𝐶𝑠 is the concentration of lithium in solid phase. 𝐷𝑠 is the mass diffusion coefficient of lithium-ion
in the electrolyte, 𝑟 is the radial coordinate along the active material particle, 𝑅𝑠 is the radius of the solid
active material particle, 𝑗𝐿𝑖 is the transfer current resulting from Lithium insertion/de-insertion at the
electrode/electrolyte interface, which consumes/generates the species Li+,
𝑗𝐿𝑖 = 𝑎𝑠𝑖𝑜 {
𝑎𝑠,𝑎 𝑖𝑛,𝑎
0𝑎𝑠,𝑐 𝑖𝑛,𝑐
in the anode, separator and cathode (11)
1.2.4. Lithium conservation in electrolyte phase
The lithium-ion balance in the liquid phase is described as follows [22]:
𝜕(𝜖𝑒 𝑐𝑒)𝐶𝑠
𝜕𝑡− ∇(𝐷𝑒
𝑒𝑓𝑓∇ 𝑐𝑒) −1 − 𝑡+
0
𝐹𝑗𝐿𝑖 +
𝑖𝑒 ∇𝑡+
𝐹 = 0 (12)

9
in other words,
𝜕(𝜖𝑒 𝑐𝑒)𝐶𝑠
𝜕𝑡=
𝜕
𝜕𝑥(𝐷𝑒
𝑒𝑓𝑓 𝜕𝐶𝑒
𝜕𝑥) +
1 − 𝑡+0
𝐹𝑗𝐿𝑖 +
𝑖𝑒 ∇𝑡+
𝐹 (13)
(𝜕𝐶𝑒
𝜕𝑥)
𝑥=0= 0 and (𝜕𝐶𝑒
𝜕𝑥)
𝑥=𝐿= 0 (14)
where 𝜖𝑒 is the volume fraction/porosity of the electrolyte, 𝐷𝑒𝑒𝑓𝑓 is the effective diffusion coefficient
(Burggeman relation,𝐷𝑒𝑒𝑓𝑓 = 𝐷𝑒𝜖𝑒
𝛽), 𝑡+0 is the transfer number of Li+ with respect to the velocity of the
solvent (a function of electrolyte concentration, if assuming constant,𝑖𝑒 ∇𝑡+
𝐹 = 0). Also, 𝜖𝑠 is the volume
fraction of solid particle (active material) in the electrode. 𝜖𝑓 is the volume fraction of filler material in the
electrode.
1.2.5. Electrochemical Kinetics: Reaction Rate (Butler-Volmer Equation)
The electrochemical reaction rate on the surface of electrode particles is usually governed by the Butler-
Volmer equation [33, 35, 45]; i.e the Butler-Volmer equation is used to couple a charge-species governing
equation and is given by:
𝑗𝐿𝑖 = 𝑎𝑠𝑖𝑜 {exp [∝𝑎 𝐹
𝑅 𝑇 𝜂] − exp [
∝𝑐 𝐹
𝑅 𝑇 𝜂]} (15)
where the local surface over potential is given by [46]:
𝜂 = ∅𝑠 − ∅𝑒 − 𝑈 (16)
and the exchange current density is given by [43]:
𝑖0 = 𝑘𝑚(𝐶𝑒)∝𝑎(𝐶𝑠,𝑚𝑎𝑥 − 𝐶𝑠,𝑒)∝𝑎(𝐶𝑠,𝑒)∝𝑐 (17)
where 𝑎𝑠 is the active surface area per electrode unit volume for electron transfer reactions (1/cm), 𝑖0 is the
exchange current density (a function of lithium concentrations in both electrolyte and solid active
materials), ∝𝑎 is the transfer coefficient of the anode, T is the temperature (K), 𝜂 is the over potential (V),
∝𝑐 is the transfer coefficient of the cathode, U is thermodynamics OCV, 𝐶𝑠,𝑚𝑎𝑥 is the maximum
concentration of lithium in solid phase and 𝐶𝑠,𝑒 is the concentration of lithium at the surface of solid
particles, and ∅𝑠 and ∅𝑒 are the phase potential for solid and electrolyte phase.
For coupling the model, temperature dependent physicochemical properties, such as diffusion coefficient
(𝐷𝑠) and ionic conductivity of an electrolyte (𝑘) are needed and dependence can be generally described by
Arrhenius Equation [43]:

10
𝐷𝑠 = 𝐷𝑠,𝑟𝑒𝑓 exp [−𝐸𝑑
𝑅 (1𝑇
−1
𝑇𝑟𝑒𝑓)
] (18)
𝑘𝑚 = 𝑘𝑚,𝑟𝑒𝑓 exp [−𝐸𝑟
𝑅 (1𝑇 −
1𝑇𝑟𝑒𝑓
)] (19)
also diffusion coefficient in electrolyte phase, 𝐷𝑒, is given by:
𝐷𝑒𝑒𝑓𝑓 = 𝐷𝑒𝜖𝑒
𝛽 (20)
𝑎𝑠 = 3 𝜖𝑠
𝑟𝑠 (21)
where 𝑎𝑠 is the solid/electrolyte interfacial area per unit volume, 𝐷𝑠 is the diffusion coefficient in solid
phase, 𝐷𝑠,𝑟𝑒𝑓 is the reference solid diffusion coefficient, 𝑘𝑚,𝑟𝑒𝑓 is the reference reaction rate coefficient, 𝐷𝑒
is the diffusion coefficient in the electrolyte phase, 𝐸𝑑 is the activation energy that controls temperature
sensitivity of Ds, 𝐸𝑟 is the activation energy that controls the temperature sensitivity of 𝑘𝑚, and 𝑇𝑟𝑒𝑓 is the
reference temperature = 298 K.
1.2.6. Energy Equation
The energy balance equation is given by [22]:
∇2𝑇 +�̇�
𝑘=
1
𝛼
𝜕𝑇
𝜕𝑡 (22)
in other words,
𝜕2𝑇
𝜕𝑥2+
𝜕2𝑇
𝜕𝑦2+
𝜕2𝑇
𝜕𝑧2+
�̇�
𝑘=
1
𝛼
𝜕𝑇
𝜕𝑡 (23)
The above equation is further modified to
�̇� = 𝜕(𝜌𝑐𝑝𝑇)
𝜕𝑡− ∇ (𝑘 ∇𝑇) (24)
also,
∇ (𝜎+∇∅+) = - 𝑗 (25)

11
∇ (𝜎−∇∅−) = + 𝑗 (26)
�̇� = (𝜎+ ∇2∅+
) + (𝜎− ∇2∅−
) + �̇�𝐸𝐶𝐻 (27)
where �̇�𝐸𝐶𝐻 is the electro chemical heat and is given by [22]:
�̇�𝐸𝐶𝐻 =
𝑖𝑝(∅+ − ∅−) + (𝜎− ∇2∅−
) + ∫ 𝑗𝐿𝑖 (𝑇𝑟𝑒𝑓𝜕𝑈𝜕𝑡
− 𝑈𝑟𝑒𝑓)𝐿
0𝑑𝑥
𝐿 (28)
also,
𝑖𝑝 = ∫ 𝑗𝐿𝑖𝑙𝑝
0
𝑑𝑥 (29)
𝑗 = − 𝑎 𝑖𝑝 (30)
where �̇� is the heat generation rate during battery operation which includes joule heating, electrochemical
reaction heating and entropic heating, 𝜌 is the density, 𝑐𝑝 is the specific heat. The parameters used for the
modeling are shown in Table 3. The material properties are also presented in Table 4. These properties are
used in the simulation.
4. Results and Discussion
Figure 4 shows the validation of experimental and simulated temperature field results at 2C, 3C, and 4C
discharge rates. The operating condition for the battery under different C-rates (2C, 3C, and 4C) is at an
initial temperature of 22°C. As shown in Figure 4, the average surface temperature increases by 14°C, 24°C,
and 36°C above the ambient temperature for the discharge rates of 2C, 3C, and 4C, respectively. It can also
be seen that the surface temperature increases faster at a higher discharge rate. The variation of temperature
profile with discharge time may be due to the internal heat generation. The advantage of the MSMD
numerical model is its relatively high calculation speed, which ranges in order of minutes, with relatively
high accuracy results. The quality of the computational mesh has a higher influence on the actual
computational time. The simulation can give more accurate results if the computational mesh is finer and
better quality.
Figure 5 (a and b) shows a comparison of the temperature contour of a battery at 4C discharge rate with IR
image and simulation by the numerical model, as created with ANSYS Fluent software. It can be seen that,
with simulation, the temperature at the end of the discharge rate is 69°C while with the IR image the

12
temperature is 70°C, which is very close. It was also noted that the highest temperature distribution was
observed near the tabs (positive and negative electrode) as compared to the middle and the end on the
principle surface of the battery along the height of the battery. The lowest spread in temperature is observed
at the end on the surface of the battery along the height of the battery.
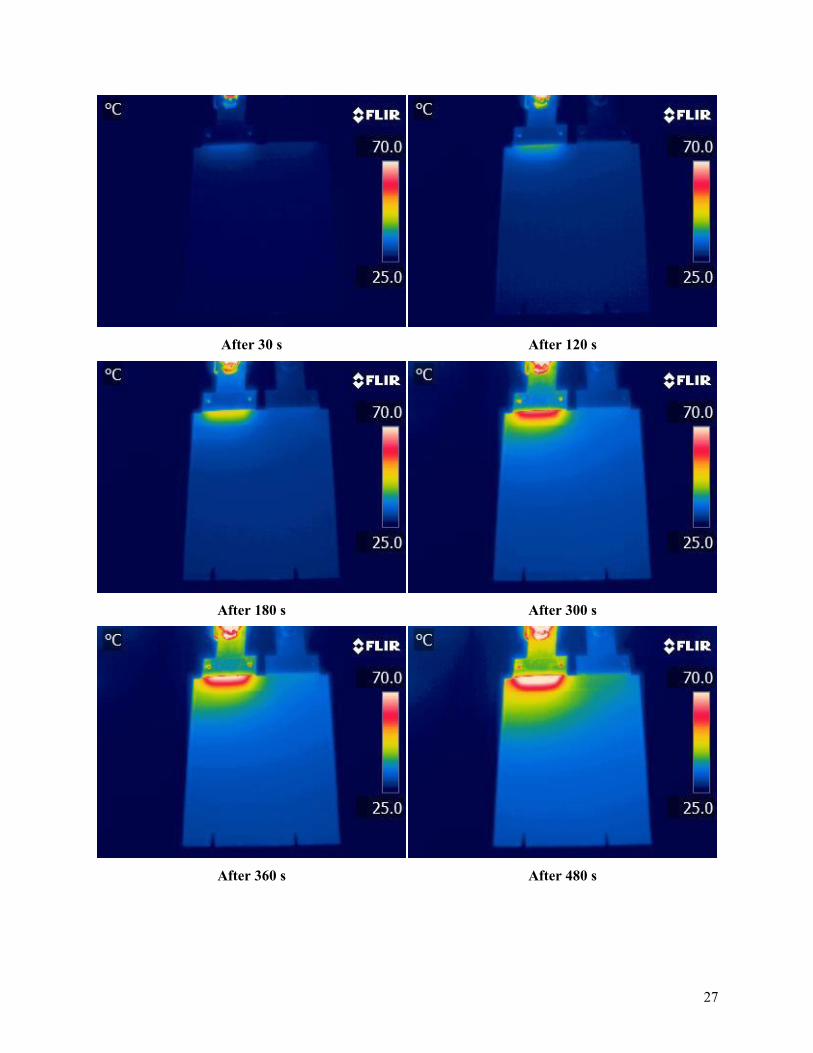
Figure 6 shows a series of IR images during 4C discharge. In all images the brightest white part is the area
where the highest temperature distribution was observed and subsequently the heat generation was also
higher. This series of images are purposefully introduced in this paper to see the surface temperature
contours of battery between beginnings of the discharge to the end of the discharge. It was also found that
after 540s the battery surface temperature increased faster and it became highest at 900s. After that the
charging cycle started and the battery surface temperature decreased and it became the lowest at an around
1740s. Here, in this experiments, the charging was done at constant current-constant voltage (CC-CV) and
discharging was done at constant current (CC). There was no resting period during discharging and
charging.
5. Conclusions
This paper has presented a comparative study of the temperature distributions on a large sized 20Ah-
LiFePO4 prismatic battery cell using both experimentally and theoretically (through simulation methods by
using electrochemical thermal approach) at 2C, 3C, and 4C discharge rates. Some closing remarks are then
stated as follows: (i) the temperature distributions on the surface of the battery increase as the C-rates
increase; (ii) the thermocouple sensors closest to the electrodes provide higher temperatures than the
centerline-thermocouple sensors; (iii) the tab temperatures are always higher as compared to the surface
temperatures; and (iv) the positive current collector temperature is always higher than the negative current
collector for all the discharge rates. In addition, an experimental study was conducted using an IR camera
to capture IR images at various discharge rates, and temperature non-uniformity was visually observed. The
temperature non-uniformity was an indication of the non-uniformity in the heat generation on a surface of
the battery and as such it was concluded that the area of highest temperature and non-uniformity is the
location where the heat generation is highest. These results can provide physical insights for the design and
thermal optimization of batteries.
Nomenclature
𝑎𝑠 : solid/electrolyte interfacial area per unit volume or active surface area per electrode
unit volume for electron transfer reactions [1/cm]
A : area [m2]

13
𝑐𝑝 : specific heat capacity [J/kg°C]
𝐶𝑝,𝑝 : specific heat for positive tab [J/kg-K]
𝐶𝑝,𝑛 : specific heat for negative tab [J/kg-K]
𝐶𝑝,𝑎 : specific heat for active zone [J/kg-K]
𝐶𝑒 : concentration of lithium in electrolyte phase [mol/m3]
𝐶𝑠 : concentration of lithium in solid phase [mol/m3]
𝐶𝑠,𝑝,𝑚𝑎𝑥 : maximum solid Li+ Concentration for positive electrode [mol/m3]
𝐶𝑠,𝑛,𝑚𝑎𝑥 : maximum solid Li+ Concentration for negative electrode [mol/m3]
𝐷𝑠 : mass diffusion coefficient of lithium-ion in electrolyte
𝐷𝑠,𝑝 : reference diffusivity for positive electrode [m2/s]
𝐷𝑠,𝑛 : reference diffusivity for negative electrode [m2/s]
𝐷𝑠,𝑟𝑒𝑓 : reference solid diffusion coefficient
𝐷𝑒𝑒𝑓𝑓 : effective diffusion coefficient
𝐸𝑑 : activation energy that controls temperature sensitivity of Ds [kJ/mol]
Er : activation energy that controls temperature sensitivity of 𝑘𝑚 [kJ/mol]
𝑓± : molecular activity coefficient of the electrolyte also called electrolyte activity
coefficient
F : Faraday`s constant [96485 Columb/mol]
𝑖0 : exchange current density [A/m2]
I : current [A]
𝑗𝐿𝑖 : transfer current resulting from lithium insertion/de-insertion at the
electrode/electrolyte interface [A/m2]
𝑘 : ionic conductivity of electrolyte [S/m]
𝑘𝑝 : reference rate constant for positive electrode [mol/m2s/(mol/m3)1.5]
𝑘𝑛 : reference rate constant for negative electrode [mol/m2s/(mol/m3)1.5]
𝑘𝑚,𝑟𝑒𝑓 : reference reaction rate coefficient
𝑘𝑒𝑓𝑓 : effective diffusional conductivity [S/m]
𝑘𝐷𝑒𝑓𝑓 : effective ionic conductivity [S/m]
𝑙𝑛 : length of negative electrode [µm]
𝑙𝑠 : length of separator [µm]
𝑙𝑝 : length of the positive electrode [µm]
𝐿 : overall length (𝐿 = 𝑙𝑛 + 𝑙𝑠 + 𝑙𝑝) in [µm]

14
n : number of electrons
�̇� : heat generation rate [W]
𝑟 : radial coordinate along active material particle
R : resistance [Ω]
𝑅 : universal gas constant [8.3143 kJ/kg mole. K]
𝑅𝑠 : radius of solid active material particle [µm]
𝑅𝑠,𝑝 : particle radius for positive electrode [µm]
𝑅𝑠,𝑛 : particle radius for negative electrode [µm]
T : temperature [°C or K]
𝑡+0 : transfer number of lithium-ion
t : time [s]
U : electrode potential of the reaction or thermodynamic open circuit potential [V]
V : cell voltage or cell potential [V]
Greek Symbols
α : thermal diffusivity [m2/s]
𝜑 : energy dissipation rate
β : Burggeman porosity exponent
𝜌 : density [kg/m³]
𝛻 : gradient operator
∅𝑠 : solid phase potential [V]
∅𝑒 : electrolyte phase potential [V]
𝜎𝑒𝑓𝑓 : effective conductivity [S/m]
𝜎+ : effective electrical conductivity for positive electrode [S/m]
𝜎− : effective electrical conductivity for negative electrode [S/m]
𝜖𝑒 : volume fraction of electrolyte phase in electrode
𝜖𝑠 : volume fraction of solid particle (active material) in electrode
𝜖𝑓 : volume fraction of filler material in electrode
∝𝑎 : transfer coefficient of anode
∝𝑐 : transfer coefficient of the cathode
Subscripts
∞ : ambient

15
0 : initial
a : anode
c : cathode
e : electrolyte
f : filler
exp : experimental
n : negative electrode
oc : open circuit
p : positive electrode
ref : reference
s : separator
sim : simulated
tot : total
x,y,z : Cartesian coordinate directions
Subscripts
° : degree
Li : lithium
𝑒𝑓𝑓 : effective
ECH : Electrochemical heat
Acronyms
ANSYS Inc. American Computer-aided engineering software developer
BC Boundary condition
BEV Battery electric vehicle
BTMS Battery thermal management system
C Capacity
CFD Computational fluid dynamics
DOD Depth of discharge
ECT Electrochemical thermal
ECM Equivalent circuit-based modeling
EV Electric vehicle
FCV Fuel cell vehicle
FEA Finite element analysis

16
FEM Finite element method
FUDS Federal urban drive cycle
FORTRAN derived from "Formula Translation"
HEV Hybrid electric vehicle
HWFET Highway fuel economy cycle
IR Infra-red
Li-ion Lithium ion
LiFePO4 Lithium iron phosphate
LCM lumped capacitance model
LFP Lithium phosphate
LPM Lumped parameter model
LPV Linear parameter varying
LabVIEW Laboratory virtual instrument engineering workbench
MSMD Multi scale multi domain
NiMH Nickel metal hydride
OCV/OCP Open circuit voltage/Open circuit potential
PC Personal computer
P2D Pseudo two dimensional
PDE Partial differential equation
PHEV Plug-in hybrid electric vehicle
SOC State of charge
SEM Scanning electron microscope
TC Thermocouple
US06 United states of America 06 drive cycle
UDDS Urban dynamometer driving schedule
1D one-dimensional
2D two-dimensional
3D three-dimensional
References
[1] Q. Wang, Q. Sun, P. Ping, X. Zhao, J. Sun and Z. Lin, "Heat transfer in the dynamic cycling of lithium–titanate batteries," International Journal of Heat and Mass Transfer, no. 93, pp. 896-905, 2016.

17
[2] Z. Ling, F. Wang, X. Fang, X. Gao and Z. Zhang, "A hybrid thermal management system for lithium ion batteries combining phase change materials with forced-air cooling," Applied Energy, no. 148, pp. 403-409, 2015.
[3] H. Ge, J. Huang, J. Zhang and Z. Li, "Temperature-Adaptive Alternating Current Preheating of Lithium-Ion Batteries with Lithium Deposition Prevention," Journal of The Electrochemical Society, vol. 163, no. 2, pp. A290-A299, 2016.
[4] A. Ritchie and W. Howard, "Recent developments and likely advances in lithium-ion batteries," Journal of Power Sources, vol. 162, pp. 809-812, 2006.
[5] Y. Ye, L. H. Saw, Y. Shi and A. A. Tay, "Numerical analyses on optimizing a heat pipe thermal management system for lithium-ion batteries during fast charging," Applied Thermal Engineering, vol. 86, pp. 281-291, 2015.
[6] M. J. Isaacson, R. P. Hollandsworth, P. J. Giampaoli, F. A. Linkowsky, A. Salim and V. L. Teofilo, "Advanced Lithium-ion battery charger," Battery conference on Applications and Advances, pp. 193-198, 2000.
[7] J. McDowall, P. Biensan and M. Broussely, "Industrial Lithium-ion battery safety-What are the tradeoffs?," in Telecommunications Energy Conference, 2007.
[8] Y. Xing, Q. Miao, K.-L. Tsui and M. Pecht, "Prognostics and health monitoring for lithium-ion battery," in IEEE International Conference on, 2011.
[9] X. Feng, M. Fang, X. He, M. Ouyang, L. Lu, H. Wang and M. Zhang, "Thermal runaway features of large format prismatic lithium ion battery using extended volume accelerating rate calorimetry," Journal of Power Sources, pp. 255 : 294-301, 2014.
[10] L. Lu, X. Han, J. Hua, M. Ouyang and J. Li, "A review on the key issues for lithium-ion battery management in electric vehicles," Journal of Power Sources, pp. 226:272-288, 2013.
[11] S. Panchal, I. Dincer, M. Agelin-Chaab, M. Fowler and R. Fraser, "Uneven temperature and voltage distributions due to rapid discharge rates and different boundary conditions for series-connected LiFePO 4 batteries," International Communications in Heat and Mass Transfer, vol. 81, pp. 210-217, 2017.
[12] S. Panchal, I. Dincer, M. Agelin-Chaab, R. Fraser and M. Fowler, "Experimental and simulated temperature variations in a LiFePO 4-20Ah battery during discharge process," Applied Energy, vol. 180, pp. 504-515, 2016.
[13] S. Panchal, I. Dincer, M. Agelin-Chaab, R. Fraser and M. Fowler, "Experimental and theoretical investigation of temperature distributions in a prismatic lithium-ion battery," International Journal of Thermal Sciences, no. 99, pp. 204-212, 2015.

18
[14] S. Panchal, I. Dincer, M. Agelin-Chaab, R. Fraser and M. Fowler, "Thermal modeling and validation of temperature distributions in a prismatic lithium-ion battery at different discharge rates and varying boundary conditions," Applied Thermal Engineering, 2015.
[15] S. Panchal, I. Dincer, M. Agelin-Chaab, R. Fraser and M. Fowler, "Experimental and theoretical investigations of heat generation rates for a water cooled LiFePO4 battery," International Journal of Heat and Mass Transfer, vol. 101, pp. 1093-1102, 2016.
[16] A. Pruteanu, B. V. Florean, G. Maria Moraru and R. C. Ciobanu, "Development of a thermal simulation and testing model for a superior lithium-ion-polymer battery," in Optimization of Electrical and Electronic Equipment (OPTIM), IEEE, pages 947–952, 2012.
[17] J. Yi, U. S. Kim, C. B. Shin, T. Han and S. Park, "Three-dimensional thermal modeling of a lithium-ion battery considering the combined effects of the electrical and thermal contact resistances between current collecting tab and lead wire," Journal of the Electrochemical Society, vol. 160, no. 3, pp. 437-443, 2013.
[18] C. Alaoui, "Solid-State Thermal Management for Lithium-Ion EV Batteries," Vehicular Technology, IEEE Transactions on, vol. 62, no. 1, pp. 98-107, 2013.
[19] X. Hu, S. Asgari, S. Lin, S. Stanton and W. Lian, "A linear parameter-varying model for HEV/EV battery thermal modeling," in Energy Conversion Congress and Exposition (ECCE), IEEE, pages 1643-1649, 2012.
[20] A. Smyshlyaev, M. Krstic, N. Chaturvedi, J. Ahmed and A. Kojic, "PDE model for thermal dynamics of a large," in American Control Conference (ACC), IEEE, pages 959-964, 2011.
[21] A. Samba, N. Omar, H. Gualous, Y. Firouz, P. V. d. Bossche, J. V. Mierlo and T. I. Boubekeur, "Development of an Advanced Two-Dimensional Thermal Model for Large size Lithium-ion Pouch Cells," Electrochimica Acta, vol. 117, pp. 246-254, 2014.
[22] G. Li and S. Li, "Physics-Based CFD Simulation of Lithium-ion Battery under the FUDS Driving Cycle," ECS Transactions, vol. 64, no. 33, pp. 1-14, 2015.
[23] P. Vyroubal, T. Kazda, J. Maxa and J. Vondrák, "Analysis of Temperature Field in Lithium Ion Battery by discharging," ECS Transactions, vol. 70, no. 1, pp. 269-273, 2015.
[24] C. H. Wang, T. Lin, J. T. Huang and Z. H. Rao, "Temperature response of a high power lithium-ion battery subjected to high current discharge," Materials Research Innovations, vol. 19, pp. 156-160, 2015.
[25] L. W. Jin, P. S. Lee, X. X. Kong, Y. Fan and S. K. Chou, "Ultra-thin minichannel LCP for EV battery thermal management," Applied Energy, vol. 113, pp. 1786-1794, 2014.

19
[26] K. Yeow, M. Thelliez, H. Teng and E. Tan, "Thermal Analysis of a Li-ion Battery System with Indirect Liquid Cooling Using Finite Element Analysis Approach," SAE International Journal, vol. 1, no. 1, pp. 65-78, 2012.
[27] J. Newman and W. Tiedemann, "Porous-Electrode Theory with Battery Application," AIChE, vol. 21, pp. 25-41, 1975.
[28] T. F. Fuller, M. Doyle and J. Newman, "Simulation and Optimization of the Dual Lithium Ion Insertation Cell," Journal of Electrochemical Society, vol. 141, pp. 1-10, 1994.
[29] C. Y. Wang, W. B. Gu and B. Y. Liaw, "Micro-Macroscopic Coupld Modeling of Batteries and Fuel Cells: Part II: Applications to Ni-Cd and Ni-MH Cells," Journal of Electrochemical Society, vol. 145, pp. 3418-3427, 1998.
[30] W. B. Gu and C. Y. Wang, "Thermal and Electrochemical Coupled Modeling of a Lithium-Ion Cell," Journal of Electrochemical Society, vol. 99, pp. 748-762, 2000.
[31] M. M. Majdabadi, S. Farhad, M. Farkhondeh, R. Fraser and M. Fowler, "Simplified electrochemical multi-particle model for LiFePO4 cathodes in lithium-ion batteries," Journal of Power Sources, vol. 275, no. 1, pp. 633-543, 2015.
[32] M. Mastali , E. Foreman, M. A, S. Farhad, R. Fraser and M. Fowler, "Electrochemical-Thermal Modeling of a Commercial Graphite/LiFePO4 Prismatic Cell," Journal of Power Sources, 2016.
[33] M. Xu, Z. Zhang, X. Wang, L. Jia and L. Yang, "A pseudo three-dimensional electrochemicalethermal model of a prismatic LiFePO4 battery during discharge process," Energy, vol. 80, pp. 303-317, 2015.
[34] N. Yang, X. Zhang, B. Shang and G. Li, "Unbalanced discharging and aging due to temperature differences among the cells in a lithium-ion battery pack with parallel combination," Journal of Power Sources, vol. 306, pp. 733-741, 2016.
[35] W. Huo, H. He and F. Sun, "Electrochemical–thermal modeling for a ternary lithium ion battery during discharging and driving cycle testing," RSC Advances, vol. 71, no. 5, pp. 57599-57607, 2015.
[36] Y. Lai, S. Du, L. Ai, A. Lihua, Y. Cheng, Y. Tang and J. Ming, "Insight into heat generation of lithium ion batteries based on the electrochemical-thermal model at high discharge rates," International Journal of Hydrogen Energy, vol. 40, pp. 3039-3049, 2015.
[37] C. Lin, S. Xu, Z. Li, B. Li, G. Chang and J. Liu, "Thermal analysis of large-capacity LiFePO4 power batteries for electric vehicles," Journal of Power Sources, vol. 294, pp. 633-642, 2015.

20
[38] M. Streza, C. Nuţ, C. Tudoran, V. Bunea, A. Calborean and C. Morari, "Distribution of current in the electrodes of lead-acid batteries: a thermographic analysis approach," Journal of Physics D : Applied Physics, vol. 49, no. 5, pp. 55503-55510, 2016.
[39] S. J. Bazinski and X. Wang, "Predicting heat generation in a lithium-ion pouch cell through thermography and the lumped capacitance model," Journal of Power Sources, vol. 305, pp. 97-105, 2016.
[40] M. Doyle, T. F. Fuller and J. Newman, "Modeling of Galvanostatic Charge and Discharge of the Lithium/Polymer/Insertion Cell," Journal of The Electrochemical Society, vol. 140, no. 6, pp. 1526-1533, 1993.
[41] L. Cai and R. E. White, "Mathematical modeling of a lithium ion battery with thermal effects in COMSOL Inc. Multiphysics (MP) software," Journal of Power Sources, vol. 196, no. 14, pp. 5985-5989, 2011.
[42] M. Farkhondeh, M. Safari, M. Pritzker, M. Fowler, T. Han, J. Wang and C. Delacourt, "Full-Range Simulation of a Commercial LiFePO4 Electrode Accounting for Bulk and Surface Effects: A Comparative Analysis," Journal of The Electrochemical Society, vol. 161, no. 3, pp. A201-A212, 2014.
[43] A. Inc., "ANSYS Fluent Advanced Add-On Modules," ANSYS, Inc., November 2013. [Online]. Available: http://www.ansys.com. [Accessed November 2013].
[44] N. Yang, X. Zhang, G. Li and D. Hua, "Assessment of the forced air-cooling performance for cylindrical lithium-ion battery packs: A comparative analysis between aligned and staggered cell arrangements," Applied Thermal Engineering, vol. 80, pp. 55-65, 2015.
[45] A. Fotouhi, D. J. Auger, K. Propp, S. Longo and M. Wild, "A review on electric vehicle battery modelling : From Lithium-ion toward Lithium–Sulphur," Renewable and Sustainable Energy Reviews, vol. 56, pp. 1008-1021, 2016.
[46] Y. Huo, Z. Rao, X. Liu and J. Zhao, "Investigation of power battery thermal management by using mini-channel cold plate," Energy Conversion and Management, vol. 89, pp. 387-395, 2015.
[47] W. Fang, O. J. Kwon and C.-Y. Wang, "Electrochemical–thermal modeling of automotive Li-ion batteries and experimental validation using a three-electrode cell," International Journal of Energy Research, vol. 34, no. 2, pp. 107-115, 2009.
[48] M. M. Majdabadi Kohneh, E. Samadani, S. Farhad, R. Fraser and M. Fowler, "Three-Dimensional Electrochemical Analysis of a Graphite/LiFePO4 Li-Ion Cell to Improve Its Durability," SAE International, 2015.

21
[49] W. Zhao, G. Luo and C.-Y. Wang, "Modeling Nail Penetration Process in Large-Format Li-Ion Cells," Journal of The Electrochemical Society, vol. 162, no. 1, pp. A207-A217, 2015.
[50] K. Smith and C.-Y. Wang, "Power and thermal characterization of a lithium-ion battery pack for hybrid-electric vehicles," Journal of Power Sources, vol. 160, no. 1, pp. 662-673, 2006.
List of Table Captions
Table 1: LiFePO4- 20Ah Lithium-ion pouch cell specifications
Table 2: Experimental plan
Table 3: Parameters used in the 2D Model
Table 4: Material Properties used in the simulation
List of Figure Captions
Figure 1: Experimental set-up during a) battery testing and b) IR imaging
Figure 2: Schematic diagram of lithium-ion battery cell configuration for the pseudo-two dimensional
multi-particle model
Figure 3: Lithium-ion prismatic cell geometry for ECT model
Figure 4: Validation of experimental and simulated results at 2C, 3C, and 4C discharge rate
Figure 5: Comparison of temperature contour of battery at 4C discharge rate (simulated and real image)
Figure 6: Series of IR images during 4C discharge
22
Tables Table 1 : LiFePO4- 20Ah Lithium-ion pouch cell specifications
Specifications Value Cathode Material LiFePO4 Anode Material Graphite Electrolyte Carbonate based Nominal Capacity 20.0 Ah Nominal Voltage 3.3 V Dimensions 7.25 mm x 160 mm x 227 mm
Table 2 : Experimental plan
Charge/Discharge Rate Constant Current 1C 20 A 2C 40 A 3C 60 A 4C 80 A
Table 3 : Parameters used in the 2D Model [22, 31, 47, 33, 48, 34, 49, 50]
Parameter Notation Value Unit Thickness of +ve electrode 𝑙𝑝 183 µm Thickness of separator 𝑙𝑠 52 µm Thickness of -ve electrode 𝑙𝑛 100 µm Particle radius for +ve electrode 𝑅𝑠,𝑝 1.6e-05/2 µm Particle radius for -ve electrode 𝑅𝑠,𝑛 2.5e-05/2 µm Maximum solid Li+ Concentration for +ve electrode
𝐶𝑠,𝑝,𝑚𝑎𝑥 22806 mol/m3
Maximum solid Li+ Concentration for -ve electrode
𝐶𝑠,𝑛,𝑚𝑎𝑥 31370 mol/m3
Initial solid Li+ concentration for +ve electrode
𝐶𝑠,𝑝,0 3886.2 mol/m3
Initial solid Li+ concentration for -ve electrode
𝐶𝑠,𝑛,0 14870.76 mol/m3
Initial electrolyte Li+ concentration for +ve electrode 𝐶𝑜 2000 mol/m3
Initial electrolyte Li+ concentration for -ve electrode 𝐶𝑜 2000 mol/m3
Initial electrolyte Li+ concentration for separator 𝐶𝑜 2000 mol/m3
Volume fraction for +ve electrode 𝜖𝑝 0.444 - Volume fraction for -ve electrode 𝜖𝑛 0.357 - Volume fraction for separator 𝜖𝑠 1 -

23
Filler fraction for +ve electrode 𝜖𝑓,𝑝 0.259 - Filler fraction for -ve electrode 𝜖𝑓,𝑛 0.172 - Reference diffusivity for +ve electrode 𝐷𝑠,𝑝 1e-13 m2/s Reference diffusivity for -ve electrode 𝐷𝑠,𝑛 3.9e-14 m2/s Activation energy for +ve electrode 𝐸𝑑,𝑝 8.6e4 Activation energy for -ve electrode 𝐸𝑑,𝑛 2e4 Conductivity for +ve electrode 𝜎𝑝 3.8 S/m Conductivity for -ve electrode 𝜎𝑛 100 S/m Reference rate constant for +ve electrode
𝑘𝑝 2.072818e-11 mol/m2s/(mol/m3)1.5
Reference rate constant for -ve electrode 𝑘𝑛 2.072818e-11 mol/m2s/(mol/m3)1.5 Activation energy for +ve electrode 𝐸𝑟,𝑝 9e3 Activation energy for -ve electrode 𝐸𝑟,𝑛 2e4 Electrolyte diffusivity for +ve electrode 𝐷𝑒 7.5e-11 m2/s 𝑡+ factor for +ve electrode 𝑡+ 0.363 - Nominal capacity of cell C 20 Ah Minimum stop voltage 𝑉𝑚𝑖𝑛 2.0 V Maximum stop voltage 𝑉𝑚𝑎𝑥 4.1 V Reference temperature 𝑇𝑟𝑒𝑓 298 K Universal gas constant 𝑅 8.3143 kJ/kg mole K Faraday’s constant 𝐹 96485 Columb/mole
Table 4 : Material Properties used in the simulation [22, 31, 49]
Property Symbol Value Unit Density for positive tab 𝜌𝑝 2719 kg/m3 Density for negative tab 𝜌𝑛 8978 kg/m3 Density for active zone 𝜌𝑎 2092 kg/m3 Specific heat for positive tab 𝐶𝑝,𝑝 871 J/kg-K Specific heat for negative tab 𝐶𝑝,𝑛 381 J/kg-K Specific heat for active zone 𝐶𝑝,𝑎 678 J/kg-K Thermal conductivity for positive tab 𝐾𝑝 202 W/m-K Thermal conductivity for negative tab 𝐾𝑛 387.6 W/m-K Thermal conductivity for active zone 𝐾𝑎 18.2 W/m-K

24
Figures
a) Battery testing b) IR imaging
Figure 1 : Experimental set-up during a) battery testing and b) IR imaging
Negative Electrode Separator Positive Electrode
Positive Current
Collector
Negative Current
Collector
𝐿𝑖+
𝐿𝑖+
𝐿𝑖+
𝐿𝑖+
II
Ionic Current
Electrical Current
𝑙𝑐 𝑙𝑛 𝑙𝑠 𝑙𝑝 𝑙𝑐
𝐿 = 𝑙𝑛 + 𝑙𝑠 + 𝑙𝑝
𝐿𝑖+
r r
𝐶𝑠(𝑟) 𝐶𝑠(𝑟)
Dchg
𝑒− 𝑒−
Figure 2 : Schematic diagram of lithium-ion battery cell configuration for the pseudo-two
dimensional multi-particle model (modified from [33])

25
+-
22
.7 cm
16 cm
4.6 cm 4.6 cm
3.2 cm1.8 cm
1.8 cm
2.7
mm
a) Battery cell geometry b) Picture of battery cell
Figure 3 : Lithium-ion prismatic cell geometry for ECT model
Figure 4 : Validation of experimental and simulated results at 2C, 3C, and 4C discharge rate

26
(a) Simulated result at 4C discharge rate
(b) IR imaging result at 4C discharge rate
Figure 5 : Comparison of temperature contour of battery at 4C discharge rate (simulated and real image)
27
After 30 s After 120 s
After 180 s After 300 s
After 360 s After 480 s

28
After 540 s After 660 s
After 720 s After 840 s
After 900 s After 1020 s

29
After 1080 s After 1140 s
After 1200 s After 1260 s
After 1320 s After 1380 s

30
After 1440 s After 1500 s
After 1560 s After 1620 s
After 1680 s After 1740 s
Figure 6 : Series of IR images during 4C discharge