transforming meaningful use into meaningful care...
TRANSCRIPT

Transforming Meaningful Use into Meaningful Care in the Outpatient Setting
Transforming Meaningful Use into Meaningful Care in the Outpatient Setting
Jennifer Lord ‐ Meaningful Use Project Manager
Robb Malone, PharmD, CPP – VP Practice Quality & Innovation
Nelson Nauss – Health IT Project Manager
Donald Spencer, MD – ACMIO, Medical Dir, VP Ambulatory Care
Jonathan Thornhill –Manager Practice Quality & Innovation
The Practice Quality & Innovation (PQI) Project Team
IHI 13thAnnual Summit on Improving Patient Care in the
Office Practice & the Community
March 19, 2012Washington, DC

Presenter DisclosurePresenter Disclosure
The accreditation board requires each presenter to list a disclosure statement at the beginning of their presentation.
Jennifer Lord does not have anything to disclose.
Robb Malone does not have anything to disclose.
Nelson Nauss does not have anything to disclose.
Don Spencer does not have anything to disclose.
Jonathan Thornhill does not have anything to disclose.
2

Session ObjectivesSession Objectives
Develop an infrastructure to drive implementation and support sustainability.
Design a motivational incentive distribution model.
Engage leadership through data transparency and alignment of MU with organizational goals.
Create effective communication mechanisms and informational tools.
3

Who we areWho we are
Why We’re Here
Where we are with MU Certification
Medicare/Medicaid Attestations
4
Panel Jennifer Lord –Meaningful Use Project Manager
Robb Malone, PharmD, CPP – VP Practice Quality & Innovation
Nelson Nauss – Health IT Project Manager
Donald Spencer, MD – ACMIO, Medical Director, VP Ambulatory Care
Jonathan Thornhill –Manager Practice Quality & Innovation
The Practice Quality & Innovation (PQI) Project Team

2/17/2012
THE INTRODUCTION:MEANINGFUL USETHE INTRODUCTION:MEANINGFUL USE
Robb Malone
5

Part of American Reinvestment and Recovery Act of 2009, administered by CMS
It is an initiative that will not go away We are in Stage 1 of 3 Data has to be in coded form, reporting requirement
must be met
UNC qualifies for two separate programs, “Eligible Professionals” and “Eligible Hospitals”
Meaningful Use is one of several regulatory programs beginning to affect outpatient care
What is Meaningful Use?What is Meaningful Use?
We consider the “Eligible Professionals” program to be more challenging
6
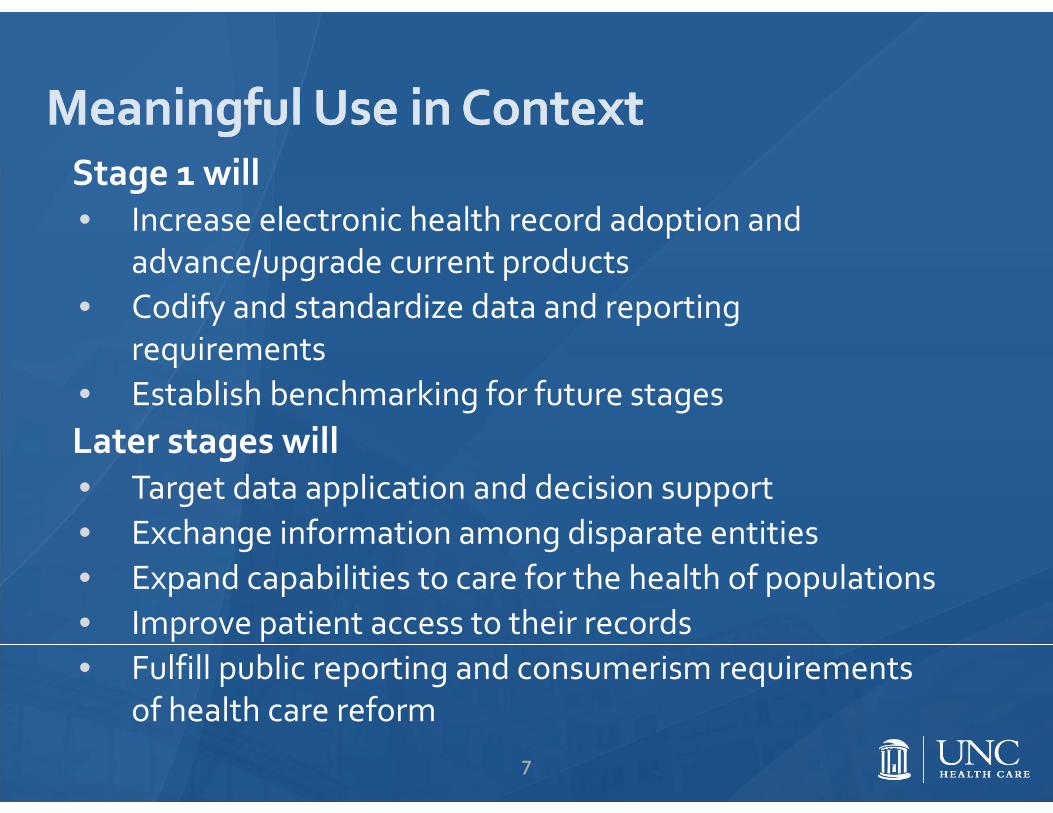
Meaningful Use in ContextMeaningful Use in ContextStage 1 will• Increase electronic health record adoption and
advance/upgrade current products• Codify and standardize data and reporting
requirements• Establish benchmarking for future stagesLater stages will • Target data application and decision support• Exchange information among disparate entities• Expand capabilities to care for the health of populations• Improve patient access to their records• Fulfill public reporting and consumerism requirements
of health care reform7

Year 1 uses a 90‐day window of each physician’s data.
8
Measure Unit Definition Target
Med List Patient 1 on list 80%
Allergy List Patient 1 on list 80%
Problem List Patient 1 on list 80%
Ht,Wt, BP Patient Capture 50%
Tobacco Patient Capture, Advise 50%
Clinical Summaries Visit 3 business days 50%
ePrescribing Prescriber 40%
Key Stage 1 MeasuresKey Stage 1 Measures

• The EHR Promise….
• Key tool for improving safety and quality of care and for reducing costs
• Promise unfulfilled....
• Adoption of an EHR does not necessarily improve quality and
• quality does not improve over time among EHR users.
• Adoption of the HITECH Act and meaningful use is intended to be only a starting point.
• These changes will be in addition to other delivery‐system reforms encouraged under the Affordable Care Act.
NEJM 2011 Article by C. Classen, M.D. and David W. Bates, M.DSee article for references
Meaningful Use in contextFinding the Meaning in Meaningful Use
2/17/2012
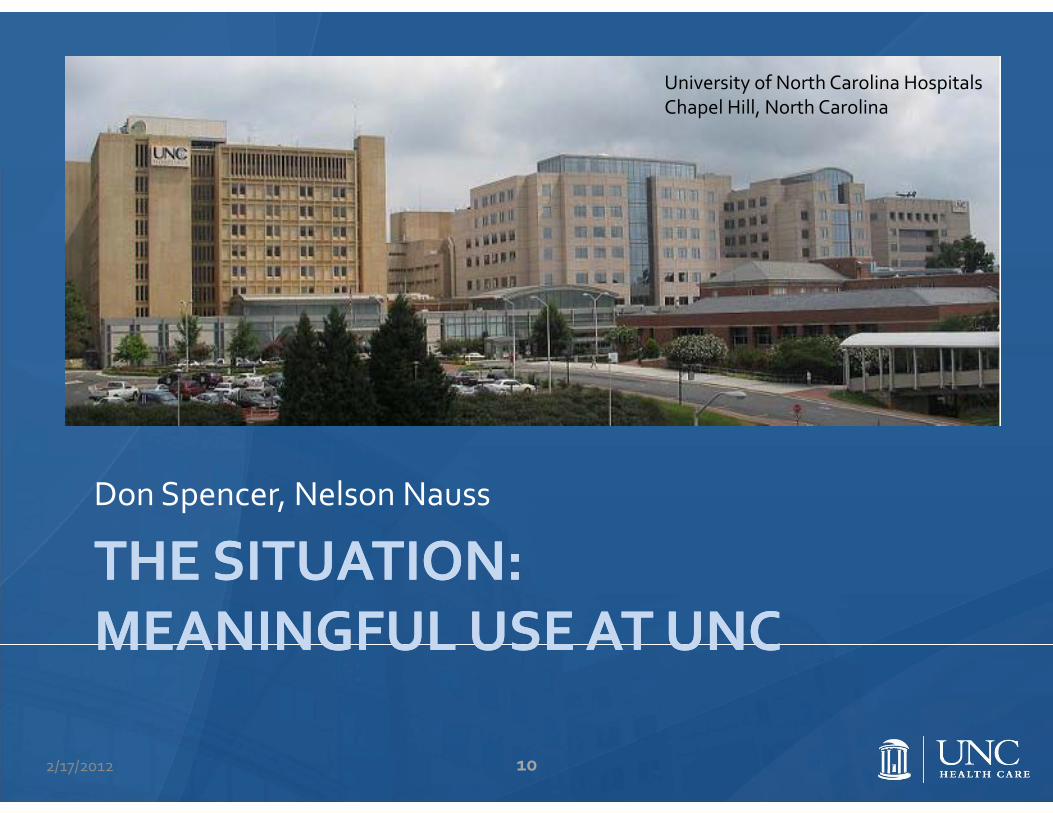
THE SITUATION: MEANINGFUL USE AT UNCTHE SITUATION: MEANINGFUL USE AT UNC
Don Spencer, Nelson Nauss
10
University of North Carolina HospitalsChapel Hill, North Carolina
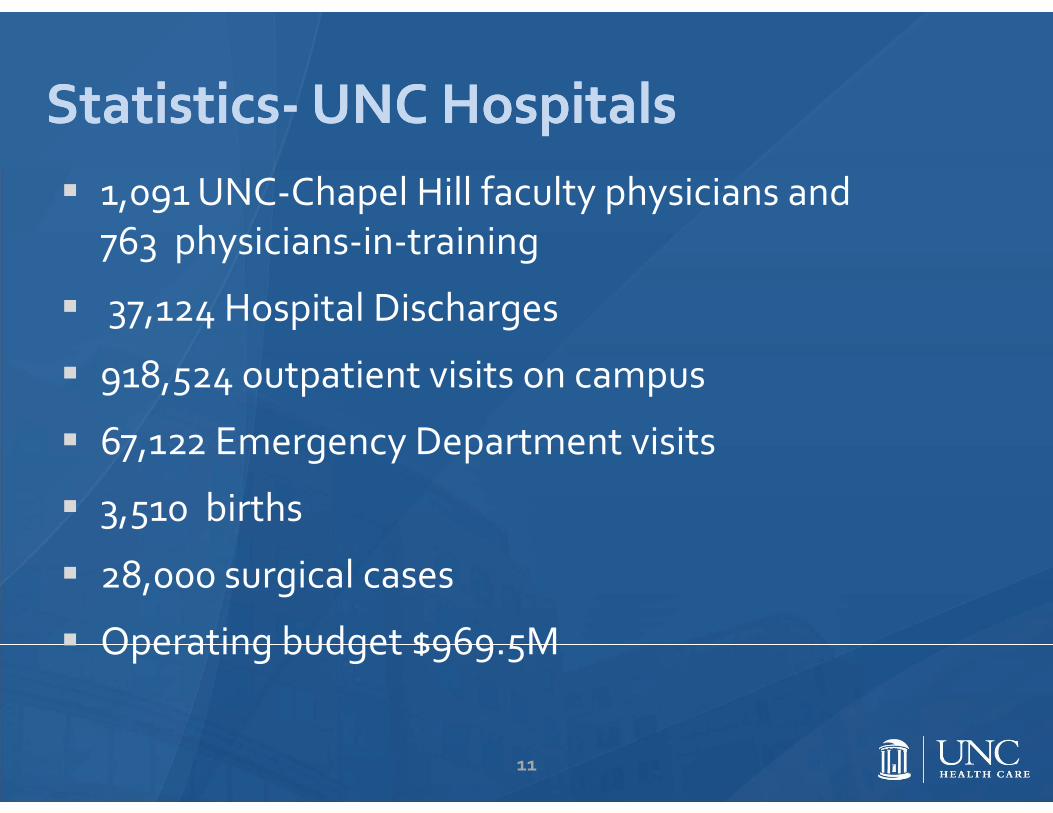
Statistics‐UNC HospitalsStatistics‐UNC Hospitals 1,091 UNC‐Chapel Hill faculty physicians and
763 physicians‐in‐training
37,124 Hospital Discharges
918,524 outpatient visits on campus
67,122 Emergency Department visits
3,510 births
28,000 surgical cases
Operating budget $969.5M
11

UNC Health Care Then and NowUNC Health Care Then and NowNC Memorial Hospital
Rex Healthcare
NC Women’s & Children’s Hospital
Ambulatory Care Center
Chatham Hospital
NC Neurosciences Hospital
NC Cancer Hospital
UNC Health Care –Beginnings
Rex Wakefield

Integrated health system greatly benefits the UNC School of MedicineIntegrated health system greatly benefits the UNC School of Medicine
Aligns objectives
Facilitates performance on research, education, clinical missions
Attracts and retains world‐class faculty
Rapidly deploys recent discoveries
Enables multi‐disciplinary care
Makes population care management a possibility
Unified Leadership
Integrated Faculty
Resource Generation
Clinical Translation
Collaborative Network
Data Accumulation
13

Ambulatory Clinical ‘Organization’: One of many challenges to Meaningful Use ImplementationAmbulatory Clinical ‘Organization’: One of many challenges to Meaningful Use ImplementationWhy we organized centrally rather than by Department or Division for MU attestation

UNC Electronic Health Record: WebCISUNC Electronic Health Record: WebCIS Web based system used by 1900 physicians and 3000 nurses Inpatient and outpatient comprehensive electronic record 1991 deployed as a two‐tier architecture 1995 expanded beyond inpatient units Purchased by Siemens Healthcare in August 2009
WebCIS Circa 2001 WebCIS Circa 2012
15

WebCIS <‐> CPOE <‐> eChartWebCIS <‐> CPOE <‐> eChartWebCIS
CPOE
eChart
16

Document Imaging PACS
CPOEeCHART
WebCIS
Rounds Report
Integration at work…Integration at work…
17

UNC SystemsUNC Systems

Reporting takes a lot of effortTwo questions relevant to “Meaningful Use”Reporting takes a lot of effortTwo questions relevant to “Meaningful Use”
Does Dr. Spencer’s patient, John Smith, have coded problems on his problem list?
What percentage of Dr. Spencer’s patients have coded problems on their problem lists?
19

Evolution of a data warehouse workgroupEvolution of a data warehouse workgroup Diabetes Workgroup used data warehouse for NCQA
recognitions Change in name to Ambulatory Quality Workgroup with focus
on health system organizational goals including diabetes control and electronic prescription
Diabetes Composite Electronic Prescribing

Health care landscape is changing rapidlyHealth care landscape is changing rapidly
Health Reform
More people will require care
Baby‐boomers hitting 65
Those 65+ will increase by 30%.
Physician Shortage
U.S. shortage estimated to reach > 60,000
MDs retiring
1/3 of today’s practicing MDs will have retired
Population growing
North Carolina’s population will grow from 9 to 13 million
Physician need
20302010 2020

Change is coming at a time when expectations and frustrations are highChange is coming at a time when expectations and frustrations are high
Information Technology• Deliver amazing technology• Address security and
privacy concerns• Deliver more with less• Provide information
on demand• Develop slick interfaces• Avoid downtime, it is
unacceptable• Operate in an environment
where technology is a necessity, not a luxury
Providers• Asked to do more with less• Manage burdensome
regulations • Have not seen the value EMRs
have promised• Experience frustration
practicing medicine in a fragmented delivery system
• Have less time with patients and practicing medicine
22

Meaningful Use is a key component of our systems response to the changing health care environment
Meaningful Use is a key component of our systems response to the changing health care environment
23

2/17/2012
THE APPROACH:BUILDING AN INFRASTRUCTURE FOR MEANINGFUL CARE
THE APPROACH:BUILDING AN INFRASTRUCTURE FOR MEANINGFUL CARE
Robb Malone
24

Making the case for our ‘new’ initiativeMaking the case for our ‘new’ initiativeSituation: • Significant changes in reimbursement models will occur due to the
unsustainable growth in health care expendituresBackground: • Incentives from stimulus packages are available now• Penalties are coming through health care reform• Public reporting will become a factor• Alternative payment mechanisms are likelyAssessment: • We must be diligent and prepared to maximize our reimbursementRecommendation: • Coordinate effort for HCS (inpatient and outpatient)• Prepare for increased accountability• Build infrastructure now, take advantage of incentives
25

Alignment with organizational priorities is a great place to startAlignment with organizational priorities is a great place to start
PCMH 2011 Draft StandardsBlue = "Must Pass" in 2008 version / Green = new for 2011
Meaningful UseFinal Rules
PQRI GPRO Measures
JCAHO Peer ReviewChosen Indicators
Standards
PCMH MU JCAHO
# Description Set Component Ind # GPRO # Measure Dept
PCMH 2 Identify and Manage Patient Populations
2B Searchable Clinical Data
2B ‐ 1 Uses nationally standardized codes for patients, clinicians and clinical data, including medication and allergy data Core
Active Problem, Med, and Med Allergy Lists as structured data
Notes documented/signed within required timeframe Various 75% >80% 85%
2B ‐ 2 Documentation of age‐appropriate preventive services [NCQA will specify based on USPSTF recommendations] Menu Preventive and F/U
reminders
112 Prev‐5Notes documented/signed within required timeframe Various 75%
20% of pts ≥65 or ≤5 years old
85%113 Prev‐6110 Prev‐7111 Prev‐8
2B ‐ 3 Documentation of results of screenings and risk factor assessments Core Smoking Status
114
Notes documented/signed within required timeframe Various 75% >50% 85%
115134173131
2B ‐ 4 Allergies and adverse reactions CoreActive Med Allergy List, Drug‐Drug/‐Allergy Checks
Documented in record Medicine 75% >80% 85%
2B ‐ 5 Blood pressure with date of update Core Vitals Charted
HTN‐1 Documented in record Pediatrics
75% >50% 85%1222013 DM‐3
2B ‐ 6 BMI (N/A for pediatric practices) Core Vitals Charted 128 75% >50%
2B ‐ 7 Length, weight, head circumference plotted on growth chart for ≤ 2 years of age (N/A for adult practices) Core Vitals Charted Weight documented Pediatrics 75% >50% 85%
2B ‐ 8 BMI percentile plotted on growth chart for 2 – 17 years (N/A for adult practices) Core Vitals Charted 75% >50%
2B ‐ 9 Lists of prescription medications with date of updates
Core Active Med List 130 Antibiotics/DVT prophylaxisdocumented Various 75% >80% 85%2B ‐ 10 Lists of over‐the‐counter medications with date of updates
2B ‐ 11 Lists of supplements and alternative therapies with date of updates
2B ‐ 12 Laboratory test results Menu Lab Results Process TAT Path/Lab Med 75% >40% 90%
2B ‐ 14 Care in other facilities and dates Menu Transition Summary D/C Summaries completed within required timeframe Various 75% >50% 85%
2C Comprehensive Health Assessment
2C ‐ 3 Medical history of patient and family Core Updated Problem List 75% >80%
2C ‐ 4 Advance care planning (N/A for pediatric practices) Menu Adv Directives (Hosp only) 47 75%
2C ‐ 5 Depression screening for patients with chronic conditions using a standardized tool Core Decision Support Rule 134 75%
2C ‐ 6 Behaviors (smoking, nutrition, physical activity, dental care) and family risk factors (e.g. second hand smoke)
Core Record Smoking status 114 75% >50%115
2C ‐ 7 Patient and family mental health/substance abuse (stress, alcohol, prescription drug abuse or illegal drug use, maternal depression) Core Updated Problem List 173 Documented in record Psychiatry 75% >80% 85%

Leadership engagement and a clear messageLeadership engagement and a clear message
27

MU Implementation
Change Management & Improvement
Project Manager
Coaches
Administrative Support
ISD Training and User support
Trainers
ISD Business Intelligence & P&A
Analytics
Analyst
Programmers
Academic Evaluation
SOPH Faculty
Four areas of focus make up the ‘implementation team’
Support is required to manage change:Components of Meaningful Use infrastructureSupport is required to manage change:Components of Meaningful Use infrastructure

Building The MU Team: The transformation beginsBuilding The MU Team: The transformation begins
29
A conference room becomes a base for teamwork and collaboration
A conference room becomes a base for teamwork and collaboration
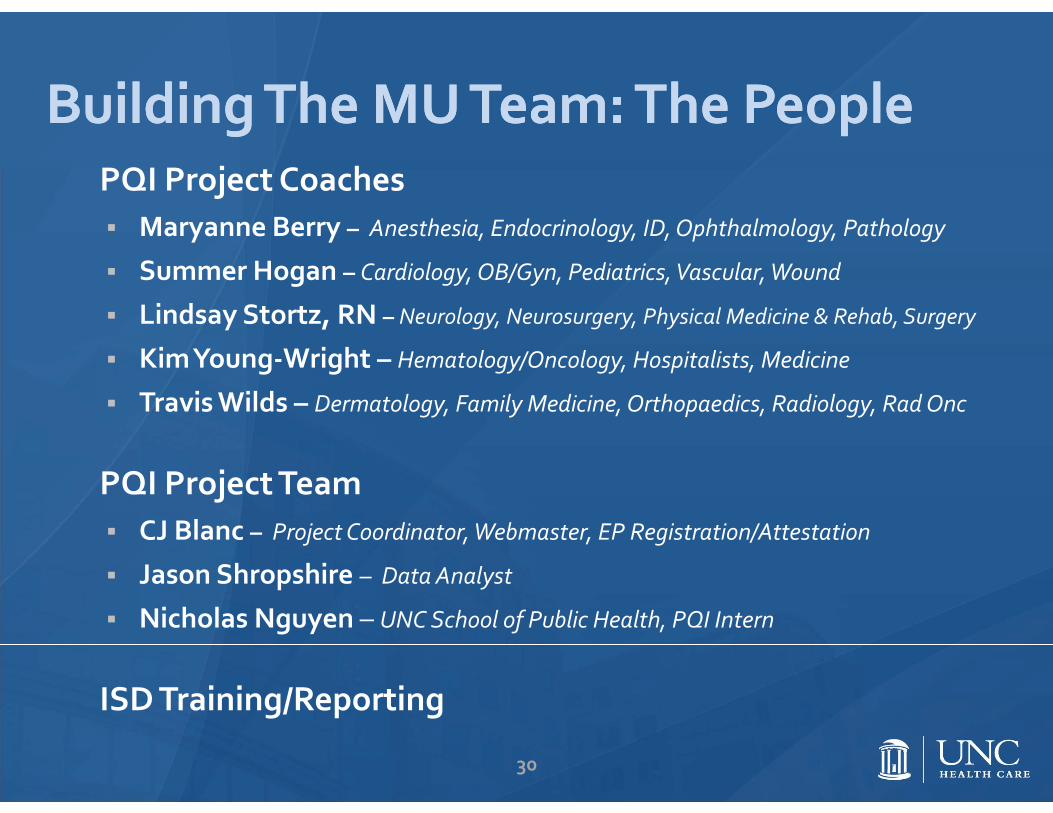
Building The MU Team: The PeopleBuilding The MU Team: The People
30
PQI Project Coaches Maryanne Berry – Anesthesia, Endocrinology, ID, Ophthalmology, Pathology
Summer Hogan – Cardiology, OB/Gyn, Pediatrics, Vascular, Wound
Lindsay Stortz, RN – Neurology, Neurosurgery, Physical Medicine & Rehab, Surgery
Kim Young‐Wright – Hematology/Oncology, Hospitalists, Medicine
Travis Wilds – Dermatology, Family Medicine, Orthopaedics, Radiology, Rad Onc
PQI Project Team CJ Blanc – Project Coordinator, Webmaster, EP Registration/Attestation
Jason Shropshire – Data Analyst
Nicholas Nguyen – UNC School of Public Health, PQI Intern
ISD Training/Reporting

Building The MU Team:The Foundation
Building The MU Team:The Foundation
31
Our vision and values guide our decisions and support us in times of ambiguity.

Building The MU Team: Governance supports and teams drive change
• Based on proven models that work and UNC experience
• MU Governance is key and dedicated• Project leadership aligns efforts• Manager coordinates system
approach• Implementation spread through
Coaches who focus on;• Practice improvement
• Development and support of practice leadership
• Measures that matter to the system and the individual practice
• Building relationships and expertise in all each clinical area
MU Governance
Project Leadership
Project Coaches
MU Teams
Eligible Professionals
Approximately1 Coach per 8 practices or 150 EPs
32

Division Chief
Medical Director
MU Team
Physician
Chief Resident
Nurse
Administrator
Nurse Manager
Project Coach
Clinic Manager
Building The MU Team: Typical team structureBuilding The MU Team: Typical team structure
33

Prepare for public reporting.
Supporting Change:Choosing TransparencySupporting Change:Choosing Transparency
34
Start the conversation.Empower the individual EP. Make the subjective objective.
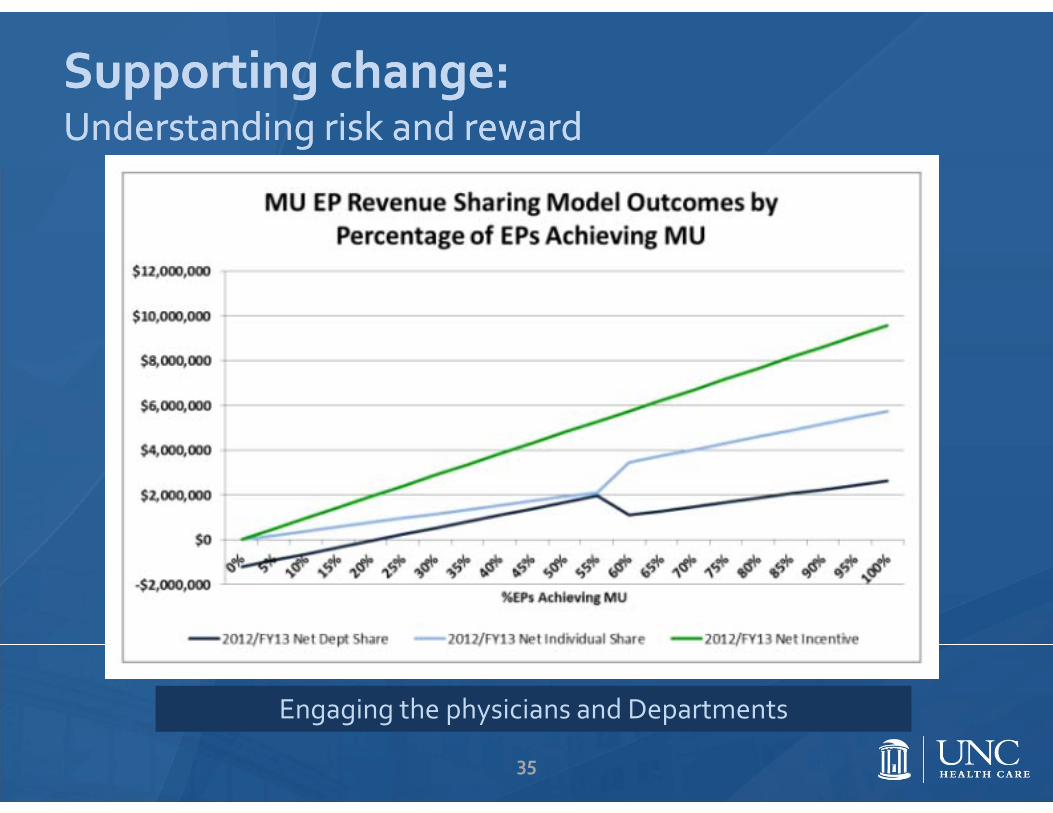
Supporting change:Understanding risk and rewardSupporting change:Understanding risk and reward
Engaging the physicians and Departments
35

Evaluating the initiative: Innovative Collaboration with School of Public HealthEvaluating the initiative: Innovative Collaboration with School of Public Health
• UNC Health Care/School of Medicine and UNC School of Public Health entered a collaborative relationship May 2011
• The goal of this collaborative is to facilitate and evaluate methods used to achieve Meaningful Use
• As a first step, the tem pilot tested and launched two tools: • Capacity Assessment• Readiness for Change Survey
• Next steps are to• Inform our intervention, NOW• Analyze, interpret and report• Seek to pair Medicine and SOPH faculty for future collaboration
An innovative approach to a key initiative that informs and fulfills our academic mission
36

2/17/2012
ENGAGEMENT THROUGH LEADERSHIP AND COLLABORATIONENGAGEMENT THROUGH LEADERSHIP AND COLLABORATION
Panel Discussion with Robb Malone, Nelson Nauss, Don Spencer
37

2/17/2012
THE NUMBERS: $, #, % THE NUMBERS: $, #, % Jonathan Thornhill
38

The MoneyThe Money

Estimating the Incentive“That’s going to be a big spreadsheet…”Estimating the Incentive“That’s going to be a big spreadsheet…”
Understanding MU incentive program
Who’s eligible?
How much incentive?
Who will meet MU?
When will they meet MU?
Where should we focus?
What about specialists?
40

Medicare MU EP Eligibility & IncentivesMedicare MU EP Eligibility & Incentives
MD, DO, DDS, DDM, DPM,OD, or DC
< 90% services provided in inpatient hospital or emergency department
75% of allowed charges up to annual maximums
CalendarYear
First Calendar Year for which the EP Receives Incentive Payment
2011 2012 2013 20142015 and
subsequent years
2011 $18,000 ‐‐‐ ‐‐‐ ‐‐‐ ‐‐‐
2012 $12,000 $18,000 ‐‐‐ ‐‐‐ ‐‐‐
2013 $8,000 $12,000 $15,000 ‐‐‐ ‐‐‐
2014 $4,000 $8,000 $12,000 $12,000 ‐‐‐
2015 $2,000 $4,000 $8,000 $8,000 $0
2016 ‐‐‐ $2,000 $4,000 $4,000 $0
TOTAL $44,000 $44,000 $39,000 $24,000 $0
41

Medicaid MU EP Eligibility & IncentivesMedicaid MU EP Eligibility & Incentives
MD, DO, DDM, NP, PA, or CNM
< 90% services provided in inpatient hospital or emergency department
> 30% Medicaid patient encounters > 20% if pediatrician
Annual incentive based on average cost of EHR implementation
Calendar Year
First Calendar Year for which the EP Receives Incentive Payment
2011 2012 2013 2014 2015 2016
2011 $21,250 $0 $0 $0 $0 $0
2012 $8,500 $21,250 $0 $0 $0 $0
2013 $8,500 $8,500 $21,250 $0 $0 $0
2014 $8,500 $8,500 $8,500 $21,250 $0 $0
2015 $8,500 $8,500 $8,500 $8,500 $21,250 $0
2016 $8,500 $8,500 $8,500 $8,500 $8,500 $21,250
2017 $0 $8,500 $8,500 $8,500 $8,500 $8,500
2018 $0 $0 $8,500 $8,500 $8,500 $8,500
2019 $0 $0 $0 $8,500 $8,500 $8,500
2020 $0 $0 $0 $0 $8,500 $8,500
2021 $0 $0 $0 $0 $0 $8,500
TOTAL $63,750 $63,750 $63,750 $63,750 $63,750 $63,750
42

Estimating the IncentiveLots of questions to answerEstimating the IncentiveLots of questions to answer
43

Who’s eligible? How much incentive?Who’s eligible? How much incentive?
Multiple scenarios to consider Maximum “Likely” No one meets
44

Who will meet MU? When?Who will meet MU? When?
Categorized Divisions as early, early‐middle, middle, middle‐late, and late adopters
Assigned achievement percentages and dates to each category
Varied Medicare allowed charges growth rate Estimated 59% overall likely achievement
45

Where should we focus? Specialists?Where should we focus? Specialists?
Analyzed possible incentive by Division
Identified Divisions most likely to meet MU with most incentive at stake

Individual Share: 40/60% of the net incentive (after the Service Fee) goes to the provider.
Engaging Clinicians and Departments: A Model to Share the IncentiveEngaging Clinicians and Departments: A Model to Share the Incentive
Administrative Service Fee: 13.9%
Department Share: 60/40% of the net incentive (after the Service Fee) goes to the department.
Part of the department share is used to cover MU operational expenses
47

Incentive Sharing ModelIf fewer than 60% of EPs achieve MUIncentive Sharing ModelIf fewer than 60% of EPs achieve MU
$2.3M
$2.2M
$1.2M
$0.9M
FY13 Incentive ‐ 59% of Eligible Professionals Achieve
Provider Share Department Share
Operational Expense Administrative Service Fees
13.9% of incentive –Administrative Service Fees
40% of remaining incentive to individual clinician
60% of remaining incentive to department
Operational expenses (Project Coaches, Training, Reporting) paid from department share

Incentive Sharing ModelIf 60% or more of EPs achieve MUIncentive Sharing ModelIf 60% or more of EPs achieve MU
13.9% of incentive –Administrative Service Fees
60% of remaining incentive to individual clinician
40% of remaining incentive to department
Operational expenses (Project Coaches, Training, Reporting) paid from department share
$5.8M
$2.6M
$1.2M
$1.5M
FY13 Incentive ‐ 100% of Eligible Professionals Achieve
Provider Share Department Share
Operational Expense Administrative Service Fees
Sharing MU incentives with individual clinicians is unique among Academic Medical CentersSharing MU incentives with individual clinicians is unique among Academic Medical Centers
A University HealthsystemConsortium (UHC) survey of participants found most AMCs are retaining incentives for EHR implementation costs or distributing to clinical departments Of 7 survey respondents only UNC Health Care indicated a plan to distribute earned incentives to individual clinicians
Source: University Healthsystem Consortium survey of Meaningful Use listserv participants

The DataThe Data

Capacity Assessment focused on people, process, and technologyCapacity Assessment focused on people, process, and technology
People
• MD Champion• Nurse Champion• WebCIS Superusers
• WebCIS data entry competence
• Clinical QI team
Process
• Vitals• Allergies• Medications• Problems• Compliance tracking
• Coded data• Information outside WebCIS
Technology
• Computers in exam rooms
• Printers in exam rooms
• Centrally located printer
• Sufficient supply of working computers
52

Setting the Course: Capacity Assessment SWOT AnalysisSetting the Course: Capacity Assessment SWOT Analysis
Used modified SWOT analysis to analyze Capacity Assessment results Strengths Weaknesses Degree of Consensus
53

Aggregate SWOTAggregate SWOT
Compiled individual clinic SWOTs to create Aggregate SWOT
‘Process’ dimension holds greatest opportunity
We have the ‘People’ to meet MU
Our ‘Technology’ has room for improvement
In aggregate, our clinics have the capacity to meet MU
‐6‐5‐4‐3‐2‐10123456
‐6 ‐5 ‐4 ‐3 ‐2 ‐1 0 1 2 3 4 5 6
Concen
sus
Strength/Weakness
Clinics Overall
ClinicOverallPeople
Process
54

Lack of Process Standards: Significant challenge, greatest opportunityLack of Process Standards: Significant challenge, greatest opportunity
‐6
‐5
‐4
‐3
‐2
‐1
0
1
2
3
4
5
6
‐6 ‐5 ‐4 ‐3 ‐2 ‐1 0 1 2 3 4 5 6
Consen
sus
Strength/Weakness
Vitals standards
Allergy standards
Allergies in WebCIS
Medication standards
Medication in WebCIS
Problem list standards
Problem in WebCIS
Track Compliance
Outside Software use
55

Variability of Process StandardsVariability of Process Standards Variability exists
for processes
86% have standards for vitals
33% have standards for problems
33% track compliance with standards
56

We’re going to need a laptop (or two)We’re going to need a laptop (or two)
88% of respondents thought it necessary to have a computer in each exam room
34% of respondents identified an insufficient supply of working computers
Identified 20 areas with hardware needs (replacement/upgrades and net new needs)
Worked with Senior Leadership and ISD to deploy hardware outside normal cycle
57

MU Dashboard & Supplemental ReportingMU Dashboard & Supplemental Reporting
Need for data that is: Transparent Valid Accessible Actionable Timely Detailed Aggregated Static Dynamic
58

MU Dashboard at HCS levelMU Dashboard at HCS level
59

MU Dashboard at Department levelMU Dashboard at Department level
60

MU Dashboard at Division levelMU Dashboard at Division level
61

MU Dashboard at Provider levelMU Dashboard at Provider level
62

Supplemental ReportingSupplemental Reporting
“Coaches” report proved to be valuable source of data
Crosstab providing measure‐level performance for all providers
Can be filtered to specific Departments or Divisions
63

Tracking Change Over TimeTracking Change Over Time
Aggregated run chart shows percent of EPs passing each measure over time
Each data point represents a 90 day reporting period
Can be by Departments and Divisions
64

Reporting ChallengesReporting Challenges
Scheduled provider/Billing provider Defining the patient encounter Measure‐specific exclusions External/Part‐time providers Multidisciplinary clinics Outside Systems Lack of integrated data repository Number of EPs
65

2/17/2012
THE PLANTHE PLANJennifer Lord
66

Make it clear.Make it clear.
Make it easy.Make it easy.
Make it matter.Make it matter.

Make it clearMake it clear

Distill the contentDistill the content
Condensed the 864‐page Final Rule to two double‐sided pages
Focused exclusively on the objectives and requirements (the ‘why’ and the ‘how’)
69

Narrow the optionsNarrow the optionsSelected 18 of the 38 Non‐Core Quality measures to report on for UNC providers—based on impact/effort and alignment with PQRS, PCMH, etc.

Break it downBreak it down
71
MU in ‘10 Steps’ that align with the workflow
A single page (double‐sided) lists only the components that require operational effort
Phased implementation to focus effort
Components that require provider involvement are all in Phase One

Keep it simpleKeep it simpleA visual timeline of the targets for each phase of the implementation plan.

Make it accessibleMake it accessible
73
Our Meaningful Use website was created on our internet site (vs. intranet) so that the information can be accessed from anywhere.

Make it easyMake it easy

Know the impactKnow the impact
75
EP Meaningful Use - UNC Health Care System Impact
CORE Our People Our Systems Our Operations
# Component MD Clinical Non‐Clinical WebCIS GE Portal /
WebsiteCDW /
Reporting Training Coaching Comm. Policies / Protocols
1 CPOE
2 Decision Support rule Demonstrate system capability ‐‐ no reporting required.
3 Demograhics
4 Drug‐drug/‐allergy check Demonstrate system capability ‐‐ no reporting required.
5 E‐Info Exchange
6 E‐Info Security Demonstrate system capability ‐‐ no reporting required.
7 E‐prescribe
8 Allergy List
9 Medicine List
10 Problem List
11 Patient Clinical Summary
12 Patient e‐Health Info
13 Quality Improvement
14 Smoking Assess/Intervene
15 Document Vitals
Initial assessment to determine system‐wide impact of each component.

76
Optimize the Care TeamOptimize the Care TeamWorking with State and local policy experts to determine the minimal level of licensure required for documentation of each component.

Brainstorm InterventionsBrainstorm Interventions
77
Ideas for helping our clinic staff to meet MU requirements were cultivated during our PQI retreat and are documented in our Project Plan
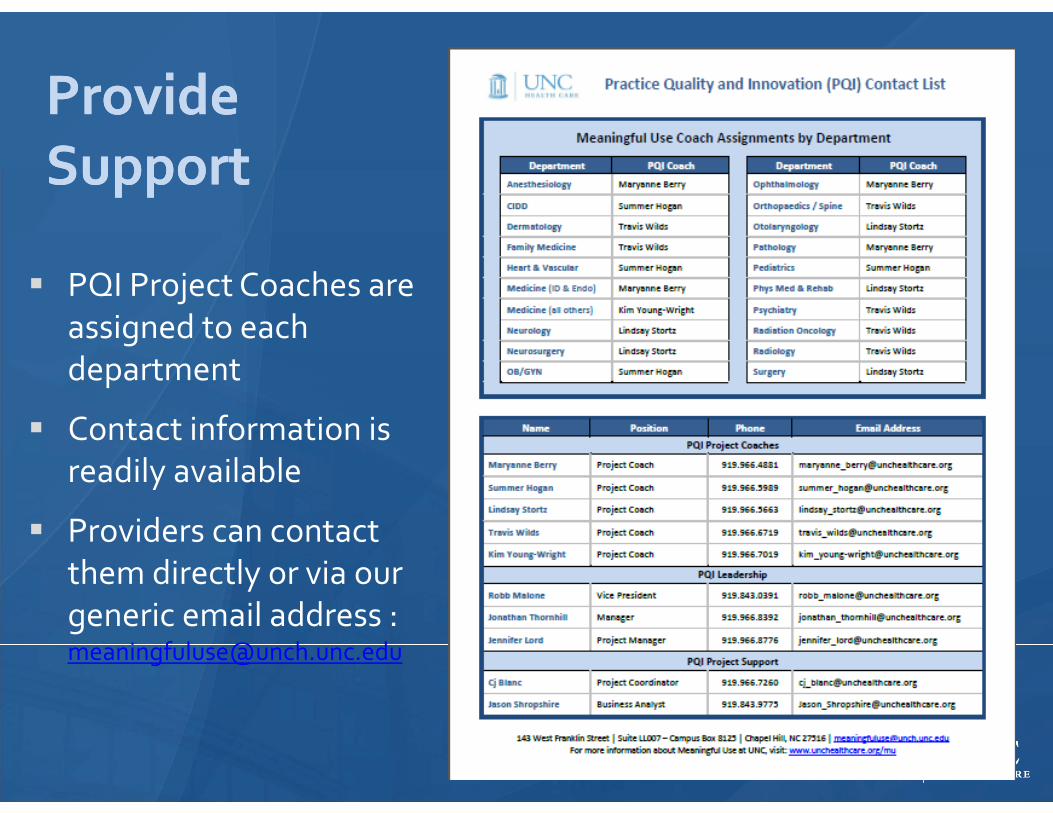
Provide SupportProvide Support
PQI Project Coaches are assigned to each department
Contact information is readily available
Providers can contact them directly or via our generic email address : [email protected]
78

Identify and Address the IssuesIdentify and Address the IssuesProject Coaches maintain a log on our SharePoint site to track concerns identified in reporting, EHR functionality, CMS regulations, etc.

Make it matterMake it matter
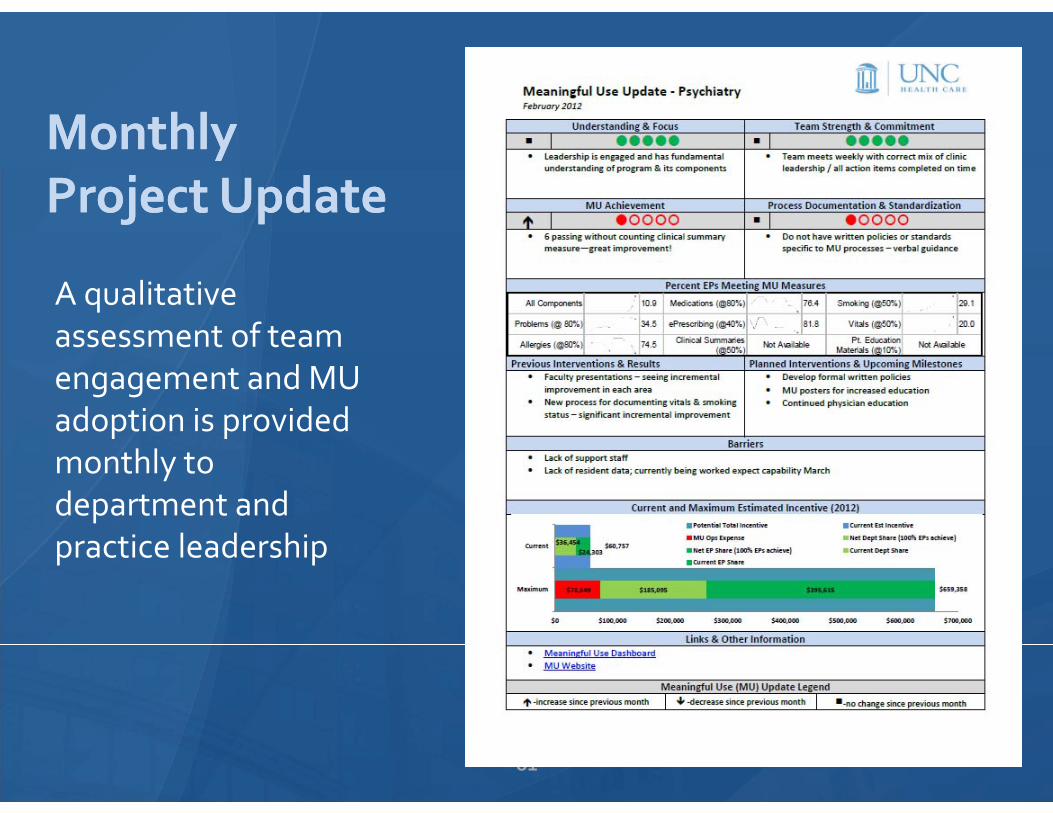
MonthlyProject UpdateMonthlyProject Update
81
A qualitative assessment of team engagement and MU adoption is provided monthly to department and practice leadership

Qualitative OverviewQualitative Overview
82
The Project Update Aggregate shows a snapshot of how our MU Clinic Teams are doing and where we need to focus our efforts.
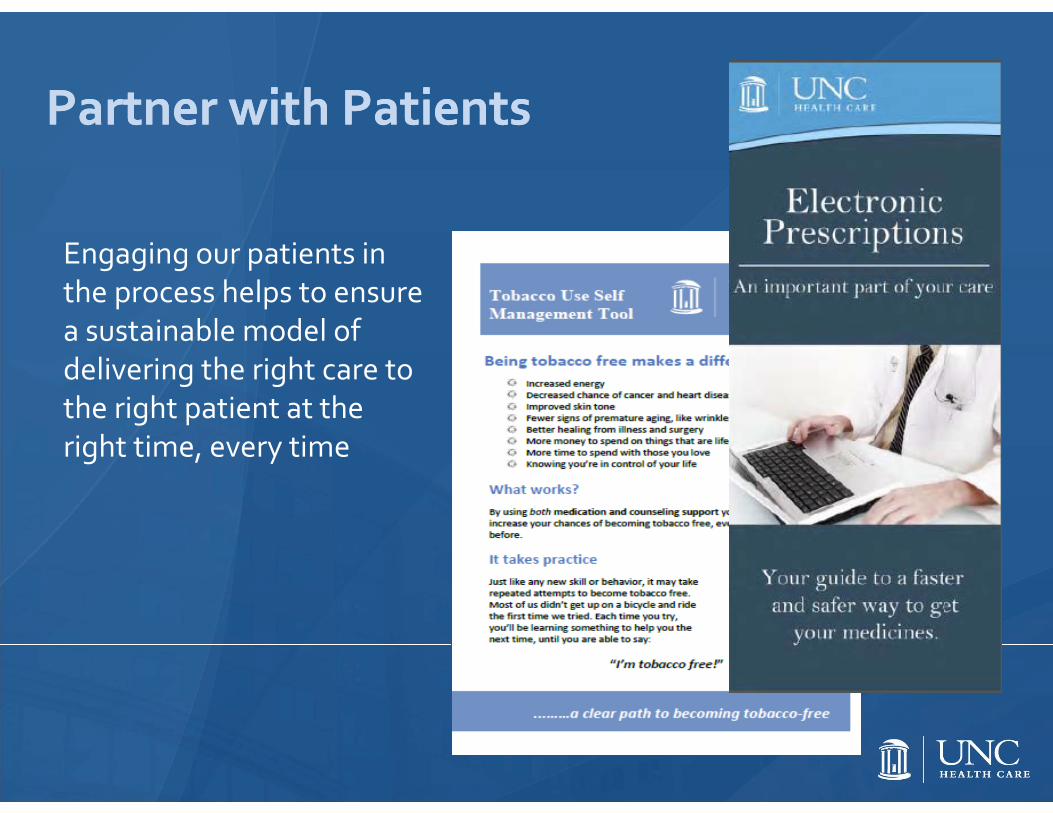
Partner with PatientsPartner with Patients
Engaging our patients in the process helps to ensure a sustainable model of delivering the right care to the right patient at the right time, every time

84

Contact InformationContact Information
85
Please contact us if you have questions or want additional information Jennifer Lord –Meaningful Use Project Manager,
Robb Malone, PharmD, CPP – VP Practice Quality & Innovation, [email protected]
Jonathan Thornhill –Manager Practice Quality & Innovation, [email protected]
Visit our website: www.unchealthcare.org