transformations of runoff chemistry in the arctic tundra, … · 2006-10-17 · decomposed (quinton...
TRANSCRIPT

HYDROLOGICAL PROCESSESHydrol. Process. 20, 2901–2919 (2006)Published online 8 June 2006 in Wiley InterScience (www.interscience.wiley.com). DOI: 10.1002/hyp.6083
Transformations of runoff chemistry in the Arctic tundra,Northwest Territories, Canada
W. L. Quinton1* and J. W. Pomeroy2
1 Cold Regions Research Centre, Wilfrid Laurier University, Waterloo, Canada2 Department of Geography, University of Saskatchewan, Saskatoon, Canada
Abstract:
The transformation of snowmelt water chemical composition during melt, elution and runoff in an Arctic tundra basinis investigated. The chemistry of the water flowing along pathways from the surface of melting snow to the 95Ð5 habasin outlet is related to relevant hydrological processes. In so doing, this paper offers physically based explanationsfor the transformation of major ion concentrations and loads of runoff water associated with snowmelt and rainfallalong hydrological pathways to the stream outlet. Late-lying snowdrifts were found to influence the ion chemistry inadjacent reaches of the stream channel greatly. As the initial pulse of ion-rich melt water drained from the snowdriftand was conveyed through hillslope flowpaths, the concentrations of most ions increased, and the duration of the peakionic pulse lengthened. Over the first 3 m of overland flow, the concentrations of all ions except for NO�
3 increasedby one to two orders of magnitude, with the largest increase for KC, Ca2C and Mg2C. This was roughly equivalentto the concentration increase that resulted from percolation of relatively dilute water through 0Ð25 m of unsaturatedsoil. The NaC and Cl� were the dominant ions in snowmelt water, whereas Ca2C and Mg2C dominated the hillsloperunoff. On slopes below a large melting snowdrift, ion concentrations of melt water flowing in the saturated layer ofthe soil were very similar to the relatively dilute concentrations found in surface runoff. However, once the snowdriftablated, ion concentrations of subsurface flow increased above parent melt-water concentrations. Three seasonallycharacteristic hydrochemical regimes were identified in a stream reach adjacent to late-lying snowdrifts. In the firsttwo stages, the water chemistry in the stream channel strongly resembled the hillslope drainage water. In the thirdstage, in-stream geochemical processes, including the weathering/ion exchange of Ca2C and Mg2C, were the maincontrol of streamwater chemistry. Copyright 2006 John Wiley & Sons, Ltd.
KEY WORDS runoff chemistry; hydrology; flowpaths; stream flow; Arctic; tundra; permafrost; soil pipes
INTRODUCTION
Seasonal snowmelt releases 8 to 9 months of wet and dry chemical deposition and most of the annualprecipitation within a relatively short period, and so can strongly influence the hydrochemical input to smallto medium-sized Arctic catchments. The influence of chemical inputs such as inorganic nitrogen on carboncycling and primary productivity is potentially profound (Schindler and Bayley, 1993) and the redistributionof chemical compounds during snowmelt runoff is potentially a very important part of weathering andgeochemical cycling in tundra. Improving the understanding of the influence of tundra hydrological processesand pathways on the fate of chemicals deposited to snow and ground surfaces is an essential step towardpredicting the response of runoff chemistry and terrestrial geochemical budgets to changes in water and energyavailability in this environment.
During winter, wind redistributes snow and its chemical load across the tundra from areas of short vegetationand high wind exposure to sites sheltered from the wind or with taller, denser vegetation (Pomeroy et al.,1993). The snow ion load in depositional areas (e.g. snowdrifts) can be 8 to 10 times greater than in the
* Correspondence to: W. L. Quinton, Cold Regions Research Centre, Wilfrid Laurier University, Waterloo, Ontario N2L 3C5, Canada.E-mail: [email protected]
Received 12 March 2004Copyright 2006 John Wiley & Sons, Ltd. Accepted 28 March 2005

2902 W. L. QUINTON AND J. W. POMEROY
open tundra, with the effect magnified for sea salts and diminished for NO3�, which is not conserved in
blowing snow particles (Pomeroy et al., 1991, 1995). Although these snowdrifts govern the length of themelt season and contribute significantly to the late melt runoff in medium-sized Arctic catchments (Marshand Pomeroy, 1996; Quinton and Marsh, 1999), the chemical implications of snowdrift melt chemistry forthe stream and interactions with the soil have not been assessed. Several studies examining the timing of theion mass flux from deep, late-lying snow have found that the chemical concentration of initial melt water isenhanced to varying degrees, whereas later melt water is relatively dilute (Jones et al., 2001). Much of theenhanced concentrations in early melt are due to diffusion of solute-rich water into melt water (Marsh andPomeroy, 1999). Jones (1991) demonstrated that, within a snowpack, microbial consumption and release ofinorganic nitrogen could substantially alter the snow nitrogen budget during melt, with large reductions inNO3
� concentrations often observed. Other studies describe the opposite fate of NO3� in the snowpack, with
nitrification often reported (Sueker et al., 2001).The chemistry of snowmelt water is not easily related to the chemical composition of small Arctic streams
during the snowmelt freshet. In a study of the chemistry of headwater streams in Arctic tundra, Teare (1998)found that, during the snowmelt runoff period, all streams contained high levels of organic acids and relativelyhigh concentrations of KC. A Ca2C � SO4
2� signal predominated during the declining limb of the snowmeltrunoff hydrograph, and a Ca2C � HCO�
3 signal characterized the low stream-flow conditions of summer. TheCa2C � SO4
2� signal was attributed to interaction with lake sediments and mixing with sediment pore water,and the Ca2C � HCO�
3 signal was attributed to interaction with the Quaternary sediments underlying thestream channels (Teare, 1998). The ion composition of the streams contrasted strongly with the early meltpeak in the primary chemical fluxes of NaC, Cl�, SO4
2�, and NO3� and the very low levels of KC and organic
acids observed by Marsh and Pomeroy (1999) in nearby snowpacks. This suggests that the composition ofthe melt water that flowed through the soil to the stream changed markedly by mixing with soil water andinteracting with the soils. Jones and Pomeroy (2001), working in a boreal catchment in Quebec, found thatthe degree to which the snow chemical composition was preserved in the hillslope runoff depended uponthe extent of impermeable (concrete) frost in the soil. The substantial interannual variability in the extentof concrete frost, and in the ionic composition of the hillslope runoff, suggested complex and variable flowpathways that could not be elucidated.
Overland flow on tundra, permafrost hillslopes is generally limited to areas downslope of melting, late-lying snowdrifts. Melt water also percolates through the porous organic soils and moves rapidly downslope asinterflow (Quinton and Marsh, 1999), even while the ground is still snow covered (Quinton and Marsh, 1998).Because the hydraulic conductivity of organic soils in this environment decreases exponentially with depth(Quinton et al., 2000), the residence time of subsurface drainage water increases as the soil thaws and thezone of saturation descends through the wetted profile. As a result, the time available for chemical interactionbetween the water of the active and inactive soil pores is expected to increase as thaw progresses. The surfacearea for contact between pore water and soil also increases with increasing soil thaw due to a decrease inmean pore diameter with depth (Quinton et al., 2000).
As the active layer thaws during and after melt and the water table perched above the frozen soil descends,the thickness of the unsaturated zone above it increases. Drying of the unsaturated layer concentrates theremaining solute in shrinking water films on soil particle surfaces. A water table rise due to rainfall orsubsequent seasonal snowmelt could mix with these enriched films, altering the chemical composition ofinterflow from that of the original rainfall or snowmelt effluent. In Arctic Alaska for example, the concentrationof some ionic species in hillslope runoff has been observed to increase following rain events (Hinzman et al.,1998).
There is evidence that hydrochemical processes during tundra runoff alter the chemistry of waters derivedfrom snowmelt and rainfall. In particular, the high chemical loads of sea salt, SO4
2� and NO3� observed
in snowdrifts may be altered before reaching the stream. The objectives of this paper are to characterizein detail the chemical transport and transformations of water draining along an Arctic tundra pathway from
Copyright 2006 John Wiley & Sons, Ltd. Hydrol. Process. 20, 2901–2919 (2006)

TRANSFORMATIONS OF RUNOFF CHEMISTRY IN ARCTIC TUNDRA 2903
Trail
Valley
Creek
Siks
ik
Upper
Middle Component
East
Arm
West Arm
Camp
Creek
Arm
Cam
p
Metres
0 200
basin boundarystream gauging stationsnow pitlate lying snow driftsopen tundrashrub (tundra)shrub (channel)polygons
WSCgaugingstation
met.tower
Tuktoyaktuk
SiksikCreek
InuvikAklavik
Beaufort Sea
Study Plot
UpperGaugingStation
LowerGaugingStation
MiddleGaugingStation
Component
Cre
ek
Figure 1. The Siksik Creek basin, showing the major biophysical terrain types, the three stream gauging stations, the snow pits, and thehillslope study plot
snowdrift to stream, and to relate the chemical mass balance of the surrounding small headwater catchmentto hydrochemical processes.
STUDY SITE
The study was conducted at Siksik Creek (68°440N, 133°280W) located approximately 55 km north-northeastof Inuvik, and 80 km south of Tuktoyaktuk on the Arctic Ocean (Figure 1). The watershed is located at the
Copyright 2006 John Wiley & Sons, Ltd. Hydrol. Process. 20, 2901–2919 (2006)

2904 W. L. QUINTON AND J. W. POMEROY
northern fringe of the forest–tundra transition zone (Bliss and Matveyeva, 1992), and is within continuouspermafrost (Heginbottom and Radburn, 1992). Siksik Creek drains a 95Ð5 ha area with elevations rangingbetween approximately 60 and 100 m a.s.l.
The climate at Siksik Creek, as inferred from the climate normals for Inuvik and Tuktoyaktuk (AES,1982a,b), is characterized by short, cool summers and long cold winters, with 8 months of snow cover. Themean daily temperature rises above 0 °C in early June and falls below 0 °C in early October, with a meanannual air temperature of �9Ð8 °C at Inuvik and �10Ð9 °C at Tuktoyaktuk. The mean annual precipitationtotals at Inuvik (266 mm) and Tuktoyaktuk (138 mm) are comprised of 66% and 47% snowfall respectively.Monthly precipitation is greatest in August, September and October, with most precipitation falling as rain inAugust and September, and as snow in October.
Mineral earth hummocks (Figure 2a) occur throughout the study basin, covering between 30% and 70%of hillslope surfaces. Their diameters range between 0Ð4 and 1 m, with their crests rising 0Ð1 to 0Ð4 m abovethe surrounding interhummock surface. The hummock surfaces are bare or support a thin layer of lichen(Alectoria and Cladina spp.). The interhummock vegetation consists of sedges (Eriophorum and Carex spp.)and small vascular plants (Empetrum, Vaccinium, Ledum and Rubus spp.) rooted in a continuous cover ofmoss (Sphagnum spp.). The peat in the interhummock area is ¾0Ð3 to 0Ð4 m thick. The upper ¾0Ð1 to 0Ð2 mis composed of living vegetation and lightly decomposed peat. Below this, the peat is moderately to stronglydecomposed (Quinton and Marsh, 1999).
Water moves preferentially through the interhummock area, since the hummocks are raised, and thehydraulic conductivity of the organic soil is three to six orders of magnitude higher than that of the clay-richhummocks (Quinton and Marsh, 1998). In the interhummock area, soil pipes, with diameters of 0Ð05 to 0Ð10 mare common on hillslopes with gradients � 0Ð08, but were not observed on gradients of � 0Ð04. The soil pipesoccur predominantly in the lower peat layer, with the upper layer forming an organic ‘roof’. By late summer,the average frost table depth was ¾0Ð3 m in the interhummock area, compared with 0Ð6 m in the hummocks(Quinton and Marsh, 1998). Fine-grained, frost-susceptible soils underlie the organic cover throughout thebasin.
At the onset of snowmelt runoff in the spring, the soil profile in the interhummock area is usually saturatedor nearly saturated with ice, creating a relatively impermeable boundary close to the ground surface. Previoushydrological studies on this hillslope (Quinton and Marsh, 1998; Quinton et al., 2000) demonstrated that,during soil thawing, the upper surface of the frozen, saturated soil coincides closely with the elevation of the0 °C isotherm, i.e. the frost table. The frost table, therefore, approximates the lower boundary of the thawed,saturated layer through which subsurface water drains from the hillslope. The saturated, horizontal hydraulicconductivity ks decreases from 10�3 m s�1 to 10�6 m s�1 between 0Ð1 and 0Ð3 m depth increments in theinterhummock area (Quinton et al., 2000). Given the depth dependency of ks and the impermeable natureof the frost table in this environment, the frost table elevation is a major factor controlling the timing andmagnitude of hillslope subsurface drainage.
METHODOLOGY
Field studies
Most field measurements were conducted between April and September 1992, with selected follow-upsampling and measurement during the same period of 1993. In late winter, 845 snow depths and 169 densitieswere measured along transects to estimate the snow water equivalent for each of the major biophysical covertypes: open tundra, shrub tundra, channel shrub, open channel, and steep slopes where late-lying snowdriftsform, following the methodology of Pomeroy and Gray (1995). On 6 May, snow pits were dug with Teflon-coated shovels within each biophysical site type. In each pit, initial snow chemistry was measured by a massweighted mean of samples extracted from the various physical layers. Snow samples were extracted using a
Copyright 2006 John Wiley & Sons, Ltd. Hydrol. Process. 20, 2901–2919 (2006)

TRANSFORMATIONS OF RUNOFF CHEMISTRY IN ARCTIC TUNDRA 2905
Frost table Organic Mineral
Inter-hummockarea
Mineral earthhummocks
OLF (3 m)
OLF (20 m)
Lysimeter (0 m)
21-May 31-May 10-Jun 20-Jun 30-Jun
0.25
0.30
0.35
0.20
0.15
0.10
0.05
0.0
19 May: drift thermally stratified, hillside downslope ofdrift is ~30% snow-free.
31 May
10 June
17 Junewater table
frost tablethawed, saturated soil(lateral subsurface flow)
(a)
31 May: 1.25 m
10 June: 0.82 m
17 June: 0 m
Water table
Snow drift
20 m
Streamflow
30 m to Middle gauging station
(b)
Figure 2. (a) A schematic of the hillslope study plot; (b) variation in the average depth of the frost table measured along the measurementtransect and water table measured at the observation well 15 m downslope of the snowdrift at the study plot in 1992
200 cm3 polyethylene scoop that had been soaked and rinsed with deionized water. The snow samples werestored in clean polyethylene resealable bags, and allowed to melt at 20 °C.
By 21 May, the snowdrift had become isothermal at 0 °C. On that date, a 0Ð25 m2 polyethylene lysimeterthat had been soaked and rinsed with deionized water was installed at the base of the snowpack, followingthe methodology of Marsh and Woo (1985). Installing the lysimeter prior to the isothermal condition was
Copyright 2006 John Wiley & Sons, Ltd. Hydrol. Process. 20, 2901–2919 (2006)
2906 W. L. QUINTON AND J. W. POMEROY
attempted, but it resulted in refreezing and ice blockage in the lysimeter. Each day, melt water was collectedfrom the lysimeter in high-density polyethylene (HDPE) bottles that had been washed in nitric acid and thenrinsed several times with deionized water.
Six rain-chemistry collectors, each consisting of a 0Ð15 m diameter polyethylene funnel attached to a 500 mlHDPE bottle, were located near the base camp (Figure 1). The gauges were positioned at a height of 1Ð5 mabove the ground surface so as to minimize splash or entry of vegetation debris. Each gauge was checkedand rinsed with deionized water daily, and following each rain event, at which time all accumulated rainwaterwas recovered, and a single composite sample was stored in a pre-washed HDPE bottle. A shielded Misco0Ð2 m diameter tipping-bucket rain gauge was deployed at the same location in order to obtain a continuousrainfall for both years. This gauge was attached to a Campbell datalogger, which recorded total rainfall every30 min.
On a northeast-facing hillslope (Figure 1), an intensive study plot was established so that water samples anddischarge measurements could be taken along segments of a hillslope runoff pathway (Figure 2a). Upslopeof the plot was a late-lying snowdrift that remained for 3 to 4 weeks after the melt of the surrounding snow.Following snowmelt, a graduated steel rod was used to measure the depth of the impermeable frost tablebelow the ground surface. These measurements were made every second day at 0Ð5 m intervals along a 20 mtransect that extended between the stream bank and the snowdrift. The transect included approximately anequal number of points in hummocks and in the interhummock organic-rich surface (Quinton and Marsh,1998, 1999; Quinton et al., 2000). The depth of the water table below the ground surface was measured dailyat a stilling well, located 15 m downslope of the snowdrift, that was installed in the interhummock area duringthe fall of 1991. This well was also used to obtain water samples from the saturated layer, representing thesubsurface drainage pathway. Overland flow from the study plot was measured using a flume box equippedwith a 90° V-notch weir and stage recorder, located at the terminus of an ¾20 m long ephemeral rill thatconveyed the melt water from the snowdrift to the stream bank. Overland flow samples were collected dailyat the flume box and 3 m downslope of the snowdrift along the same rill. Water draining from the outlet ofnatural soil pipes at the stream bank was also sampled.
Zero-tension, polyethylene lysimeters with a surface area of 0Ð1 m2 and a depth of 0Ð05 m were usedto collect water percolating through the unsaturated zone. Each lysimeter was covered with a perforatedpolyethylene sheet to prevent the overlying soil from collapsing into the 0Ð05 m thickness air space below.Four soil pits were excavated to the frost table, and a lysimeter was installed in each, so that its upper,perforated surface was 0Ð25 m below the ground surface. The intact organic soil block was then carefullypositioned on top of the lysimeter.
The lysimeters were installed on 26 June 1992 and were sampled on 23 July. Following the initial sam-pling, each lysimeter was rinsed with deionized water, reinstalled in the ground, and covered with the soilblock. Deionized water (1Ð5 l) was then applied to the surface of each soil block, which is equivalent to arainfall depth of 15 mm. The deionized-water application took approximately 10 min for each lysimeter. Thelysimeters were sampled 1 week later, on 29 July. No rain occurred during this period, so the accumulatedwater was assumed to have come only from the deionized water and any antecedent water in the unsaturatedsoil layer above the lysimeters.
Stream discharge was measured at the basin outlet (lower gauging station, drainage area 95Ð5 ha) usinga reinforced plywood weir with a metal-plated 90° V-notch and a stilling well with a stage recorder.Discharge was also measured at two additional gauging stations located 275 m (middle gauging station,drainage area 83Ð4 ha) and 1175 m (upper gauging station, drainage area 43Ð9 ha) upstream of the outlet(Figure 1). Since these stations were under construction during the 1992 study season, discharge was notmeasured continuously until July of that year. Prior to that time, discharge was measured instantaneouslyusing a Price AA current meter at the site of each station, twice daily during the snowmelt runoff period,and once daily thereafter. Water samples were collected manually at all the stations in both years in 250 mlHDPE bottles.
Copyright 2006 John Wiley & Sons, Ltd. Hydrol. Process. 20, 2901–2919 (2006)

TRANSFORMATIONS OF RUNOFF CHEMISTRY IN ARCTIC TUNDRA 2907
Analytical procedure
All water samples, including melted snow, percolate collected from the snow and soil lysimeters, hillslopedrainage water and rainfall, were filtered through 0Ð4 µm Nuclepore filters. The pH was measured prior tofiltering with a Ross combination electrode. All samples were then stored in washed HDPE bottles at cooltemperatures and shipped to the National Hydrology Research Institute in Saskatoon for analysis. Anionanalyses (Cl�, NO3
�, SO42�) were conducted on a Dionex 2010i ion chromatograph with a 100 µl injection
loop, 0Ð75 M NaHCO3 –1Ð5 M Na2CO3 eluent, and suppressed conductivity detection. Samples were introducedby a Technicon sampler into the loop after mixing nine parts of sample to one part of concentrated eluent(10ð the working eluent concentration). Cation analyses (Ca2C, Mg2C, NaC, KC) were performed using flameatomic absorption spectrophotometry on Perkin Elmer AAS models 460, 2380 and 5000.
The annual water balance was computed for the Siksik Creek drainage basin from
�SWE C P� � R D S �1�
where SWE is the areally weighted mean pre-melt snow water equivalent of the five major biophysical terrainunits computed from the results of the late-winter snow depth and density surveys, P is cumulative annualrainfall measured between snowmelt and freeze-up, R is the cumulative annual discharge measured at thelower gauging station (Figure 1), and S is the change in storage. All units are in millimetres.
For each ion species under study, the annual mass balance was computed from
[�VSWECSWE� C �VPCSP�] � �VRCSR� D SM �2�
where VSWE (m3) is the snow water equivalent volume (computed as the product of the areally weighted SWEdepth defined in Equation (1) and the basin area), CSWE is the areally weighted ion concentration (computedfrom the snow pit data), VP (m3) is the cumulative rainfall volume (equal to the product of the cumulativerainfall depth and the basin area), CSP is the average measured ion concentration of all rain events for whichwater samples were collected, VR is the cumulative runoff volume (equal to the product of the cumulativerunoff depth and the drainage area), and CSR is the ion concentration measured in the stream channel. Becausethe variation in ion concentration over time is relatively large in the stream channel, VRCSR was computedover daily periods with the assumption that ion concentrations measured in each daily water sample wererepresentative of the volume of water that discharged from the stream channel over the daily interval sincethe last water sample was collected. The daily values of VRCSR were then summed to arrive at a seasonalestimate. SM is the change in the ion mass (kilograms) stored in the basin.
RESULTS
Hillslope hydrology
The rate that water drained from the hillslope and through the stream channel varied with the degree ofsnowmelt and soil thaw. This is demonstrated by comparing the flow conditions of four specific dates (19 May,31 May, 10 June and 17 June) representing different stages of the snowmelt runoff period. On 19 May, thesnowdrift was thermally stratified; and the 20 m section between the snowdrift and the stream channel, whichwas entirely snow covered a few days earlier, was now about 30% snow free. The stream channel was filledwith wet snow, and flooded in several areas, and did not yet conduct open channel flow. Instead, water in thechannel moved slowly toward the basin outlet as seepage through the saturated channel snowpack. At thistime, melt water percolated through the snowdrift at a rate of 1Ð33 ð 10�6 to 1Ð99 ð 10�6 m s�1, as computedfrom the method of Marsh (1991), indicating that the melt water contribution of the snowdrift to the streamchannel was negligible.
By 31 May, the snowdrift had been isothermal for about 10 days, and the rate of percolation through this1Ð25 m deep pathway had increased to 6Ð02 ð 10�5 m s�1 (Marsh, 1991), indicating that 24% of the overall
Copyright 2006 John Wiley & Sons, Ltd. Hydrol. Process. 20, 2901–2919 (2006)
2908 W. L. QUINTON AND J. W. POMEROY
travel time from the surface of the melting snowdrift to the basin outlet was spent in percolation through thesnowdrift. Overland flow began approximately 2 days before 31 May, and the entire hillslope downslope ofthe snowdrift was now snow free. The hillslope tracer tests at this time (Quinton et al., 2000) indicated amean pore velocity through the saturated soil layer (Figure 2b) of ¾8Ð10 ð 10�4 m s�1. For the 20 m longhillslope, this represents approximately 53% of the overall travel time to the basin outlet. Less than 2% ofthis travel time was spent in the 275 m stream section between the study plot and the outlet, where openchannel flow was now occurring, and the mean velocity was 0Ð34 m s�1.
On 10 June, the depth of the snowdrift was 0Ð82 m, and the average percolation rate (Marsh, 1991) was6Ð02 ð 10�5 m s�1, representing ¾20% of the overall travel time to the outlet. Overland flow, which peakedon the previous day (9 June), remained high. The pore velocity in the unsaturated layer had decreased to3Ð70 ð 10�4 m s�1, resulting from the lower position of the thawed saturated zone (Figure 2b). By this time,the subsurface hillslope flowpath was at 78% of the overall travel time to the outlet. Approximately 2Ð5% ofthe travel time was spent in the stream channel, where the average flow velocity was 0Ð16 m s�1.
The snowdrift had melted at the snowmelt lysimeter by 17 June (Figure 3a), although it persisted until19 June further upslope. Within a day of the snowdrift’s disappearance, overland flow and flow from mostsoil pipes ceased, thereby leaving subsurface flow through the peat matrix as the only pathway to the streamchannel. Continued soil thaw reduced the average pore velocity in this segment to 6Ð13 ð 10�5 m s�1 (Quintonet al., 2000), increasing the time spent in this 20 m pathway to over 98% of the overall travel time. Theremaining ¾2% of the travel time was spent in the stream channel with an average velocity of 0Ð12 m s�1.
Major flowpaths
Snowmelt percolation. At all snow pits, the concentration factor (CF), the ratio of the ion concentrationin the melt water to that in the parent snow, was largest for Ca2C, with high values also occurring for NaC,Cl� and Mg2C. At the snowdrift, where the snow cover persisted for 3 to 4 weeks following the melt of thesurrounding snow (Figure 3a), the CF values indicate an initial pulse of acidic, ion-rich melt water, followedby the drainage of relatively dilute water with a more neutral pH. The ion concentrations in the melt waterfrom the snowdrift and CF values (Figure 3b) peaked on 27 May, after only 18% of the cumulative waterequivalent was released (Figure 3c). By 2 June, when 35% of the SWE had melted and after the initial pulseof highly concentrated melt water, the cumulative mass flux of all ions (except KC) exceeded 90%. The ionconcentrations were low in the remaining 65% of the melt water from the drift.
Overland flow. An ephemeral rill, such as that depicted in Figure 2a, conveyed melt water across the 20 msnow-free valley bottom from the snowdrift to the stream bank. From 31 May to 3 June, while ions werepreferentially eluted in melt waters from the snowdrift (Figure 3b), the difference in the ion concentrations ofwater sampled from the upslope (snowmelt lysimeter) and downslope of the 20 m rill were one to two ordersof magnitude larger than the differences in ion concentrations from parent snow to melt water (Table I). Aswith the melt water, the enrichment in Ca2C concentration was the largest in overland flow, followed byKC. The behaviour of NO3
� concentration did not change appreciably during melting, and then decreasedbelow the analytical detection limits during overland flow to the stream bank. Although the concentrations ofNO3
� and SO42� in the melt water were similar to those of Ca2C and Mg2C for the 40-daily water samples
taken along the rill, NO3� was detectable in only one overland flow sample (19 June) after travelling 3 m
downslope and was not detected in any of the samples at the stream bank. Whereas NO3� concentrations
decreased with flow distance, the average concentration of SO42� was consistently higher in the overland
flow than in the melt water (Table I), and often increased with overland flow distance.Prior to the peak of overland flow (9 June), the concentration of each ion species in the melt water percolation
and overland flow (20 m) decreased following the peak concentration on 27 May (Figure 3b). After 9 June,the snowdrift melt water did not strongly affect the ion concentrations of overland flow. For example, duringthe second half of June, the concentrations of Ca2C and Mg2C increased in overland flow, while they were
Copyright 2006 John Wiley & Sons, Ltd. Hydrol. Process. 20, 2901–2919 (2006)

TRANSFORMATIONS OF RUNOFF CHEMISTRY IN ARCTIC TUNDRA 2909
0
600
300
100
400
200
500
8-May 13-May 18-May 23-May 28-May 2-Jun 7-Jun 12-Jun 17-Jun0
40
80
20
60
100
Ca Mg Na K Cl No3 SO4
Cum
ulat
ive
mel
twat
er f
lux
to ly
sim
eter
(m
m)
Cum
ulat
ive
ion
flux
toly
sim
eter
(m
g m
-2)
Mel
t wat
er fl
ux
(c)
3.5
4.0
4.5
5.0
5.5
6.0
6.5
0
2
4
6
8
Con
cent
ratio
n fa
ctor
pH
pH
(b)
0
100
200
300
400
500
600
SWE
(m
m)
(a)
23 May: melt water firstdetected in lysimeter 4 - 8 June
cold period
21 May: 25 May:snowmeltlysimeterinstalled.
Snow-freedownslopeof drift.
Figure 3. (a) The ablation of the late-lying snowdrift at the study plot in 1992; (b) the temporal variation in concentration factor and pH ofthe melt water collected from the base of the snowpack; and (c) the cumulative flux of ions and water from the snowdrift to the snowmelt
lysimeter
decreasing in the melt water (Figure 4). During 9–13 June, the largest increase in concentrations occurredover the first 3 m of overland flow. The average concentration of all ions, except for NO3
�, increased by oneto two orders of magnitude in the 3 m flow distance, with the largest increase occurring for Ca2C (178-fold),followed by Mg2C (38-fold), and then KC (29-fold). The change in ion concentrations over the next flowincrement (3 m to 20 m) was considerably lower, as the average concentration at 20 m during this period
Copyright 2006 John Wiley & Sons, Ltd. Hydrol. Process. 20, 2901–2919 (2006)

2910 W. L. QUINTON AND J. W. POMEROY
Table I. The weighted average ion concentrations of the three major layers in the parent snow of the snowdrift; the averageion concentration of the meltwater percolate for the period over which melt water was sampled from the snow lysimeter (23May–13 June 1992), and the average ion concentrations for the 31 May–3 June and 9–13 June periods measured at thesnowmelt lysimeter, at 3 m and 20 m downslope of the edge of the snowdrift along the rill conducting overland flow (OLF)
to the stream bank at the study plot in 1992
Period Sample type Ion concentration (µeq l�1)
Ca2C Mg2C NaC KC Cl� NO3� SO4
2�
6 May Parent snow 0Ð50 1Ð99 4Ð25 1Ð28 6Ð05 2Ð42 3Ð0423 May–13 June Percolate 1Ð59 3Ð39 8Ð49 0Ð41 12Ð45 2Ð03 2Ð42
31 May–3 June Percolate 0Ð71 1Ð62 4Ð81 0Ð22 6Ð11 1Ð10 1Ð4OLF (20 m) 84Ð0 68Ð5 35Ð3 20Ð7 54Ð9 — 4Ð0
9–13 June Percolate 0Ð12 0Ð22 0Ð62 0Ð32 0Ð84 0Ð05 0Ð17OLF (3 m) 21Ð3 8Ð3 12Ð03 9Ð23 14Ð22 — 2Ð85OLF (20 m) 34Ð33 27Ð78 15Ð80 9Ð66 13Ð09 — 1Ð32
was between 0Ð46 and 3Ð35 times what it was at 3m (Table I). For 31 May to 3 June and 9 to 13 June, Ca2C
and Mg2C had replaced NaC and Cl� as the dominant ions along the 20 m overland flowpath.In 1992, too few overland flow samples were collected to determine whether the ion pulse, which entered
the hillslope from the snowdrift (Figure 3b), was preserved through the 20 m overland flowpath. However, in1993, a sufficient number of samples were collected to show clearly a breakthrough of acidic, ion-rich waterentering the stream (Figure 5a). The arrival of the ion-rich water at the stream was relatively early in therunoff period (5 June), by which time only 30% of the cumulative overland flow had occurred (Figure 5b).The limited snowmelt lysimeter data during 1993 (five sample days) indicated that Cl� and NaC dominatedthe melt water percolating from the snowdrift, as during 1992 (Figure 3c). Figure 5a also indicates that, as in1992, Ca2C and Mg2C were the dominant ions in the overland runoff water entering the stream.
Percolation through unsaturated soil. The 0Ð25 m vertical pathway represents unsaturated soil flow fromthe ground surface to the top of the soil lysimeters. The ion concentrations in the deionized water applied tothe top of the soil (Table II) were similar to that of the relatively dilute snowmelt percolate (e.g. 9–13 June;Table I). Ion concentrations increased one to two orders of magnitude; and, as with overland flow, SO4
2�concentration also increased in the soil percolate, whereas NO3
� remained below the analytical detectionlimit. The increase in ion concentration of the deionized water over the 0Ð25 m of soil percolation pathway(Table II) is roughly equivalent to that which occurred over the first 3 m of overland flow (Table I). The sameexperiment conducted using rainfall rather than deionized water as the input yielded similar results, with theexception of the behaviour of NO3
� and SO42�, whose concentrations were lower in the soil lysimeters than
in the rainfall (Table II). However, this difference is governed by the high average concentrations of SO42�
(9Ð7 µeq l�1) and NO3� (4Ð3 µeq l�1) in the rainfall, where only Ca2C had a higher average concentration. The
SO42� concentration in the rainfall was about twice that of the peak SO4
2� level in the snowmelt percolate,and an order of magnitude higher than the concentrations in the relatively dilute melt water percolate of the9–13 June period.
Subsurface drainage. Ion concentrations in the soil saturated zone (Figure 4) peaked within 3 days followingthe peak in the ion concentrations in the melt water (Figure 3b), and then slowly decreased, so that by 17 June,2 days before the snowdrift disappeared, the concentrations had returned near to their initial values of 26 May.The ion concentration in the saturated layer varied with the seasonal evolution of the hillslope hydrologydiscussed above. For example, on 31 May, the ion concentrations measured in the saturated layer were verysimilar to those measured in the overland flow arriving at the stream bank (Table III). By 10 June, several
Copyright 2006 John Wiley & Sons, Ltd. Hydrol. Process. 20, 2901–2919 (2006)

TRANSFORMATIONS OF RUNOFF CHEMISTRY IN ARCTIC TUNDRA 2911
0
20
40
60
80
100
0
0
1
1
2
2
3
3
4
4
5
5
6
7
26-May 26-May
26-May 26-May
26-May 26-May
26-May
21-May 21-May
21-May 21-May
21-May 21-May
21-May
31-May 31-May
31-May 31-May
31-May 31-May
31-May
5-Jun 5-Jun
5-Jun 5-Jun
5-Jun 5-Jun
5-Jun
10-Jun 10-Jun
10-Jun 10-Jun
10-Jun 10-Jun
10-Jun
15-Jun 15-Jun
15-Jun 15-Jun
15-Jun 15-Jun
15-Jun
20-Jun 20-Jun
20-Jun 20-Jun
20-Jun 20-Jun
20-Jun
25-Jun 25-Jun
25-Jun 25-Jun
25-Jun 25-Jun
25-Jun
0
40
80
120
160
0
20
40
60
80
100
120
140
0
0
5
10
10
15
20
20
25
30
30
35
40
40
50
60
(a) Ca2+
9 - 13 June 9 - 13 June
(e) C1-
(b) Mg2+ (f) No3-
(g) So42-(c) Na+
mic
ro e
q. /
L
(d) K+
Melt water percolate to lysimeter in the drift
OLF 3 m downslope of drift
OLF 20 m downslope of drift
Subsurface runoff measured in stilling well15 m downslope of drift
Figure 4. The ion concentration in the (i) melt water percolate from the snowdrift, (ii) overland flow (OLF) at 3 m downslope of thesnowdrift, (iii) overland flow at 20 m downslope of the snowdrift, and (iv) subsurface runoff through the peat matrix sampled from the well15 m downslope of the snowdrift. The period 9–13 June when samples were collected from the 0 m (lysimeter), 3 m and 20 m sampling
points is identified for each ion
Copyright 2006 John Wiley & Sons, Ltd. Hydrol. Process. 20, 2901–2919 (2006)

2912 W. L. QUINTON AND J. W. POMEROY
0
20
40
60
80
100
120
140
(a) 26-May 31-May 5-Jun 10-Jun 15-Jun 20-Jun4.5
5.0
5.5
6.0
mic
ro e
q. /
L
pH
pH
Ca2+ Mg2+ Na+ K+ C1- No3- So4
2-
(b) 26-May 31-May 5-Jun 10-Jun 15-Jun 20-Jun0
10
20
30
40
50
60
70
80
90
L /
min
ute
Figure 5. (a) The change in ion concentration and pH in the surface water draining from the study plot 20 m downslope of the snowdrift in1993; (b) the overland flow rate continuously measured at the same location
Table II. The ion concentrations of the input and output water for the soil percolation experiments. The input concentrationsare of (1) the deionized water applied to the ground surface during a rain-free period and (2) the average values for the fourrainfall events that occurred between 4 June and 23 July 1992. The output concentrations are the average values of the water
collected in the soil lysimeters
H2O type Ion concentration (µeq l�1)
Ca2C Mg2C NaC KC Cl� NO3� SO4
2�
Deionized Input 1Ð50 0Ð83 2Ð17 0Ð26 1Ð98 — —Output 37Ð15 29Ð58 50Ð98 24Ð87 17Ð51 — 3Ð59
Rainfall Input 10Ð75 4Ð17 2Ð17 3Ð14 2Ð54 4Ð26 9Ð74Output 18Ð0 19Ð17 31Ð74 27Ð69 31Ð92 0Ð00 2Ð92
Copyright 2006 John Wiley & Sons, Ltd. Hydrol. Process. 20, 2901–2919 (2006)

TRANSFORMATIONS OF RUNOFF CHEMISTRY IN ARCTIC TUNDRA 2913
Table III. Ion concentrations of the melt water percolate from the snowdrift, overland flow (OLF) at the stream bank (i.e.20 m), subsurface flow (SSF) sampled from the observation well downslope of the snowdrift, and discharge from the outletof the two main soil pipes at the stream bank on 31 May, 10 June and 17 June. For each date, the average depth of the frost
table (FT) below the ground surface is given
Date FT (m) Sample Ion concentration (µeq l�1)
Ca2C Mg2C NaC KC Cl� NO3� SO4
2�
31 May 0Ð22 Meltwater 1Ð43 3Ð17 8Ð66 0Ð31 12Ð20 2Ð37 2Ð89OLF 137Ð0 99Ð17 50Ð43 26Ð41 88Ð14 0Ð00 4Ð79SSF 126Ð5 95Ð0 24Ð35 22Ð05 23Ð16 0Ð00 1Ð25
10 June 0Ð29 Meltwater 0Ð36 0Ð46 1Ð00 0Ð73 0Ð30 0Ð00 0Ð28OLF 39Ð5 33Ð93 19Ð13 11Ð28 15Ð54 0Ð00 1Ð46SSF 74Ð5 57Ð5 22Ð17 11Ð03 14Ð69 0Ð00 1Ð25Pipe 6 16Ð0 15Ð0 13Ð48 8Ð21 12Ð43 0Ð00 2Ð29Pipe 9 22Ð50 18Ð33 13Ð04 11Ð28 10Ð17 0Ð00 1Ð25
17 June 0Ð33 Meltwater 0Ð00 0Ð07 0Ð45 0Ð14 0Ð61 0Ð08 0Ð12OLF 31Ð00 26Ð67 15Ð22 8Ð72 12Ð15 0Ð00 1Ð04SSF 30Ð00 27Ð50 10Ð00 9Ð74 8Ð76 0Ð16 2Ð08Pipe 6 8Ð00 8Ð33 7Ð83 6Ð15 9Ð04 0Ð00 1Ð46Pipe 9 10Ð00 8Ð33 8Ð70 6Ð15 9Ð60 0Ð00 1Ð88
soil pipes had begun discharging water from their stream bank outlets (Table III). This water was relativelydilute compared with the enriched water draining through the soil matrix and over the ground surface. By 17June, when percolation to the snowmelt lysimeter had ceased, the concentration of all ions except for KC inthe water draining through the two main soil pipes increased at least by a factor of 2, and for Ca2C, Mg2Cand SO4
2�, by ¾5 to 10 times.
Stream flow. At the middle gauging station, 30 m downstream of the study plot (Figure 1), three distincthydrochemical regimes occurred that closely mirror the variations in ion chemistry observed in the hillslopeflowpaths (Figure 6a). The early stage occurred from the onset of stream flow (30 May at 23 : 00; Figure 6b)until the highly concentrated initial pulse of ion-rich water passed the middle gauging station. During thisstage, the streamwater was characterized by a relatively high concentration of Ca2C, Mg2C and Cl�, andlow pH values. The middle stage occurred in the period 3–12 June, and was characterized by relativelyacidic water, although the concentrations of each ion were substantially lower, and NaC replaced Cl� asthe dominant ion following Ca2C and Mg2C. The late stage began by mid June, and was characterized byincreasing concentrations of Ca2C, Mg2C, NaC and SO4
2� in the stream (Figure 6a). The pH of the streamwateralso increased during this stage, from ¾5Ð1 to over 6Ð0.
Mass balance
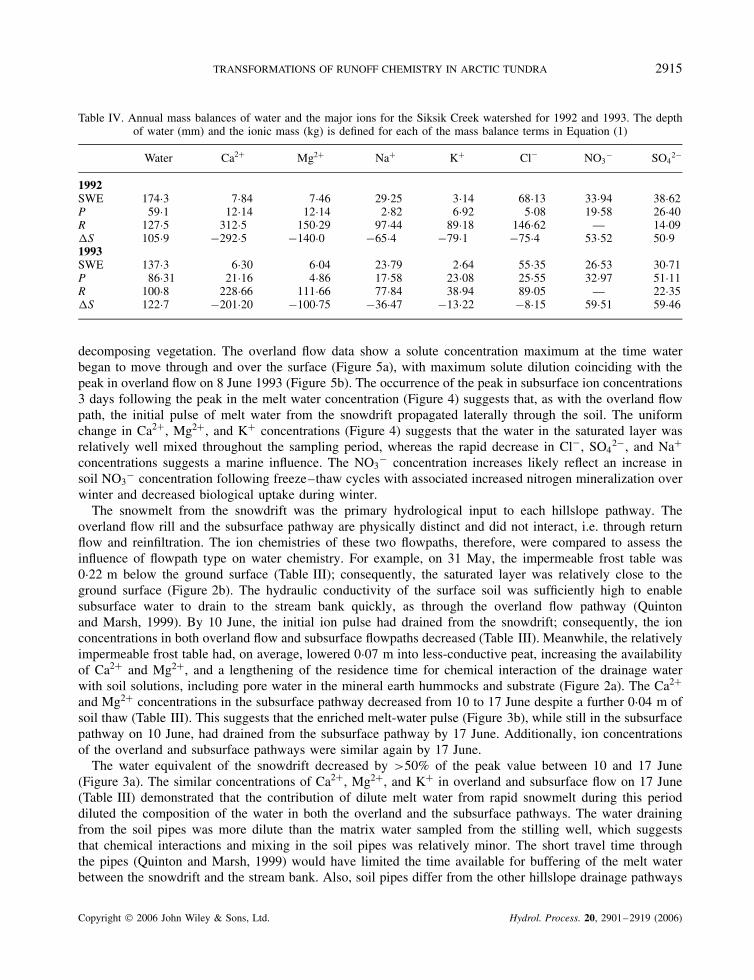
In both years, the annual runoff ratio (�SWE C P�/R) was ¾0Ð5, and R was ¾0Ð73 of the SWE (Table IV).The storage term provides a crude estimate of the evapotranspiration flux. The ion mass balance indicatesthat, at Siksik Creek, there is a net export of Ca2C, Mg2C, NaC, KC and Cl�. In the case of Ca2C and Mg2C,the mass export from the basin was an order of magnitude above that which was introduced by snowmelt andrainfall. Unlike for the other ions, there was a net import of NO3
� and SO42�.
DISCUSSION
Preferential elution (Davies et al., 1987), dry deposition during snowmelt and possibly biological consumptionof NO3
� is indicated by the variation of CF values among the ion species eluted from the snowdrift (Figure 3b).
Copyright 2006 John Wiley & Sons, Ltd. Hydrol. Process. 20, 2901–2919 (2006)

2914 W. L. QUINTON AND J. W. POMEROY
21-May 31-May 10-Jun 20-Jun 30-Jun 10-Jul 20-Jul0
0.05
0.10
0.15
0.2
0.25
(b)
m3
/ s Stream flowbegan atMiddlegaugingstation on30 Mayat 23:00
4-8 Junecold
period
0
100
200
300
400
500
600
21-May 31-May 10-Jun 20-Jun 30-Jun 10-Jul 20-Jul4.5
5.0
5.5
6.0
6.5
7.0
pH
pH
Ca2+ Mg2+ Na+ K+ C1- No3- So4
2-
(a)
mic
ro e
q. /
L
Early Middle Late
Figure 6. (a) The concentration of the major ions and the pH in the streamwater sampled from the middle gauging station on Siksik Creek,located 30 m downstream of the study plot; (b) discharge from Siksik Creek measured at the middle gauging station. The dashed line is
used to connect the time between the initiation of open channel flow (30 May at 23 : 00) and the first discharge measurement
The high CF for Ca2C, NaC, Cl� and Mg2C at each snow pit was likely the result of dry deposition, i.e. oflocal vegetation, mineral matter and sea salt aerosols, during snowmelt; while the relatively low CF valuesfor NO3
� and SO42� reflect the low input of these ions over winter. Since no melt water accumulated in
the snow lysimeter from installation on 21 May until 23 May (Figure 3a), it is unlikely that the NO3� and
SO42� eluted from the pack prior to the monitoring of snowpack chemistry. The possibility that these ions
eluted from the pack through preferential pathways which by-passed the lysimeter also seems unlikely, sincethe cumulative depth of ¾500 mm melt water collected in the lysimeter (Figure 3c) is similar to the pre-meltSWE above the lysimeter (Figure 3a).
The substantial increases in Ca2C, Mg2C, NaC, Cl� and KC along the overland flow pathway were almostcertainly due to mixing of the melt water with the more highly concentrated soil solutions enriched by the
Copyright 2006 John Wiley & Sons, Ltd. Hydrol. Process. 20, 2901–2919 (2006)
TRANSFORMATIONS OF RUNOFF CHEMISTRY IN ARCTIC TUNDRA 2915
Table IV. Annual mass balances of water and the major ions for the Siksik Creek watershed for 1992 and 1993. The depthof water (mm) and the ionic mass (kg) is defined for each of the mass balance terms in Equation (1)
Water Ca2C Mg2C NaC KC Cl� NO3� SO4
2�
1992SWE 174Ð3 7Ð84 7Ð46 29Ð25 3Ð14 68Ð13 33Ð94 38Ð62P 59Ð1 12Ð14 12Ð14 2Ð82 6Ð92 5Ð08 19Ð58 26Ð40R 127Ð5 312Ð5 150Ð29 97Ð44 89Ð18 146Ð62 — 14Ð09S 105Ð9 �292Ð5 �140Ð0 �65Ð4 �79Ð1 �75Ð4 53Ð52 50Ð91993SWE 137Ð3 6Ð30 6Ð04 23Ð79 2Ð64 55Ð35 26Ð53 30Ð71P 86Ð31 21Ð16 4Ð86 17Ð58 23Ð08 25Ð55 32Ð97 51Ð11R 100Ð8 228Ð66 111Ð66 77Ð84 38Ð94 89Ð05 — 22Ð35S 122Ð7 �201Ð20 �100Ð75 �36Ð47 �13Ð22 �8Ð15 59Ð51 59Ð46
decomposing vegetation. The overland flow data show a solute concentration maximum at the time waterbegan to move through and over the surface (Figure 5a), with maximum solute dilution coinciding with thepeak in overland flow on 8 June 1993 (Figure 5b). The occurrence of the peak in subsurface ion concentrations3 days following the peak in the melt water concentration (Figure 4) suggests that, as with the overland flowpath, the initial pulse of melt water from the snowdrift propagated laterally through the soil. The uniformchange in Ca2C, Mg2C, and KC concentrations (Figure 4) suggests that the water in the saturated layer wasrelatively well mixed throughout the sampling period, whereas the rapid decrease in Cl�, SO4
2�, and NaC
concentrations suggests a marine influence. The NO3� concentration increases likely reflect an increase in
soil NO3� concentration following freeze–thaw cycles with associated increased nitrogen mineralization over
winter and decreased biological uptake during winter.The snowmelt from the snowdrift was the primary hydrological input to each hillslope pathway. The
overland flow rill and the subsurface pathway are physically distinct and did not interact, i.e. through returnflow and reinfiltration. The ion chemistries of these two flowpaths, therefore, were compared to assess theinfluence of flowpath type on water chemistry. For example, on 31 May, the impermeable frost table was0Ð22 m below the ground surface (Table III); consequently, the saturated layer was relatively close to theground surface (Figure 2b). The hydraulic conductivity of the surface soil was sufficiently high to enablesubsurface water to drain to the stream bank quickly, as through the overland flow pathway (Quintonand Marsh, 1999). By 10 June, the initial ion pulse had drained from the snowdrift; consequently, the ionconcentrations in both overland flow and subsurface flowpaths decreased (Table III). Meanwhile, the relativelyimpermeable frost table had, on average, lowered 0Ð07 m into less-conductive peat, increasing the availabilityof Ca2C and Mg2C, and a lengthening of the residence time for chemical interaction of the drainage waterwith soil solutions, including pore water in the mineral earth hummocks and substrate (Figure 2a). The Ca2C
and Mg2C concentrations in the subsurface pathway decreased from 10 to 17 June despite a further 0Ð04 m ofsoil thaw (Table III). This suggests that the enriched melt-water pulse (Figure 3b), while still in the subsurfacepathway on 10 June, had drained from the subsurface pathway by 17 June. Additionally, ion concentrationsof the overland and subsurface pathways were similar again by 17 June.
The water equivalent of the snowdrift decreased by >50% of the peak value between 10 and 17 June(Figure 3a). The similar concentrations of Ca2C, Mg2C, and KC in overland and subsurface flow on 17 June(Table III) demonstrated that the contribution of dilute melt water from rapid snowmelt during this perioddiluted the composition of the water in both the overland and the subsurface pathways. The water drainingfrom the soil pipes was more dilute than the matrix water sampled from the stilling well, which suggeststhat chemical interactions and mixing in the soil pipes was relatively minor. The short travel time throughthe pipes (Quinton and Marsh, 1999) would have limited the time available for buffering of the melt waterbetween the snowdrift and the stream bank. Also, soil pipes differ from the other hillslope drainage pathways
Copyright 2006 John Wiley & Sons, Ltd. Hydrol. Process. 20, 2901–2919 (2006)
2916 W. L. QUINTON AND J. W. POMEROY
in that they contained very little stored water (Quinton, 1997). As a result, there would have been only limitedmixing of the melt water with in situ water along this pathway. In contrast, water flowing through the soilmatrix and over the ground surface would more readily interact and mix with water stored in the soil andvegetation, as well as in depressions.
The three hydrochemical stages observed for stream flow roughly coincided with the hydrological conditionsof the adjacent hillslope study plot. The relatively high flow rates through each hillslope pathway early inthe melt-runoff period resulted in connectivity of the hillslope with the stream, as indicated by the similaritybetween the ion concentrations of the hillslope flowpaths and the stream channel. For example, the initial peakin ion concentrations at the middle station (Figure 6a), located 30 m downstream of the study plot, occurredshortly after the peak in ion concentration in the melt water percolate from the snowdrift (Figure 3b); andthe minimum pH of the stream channel (4Ð65) occurred within 1 day of the minimum pH of the melt waterpercolate (3Ð87) and of the overland runoff (4Ð51). The initial streamwater ion concentration peak occurredprior to the initiation of open channel flow (Figure 6b), indicating that substantial solute flux occurred throughthe channel while it was still filled with snow.
The middle geochemical stage (3–12 June) coincided with the period of high melt water input from thesnowdrift, and extensive dilution of the overland flow and subsurface pathways on the hillslope. By the lategeochemical stage in the stream, the hillslope input was provided by subsurface drainage. The relativelydeep position of the frost table on the hillslopes at this time (Figure 2b) resulted in increased travel timeto the stream bank, which increased the time for chemical exchange between mobile soil water and mineralsediments, and for water–vegetation interactions (e.g. microbial uptake of NO3
� and SO42�). However, in
this stage, there appeared to be a decline in the influence of hillslope processes on the ion chemistry in thechannel reach. The increase in the Ca2C and Mg2C concentrations in the channel with time (Figure 6a) couldalso reflect an increase in the importance of within-stream processes, as reported by Teare (1998), who showedthat pH and the concentrations of Ca2C and Mg2C, increased through the summer period in Trail Valley Creek(Figure 1) due to increased exposure of streamwater to the calcareous stream sediments during low flows.
The annual solute budget indicates that the early high solute concentrations in streamwater came frominitial melt waters mobilizing an accumulation of soil solutes (both from abiotic and biotic processes) thathad accumulated over winter, not from the small solute inputs from snowmelt (Table IV). The much lowerion concentrations of pipe flow than matrix flow support this hypothesis, as it indicates that the snowdriftis important, not through its direct contribution of snow-derived ions, but rather as a medium of transportof eluted solutes from the soils. The large export of Ca2C and Mg2C from the basin was expected giventhe increasing concentration of these ions with flow distance along the hillslope and stream channel. Thenet export of the NaC and KC has also been reported for other Arctic basins (e.g. Hinzman et al., 1998),and in this case is likely due to flushing of dry deposition of sea salts from the active layer. NO3
� appearsto be strongly retained in this environment once overland flow ceases and the slower, subsurface flowpathsprevail.
The concentrations of NO3� and SO4
2� generally diminished with flow distance along all segments ofthe overall pathway leading to the basin outlet, indicating that biological assimilation and other processesremoved these ions from solution. In the case of NO3
�, net mineralization during the growing season ismuch lower than the vegetation demand; as a result, the aquatic export or consumption of inorganic nitrogenfrom basins with tundra or peat soils is often reported as negligible (e.g. Soulsby et al., 1998; Brooks andWilliams, 1999). The retention of SO4
2� suggests that industrial pollution derived from Arctic aerosol (Jones,1991) is retained in the terrestrial ecosystem, although Table IV indicates that the retention of SO4
2� is only¾0Ð5 kg ha�1 year�1, which is likely within budget errors.
Sources of error in the ion mass balance computations include errors in the field measurements of SWE, Pand R (Table IV), and errors in the laboratory analyses of water samples. Measurements of SWE using snowtubes have been reported to overestimate the water equivalent by up to 10% (Goodison et al., 1981). The valueof P is likely a conservative estimate, because it does not include the numerous trace events common at highlatitudes. The change in storage term S provides a crude estimate of the annual basin evapotranspiration
Copyright 2006 John Wiley & Sons, Ltd. Hydrol. Process. 20, 2901–2919 (2006)

TRANSFORMATIONS OF RUNOFF CHEMISTRY IN ARCTIC TUNDRA 2917
for 1992 (106 mm) and 1993 (123 mm). These values are consistent with the findings of Marsh et al. (2004),who reported an average annual evapotranspiration of 110 mm for a 9 year study period at Trail Valley Creek(Figure 1).
During the laboratory analyses, numerous blank samples for bags, bottles, filters and analytical equipmentwere consistently below the limit of detection, indicating that no measurable contamination of samplesoccurred. The level of precision and limits of detection of the atomic absorption spectrophotometers and theion chromatograph are normally at least an order of magnitude less than the levels measured in the relativelydilute melt water and snow samples. Every tenth sample was rerun in order to check the reproducibility ofanalytical results. For all ion species, concentrations for all duplicates were within 5% of the original analysisof the sample.
An ion charge balance (cations minus anions) was computed for each sample as a quality control index.The charge balance residuals for the snow and melt-water samples were typically less than 15% of totalanions plus cations, suggesting that the concentrations of most of the major ions were determined. However,for hillslope runoff and stream-flow samples, a substantial charge imbalance (cation excess) developed as thethaw season progressed. This has also been reported for other Arctic streams (e.g. Everett et al., 1989), andhas been attributed to leaching of organic acids (Bursey et al., 1991). A review of the literature suggests thatHCO�
3 is the dominant ion missing from the ion balance, followed by organic anions.
CONCLUSIONS
This paper traced the transformation of the snowmelt water chemical composition during melt, elution andrunoff in an Arctic tundra basin. By relating the chemistry of the water flowing through the major flowpathtypes between the surface of melting snow and the basin outlet to the major hydrological processes operatingwithin each flowpath type, this paper offers a physically based explanation for the transformation of majorion concentrations and loads of runoff water arising from snowmelt and rainfall in this environment. Themechanism for hydrochemical change of runoff water was mainly dilution by snowmelt with little or nochemical alteration by snowmelt solutes. The initial pulse of ion-rich melt water from the snowdrift flowedover and through the soil at a similar rate, owing to limited active layer development and the high hydraulicconductivity near the ground surface. Maximum dilution occurred with the peak flow rate in overland flow,and several days later in the subsurface pathway, owing to the lower flow rate through the peat matrix thanover the ground surface. As this initial pulse was conveyed through hillslope flowpaths, the concentrationsof most ions increased, the duration of the ion breakthrough lengthened, and NaC and Cl�, the major ions inthe snowmelt percolate arriving at the ground surface, were replaced with Ca2C and Mg2C.
The three hydrochemical stages observed for stream flow reflect the hydrological conditions of the adjacenthillslopes. The hydrochemistry of the stream channel and hillslopes was closely connected early in thesnowmelt runoff period, due to the rapid lateral transit times through all hillslope pathways. Much of thishydrochemical stage preceded open channel flow in the stream. The main snowmelt runoff hydrograph peakin the stream occurred in the middle hydrochemical stage, which coincided with the period of high melt-water input from the snowdrift, and extensive dilution of the overland flow and subsurface pathways on thehillslope. The influence of the hillslope hydrology on stream hydrochemistry appeared to be lowest in the latestage, when all hillslope input was provided by subsurface drainage, and in-stream hydrochemical processesappeared to be increasingly important.
ACKNOWLEDGEMENTS
We wish to thank Cuyler Onclin, Joni Onclin, Brenda Sørensen and Carolyn Teare for their assistancein the field. We wish to thank Dr Don Gray of the University of Saskatchewan for helpful discussionsregarding hillslope runoff, and Dr Philip Marsh of the National Hydrology Research Institute for his insights
Copyright 2006 John Wiley & Sons, Ltd. Hydrol. Process. 20, 2901–2919 (2006)

2918 W. L. QUINTON AND J. W. POMEROY
into melt water percolation through snowpacks. Financial support for this research was provided by theCanadian GEWEX programme, the Canadian Foundation for Climate and Atmospheric Sciences (CFCAS),and the Natural Sciences and Engineering Research Council of Canada (NSERC). Logistical support wasprovided by the Polar Continental Shelf Project (Department of Energy, Mines and Resources), the AuroraResearch Institute (Government of the Northwest Territories), and the Northern Scientific Training Programme(Department of Indian and Northern Affairs). We also wish to thank the four anonymous referees for theirmany helpful comments and suggestions.
REFERENCES
AES. 1982a. Temperature 1951–1980 . Canadian Climate Normals, vol. 2. Atmospheric Environment Service, Environment Canada: Toronto.AES. 1982b. Precipitation 1951–1980 . Canadian Climate Normals, vol. 3. Atmospheric Environment Service, Environment Canada: Toronto.Bliss LC, Matveyeva NV. 1992. Circumpolar arctic vegetation. In Arctic Ecosystems in a Changing Climate: An Ecological Perspective,
Chapin III FS, Jefferies RL, Reynolds JF, Shaver GR, Svoboda J (eds). Academic Press: San Diego; 59–89.Brooks PD, Williams MW. 1999. Snowpack controls on nitrogen cycling and export in seasonally snow-covered catchments. Hydrological
Processes 13: 2177–2190.Bursey GG, Edwards TWD, Frapp SK. 1991. Water balance and geochemical studies in a tundra watershed, District of Keewatin, N.W.T. In
Northern Hydrology, Selected Perspectives , Prowse TD, Ommanney CSL (eds). NHRI Science Report No. 2. National Hydrology ResearchInstitute: Saskatoon; 17–31.
Davies TD, Brimblecombe P, Tranter M, Tsiouris S, Vincent CE, Abrahams P, Blackwood LL. 1987. The removal of soluble ions frommelting snowpacks. In Seasonal Snowcovers: Physics, Chemistry, Hydrology , Jones HG, Orville-Thomas WJ (eds). Reidel: Norwell, MA;337–392.
Goodison BE, Ferguson HL, McKay GA. 1981. Measurement and data analysis. In Handbook of Snow , Gray DM, Male DH (eds). Pergamon.Everett KR, Marion GM, Kane DL. 1989. Seasonal geochemistry of an arctic tundra drainage basin. Holarctic Ecology 12: 279–289.Heginbottom JA, Radburn LK. 1992. Permafrost and ground ice conditions of northwestern Canada . Geological Survey of Canada, Map
1691A, scale 1 : 1 000 000.Hinzman LD, Robinson DW, Kane DL. 1998. A biogeochemical survey of an Arctic coastal wetland. In Seventh International Conference
on Permafrost, Yellowknife, Canada . Centre D’etudes Nordiques, Universite Laval: Laval, Canada; 459–463.Jones HG. 1991. Snow chemistry and biological activity: a particular perspective on nutrient cycling. In Seasonal Snowpacks: Processes
for Compositional Change, Davies TD, Tranter M, Jones HG (eds). NATO ASI Series G, Ecological Sciences, Vol. 28. Springer-Verlag:Berlin; 173–228.
Jones HG, Pomeroy JW. 2001. Early spring snowmelt in a small boreal forest watershed: influence of concrete frost on the hydrology andchemical composition of streamwaters during rain-on-snow events. In Proceedings of the Eastern Snow Conference 58; 209–218.
Jones HG, Pomeroy JW, Walker DA, Hoham RW. 2001. Snow Ecology: An Interdisciplinary Examination of Snow-Covered Ecosystems .Cambridge University Press: Cambridge, UK.
Marsh P. 1991. Water flux in melting snow covers. In Advances in Porous Media, vol. 1, Corapcioglu YM (ed.). Elsevier: 61–124.Marsh P, Pomeroy JW. 1996. Meltwater fluxes at an arctic forest–tundra site. Hydrological Processes 10: 1383–1400.Marsh P, Pomeroy JW. 1999. Spatial and temporal variations in snowmelt runoff chemistry, Northwest Territories, Canada. Water Resources
Research 35: 1559–1567.Marsh P, Woo M-K. 1985. Meltwater movement in natural heterogeneous snowcovers. Water Resources Research 21: 1710–1716.Marsh P, Onclin C, Russell M. 2004. A multi-year hydrological data set for two research basins in the Mackenzie Delta region. In
Proceedings, Northern Research Basins Water Balance, Kane D, Yang D (eds). IAHS Publication No. 290. IAHS Press: Wallingford,UK; 205–212.
Pomeroy JW, Gray DM. 1995. Snowcover accumulation, relocation and management . National Hydrology Research Institute, Science Report7, Environment Canada, Saskatoon.
Pomeroy JW, Davies TD, Tranter M. 1991. The impact of blowing snow on snow chemistry. In Seasonal Snowpacks: Processes ofCompositional Change, Davies TD, Tranter M, Jones HG (eds). NATO ASI Series G, Ecological Sciences, Vol. 28. Springer-Verlag:Berlin; 71–114.
Pomeroy JW, Lesack L, Marsh P. 1993. Relocation of major ions in snow along the tundra–taiga ecotone. Nordic Hydrology 24: 151–168.Pomeroy JW, Marsh P, Jones HG, Davies TD. 1995. Spatial distribution of snow chemical load at the tundra–taiga transition. In
Biogeochemistry of Seasonally Snow-Covered Catchments , Tonnessen TA, Williams MW, Tranter M (eds). IAHS Publication No. 228.IAHS Press: Wallingford, UK; 191–206.
Quinton WL. 1997. Runoff from hummock-covered Arctic tundra hillslopes in the continuous permafrost zone. PhD thesis, University ofSaskatchewan, Saskatoon, Canada (unpublished).
Quinton WL, Marsh P. 1998. Melt water fluxes, hillslope runoff and stream flow in an Arctic permafrost basin. In Seventh InternationalConference on Permafrost, Yellowknife, Canada. Centre D’etudes Nordiques, Universite Laval: Laval, Canada; 921–926.
Quinton WL, Marsh P. 1999. A conceptual framework for runoff generation in a permafrost environment. Hydrological Processes 13:2563–2581.
Quinton WL, Gray DM, Marsh P. 2000. Subsurface drainage from hummock-covered hillslopes in the Arctic tundra. Journal of Hydrology237: 113–125.
Copyright 2006 John Wiley & Sons, Ltd. Hydrol. Process. 20, 2901–2919 (2006)

TRANSFORMATIONS OF RUNOFF CHEMISTRY IN ARCTIC TUNDRA 2919
Schindler DW, Bayley SE. 1993. The biosphere as an increasing sink for atmospheric carbon: estimates from increased nitrogen deposition.Global Biogeochemical Cycles 7: 717–733.
Soulsby C, Chen M, Ferrier RC, Helliwell RC, Jenkins A, Harriman R. 1998. Hydrogeochemistry of shallow groundwater in an uplandScottish catchment. Hydrological Processes 12: 1111–1127.
Sueker JK, Clow DW, Ryan JN, Jarret RD. 2001. Effect of basin physical characteristics on solute fluxes in nine alpine/subalpine basins,Colorado, USA. Hydrological Processes 15: 2749–2769.
Teare CJ. 1998. Spatial and temporal patterns of chemical solute signals in sixteen small tundra streams of the Trail Valley Creek watershedin the western Canadian Arctic. MSc thesis, Department of Geography, Simon Fraser University, Burnaby, Canada (unpublished).
Copyright 2006 John Wiley & Sons, Ltd. Hydrol. Process. 20, 2901–2919 (2006)