transfer validation requirements morning session #2 robert beall, pmp
TRANSCRIPT
Transfer Validation Requirements
Morning Session #2Robert Beall, PMP

Introduction
2Confidential
Robert Beall
2
Transfer Experience Solids Transfer Engineer for Optimization in North America (OPINA) 132 Product transfersManaged Europe to USA NDA product transfers for 3 blockbuster product lines. Head of International transfers between Germany, US and India for WW distribution 18 productsHead of Life-Cycle product transfer for parenteral manufacturing 64 products.Solids Transfer Manager for animal Healthcare products – 32 productsMedical Device Transfer Consultant – 4 productsBiological product transfer leader – 4 products
Hometown: Syracuse, NYHome: Providence, RIFamily: Günther (Son), Maren (Daughter), Calvin (Son)Hobbies: Sailing, Travel, Olympic WeightliftingEducation: RIT BS - Engineering PMP

Agenda
3Confidential
Lifecycle Validation Requirements
1. Regulatory Standards
2. Stage 1 – Development
3. Stage 2 - Validation
4. Stage 3 – Lifecycle
3

Lifecycle Validation Requirements
4
US Regulatory Standards for ValidationSolid Oral Dose / Biological Prod* Medical Device
211.100 (a)211.110(b)211.160 (b)211.165 (a,d)211.84 (b)211.180 (e)
ISO 13485
* These requirements were included in CDER/CBER/ CVM Jan 2011 Process Validation General Principles and Practices.
5
Audience QuickBenchmarking Poll #1
• How many of you have read the 2011 FDA Guidance on Process Validation?
– Yes or No

Process Improvement?
Grandpa’s Car
6
Future Grandkid’s
Car
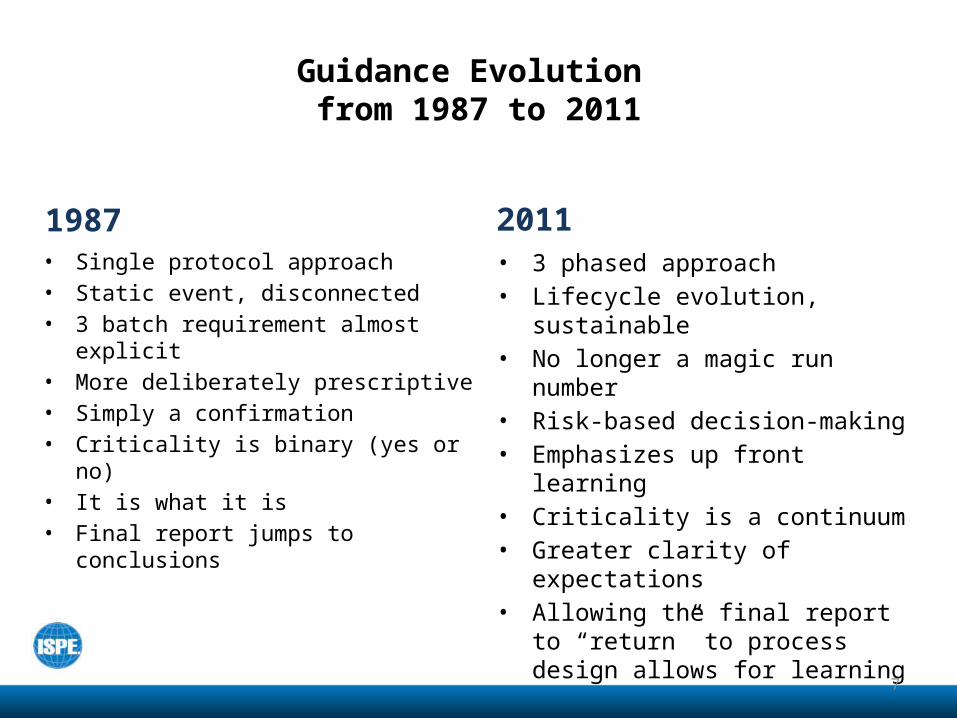
Guidance Evolution from 1987 to 2011
1987• Single protocol approach• Static event, disconnected• 3 batch requirement almost
explicit• More deliberately prescriptive• Simply a confirmation• Criticality is binary (yes or no)• It is what it is• Final report jumps to conclusions
2011• 3 phased approach• Lifecycle evolution, sustainable• No longer a magic run number• Risk-based decision-making• Emphasizes up front learning• Criticality is a continuum• Greater clarity of expectations• Allowing the final report to
“return” to process design allows for learning
7
8
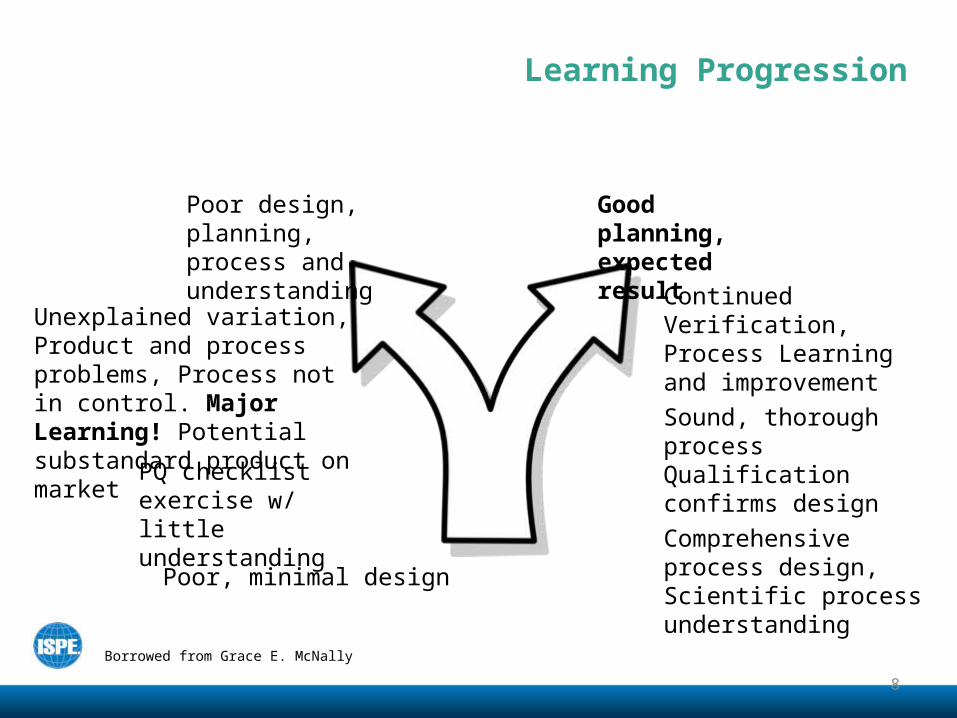
Borrowed from Grace E. McNally
Good planning, expected result
Poor design, planning, process and understanding
Learning Progression
Poor, minimal design
PQ checklist exercise w/ little understanding
Unexplained variation, Product and process problems, Process not in control. Major Learning! Potential substandard product on market
Comprehensive process design, Scientific process understanding
Sound, thorough process Qualification confirms design
Continued Verification,Process Learning and improvement

Approach to Process Validation
Process validation involves a series of activities
taking place over the lifecycle of the product and
process. The guidance describes the process
validation activities in three stages.
9

10
Audience QuickBenchmarking Poll #2
• Does the Process Validation Guidance only apply to Product or Device manufacturing?
– YES or NO?

Lifecycle Staged Approach
11Confidential
STAGE 1PROCESSDESIGN
STAGE 2PROCESSQUALIFICATION
STAGE 3CONTINUEDPROCESSVERIFICATION
COMMERCIALDISTRIBUTION
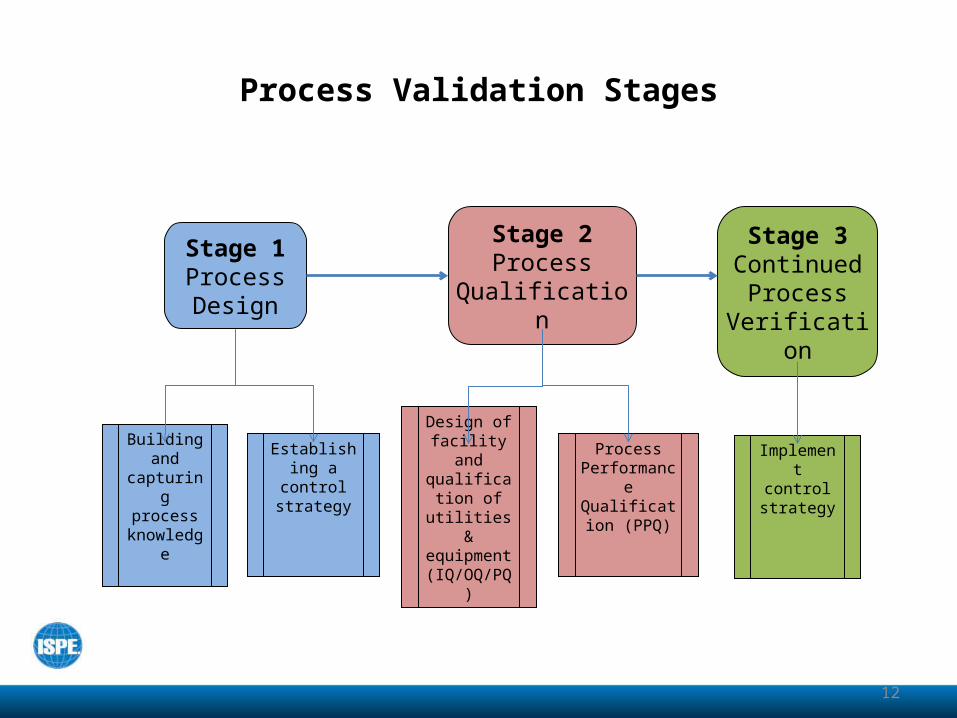
Process Validation Stages
Stage 1Process Design
Stage 2Process
Qualification
Stage 3Continued
Process Verification
Building and capturing process
knowledge
Establishing a control strategy
Design of facility and
qualification of utilities & equipment
(IQ/OQ/PQ)
Process Performance Qualification
(PPQ)
Implement control strategy
12
13
Audience QuickBenchmarking Poll #3
• How many have a life cycle approach documented at their facilities?
– Yes or No

14
Audience QuickBenchmarking Poll #4
• How many just have what we recognize as a Phase 2 approach?
– Yes or No

15
Audience QuickBenchmarking Poll #5
• How many have a developed Phase 3 program in place?
– Yes or No

Schematic of Stages(New Process or Product)
Stage 1
Process DesignEvaluate/Confirm
Stage 2
Process Qualification (PQ)
Design of Facilities &
Qualification of Equipment and Utilities
Process Performance Qualification
(PPQ)
DistributeStage 3
Continued Process
Verification
Distribute
Changes
Changes
Ref: Grace E. McNally FDA (Guide Leader) Sept 15, 2010 16
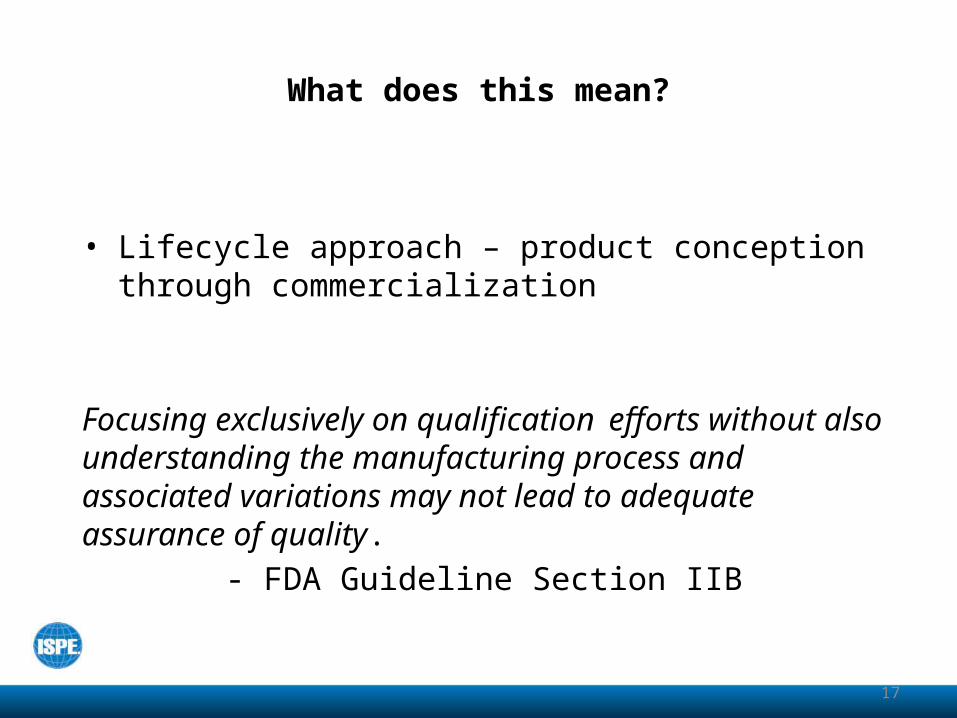
What does this mean?
• Lifecycle approach – product conception through commercialization
Focusing exclusively on qualification efforts without also understanding the manufacturing process and associated variations may not lead to adequate assurance of quality.
- FDA Guideline Section IIB
17
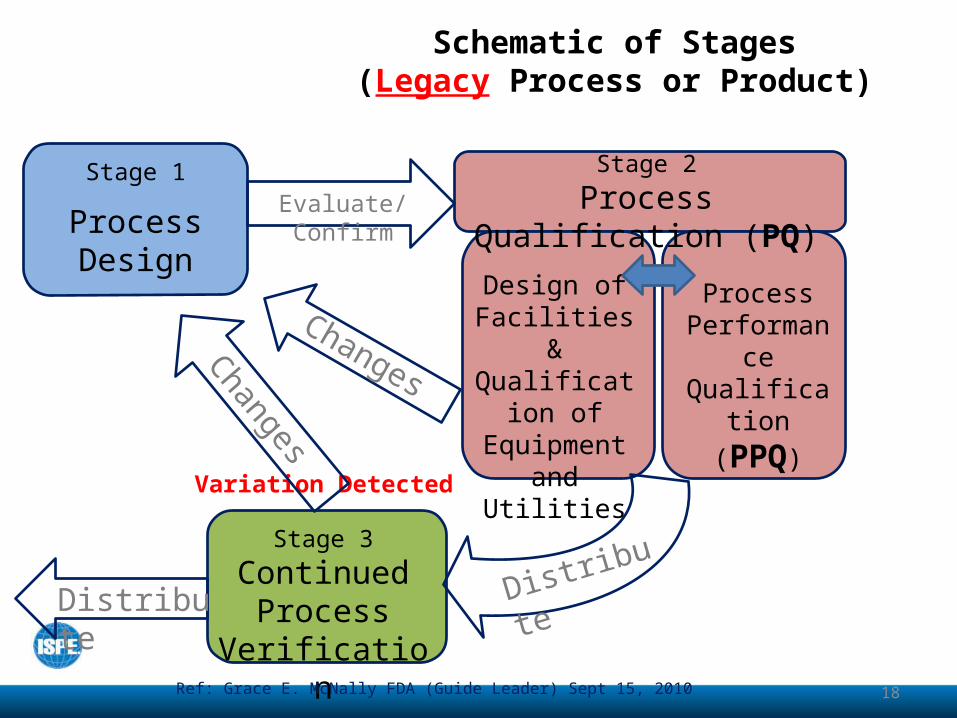
Variation Detected
Schematic of Stages(Legacy Process or Product)
Stage 1
Process DesignEvaluate/Confirm
Stage 2
Process Qualification (PQ)
Design of Facilities &
Qualification of Equipment and Utilities
Process Performance Qualification
(PPQ)
DistributeStage 3
Continued Process
Verification
Distribute
Changes
Changes
Ref: Grace E. McNally FDA (Guide Leader) Sept 15, 2010 18

19
STAGE 1: PROCESS DESIGN
Thoughtful planning very early in Development Sources of knowledge prior to Stage 1
o Previous experience with similar processes (e.g. platform process)
o Product and process understanding from clinical and pre-clinical activities
o Analytical characterizationo Published literatureo Engineering Studies/batcheso Clinical Manufacturing
• Process development and characterization studies
Building and Capturing ProcessKnowledge (Stage 1 – Process Design)

20
STAGE 1: PROCESS DESIGN
Early Stage 1 – Process Developmento Establish Target Product Profile and Quality Target Product
Profile (QTPP) – Living Documentso Identify Critical Quality Attributes (CQAs)o Define the Manufacturing Process
Late Stage 1 – Process CharacterizationScale up, Tech Transfer and Set Design Space Boundaries (optional)
o Perform Quality Risk Assessment Initial Categorization of Parameters
o Perform Process Characterization Experiments (eg DOE, multivariate, univariate)
o Final Categorization of Parameters Based on Criticality and Establish Control Strategy
Deliverables from Stage 1of Process Validation

21
STAGE 1: PROCESS DESIGN
This is done at the initiation of Stage 1 Periodically updated to incorporate any new data that may have been
generated during development Addresses relevant characteristics that include:
o Intended use in a clinical settingo Drug substance quality attributes appropriate to the drug dosage
form being developed (e.g. physical, chemical and biological properties)
o Drug product quality attributes for the intended marketed product (e.g. purity/impurities, stability, sterility, physical and chemical properties)
o Pharmacokinetic characteristics (e.g. dissolution, aerodynamic performance)
o Excipient and component quality attributes, drug –excipient compatibility, and drug container compatibility that affect the process ability, stability or biological effect of the drug product
Quality Target Product Profile (QTPP)

22
STAGE 1: PROCESS DESIGN
Does not include (this is contained in the TPP)o Dosage forms and strengthso Contraindicationso Warnings and Precautionso Adverse Reactionso Drug interactionso Abuse and dependenceo overdose
Quality Target Product Profile (QTPP)

23
STAGE 1: PROCESS DESIGN
Physical, chemical, biological or microbiological properties or characteristics that should be within an appropriate limit, range or distribution to ensure the desired product quality
CQAs are NOT synonymous with specifications Several CQAs may be detected by a single test method CQAs with corresponding Criticality Risk Assessment and desired
confidence CQAs are subject to change in the early stages of product
development (risk management should allow for an evolution of product and process knowledge
CQAs for commercial products should be defined prior to initiation of Stage 2 activities
Critical Quality Attributes (CQAs)

24
STAGE 1: PROCESS DESIGN
Designed to consistently provide a product that will meet its required quality attributes
Process Description showing process inputs, outputs, yields, in-process tests and controls, and process parameters (set points and ranges) for each unit operationo Process requirements including raw materials, scale and order of
operationso Set points and ranges for process parameterso Identification and quantity of all material flows (addition, wastes and
product streams)o Testing, sampling and in-process controlso Hold times and hold conditions for product and addition solutionso Estimated yields and durationso Sizing for equipment including chromatography columns, filtration units,
etc.o Specific identification (manufacturer, part number) for manufacturing (e.g.
filters) and product components (e.g. vials, stoppers, etc.)o Other information necessary to successfully reproduce the process
Define the Manufacturing Process
25
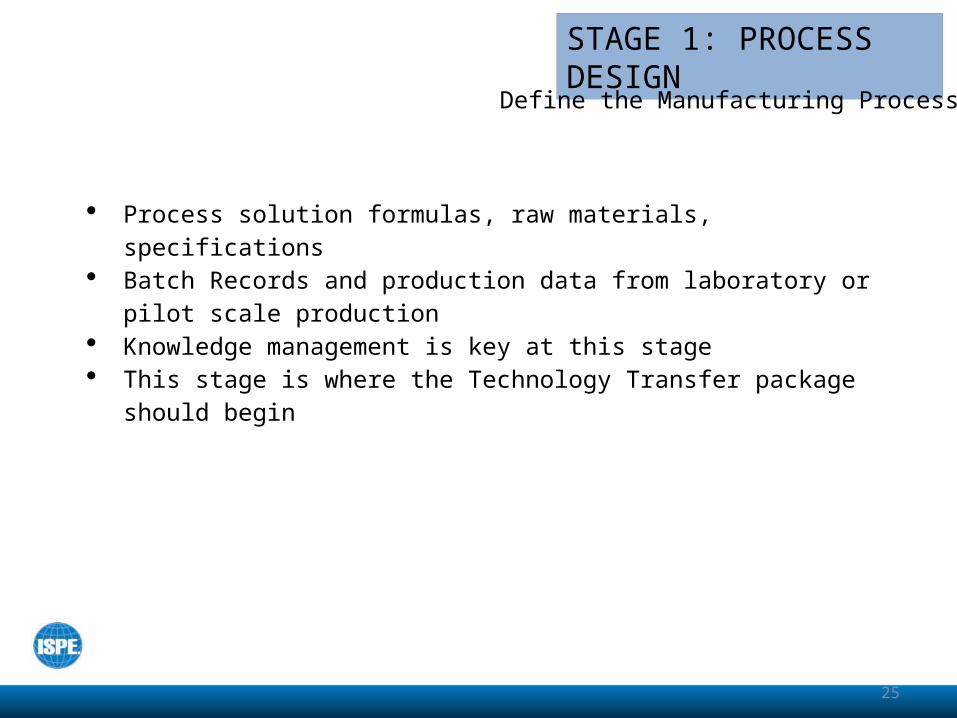
STAGE 1: PROCESS DESIGN
Process solution formulas, raw materials, specifications Batch Records and production data from laboratory or pilot
scale production Knowledge management is key at this stage This stage is where the Technology Transfer package should
begin
Define the Manufacturing Process
26
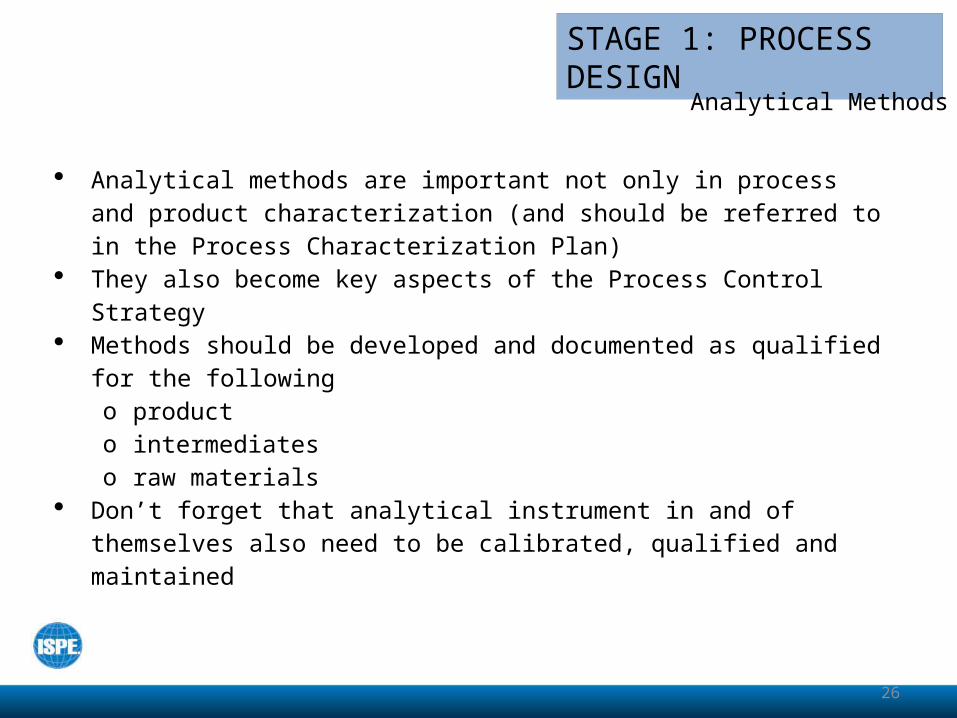
STAGE 1: PROCESS DESIGN
Analytical methods are important not only in process and product characterization (and should be referred to in the Process Characterization Plan)
They also become key aspects of the Process Control Strategy Methods should be developed and documented as qualified for
the followingo producto intermediateso raw materials
Don’t forget that analytical instrument in and of themselves also need to be calibrated, qualified and maintained
Analytical Methods
27
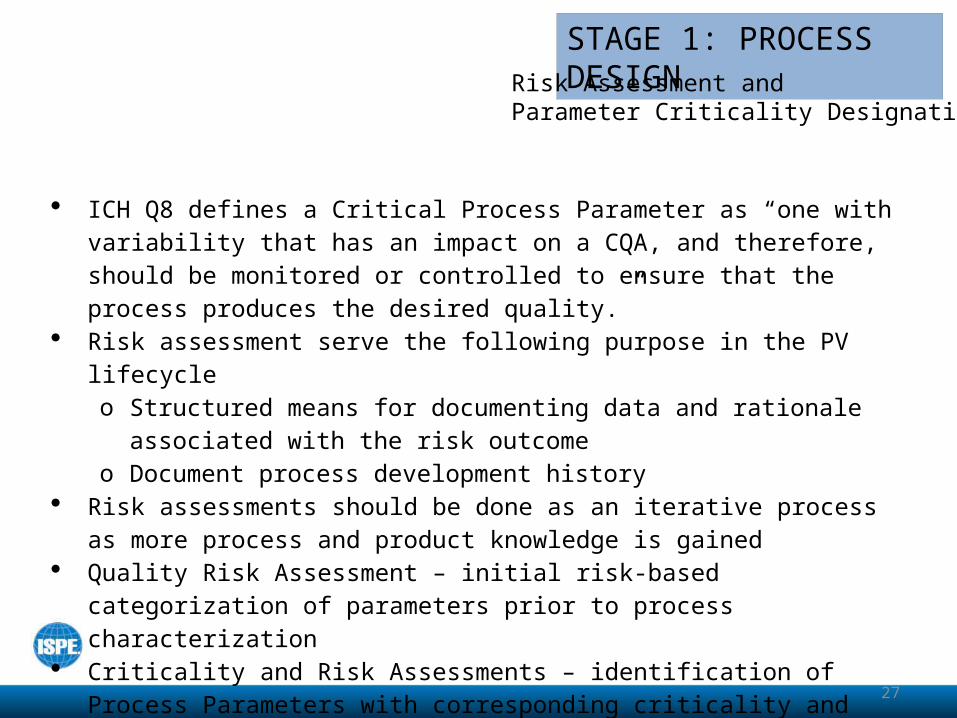
STAGE 1: PROCESS DESIGN
ICH Q8 defines a Critical Process Parameter as “one with variability that has an impact on a CQA, and therefore, should be monitored or controlled to ensure that the process produces the desired quality.”
Risk assessment serve the following purpose in the PV lifecycleo Structured means for documenting data and rationale
associated with the risk outcomeo Document process development history
Risk assessments should be done as an iterative process as more process and product knowledge is gained
Quality Risk Assessment – initial risk-based categorization of parameters prior to process characterization
Criticality and Risk Assessments – identification of Process Parameters with corresponding criticality and risk analysis
Risk Assessment and Parameter Criticality Designation
28
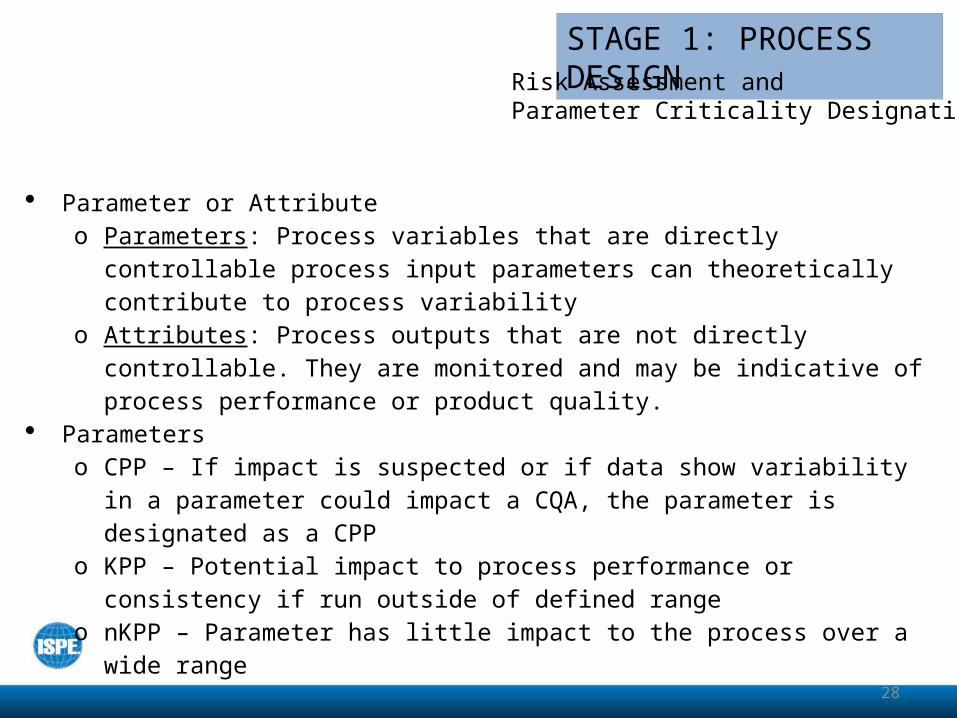
STAGE 1: PROCESS DESIGN
Parameter or Attributeo Parameters: Process variables that are directly controllable process
input parameters can theoretically contribute to process variabilityo Attributes: Process outputs that are not directly controllable. They
are monitored and may be indicative of process performance or product quality.
Parameterso CPP – If impact is suspected or if data show variability in a
parameter could impact a CQA, the parameter is designated as a CPP
o KPP – Potential impact to process performance or consistency if run outside of defined range
o nKPP – Parameter has little impact to the process over a wide range
Risk Assessment and Parameter Criticality Designation
29
STAGE 1: PROCESS DESIGN
Defined as: A set of documented studies in which operational parameters are purposely varied to determine their effect on product quality attributes and process performance
Include: Process Characterization Plan and Protocols. May utilize:o Univariate approaches to find PARo Multivariate approaches to find interactions between process
parameters/ material attributes Useful in:
o defining ranges beyond NORo Setting acceptance criteria for PPQ
Study Data Reports
Process Characterization
30
STAGE 1: PROCESS DESIGN
Scale up/scale down approach (Evaluation/Qualification of Laboratory Models)o Laboratory models need to be verified and justified for full scale
Biotech Chromatography scale down models should compare to full scale including the following parameters:
Yield Eluation Profile Elution Volume Retention Time
Should analyze Product Quality such as Pool Purity Process related impurities Host cell related impurities
Small Molecule Pilot Scale Modeling Solid and liquid oral dosage forms
o 10% of commercial size oro 100,000 units
Process Characterization

31
STAGE 1: PROCESS DESIGN
Characterization tests not included in the product Release Test panelo Tests on Drug Substance, Drug Product and/or Critical
Intermediateso E.g.: Residual DNA levels beyond safety clearance
requirementso Whatever testing is necessary to claim a comprehensive
understanding of the product and process
Product Characterization Test Plan

32
STAGE 1: PROCESS DESIGN
Establishing a control strategy is one of the most important outcomes of Stage 1 Development of an effective control strategy is an iterative process Needs to take into consideration all unit operations in the process All Attributes, Critical or not, are included in the process control strategy (PCS) Raw material / Component Specifications
o Characterized based on their potential risk for Introducing variability Introducing contaminants
o Potential sources in CQA variabilityo Potential sources of process variability
E.g.: Yield, Reaction kinetics, filterability or non-product, quality related effects
o Raw material selection should consider grade (e.g.: purity, chemical and physical characteristics, microbial specifications and endotoxins)
o Relationship of raw materials to product and process essential to controlling variability
Control Strategy

33
STAGE 1: PROCESS DESIGN
In-process and Release specificationso Relationship to product safety, efficacy and product consistencyo Confirmed failure of these specifications should disqualify the product
from use in clinical or commercial applicationso More information can be found in ICH Q6a and Q6b
Q6a = Specifications: Test Procedures and Acceptance Criteria for new drug substances and new drug products: Chemical Substances
Q6b = Specifications: Test Procedures and Acceptance Criteria for Biotechnological/Biological Products
In-process Control limitso Inputs to the processo Checks performed during the production for monitoring and adjustingo Ensures intermediates or product conform to defined specification
Control Strategy
34
STAGE 1: PROCESS DESIGN
Process Parameterso Process outputs that cannot be controlledo Indicators of proper process performanceo E.g.: peak cell density/viability or tablet/capsule disintegration
Process Parameter set points and rangeso Knowing NOR and PAR (with supportive data) can be used to
assess the severity of process deviations caused by parameter excursions
Routine monitoring requirements (including sampling and testing)o Data collection and analysis should begin in Stage 1 and will
become integral parts of Stage 2 and eventually evolves into Stage 3
o E.g.: Flow rates, temperatures, volumes, pH, etc.
Control Strategy
35
STAGE 1: PROCESS DESIGN
Storage and time limitationso Necessary for all intermediates, prepared process solutions and process
steps, drug substance and drug producto These are key to the process control strategy
Process Analytical Technology (PAT)o Maybe used to implement the Process Control Strategyo CQAs may be monitored in real time (in-line and/or at-line)o May be used to adjust CPPs to decrease product variabilityo PAT=process knowledge + equipment automation + analytical
instrumentationo PAT requires a thoroughly characterized process
Including mathematical models of the relationship of CPP to CQAs Stage 1 must deliver a scheme and algorithm for adjusting CPPs based
on process responseo Design and qualification of instrumentation becomes more key in control
systemso Qualification of PAT control methods must also be conducted
Control Strategy

36
STAGE 1: PROCESS DESIGN
Not all the final controls may be implemented Experience is valuable for evaluating process performance May be used to support ranges and limits Clinical batch data should be included in the final process
design report
Clinical Manufacturing Experience –Batch Records and Production Data

37
STAGE 1: PROCESS DESIGN
Deliverable or Output from Stage 1 Intended to be a revisable document Support data for PCS and justification of ranges Data gathered from process change control should be incorporated here The document should include:
o CQAs and supporting risk assessmentso Process flow diagramso Process description tables
Inputs (in process controls) Outputs (in process tests and limits, in process specifications)
o Process Parameters and rangeso Classification of parameters for risk of impact to CQAs and process
performanceo Design space, as appropriateo Justification and data supporting all parameter ranges
Characterization data Development studies Clinical manufacturing history
Process Design Report – Development Document

38
STAGE 1: PROCESS DESIGN
Should be initiated during Stage 1 Outlines validation strategy and supporting rationale Typically includes
o Process characterization plano Description of the manufacturing process and control strategyo Functions and responsibilitieso PQ or PPQ plano PPQ
strategy (examples may include) Single unit operations or a combination of unit
operations Bracketing Family Matrix
Process Validation Master Plan

39
STAGE 1: PROCESS DESIGN
List of individual protocols (examples may include) Mixing Media preparation In process pool hold time Resin lifetime
List of equipment and facilities to be used List of analytical methods and their status Sampling plan
o Proposed timeline and schedule of deliverableso Procedures for handling deviations and revisionso Continued Process Verification Plan
Process Validation Master Plan

40
STAGE 1: PROCESS DESIGN
Beyond equipment capabilities; material compatibility should be studies in Stage 1
Equipment surface interactions (e.g. extractables, leachables, adsorptions)o Extractables come off materials under forceo Leachables come off materials under normal conditions of use
Stage 1 Manufacturing and Technology Considerations

41
1) Define risk based methodology and team structure2) Define CQA 3) Perform Risk Assessment4) Design of Experiments & Quality by Design4) Define applicable CPPs 5) Determine analytical process variation6) Demonstrate variation correlation7) Establish control strategy 8) Assess data
Best Practice
Expectations
1) Engage Process Development Scientist & Engineers early2) Get it in writing3) Ensure scalability 4) Create event driven Process Flow5) Get an early start on Method Validation
STAGE 1: PROCESS DESIGN

Quick Case Study /Knowledge application
Process• Weighing two solids (active
and stabilizer)• Dissolving in Water for
Injection• Sterile Filtration• Fill into Single use bottles
List the CPPs
– Type answers here
42

43
Process Flow
CPP Risk Measure System Validated
Spec Rationale
Process Quality Data updated
Statistical Capability Assessment CQA MonitorIn NormalProduct(Yes / No)
RPN < 100
Yes / No Yes / No Spec Range
Yes / No Control Charts Capability Assessment
PatternAnalysis
Average /Standard deviation
Distribution analysis
K2 PPK
Raw Material Release –
Alkylating Agents
48 Yes – MVR -1234
Yes – USP 1280
Yes – Report 102
NA 99.3/ 0.4 X - Normal 3.0 1.49 No – NIR planned for 2015
Mixing RPMTimeFeed rateImpeller selection
383 NoYesNoYes
LinearityMatrixLimitsTech sheet
Mix - Report 1200
Due 10/13 Due 11/13 Due 12/13 4.26 0.93 Protein– NopH- Yes
Filter Bubble point
110 Yes – MVR 4321
Tech sheet Yes - Report 102
In process Chi Square 3.1 0.99 No – flow meter due 9/13
Process Risk Assessment Tracking
List ProcessSteps and CPP /
CQA
Perform Risk Assessment and
List RPN
Determine MS Validation Status
Evaluate Rationale for Specification
Check Data Quality, Process State of
Control
44
Best Practice
Expectations
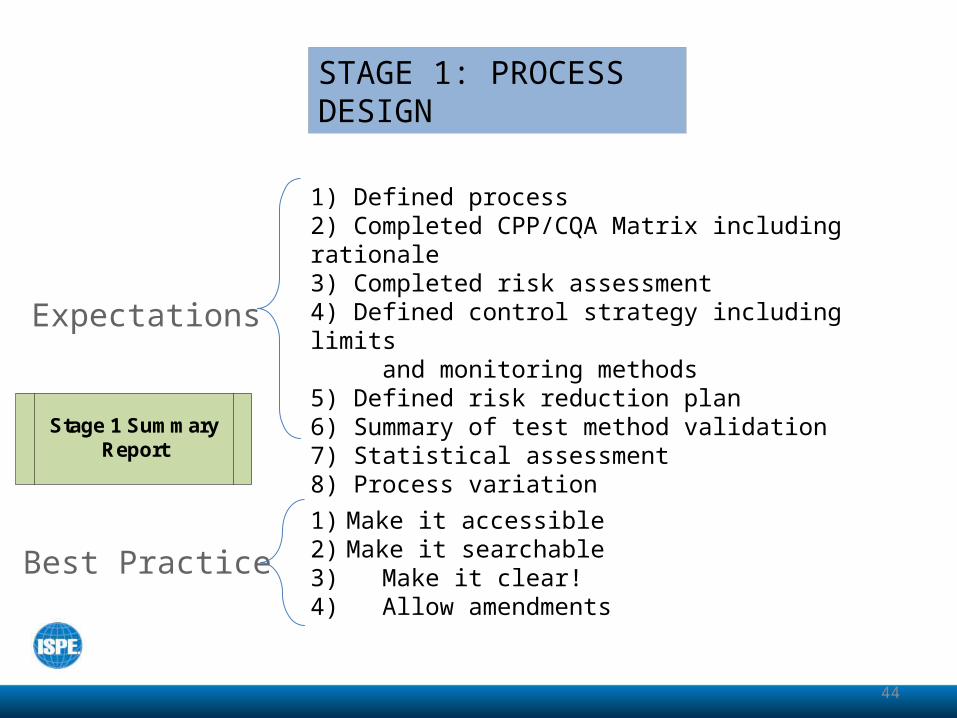
1) Make it accessible2) Make it searchable3) Make it clear!4) Allow amendments
STAGE 1: PROCESS DESIGN
Stage 1 Summary Report
1) Defined process2) Completed CPP/CQA Matrix including rationale3) Completed risk assessment 4) Defined control strategy including limits and monitoring methods5) Defined risk reduction plan6) Summary of test method validation 7) Statistical assessment 8) Process variation

45
• Addresses 2 primary areas– Design and qualification of the facility, equipment, and
utilities– Demonstrating the ability to produce product that meets
predetermined quality attributes; demonstrating control of variability
• In current terminology: Process Performance Qualification (PPQ)
• Stage 2 activities may be in progress in parallel with Stage 1
STAGE 2: PROCESS QUALIFICATION

46
• Qualification of Systems (facilities, utilities, and equipment)• Performed per Qualification Plan• Confirm suitability for intended use• Completed prior to PPQ• For equipment
• verify operational parameters suitable to support intended process
• verify performance when applicable
Strategies for System Design and Qualification
STAGE 2: PROCESS QUALIFICATION
47
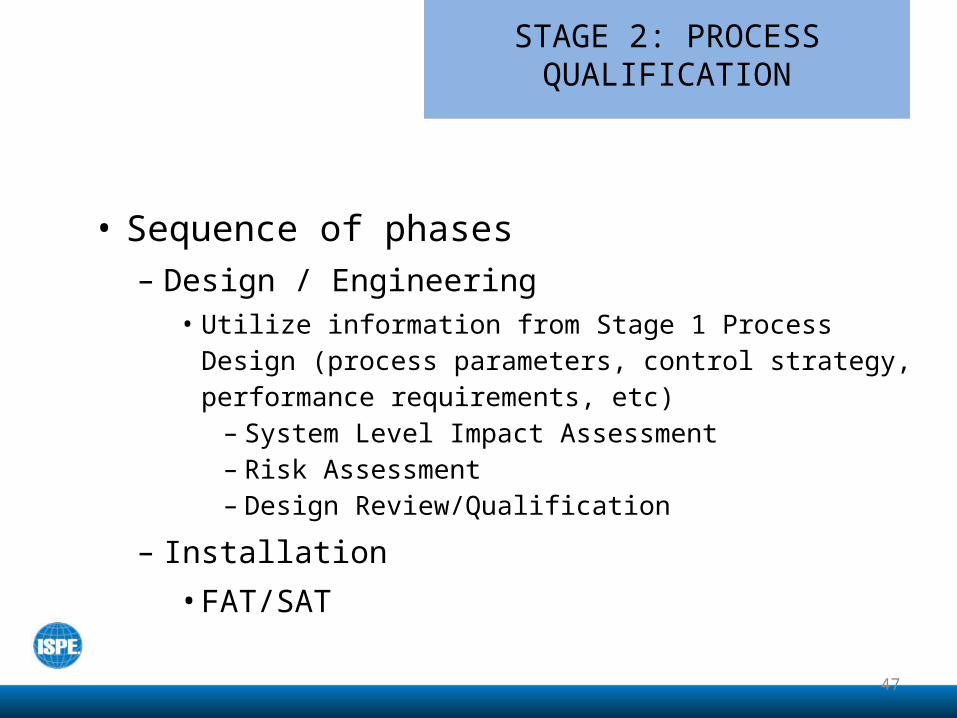
• Sequence of phases– Design / Engineering
• Utilize information from Stage 1 Process Design (process parameters, control strategy, performance requirements, etc)
– System Level Impact Assessment– Risk Assessment– Design Review/Qualification
– Installation
• FAT/SAT
STAGE 2: PROCESS QUALIFICATION
48
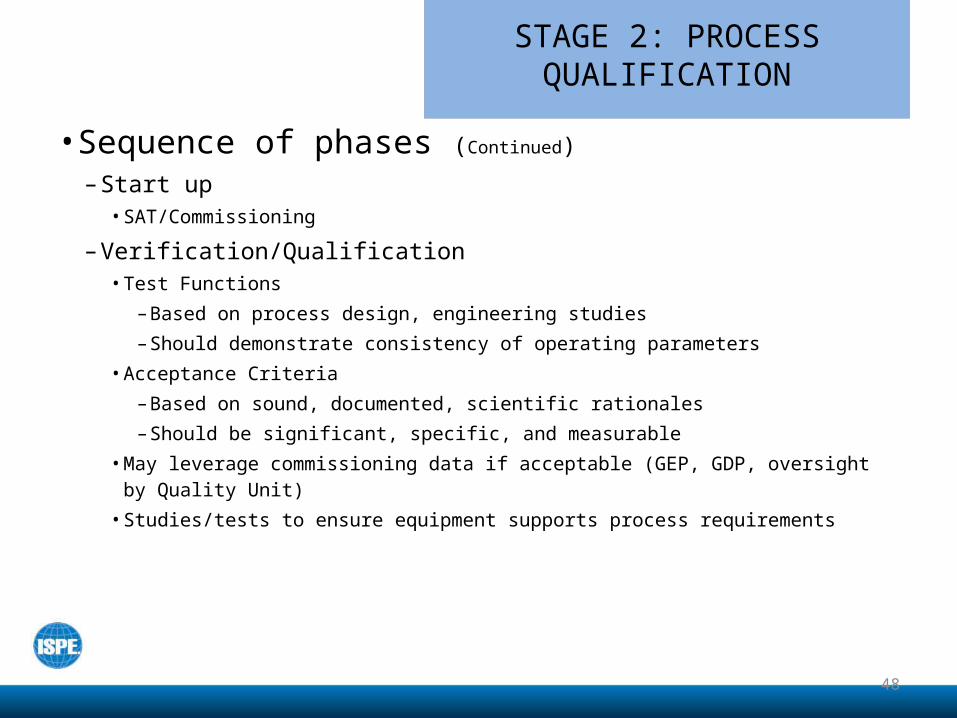
• Sequence of phases (Continued)
– Start up• SAT/Commissioning
– Verification/Qualification• Test Functions
– Based on process design, engineering studies
– Should demonstrate consistency of operating parameters
• Acceptance Criteria
– Based on sound, documented, scientific rationales
– Should be significant, specific, and measurable
• May leverage commissioning data if acceptable (GEP, GDP, oversight by Quality Unit)
• Studies/tests to ensure equipment supports process requirements
STAGE 2: PROCESS QUALIFICATION

49
STAGE 2: PROCESS QUALIFICATION
• Process Performance Qualification (PPQ)• PPQ Readiness
• Confirm all support facilities, utilities and equipment qualified
• Implement Process Control Strategy
• CPPs and CQAs
• Process Risk Assessment
• Analytical Methods
• Process Design Report

50
STAGE 2: PROCESS QUALIFICATION
• PPQ Design Strategy Considerations • Prior Knowledge/ Stage 1 Data to support PPQ
• Data from process characterization studies, clinical/stability/pilot manufacturing batches
• PPQ Design considerations/approaches• Number of Batches
• No pre set number (traditional 3 batches)• Based on combination of prior knowledge,
process complexity, process variability, type and amount of data needed to confirm process design, control strategy, and operational proficiency at commercial scale
• Use statistical methods when practical
51
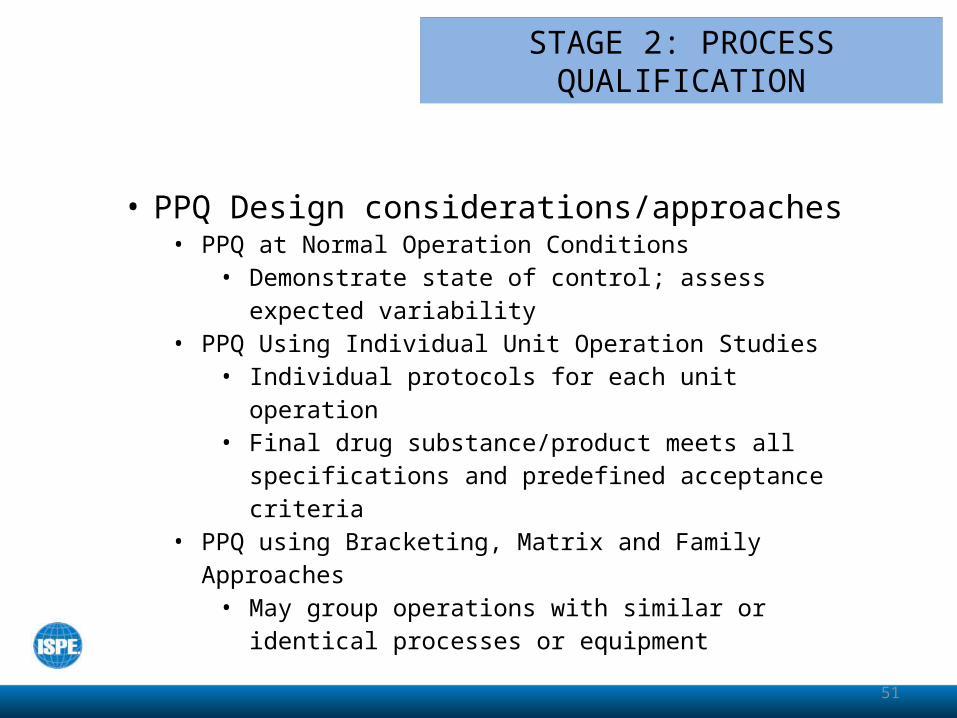
STAGE 2: PROCESS QUALIFICATION
• PPQ Design considerations/approaches• PPQ at Normal Operation Conditions
• Demonstrate state of control; assess expected variability
• PPQ Using Individual Unit Operation Studies• Individual protocols for each unit operation• Final drug substance/product meets all
specifications and predefined acceptance criteria• PPQ using Bracketing, Matrix and Family Approaches
• May group operations with similar or identical processes or equipment

52
STAGE 2: PROCESS QUALIFICATION
• PPQ Design considerations/approaches• Bracketing Approach
• Can be used for processes that represent extremes of process variables
• Matrix Approach• Can be used when configurations of same
process/product have > one variable• Family (Grouping) Approach
• Appropriate when related but different processes are represented by one of the group which demonstrates the common properties or is worst case
53
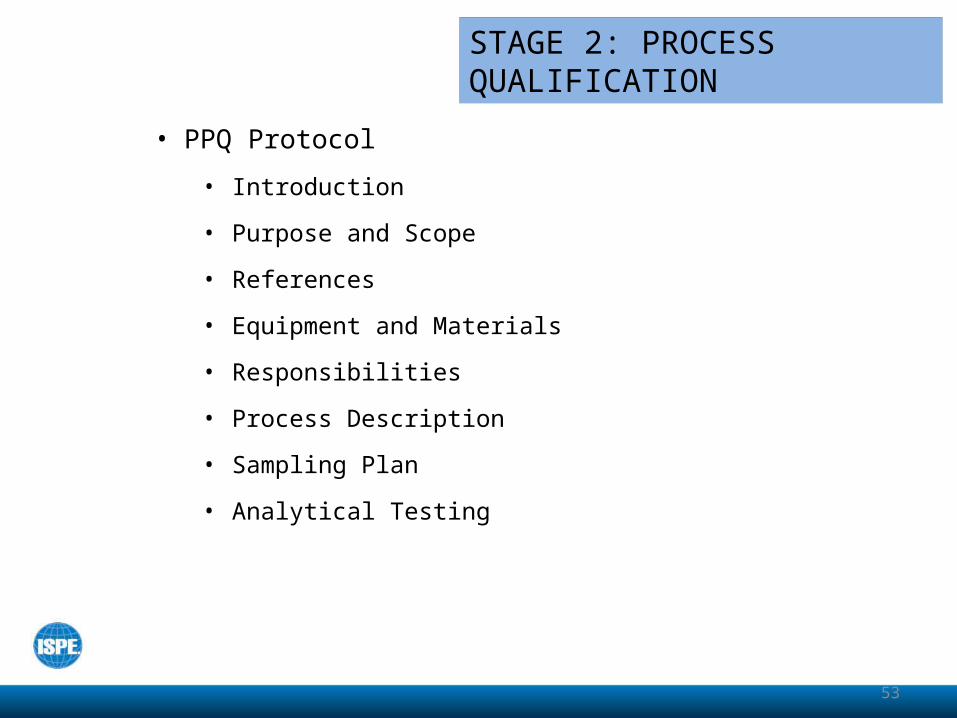
STAGE 2: PROCESS QUALIFICATION
• PPQ Protocol
• Introduction
• Purpose and Scope
• References
• Equipment and Materials
• Responsibilities
• Process Description
• Sampling Plan
• Analytical Testing

54
STAGE 2: PROCESS QUALIFICATION
• PPQ Report
• Introduction
• Methods and Materials
• Deviations/Nonconformances
• Results
• Data Summary
• Data Analysis
• Conclusions
55
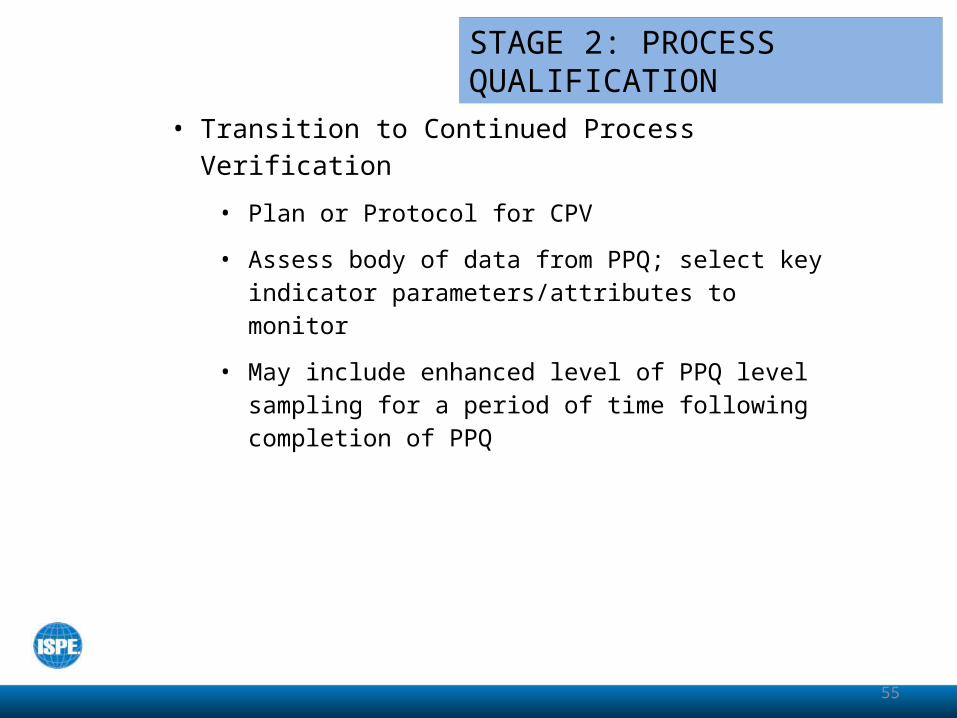
STAGE 2: PROCESS QUALIFICATION
• Transition to Continued Process Verification
• Plan or Protocol for CPV
• Assess body of data from PPQ; select key indicator parameters/attributes to monitor
• May include enhanced level of PPQ level sampling for a period of time following completion of PPQ
56
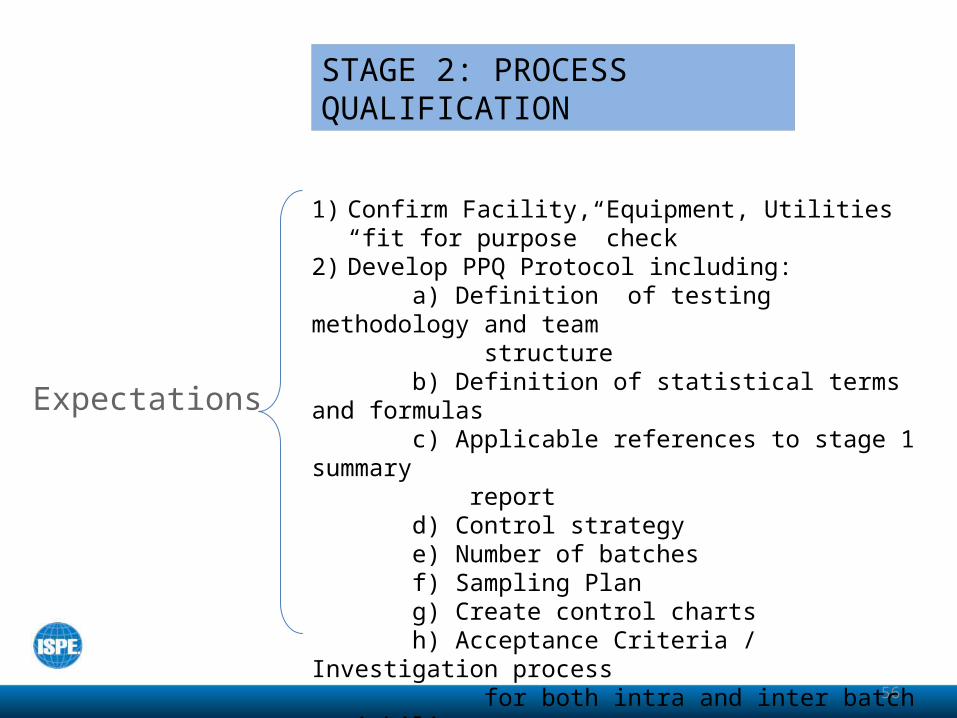
Expectations
STAGE 2: PROCESS QUALIFICATION
1) Confirm Facility, Equipment, Utilities “fit for purpose” check
2) Develop PPQ Protocol including: a) Definition of testing methodology and team structure b) Definition of statistical terms and formulas c) Applicable references to stage 1 summary report d) Control strategy e) Number of batches f) Sampling Plan g) Create control charts h) Acceptance Criteria / Investigation process for both intra and inter batch variability i) Training record

57
Best Practice
Expectations
1) Plan extra runs2) Prepare for deviations & conduct ‘in control’ approvals3) Follow in-process results closely
STAGE 2: PROCESS QUALIFICATION
3) Train Operations and Analytical Team a) Manufacturing Processes b) Statistical Process Control trending or charting begins c) Updated SOPs d) Batch record review e) Risk assessment review f) CPP/CQA Matrix review4) Execute Protocol 5) Revise risk assessment and CPP/CQA

58
Knowledge Check
• When should you get the Quality Unit involved on the team?– A. When Process Equipment is Qualified– B. At Stage 2– C. At Stage 1– D. Never

59
Using your scientific mind…
• What else can lead to failure?
– Type answers here
• Variation can come from all sources!• Let’s explore
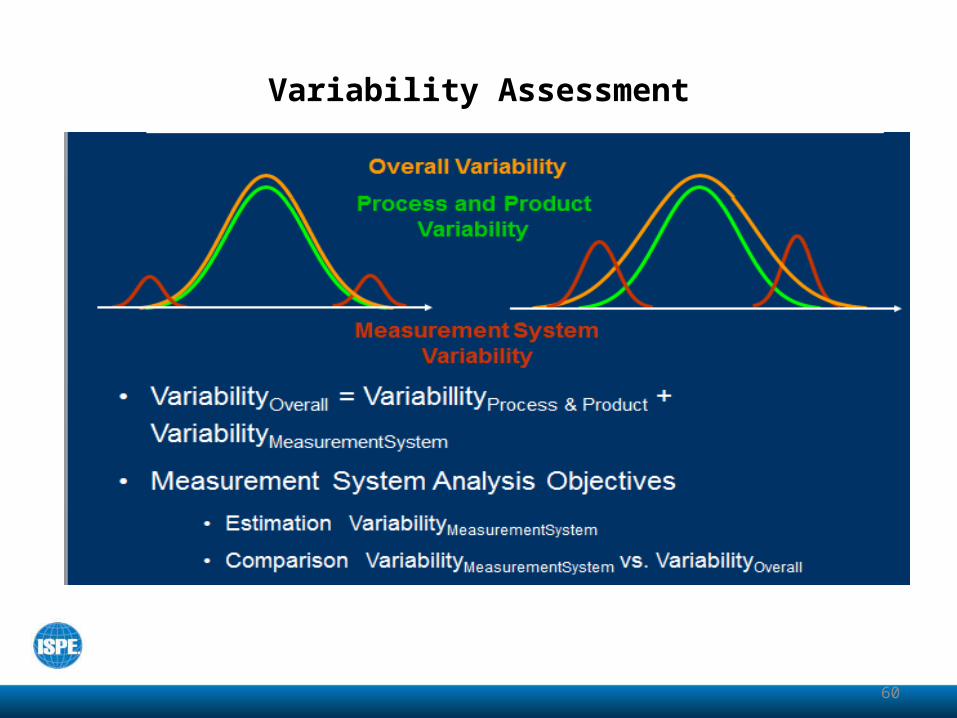
Variability Assessment
60
61
Why PPK and not CPK?
PPK: • Index based on Long Term Variation • Calculated using overall standard deviation• Indicates the overall performance of a process
including special causes of variation
• PPK captures both within-batch and between-batch variation
• Usually used when the state of statistical control is unknown

62
Stage 2 Summary Report
1) Summary of results2) Confirm Process Performance value 3) List of CPP’s by Risk Priority Number 4) Control system5) Determine confidence intervals6) Justification for reduced testing (“hand-shake” to Stage 3)
STAGE 2: PROCESS QUALIFICATION
Best Practice
Expectations
1) Compile results in real time2) Utilize someone well versed in statistical
methods3) Leave a well documented rationale as to
which Attributes to monitor and why

Commercial Distribution
• Basis for Commercial Distribution
“Each manufacturer should judge whether it has gained sufficient understanding to provide a high degree of assurance in its manufacturing process to justify commercial distribution of the product.”
FDA Guideline Section IIB
63

64
STAGE 3: CONTINUED PROCESS VERIFICATION
Incorporation of Feedback from CPV Monitoring
• Validation CPP and CQA’s checked – A Risk Assessment is conducted to confirm future state.
• Lock validated parameters
65
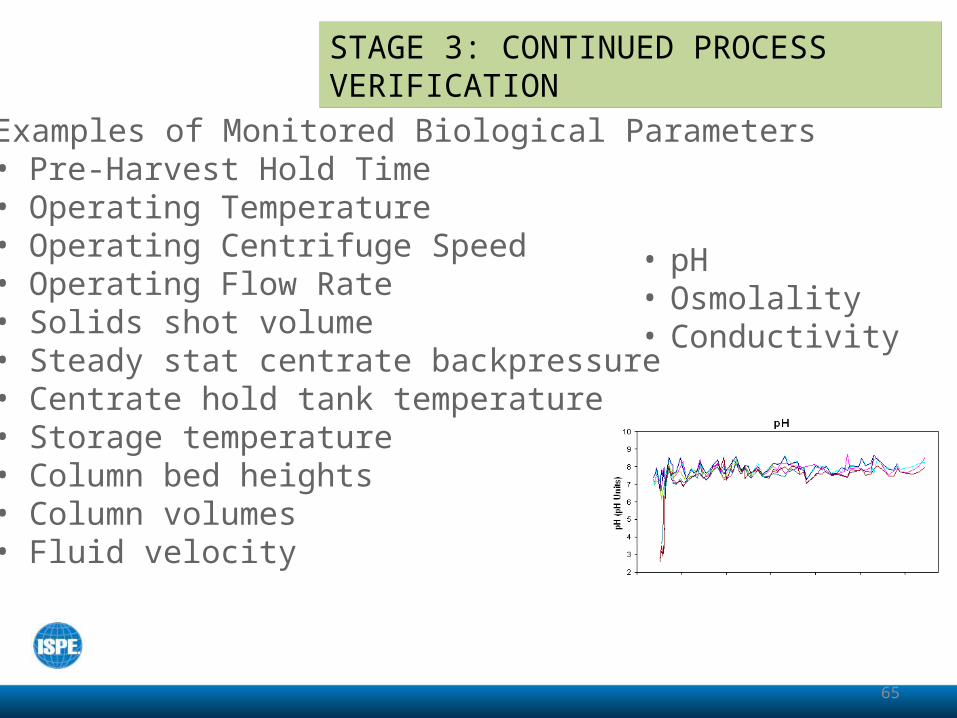
STAGE 3: CONTINUED PROCESS VERIFICATION
Examples of Monitored Biological Parameters• Pre-Harvest Hold Time• Operating Temperature• Operating Centrifuge Speed• Operating Flow Rate• Solids shot volume• Steady stat centrate backpressure• Centrate hold tank temperature• Storage temperature• Column bed heights• Column volumes• Fluid velocity
• pH• Osmolality• Conductivity
66
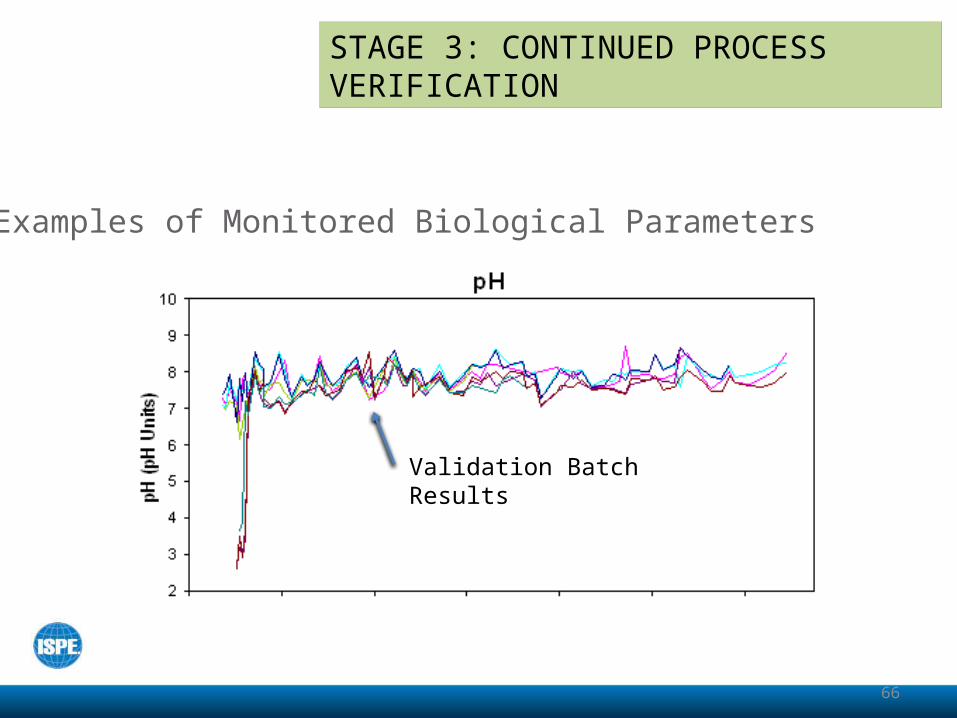
STAGE 3: CONTINUED PROCESS VERIFICATION
Examples of Monitored Biological Parameters
Validation Batch Results

67
STAGE 3: CONTINUED PROCESS VERIFICATION
Examples of Monitored Biological Parameters
+/- 3 Sigma control lines
68
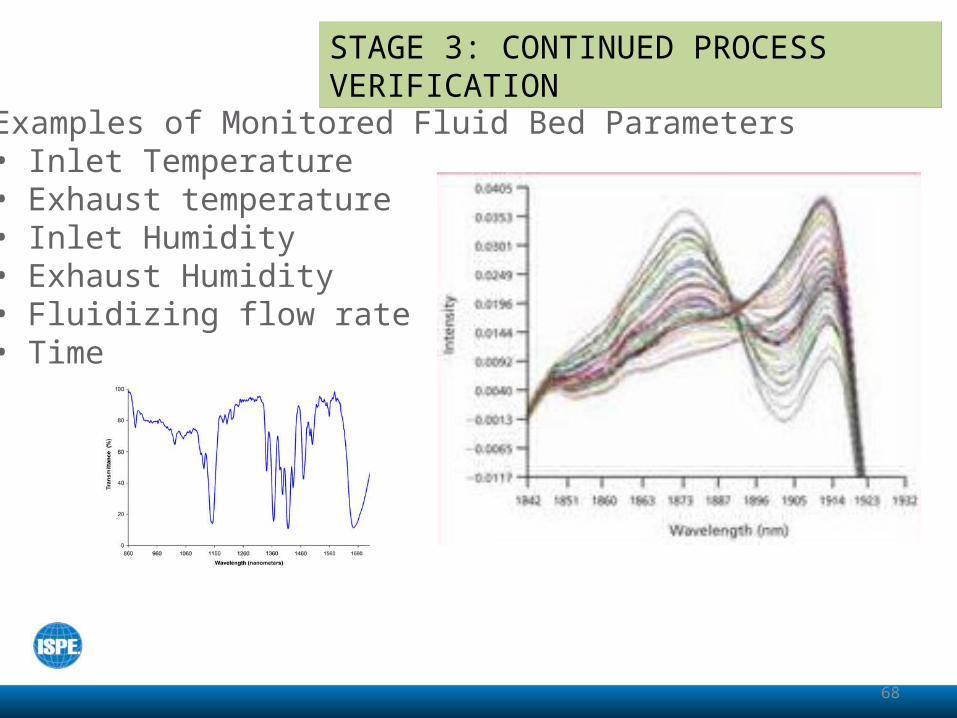
STAGE 3: CONTINUED PROCESS VERIFICATION
Examples of Monitored Fluid Bed Parameters• Inlet Temperature• Exhaust temperature• Inlet Humidity• Exhaust Humidity• Fluidizing flow rate• Time

Continued Process Verification
CGMP requirements:
The collection and evaluation of information and data about the performance of the process will allow detection of undesired process variability. Evaluating the performance of the process identifies problems and determines whether action must be taken to correct, anticipate, and prevent problems so that the process remains in control
(§ 211.180 e).
69

Continued Process Verification
• Goal – to continually assure that process remains in a state of control
• Collection and evaluation of data will allow detection of process drift
• Evaluation should determine whether action must be taken
• On-going program to collect and analyze data must be established
• Statisticians can develop the data collection plan & methods
70

71
EU Continuous Process Validation
• An alternative approach in which manufacturing process performance is continuously monitored and evaluated.
• In-coming materials or components, in-process material and finished products
• Verification of attributes, parameters and end points, and assessment of CQA and CPP trends
• Use of tools to support (PAT, NIR, etc.)
72
EU Continuous Process Validation
• Other Factors- Compliance with GMP principles & requirements- Prior development & manufacturing knowledge- Complexity of product/manufacturing process- Process should be verified on commercial-scale
batches prior to marketing

Is there a conclusion?
• Know your process• Understand your variability• Build a Control Strategy early• Establish a lifecycle• Revisit your Risk Assessment• Monitor the process and analyze your results• Continued process improvement will lead you to
the Future!
73