transcriptomic profiles of drosophila melanogaster third ... · drosophila (adams et al., 2000), we...
TRANSCRIPT

Journal compilation © 2008 The Royal Entomological Society
325
No claims to original US government works
Insect Molecular Biology (2008)
17
(4), 325–339
Blackwell Publishing Ltd
Transcriptomic profiles of
Drosophila melanogaster
third instar larval midgut and responses to oxidative stress
H.-M. Li*, G. Buczkowski*, O. Mittapalli†, J. Xie‡, J. Wu‡, R. Westerman§, B. J. Schemerhorn*¶, L. L. Murdock*†† and B. R. Pittendrigh*††
*
Department of Entomology, Purdue University, West Lafayette, IN, USA;
†
Department of Molecular Ecology, Max-Planck Institute for Chemical Ecology, Jena, Germany;
‡
Department of Statistics, Purdue University, West Lafayette, IN, USA;
§
Genomics Facility, Whistler Hall, Purdue University, West Lafayette, IN, USA;
¶
The USDA-ARS, West Lafayette, IN, USA; and
††
MPRINT – Molecular Plant Resistance and Nematode Team, Department of Entomology, Purdue University, West Lafayette, IN, USA
Abstract
Oligoarray analysis was used to determine the numberand nature of genes expressed in third instar
Drosophilamelanogaster
larval midguts. The majority of transcriptswere associated with protein synthesis and metabolism.Serine proteases were the main proteolytic enzymesdetected. Some 40% of the cytochrome P450 genesand 74% of the glutathione S transferases (GSTs) inthe genome of
D. melanogaster
were observed to beexpressed in the midgut by oligoarray analysis. Wealso identified potential transcription factor bindingmotifs (TFBMs) of P450s, GSTs and carboxylesterases.Many of the midgut-expressed GST genes containedcandidate TFBMs homologous to TFBMs in mammalsthat have been associated with responses to oxidativestress. We also investigated the response of GSTs inthe midgut to dietary H
2
O
2
, which showed a dosage-based differential response.
Keywords: glutathione S-transferase, cytochrome P450,transcription factor binding motif, serine protease,midgut, insect.
Introduction
Over the past several decades interest has grown inpesticides that target the insect digestive system. Particularattention has been given to proteins that affect insect-specific gut receptors because the genes encoding suchproteins can be used in transgenic plants to serve asplant defences. For example, the soil bacterium
Bacillusthuringiensis
(
Bt
) produces a toxic protein that targetsreceptors in the insect midgut.
Bt
is considered to be a safeinsect control agent from the perspective of both humanhealth and the environment.
A significant threat to
Bt
-based insect control is thepotential for resistance to evolve (Tabashnik
et al
., 1994;Bauer, 1995; Schnepf
et al
., 1998; Ferre & Van Rie, 2002;Chilcutt & Tabashnik, 2004). Although efforts have beenmade to discover other toxins useful in transgenic insectcontrol, genes encoding
Bt
toxins are the only group ofproteins that have been proven to be of commercial valuethus far. Given the dearth of useful resistance gene classes,there is a need to identify novel potential target sites inthe insect digestive system that may be exploited for thedevelopment of novel classes of insect control agents. Forexample, Baum
et al
. (2007) have recently demonstratedthe concept of using transgenic plants expressing insect-specific dsRNAs as an insect control strategy. Discoveryof novel insect digestive system target sites that mayultimately be useful in such a strategy will require a betterunderstanding of the genes and corresponding proteinsthat are expressed in the insect midgut.
Better understanding of the genomics of the insect diges-tive system may also provide new insights into: (1) humandigestion, nutrition, diseases of the digestive system andissues associated with weight gain, or loss, or both; (2) theevolution of the insect digestive system, which representsa crucial interface between the animal and its environment;and (3) a better understanding of plant
−
insect interactions.For example, it has been hypothesized that the divergencein total numbers of cytochrome P450s and glutathioneS transferases (GSTs) associated with different insectgenomes is a reflection of the diversity of the toxins theyexperience in their diet (Enayati
et al
., 2005). Thus, in thegenomes of polyphagous insects we would expect a greater
Received 4 September 2007; accepted after revision 4 April 2008. Corre-spondence: Barry R. Pittendrigh, Department of Entomology, PurdueUniversity, 901 West State Street, West Lafayette, IN 47907, USA. Tel.: + 1765 494 7730; fax: +1 765 494 0535; e-mail: [email protected]

326
H.-M. Li
et al.
Journal compilation © 2008 The Royal Entomological Society,
17
, 325–339No claims to original US government works
number of genes encoding detoxification enzymes comparedto monophagous insects. As a corollary to this hypothesis,if cytochrome P450s, GSTs and carboxylesterases playimportant roles in detoxification of compounds found inthe diet, then we would expect to find a large number ofP450s and GSTs associated with the midgut. To date, nocomprehensive study has addressed the question of howmany P450s, GSTs and carboxylesterases are associatedwith the midgut.
Currently, we have a limited understanding of the genomicprofile of any insect digestive system. Recently, expressedsequence tag (EST) studies and cDNA spotted arrays havebeen used in developmental and nutritional studies as wellas in an attempt to determine the complement (or subset)of genes specifically associated with insect digestivesystems (Zinke
et al
., 2002; Li & White, 2003; Pedra
et al
.,2003; Arvestad
et al
., 2005; Mittapalli
et al
., 2005; Siegfried
et al
., 2005). The EST approach, however, may not accuratelyreflect the complement of genes being expressed (Wang
et al
., 2004).Thanks to the availability of whole-genome oligoarrays in
Drosophila
(Adams
et al
., 2000), we now have the capacityto describe many of the genes expressed in a given tissue,i.e. those that are expressed at or above the level ofdetectability in the oligoarrays. Even so, we still do not knowthe complement of genes associated with the midgut ofthird instar
Drosophila
larvae (Li & White, 2003). The thirdinstar
Drosophila
larva represents a developmental stage atwhich (1) high level of feeding occurs, (2) effective feedingbioassays can be performed, and (3) the midgut is largeenough to be easily dissected.
In this study, we investigated the genes associatedwith the midgut of third instar
D. melanogaster
larvae. Thisallowed us to determine the number of cytochrome P450sand GSTs associated with the midgut. We also identifiedthe potential DNA transcription factor binding motifs (TFBMs)of cytochrome P450s, GSTs and carboxylesterases expre-ssed in the third instar larval midguts. As some of thecandidate TFBMs for the midgut-associated GSTs wereobserved to be linked to the oxidative stress response, wealso tested the effect of an oxidative stressor, hydrogenperoxide, on expression of GSTs.
Results and discussion
Functional annotations of
Drosophila melanogaster
midgut transcriptome
We observed 2943 probes (
P
< 0.001,
ANOVA
) representing2923 different transcripts to be present on all three replicatesof the oligoarrays (Supplementary Material Table S1). Sixtyfive per cent (1908/2923) of genes were functionallyannotated using the gene ontology database. Based on thefunction annotations of the Affymetrix’s NetAffx™ AnalysisCenter (http://www.affymetrix.com/analysis/index.affx),
the transcripts were assigned to one of eight functionalcategories. A group of 810 of these genes (42.5%) wasassociated with protein synthesis and metabolism. Itincluded a suite of genes involved in protein catabolism,biosynthesis, modifications, proteolysis and degradation.Two-hundred and forty-four genes were associated withtransport (12.8%), 229 genes were associated with thecytoskeleton (12.0%) and 189 genes coded for proteinsassociated with DNA/RNA binding (9.9%). The number ofgenes involved in detoxification, transcription/translation,development and signalling were respectively 133 (7.0%),121 (6.3%), 93 (4.9%) and 89 (4.7%) (SupplementaryMaterial Table S1). Many genes in the midgut were associatedwith metabolism and protein synthesis; corroborating theresults of Arbeitman
et al
. (2002).
EST midgut libraries vs. microarrays
Previous transcriptome studies of insect midguts involvedsequencing and annotation of ESTs (Lehane
et al
., 2003;Pedra
et al
., 2003; Mittapalli
et al
., 2005; Siegfried
et al
.,2005). For example, in the tsetse fly (
Glossina morsitans
),Lehane
et al
. (2003) observed 8876 potential genesassociated with the adult midgut, almost triple the numberof expressed gene products that we observed in the
D. melanogaster
midgut. This difference could be becauseof: (1) differences among species; (2) different developmentalstages or physiological states examined; (3) differences intechniques (e.g. selection criteria); or, (4) a combinationof 1
−
3. The EST approach is known to overestimate thenumber of unique genes because of EST clustering errors,alternative splicing or both (Wang
et al
., 2004). Alternativesplicing has previously been documented in insects(Hanrahan
et al
., 1999; Reenan, 2005). Thus, the oligoarrayapproach taken here may under-estimate the number ofgenes actually expressed in the
D. melanogaster
midgut,particularly those genes with low expression levels.
With the advantage of the availability of other insectoligoarrays we will be in a better position to make com-parisons between species regarding (1) the nature of thegenes associated with the insect midgut, and (2) the midgut-specific gene families that have gone through evolutionaryexpansion or contraction (Hahn
et al
., 2005). Such observa-tions may give us greater insights into how food choiceshave shaped the evolution of the insect digestive system(e.g. generalists vs. specialists, legume feeders vs. cerealfeeders or herbivores vs. carnivores).
Serine proteases and digestion
Digestive enzymes are critical for insects to processproteins, carbohydrates, lipids and other materials theyimbibe with their diet. In the present study we identified 148genes involved in proteolysis and peptidolysis based ontheir known molecular functions (Table 1). Serine-typeendopeptidases (E.C.3.4.21), including trypsins (E.C.3.4.21.4)

Midgut transcriptome of
Drosophila
larvae
327
Journal compilation © 2008 The Royal Entomological Society,
17
, 325–339No claims to original US government works
and chymotrypsins (E.C.3.4.21.1), accounted for 33% (49/148) of all the proteolysis and peptidolysis enzymes presentin the
D. melanogaster
midgut transcriptome (Table 1).Our observations are consistent with results by Li &
White (2003) showing that serine proteases are themost common proteolytic enzymes associated with the
Drosophila
midgut. Digestive serine proteases (trypsinsand chymotrypsins), which function in the breakdown ofingested food, represent the major proteolytic enzymesin the midguts of many lepidopterans and dipterans(Chapman, 1998). Even so, some of the serine proteasesobserved in the midgut transcriptome may be involved inbiological roles other than food digestion. For example,serine proteases are known to activate immune pathways thatrespond to pathogen detection (Gorman & Paskewitz, 2001).
Unlike
Drosophila
, the cowpea bruchid,
Callosobruchusmaculatus
(F.), relies primarily on cysteine proteases todigest dietary proteins (Murdock
et al
., 1987). Pedra
et al
.(2003) observed mainly cysteine protease ESTs in thedigestive system of cowpea bruchid larvae. Although Pedra
et al
. (2003) sequenced only 503 ESTs from the bruchidgut, six of the total ESTs (1.2%) coded for cysteine proteaseswhile none coded for serine proteases. Our results dosuggest that serine proteases are more common in themidguts of
D. melanogaster
compared to cowpea bruchids.One hypothesis to explain the observed differences
between
D. melanogaster
and cowpea bruchids is thatseed-feeding insects (especially those that feed on legumeseeds as do cowpea bruchids) encounter high levels ofserine-specific protease inhibitors (e.g. Bowman
−
Birk typeand Kunitz trypsin inhibitors) in their diet and this may havebeen the driving evolutionary force (selection pressure)behind the expansion of the cysteine proteases expressedin the midgut of
C. maculatus
. From the
Drosophila
genomedatabase, there are 18 known serine proteases and one knowncysteine protease (Flybase, http://flybase.bio.indiana.edu).
However, there is no serine protease, and six known cysteineproteases in the ESTs of
C. maculatus
(Pedra
et al
., 2003).In addition, many coleopterans including
C.
maculatus
havean acidic gut environment (Wolfson & Murdock, 1990).Such conditions may have favoured the expansion ofcysteine protease families in the midgut. In keeping withthis latter hypothesis, the western corn rootworm,
Diabroticavirgifera
LeConte, (1) has an acidic gut (Fabrick
et al
.,2002) and (2) an EST analysis of its midgut transcriptomerevealed a large class of the cysteine proteases and onlyone serine protease (Siegfried
et al
., 2005). In contrast, thebasic pH of the
D. melanogaster
midgut is very compatiblewith a large number of serine proteases.
Aminopeptidases and cadherins
We detected two aminopeptidases and no cadherins inthe
D. melanogaster
midgut transcriptome. The aminopepti-dases identified were granny smith (EC 3.4.11.1) andaminopeptidase P (EC 3.4.11.9). Both enzymes belongto different classes from that of aminopeptidase N (APN)(EC 3.4.11.2). Although an APN is encoded in the
D. melanogaster
genome, we did not detect its expressionin our microarray analysis.
In Lepidoptera, cadherins and APN are thought to bereceptors for
Bt
toxins in the midgut epithelial cells. Muta-tions in both cadherin and APN genes in lepidopteranshave been associated with the resistance phenotype to
Bt
toxins (Ingle
et al
., 2001; Jenkins & Dean, 2001; Bel &Escriche, 2006). APN is considered as an essential gutenzyme associated with the binding of
Bt
in lepidopterans(Knight
et al
., 1994).
D. melanogaster
is not particularlysusceptible to
Bt
Cry1 toxins (Gill & Ellar, 2002). However,when Gill & Ellar (2002) made transgenic
Drosophila
expressing an APN gene from
Manduca sexta
(L.) in the
Drosophila
digestive system, the transgenic
Drosophila
became susceptible to
Cry1Ac1
. Based on these observa-tions, we suggest that wild-type
D. melanogaster
thirdinstar larval midgut (1) do not express the APN or cadheringenes or (2) express the transcripts of these genes at levelsbelow the sensitivity range of the oligoarrays.
Cytochrome P450s
Cytochrome P450 enzymes are involved in (1) biosynthesisand degradation of endogenous compounds and (2)metabolism of xenobiotics such as allelochemicals, drugsand insecticides (Feyereisen, 1999; 2005). Dietary factorscan induce P450s (Snyder
et al
., 1995; Mittapalli
et al
.,2005; Krishnan & Kodrik, 2006). The
D. melanogaster
genome contains 90 cytochrome P450s (Tijet
et al
., 2001;Feyereisen, 2005) and in this study we observed 36 (40%,Table 1) expressed in the larval midgut. By comparison, Li& White (2003) only observed nine P450s (
Cyp4Ac3
,
Cyp4d2
,
Cyp6a14
,
Cyp6d4
,
Cyp9b2
,
Cyp9f2
,
Cyp12a4
,
Cyp12a5
and
Cyp311a1
) in the midgut of third instar
Table 1. Genes related to digestion and detoxification expressed in third instar Drosophila melanogaster larval midgut. Classification was based on the functional annotation
Molecular functions Number of genes
Proteolysis and peptidolysis 148• Serine-type endopeptidase/trypsin /chymotrypsin 49• Endopeptidases 22• Carboxypeptidase 10• Metallo-endopeptidase 11• Ubiquitin-protein ligase 8• Cysteine-like protease 4• Aminopeptidase 2• Others 42Detoxification and P450s 133• Glutathione S transferases 28• Cytochrome P450s 36• Carboxylesterases 9• Others 60

328
H.-M. Li
et al.
Journal compilation © 2008 The Royal Entomological Society,
17
, 325–339No claims to original US government works
Drosophila
larvae. The discrepancy in the number of P450sobserved may be a result of the different types of arraysused or the methodology used to call the gene present.In contrast to the present study, Li & White (2003) usedpolylysine-coated glass slide arrays and an incomplete setof genes (of the total in the genome) from Drosophila.
However, our observations suggest that more P450s aretranscribed in the midgut than previously thought (Li &White, 2003). It remains to be determined what role, if any,these 36 P450s, may play in xenobiotic metabolism ofdietary materials.
Glutathione-S-transferases and oxidative stress
Glutathione-S-transferases (GSTs, EC 2.5.1.18) are a familyof multi-functional enzymes involved in the detoxification ofendogenous as well as xenobiotic compounds (Tu & Akgul,2005). GSTs catalyse the conjugation of reduced glutathione(GSH) with xenobiotics such as plant allelochemicals andinsecticides, thereby converting them to less toxic water-soluble forms (Grant & Matsumura, 1989; Zou et al., 2000;Singh et al., 2001). GSTs also play a role in oxidative stress,a condition cells experience when there is an increase inreactive oxygen species (ROS) such as superoxide, hydrogenperoxide and peroxynitrite (Fiers et al., 1999).
The D. melanogaster genome contains 38 GSTs (Tu &Akgul, 2005), 28 of which were observed in our microarrayanalysis (Table 1). We found five different GST classes inthe third instar D. melanogaster midgut transcriptome(Table 2). Most of the GSTs in the midgut transcriptomewere in the delta and epsilon classes. To validate thesensitivity of the oligoarray experiment, we carried outquantitative real-time PCRs (qRT-PCRs) to independentlyestimate gene expression levels (Fig. 1).
We measured the expression levels of GSTs absent inthe microarrays (not midgut-associated) as well as GSTsobserved in the microarrays (midgut-associated). Overall,26 of the 28 GSTs we found associated with the midgut bymicroarray analysis were confirmed by qRT-PCRs to havehigher expression levels than the genes defined as absentin the microarray experiments (Fig. 1 and Table 3). GSTD8
and Mgstl were observed to be midgut-associated inmicroarrays, but had very low expression levels as definedby qRT-PCR. The Ct values of all GST genes vs. the Ct valuesof the reference gene RP49 are presented in Fig. 1.
Interestingly, Li & White (2003) did not observe any GSTsin their microarray experiments with Drosophila midgut.One difference between observations by Li & White (2003)and our results is that their arrays were made using a midgut-enriched EST library while our study employed Affymetrixmicroarrays. The microarrays performed by Li & White(2003) may have lacked some of the GSTs, have been lesssensitive at detecting the GST transcripts as compared toour oligoarrays and/or their methodology of designatingabsent or present may have been different. However, ourresults suggest that a substantial number of GSTs in theDrosophila genome may be associated with the midgut.The functional role of these GSTs in the midgut remains tobe elucidated.
The GSTs identified in this study could possibly beresponsive to (1) midgut fermentation products (Ebertet al., 2003) or (2) oxidative stress in the midgut cells. Forexample, 4-hydroxynonenal (4-HNE) is a highly toxicaldehyde produced by lipid peroxidation in cells in responseto oxidative stress (Ullrich et al., 1997). The major pathwayof 4-HNE metabolism in mammals involves glutathioneconjugation by GSTs (Alin et al., 1985; Videla et al., 2000).4-HNE-protein adducts also occur in insects (Yan & Sohal,1998; Singh et al., 2001). Thus, Sawicki et al. (2003) inves-tigated the role of Drosophila GSTs in metabolizing 4-HNE.They found that six delta GSTs (GSTD1, GSTD2, GSTD3,GSTD7, GSTD9 and GSTD10), one epsilon GST (GSTE1)and one sigma GST (GSTS1) metabolized 4-HNE. Inter-estingly, mRNA for each of these eight GSTs was found inour oligoarray analysis of the D. melanogaster larval midguttranscriptome (Table 2).
Identification of potential GST, cytochrome P450 and carboxylesterase regulatory regions
We compared the promoter regulatory regions corre-sponding to 800 bp upstream and 200 bp downstream of
Table 2. Glutathione S transferases being observed in third instar Drosophila melanogaster larval midgut transcriptome by oligoarray analysis
GST class Observed in the midgut transcriptome Not observed in the midgut transcriptome
Delta (GstD1, GstD2, GstD3, GstD7, GstD9, GstD10)*, (GstD4, GstD6, GstD8)† GstD5†, CG17639Epsilon GstE1*, GstE3, GstE5, GstE6, GstE7, GstE8, GstE9, GstE10, CG5224, CG16936, CG11784 GstE2, GstE4, CG4688Sigma GstS1*Theta CG1681, CG1702, CG30005 CG30000Omega CG6776, CG6673 CG6781, CG6662 Zeta CG9362 CG9363Gst-like Mgstl gfzf
*GSTs known to accept 4-hydroxynonenal (4-HNE) as a substrate (Sawicki et al., 2003).†GSTs reported not to accept 4-HNE as a substrate (Sawicki et al., 2003).All other GSTs were not tested by Sawicki et al. (2003) for 4-HNE substrate activities.

Midgut transcriptome of Drosophila larvae 329
Journal compilation © 2008 The Royal Entomological Society, 17, 325–339No claims to original US government works
the target gene transcription start site of cytochrome P450sand GSTs that were either associated or not associatedwith the midgut. Four potential transcription factor bindingmotifs (TFBMs) were observed for the midgut-associatedGSTs: fork head box (FOX)-, glucocorticoid receptor element(GRE)-, E47- and NF-kappaB-like (Figs 2 and 4A), and fourdifferent potential TFBMs were observed for the midgut-associated P450s: TATA box-binding (TBP)-, hypoxia-inducible factor 1(HIF-1-), c-Myc/Max- and liver X receptor(LXR)-like (Figs 3, 4B and S1). Roles for each of theseaforementioned TFBMs have been elucidated (Table 3) inmammals. However, it has hitherto not been known if thefour similar motifs that we observed upstream of the
midgut-associated GSTs have similar biological roles inD. melanogaster. For example, insects are not known tohave glucocorticoids or glucocorticoid receptors (Yoshinaga& Yamamoto, 1991); however, one of the potential TFBMswas homologous to the mammalian glucocorticoid receptorelement (GRE). If these potential GRE-like TFBMs inD. melanogaster are functional, their role in the life-historyand cellular biology of this insect remains to be elucidated.
The four potential TFBMs observed for the midgut-associated P450s (Figs 3 and 4B) were not shared withthe nonmidgut-associated P450s. These potential TFBMs(Table 3) have been reported in mammals with the initiationof transcription (van Roon-Mom et al., 2005), gene expression
Figure 1. Fold changes and the standard errors of all glutathione S transferase (GST) transcripts in third instar Drosophila melanogaster larval midgut. RP49 is the reference gene.

330 H.-M. Li et al.
Journal compilation © 2008 The Royal Entomological Society, 17, 325–339No claims to original US government works
at low oxygen levels (Semenza et al., 2006), nitric oxide-mediated suppression of the small intestine-associatedcytochrome P450 (Watabe et al., 2003) and oxysterolinhibition of phenobarbital-mediated induction of P450s(Gnerre et al., 2005). However, to date we do not know whatrole, if any, these potential TFBMs play in D. melanogaster.Additionally, in those cases where such potential TFBMsare found to be functional, we currently do not know if theirroles in D. melanogaster may be similar to those found inmammals.
Carboxylesterases are also involved in detoxification ofxenobiotics (Russell et al., 1996) and in the metabolism oflipids and fats in Drosophila larvae (Campbell et al., 2003).We detected transcripts of nine carboxylesterases (Fig. 5)associated with the midgut of third instar D. melanogasterlarvae. Among these transcripts, Esterase-3 and Esterase-7 have previously been reported to be expressed inDrosophila larvae (Campbell et al., 2003). Four potentialTFBMs (progesterone receptor-like, interferon-regulatingfactors-like, TFII-I-like and heat shock factor 2-like) wereobserved among these nine midgut-associated carboxy-
lesterases (Table 4 and Fig. 5). As insects are not known tohave progesterone or interferon, the role of these potentialTFBMs, if any, remains to be elucidated.
Further molecular studies are needed to determine if thedetected TFBMs are functional and whether they have arole, if any, in the expression patterns of the given genesin D. melanogaster. We realise that some, or even all, ofthese motifs may not be functional. However, the analysispresented here (Figs 2–4) provides the basis for formulat-ing testable hypotheses relating to the regulation of thedigestive system-associated GSTs, P450s and carboxy-lesterases in the midgut of larval D. melanogaster.
As the strategy we used to observe the potential TFBMswas de novo motif discovery involving a combination of fivemultiple alignment approaches, it is likely that we failed toidentify other potential TFBMs that exist in the 5′ region ofthe genes. Two motifs previously shown to be involved inthe regulation of GSTs and P450s include antioxidantresponsive element (ARE) and xenobiotic responsiveelement (XRE) (Rushmore et al., 1991; Zhang et al., 1998).We scanned for these two motifs in the 2 kb upstream
Table 3. Potential transcription factor binding sites of GSTs, cytochrome P450s, and carboxylesterases observed in third instar Drosophila melanogaster larval midgut transcriptome using oligoarray analysis
Gene group TF motif name* Known mammalian function Distance†Abundancerate§
GSTs
NF-kappaB-like Nuclear factor kappa B is regulated by the intracellular reduction-oxidation state (Sen & Packer, 1996)
0.09 0.58
glucocorticoid receptor element (GRE)-like Suppressed under oxidative conditions and restored in the presence of reducing reagents (Okamoto et al., 1999)
0.06‡ 0.69
Fork head box (Fox)-like Associated with signalling pathways and cell fate decisions in development (Kaestner et al., 2000)
0.08 0.77
E-47-like A helix-loop-helix protein (HLH), essential for both B- and T-lineage development (Ikawa et al., 2006)
0.13 0.58
P450s
TBP-like TATA Box-binding protein is a general transcription factor that act on initiation of transcription (van Roon-Mom et al., 2005)
0.06‡ 0.78
HIF-1 like Hypoxia-inducible factor-1, playing a role in formation of new blood vessels because of low oxygen levels (Semenza et al., 2006)
0.11 0.47
c-Myc/Max-like Plays a role in nitric oxide-mediated suppression of the small intestine-associated cytochrome P450 Cyp3a4 (Watabe et al., 2003)
0.05‡ 0.50
LXR-like Liver X receptors, associated with oxysterol inhibition ofphenobarbital (PB)-mediated induction of cytochrome P450s in mammals (Gnerre et al., 2005)
0.12 0.56
Carboxyl esterase
PR-like Progesterone receptor, an intracellular steroid receptor that specifically binds progesterone (Leonhardt et al., 2004)
0.07‡ 0.78
IRF-like Interferon-regulating factors, cell growth inhibition (Kirchhoff et al., 1993)
0.06‡ 0.67
TFII-I-like Gene regulation (Cheriyath & Roy, 2000) 0.10 0.67HSF2-like Heat shock transcription factor (He et al., 2003) 0.14 0.56
*The transcription factor binding motif (TFBM) names were assigned based on the closest known motifs described in other organisms.†The distance was defined as a dissimilarity measurement between any pair of position weight matrices (PWMs; Gordon et al., 2006). If the numerical values were smaller, the PWMs were considered to be closer to the mammalian TFBMs.‡A distance of 0.07 or less indicated that the Drosophila melanogaster TFBM was relatively similar to the mammalian TFBM.§Abundance rate was the frequency that a motif occurred in the given set of sequences.

Midgut transcriptome of Drosophila larvae 331
Journal compilation © 2008 The Royal Entomological Society, 17, 325–339No claims to original US government works
regulatory region of all the midgut associated GSTs,cytochrome P450s and carboxylesterases. The results aregiven in Supplementary Material Figs S2 and S3. FourARE-like (sequence 5′-GTGACNNNG-3′) and 15 XRE(sequence 5′-GCGTG-3′) motifs were observed for theGSTs, while three ARE (sequence 5′-GTGACNNNGC-3′)and 23 XRE motifs were observed for the cytochromeP450s. We observed three carboxylesterases genesassociated with the potential ARE-like motifs (sequence5′-GTGACNNNG-3′), CG3841, clt and Esterase-5, andfive carboxylesterase genes associated with the putativeXRE motifs out of a total of nine midgut-associated carbo-xylesterases (Supplementary Material Fig. S4).
However, we also performed a similar screening on 200randomly generated sequences and observed that 84.5and 12.5% of these randomly generated sequences,respectively, contained matches to XRE and ARE. We further
observed that 54, 64 and 56% of the respective midgut-associated GSTs, P450s and carboxylesterases containedthe XRE motif. We also observed that 14, 8 and 33% of therespective midgut-associated GSTs, P450s and carbo-xylesterases contained the ARE motifs. Thus, the XRE andARE motifs were typically more frequently observedassociated with the randomly generated sequence thanwith the GSTs, P450s and carboxylesterases genes. It ispossible that these potential XRE and ARE TFBMs werefalse positives; neither motifs were obtained from genesassociated with the GSTs, P450s and carboxylesterasesusing the five motif discovery programs, which are de novomethods without prior information on the motif pattern.Alternatively, it is also possible that some of these AREsand XREs are functional; however, which (if any) of thesemotifs play a biological role in these aforementioned genesremains to be verified.
Figure 2. Glutathione S transferases (GSTs) associated with third instar Drosophila melanogaster larval midgut and the potential transcription factor binding motifs (TFBMs) observed 800 bp upstream and 200 bp downstream of the gene transcription start site (TSS). Different shapes represent different potential motifs. All GSTs are labelled by the gene name and categorized into their respective classes. The potential ARE and XRE TFBMs associated with the GSTs expressed in the midgut (based on microarray analysis) are given in Supplementary Material Fig. S2.

332 H.-M. Li et al.
Journal compilation © 2008 The Royal Entomological Society, 17, 325–339No claims to original US government works
GST response to different levels of dietary hydrogen peroxide
In order to determine whether the different midgut-associatedGSTs responded to oxidative stressors in a similar manner,we fed hydrogen peroxide (H2O2) to D. melanogaster thirdinstar larvae for 12 h at doses of 0.02, 0.1 and 0.5% (w/w)
in artificial diets. Twelve of the genes with potential AREand XRE motifs in their 5′ regions responded to at least onedose of dietary H2O2 (Table 3 and Supplementary MaterialFig. S2) at the P < 0.01 level. Nine GST genes lacking boththe potential XRE and ARE were differentially expressedin at least one dose of dietary H2O2 (Table 4 and Supple-mentary Material Fig. S2) at the P < 0.01 level. Further,
Figure 3. Cytochrome P450s associated with third instar in Drosophila melanogaster larvae midgut and the potential transcription factor binding motifs (TFBMs) observed 800 bases upstream and 200 bases downstream of the gene transcription start site (TSS). Different shapes present different potential motifs. All P450s are labelled by the gene name and listed in their respective classes. The potential ARE and XRE TFBMs associated with P450s expressed in the midgut (based on microarray analysis) are given in Supplementary Material Fig. S3.

Midgut transcriptome of Drosophila larvae 333
Journal compilation © 2008 The Royal Entomological Society, 17, 325–339No claims to original US government works
three GST genes with potential XRE and/or ARE TFBMswere not differentially expressed in the presence of dietaryH2O2 at the P < 0.01 level (Table 4 and SupplementaryMaterial Fig. S2).
However, a trend did occur among some of the expressionpatterns of the GST genes and their potential TFBMs(including FOX-like, GRE-like, E-47-like and NK-kappB-like)(Fig. 6 and Supplementary Material Fig. S1). Based on theexpression patterns of different GSTs that responded todietary H2O2, we observed several types of FOX-like potentialTFBMs, which we termed FOX-like-1, FOX-like-2 andFOX-like-3 (Supplementary Material Fig. S1). The potentialFOX-like-1 TFBMs were associated with GSTD3, GSTD9and GSTD10 and the potential FOX-like-2 TFBMs, whichwere different from the base consensus of FOX-like-1 wereassociated with GSTS1, CG6776 and CG1681 (Fig. 6 andSupplementary Material Fig. S1). The potential FOX-like-3TFBM was associated with GSTD1, GSTD2, GSTE1,CG16936 and CG9362, which also contained consensussequences that differed from the two aforementionedgroups CG1681 (Fig. 6 and Supplementary Material Fig. S1).Two separate consensus sequences emerged amongthe potential GRE-like TFBMs associated with (1) GSTD3,GSTD9 and GSTD10 and (2) GSTE5, GSTE6, GSTE9 andCG1702 (Fig. 6 and Supplementary Material Fig. S1). Both
GSTE3 and GSTE7 shared the common potential E-47-likeTFBM and GSTS1, CG6776 and CG1681 also shared thepotential NK-kappB-like TFBM (Fig. 6 and SupplementaryMaterial Fig. S1). For the other nine differentially expressedGSTs (in the presence of dietary H2O2), no clear trendemerged in their association with the potential TFBMs.
We do not know if some or all of the potential TFBMs arefunctional, and in those cases where they are functional,what specific role, if any, they play in the response of themidgut-associated GSTs to the oxidative stressor, dietaryH2O2. They may simply be associated with these genes,with limited or no role in response to this oxidative stressor.However, one thing is clear − there are likely to be otherTFBMs, beyond ARE and XRE, involved in the response ofthe midgut-associated GSTs to dietary H2O2.
Experimental procedures
Fly culture maintenance and tissue dissection
The w1118 D. melanogaster strain was obtained from Dr MishaLudwig at the University of Chicago. The population was reared inan environmental chamber at 24 °C, 60% humidity and 14 : 10 L/Dcycle. Adult flies were transferred to fresh diet (Formula 4-24®Blue, Carolina Biological Supply Co., Burlington, NC, USA) everythree weeks to maintain the strain. Eggs were allowed to developto early third instar larvae over a 5-day period (108–110 h after the
Figure 4. Sequence logo demonstration of all the transcription factor binding motifs (TFBMs) constituting the glutathione S transferases (GSTs) and P450s observed in the third instar Drosophila melanogaster larval midgut transcriptome using oligoarray analysis. (A) A list of potential TFBMs of the observed GSTs. (B) A list of potential transcription factor binding motifs of observed P450s.
334 H.-M. Li et al.
Journal compilation © 2008 The Royal Entomological Society, 17, 325–339No claims to original US government works
egg hatched). The larvae were then removed from the diet andtheir midguts dissected out in 214 mM NaCl solution, and thentransferred to RNAlater® (Ambion Inc., Austin, TX, USA). Thehindgut and Malpighian tubes were excluded during the dissection.After dissecting, 50 midguts were pooled in the RNAlater andimmediately frozen in liquid nitrogen, then transferred to −80 °C.Fifty midguts represented a single replicate for each microarrayexperiment. Three biological replicates were performed, with onebiological replicate per oligoarray for a total of three oligoarrays.
Microarray hybridization, scanning and data analyses
Total RNA was isolated by using the TRIzol® Reagent (Invitrogen,Carlsbad, CA, USA) and RNeasy Mini Kit (Qiagen Inc., Valencia,CA, USA) following the manufacturers’ protocols. The cDNA wasgenerated from 1 µg total RNA using iScript cDNA Synthesis Kit(Bio-Rad Lab., Hercules, CA, USA) according to the manufacturer’sinstructions. We used the Affymetrix Drosophila Genome 1 arrays(Affymetrix, Inc., Santa Clara, CA, USA). Sample preparation,labelling, microarray hybridization and scanning followed Pedraet al. (2004). The affixed 25 oligonucleotide segments are referredto as ‘probes’ in the D. melanogaster genome array. One gene wasrepresented by multiple probes in the array. The detection algorithmuses probe pair intensities to generate a detection P-value andassign a present, marginal or absent call by the AffymetrixGenechip® Expression Analysis. The data was normalized byGene Chip Robust Multi-array Average (Supplementary MaterialTable S1). Overall, 2923 transcripts were considered present or
observed in all three biological replicates, and were accordinglydefined as being midgut-associated genes. The microarray datawere deposited in the Gene Expression Omnibus (GEO, http://www.ncbi.nlm.nih.gov/geo/) and the corresponding accessionnumbers are GSM245144, GSM245146 and GSM245148.
Gene ontology analysis
We used the NetAffx™ Analysis Center (April 2005; http://www.affymetrix.com/analysis/index.affx) to determine the biologicalprocess, molecular function and cellular component information ofthe transcripts present in microarrays. We divided the transcriptsinto different categories based on their molecular functions orbiological processes.
DNA transcription factor binding motif analysis
DNA-binding transcription regulators bind to specific genomicsequences to induce or repress gene expression. We first appliedfive different motif discovery programs to identify potential commonregulatory sequences for a set of co-expressed genes, as eachprogram had different strengths: AlignACE (Roth et al., 1998),MEME (Bailey & Elkan, 1995), MDscan (Liu et al., 2002),BioProspector (Liu et al., 2001) and Weeder (Pavesi et al., 2004).In the current analysis, we focussed on regions near the genes.Each promoter region analysed was 1000 bp long and contained800 bp upstream and 200 bp downstream from the transcriptionstart site of the gene.
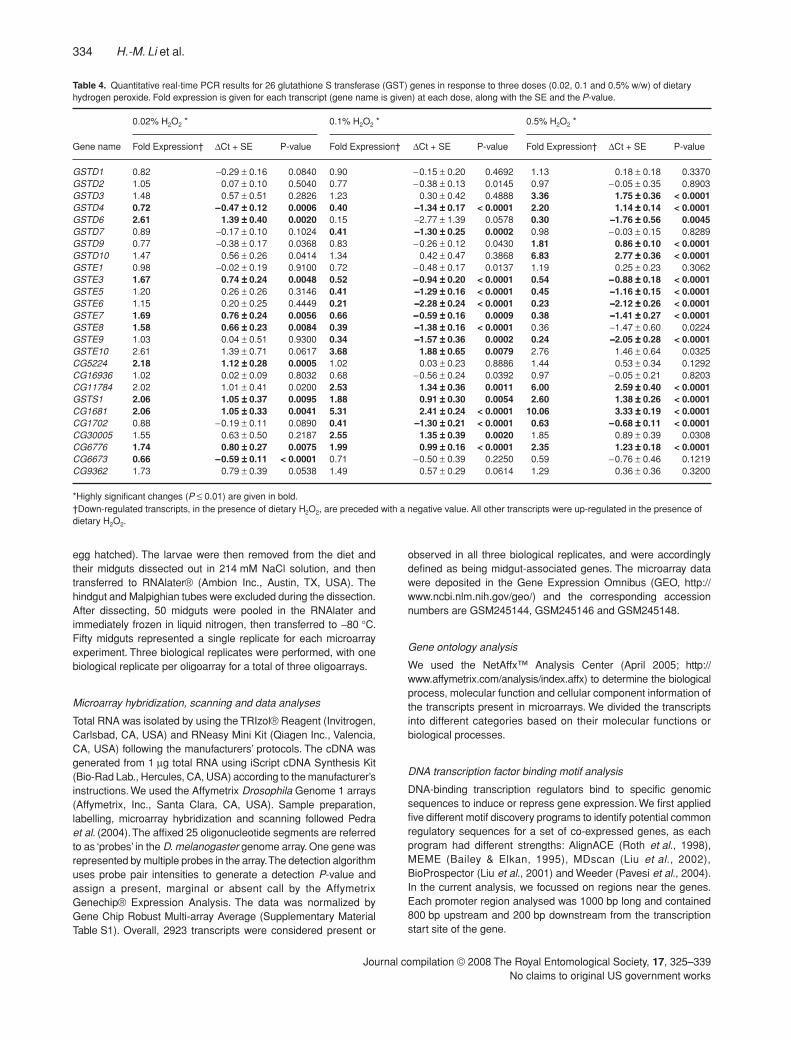
Table 4. Quantitative real-time PCR results for 26 glutathione S transferase (GST) genes in response to three doses (0.02, 0.1 and 0.5% w/w) of dietary hydrogen peroxide. Fold expression is given for each transcript (gene name is given) at each dose, along with the SE and the P-value.
Gene name
0.02% H2O2 * 0.1% H2O2 * 0.5% H2O2 *
Fold Expression† ∆Ct + SE P-value Fold Expression† ∆Ct + SE P-value Fold Expression† ∆Ct + SE P-value
GSTD1 0.82 −0.29 ± 0.16 0.0840 0.90 −0.15 ± 0.20 0.4692 1.13 0.18 ± 0.18 0.3370GSTD2 1.05 0.07 ± 0.10 0.5040 0.77 −0.38 ± 0.13 0.0145 0.97 −0.05 ± 0.35 0.8903GSTD3 1.48 0.57 ± 0.51 0.2826 1.23 0.30 ± 0.42 0.4888 3.36 1.75 ±±±± 0.36 < 0.0001GSTD4 0.72 −−−−0.47 ±±±± 0.12 0.0006 0.40 −−−−1.34 ±±±± 0.17 < 0.0001 2.20 1.14 ±±±± 0.14 < 0.0001GSTD6 2.61 1.39 ±±±± 0.40 0.0020 0.15 −2.77 ± 1.39 0.0578 0.30 −−−−1.76 ±±±± 0.56 0.0045GSTD7 0.89 −0.17 ± 0.10 0.1024 0.41 −−−−1.30 ±±±± 0.25 0.0002 0.98 −0.03 ± 0.15 0.8289GSTD9 0.77 −0.38 ± 0.17 0.0368 0.83 −0.26 ± 0.12 0.0430 1.81 0.86 ±±±± 0.10 < 0.0001GSTD10 1.47 0.56 ± 0.26 0.0414 1.34 0.42 ± 0.47 0.3868 6.83 2.77 ±±±± 0.36 < 0.0001GSTE1 0.98 −0.02 ± 0.19 0.9100 0.72 −0.48 ± 0.17 0.0137 1.19 0.25 ± 0.23 0.3062GSTE3 1.67 0.74 ±±±± 0.24 0.0048 0.52 −−−−0.94 ±±±± 0.20 < 0.0001 0.54 −−−−0.88 ±±±± 0.18 < 0.0001GSTE5 1.20 0.26 ± 0.26 0.3146 0.41 −−−−1.29 ±±±± 0.16 < 0.0001 0.45 −−−−1.16 ±±±± 0.15 < 0.0001GSTE6 1.15 0.20 ± 0.25 0.4449 0.21 −−−−2.28 ±±±± 0.24 < 0.0001 0.23 −−−−2.12 ±±±± 0.26 < 0.0001GSTE7 1.69 0.76 ±±±± 0.24 0.0056 0.66 −−−−0.59 ±±±± 0.16 0.0009 0.38 −−−−1.41 ±±±± 0.27 < 0.0001GSTE8 1.58 0.66 ±±±± 0.23 0.0084 0.39 −−−−1.38 ±±±± 0.16 < 0.0001 0.36 −1.47 ± 0.60 0.0224GSTE9 1.03 0.04 ± 0.51 0.9300 0.34 −−−−1.57 ±±±± 0.36 0.0002 0.24 −−−−2.05 ±±±± 0.28 < 0.0001GSTE10 2.61 1.39 ± 0.71 0.0617 3.68 1.88 ±±±± 0.65 0.0079 2.76 1.46 ± 0.64 0.0325CG5224 2.18 1.12 ±±±± 0.28 0.0005 1.02 0.03 ± 0.23 0.8886 1.44 0.53 ± 0.34 0.1292CG16936 1.02 0.02 ± 0.09 0.8032 0.68 −0.56 ± 0.24 0.0392 0.97 −0.05 ± 0.21 0.8203CG11784 2.02 1.01 ± 0.41 0.0200 2.53 1.34 ±±±± 0.36 0.0011 6.00 2.59 ±±±± 0.40 < 0.0001GSTS1 2.06 1.05 ±±±± 0.37 0.0095 1.88 0.91 ±±±± 0.30 0.0054 2.60 1.38 ±±±± 0.26 < 0.0001CG1681 2.06 1.05 ±±±± 0.33 0.0041 5.31 2.41 ±±±± 0.24 < 0.0001 10.06 3.33 ±±±± 0.19 < 0.0001CG1702 0.88 −0.19 ± 0.11 0.0890 0.41 −−−−1.30 ±±±± 0.21 < 0.0001 0.63 −−−−0.68 ±±±± 0.11 < 0.0001CG30005 1.55 0.63 ± 0.50 0.2187 2.55 1.35 ±±±± 0.39 0.0020 1.85 0.89 ± 0.39 0.0308CG6776 1.74 0.80 ±±±± 0.27 0.0075 1.99 0.99 ±±±± 0.16 < 0.0001 2.35 1.23 ±±±± 0.18 < 0.0001CG6673 0.66 −−−−0.59 ±±±± 0.11 < 0.0001 0.71 −0.50 ± 0.39 0.2250 0.59 −0.76 ± 0.46 0.1219CG9362 1.73 0.79 ± 0.39 0.0538 1.49 0.57 ± 0.29 0.0614 1.29 0.36 ± 0.36 0.3200
*Highly significant changes (P ≤ 0.01) are given in bold.†Down-regulated transcripts, in the presence of dietary H2O2, are preceded with a negative value. All other transcripts were up-regulated in the presence of dietary H2O2.

Midgut transcriptome of Drosophila larvae 335
Journal compilation © 2008 The Royal Entomological Society, 17, 325–339No claims to original US government works
In the second step, we combined the results of the differentanalytical programs into a comprehensive composite analysis. Theresults are represented in the form of position weight matrices(PWMs), whose columns define the probabilities of observingeach nucleotide type (A, C, G, T) at each position of the motif(Gordon et al., 2006). Significant motifs from each of the fiveprograms were pooled and clustered using either a k-medoidsalgorithm (Kaufman & Rousseeuw, 1990) or a hierarchical cluster-ing algorithm (Hartigan, 1975). The functions were pam() andhclust() in R, which is a language and environment for statisticalcomputing and graphics (http://www.r-project.org/). The centre ofeach cluster was selected to represent a potential transcriptionfactor binding motif. To annotate the identified binding motifs, wecompared the results with PWMs in the TRANSFAC database(Wingender et al., 2000).
The most similar transcription factors from TRANSFAC were usedto index each of the candidate binding motifs we observed. Wefurther verified the predictions of transcription factor binding sitesby scanning the promoter sequences with the identified bindingmotifs (cluster centres). Significant matches were evaluated byP-values. A P-value was the probability that a motif with a similarmatching score could be obtained in scanning randomly selectedsequences. The abundant motifs with P-values less than 0.05 areconsidered significant and are presented in Figs 2 and 3. Thesequence logo of a TFBM was built on a set of aligned transcriptionfactor motif sequences. The height of a pile represents theinformation content at a certain position, whereas the height of a
letter represents the individual weight of a base at a certainposition. The sequence logos shown in Fig. 4 were generatedusing WebLogo (http://weblogo.berkeley.edu/). For the XRE andARE motifs with given consensus, the 2 kb upstream regulatoryregions of each genes were scanned for exact matches. Two hundredrandomly generated sequences were also scanned for these motifs.
Hydrogen peroxide feeding experiment and qRT-PCR analyses
Eighty to 100 adult flies were placed in an 8.9 cm (diameter) Petridish containing instant diet. They were allowed to lay eggs on thediet for 2 h and then removed. Eggs were allowed to develop toearly third instar larvae over a 5-day period on the rearing diet.The larvae were then transferred from the rearing diets to theexperimental vials, using a 3/0 NB-38 silverado brush (Yasutomo,South San Francisco, CA, USA). Each 2.5 cm (diameter) × 9.5 cmplastic experimental vial (Genesee Scientific Co., San Diego, CA,USA) was cut to a 3.5 cm height to allow for ease of transfer of thelarvae. Twenty-five larvae were placed in each vial containing364 mg Formula 4-24® Blue instant Drosophila medium and1636 µl of solution with one of the following four treatments: (1)distilled water (control), (2) 0.02% (w/w) H2O2, (3) 0.1% H2O2, and(4) 0.5% H2O2. Hydrogen peroxide solution was dissolved indistilled water from a stock solution of 3% (w/v). Three biologicalreplicates were performed for each treatment.
Total RNA was isolated from 50 larval midguts per treatmentusing TRIzol® Reagent (Invitrogen) and the RNeasy Mini Kit
Figure 5. The locations of four candidate transcription factor binding motifs (TFBMs) in the carboxylesterases associated with third instar Drosophila melanogaster larval midgut observed 2 kb upstream of the gene transcription start site (TSS). The potential ARE and XRE TFBMs associated with the glutathione S transferases (GSTs) expressed in the midgut (based on microarray analysis) are given in Supplementary Material Fig. S4.
Figure 6. Responses of selected third instar Drosophila melanogaster larval midgut-associated glutathione S transferase (GST) genes to three doses of hydrogen peroxide (H2O2) at 0.02, 0.1 and 0.5% (P ≤ 0.01). The common motifs observed from similar patterns of GSTs are given in Fig. S1. For genes without highly significant expression levels (ie P < 0.01), an expression ration of 0 is given in the figure. For details of expression levels and P-values please see Table 3.
336 H.-M. Li et al.
Journal compilation © 2008 The Royal Entomological Society, 17, 325–339No claims to original US government works
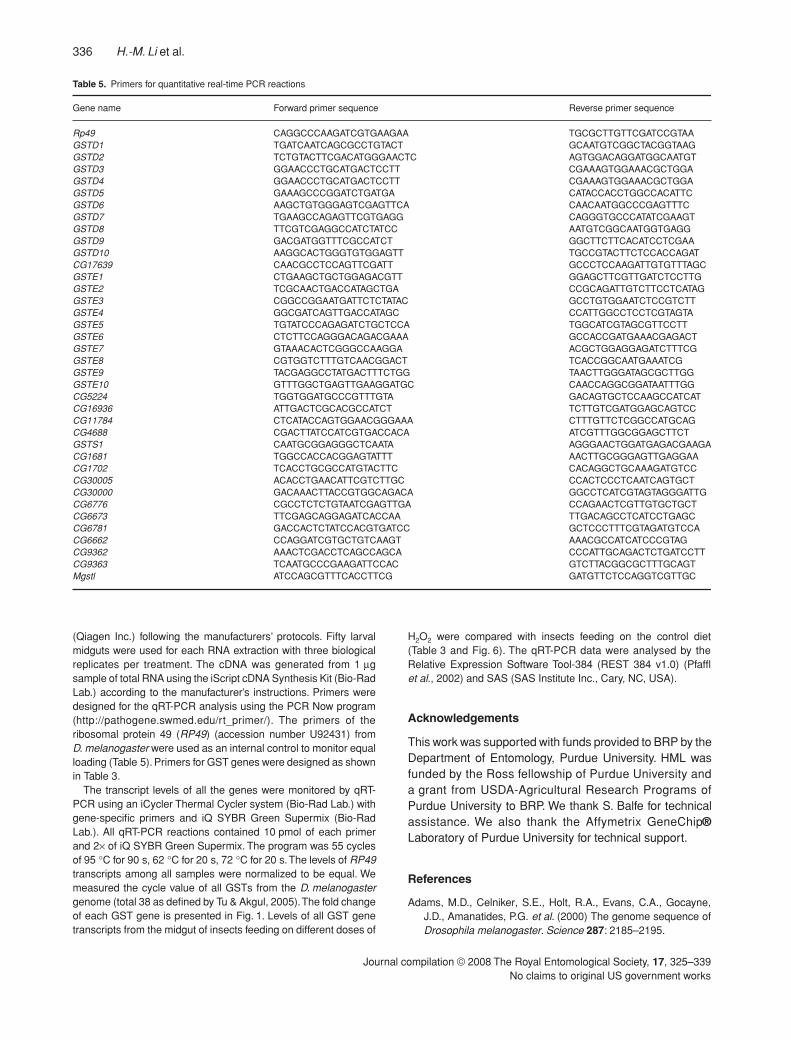
(Qiagen Inc.) following the manufacturers’ protocols. Fifty larvalmidguts were used for each RNA extraction with three biologicalreplicates per treatment. The cDNA was generated from 1 µgsample of total RNA using the iScript cDNA Synthesis Kit (Bio-RadLab.) according to the manufacturer’s instructions. Primers weredesigned for the qRT-PCR analysis using the PCR Now program(http://pathogene.swmed.edu/rt_primer/). The primers of theribosomal protein 49 (RP49) (accession number U92431) fromD. melanogaster were used as an internal control to monitor equalloading (Table 5). Primers for GST genes were designed as shownin Table 3.
The transcript levels of all the genes were monitored by qRT-PCR using an iCycler Thermal Cycler system (Bio-Rad Lab.) withgene-specific primers and iQ SYBR Green Supermix (Bio-RadLab.). All qRT-PCR reactions contained 10 pmol of each primerand 2× of iQ SYBR Green Supermix. The program was 55 cyclesof 95 °C for 90 s, 62 °C for 20 s, 72 °C for 20 s. The levels of RP49transcripts among all samples were normalized to be equal. Wemeasured the cycle value of all GSTs from the D. melanogastergenome (total 38 as defined by Tu & Akgul, 2005). The fold changeof each GST gene is presented in Fig. 1. Levels of all GST genetranscripts from the midgut of insects feeding on different doses of
H2O2 were compared with insects feeding on the control diet(Table 3 and Fig. 6). The qRT-PCR data were analysed by theRelative Expression Software Tool-384 (REST 384 v1.0) (Pfafflet al., 2002) and SAS (SAS Institute Inc., Cary, NC, USA).
Acknowledgements
This work was supported with funds provided to BRP by theDepartment of Entomology, Purdue University. HML wasfunded by the Ross fellowship of Purdue University anda grant from USDA-Agricultural Research Programs ofPurdue University to BRP. We thank S. Balfe for technicalassistance. We also thank the Affymetrix GeneChip®Laboratory of Purdue University for technical support.
References
Adams, M.D., Celniker, S.E., Holt, R.A., Evans, C.A., Gocayne,J.D., Amanatides, P.G. et al. (2000) The genome sequence ofDrosophila melanogaster. Science 287: 2185–2195.
Table 5. Primers for quantitative real-time PCR reactions
Gene name Forward primer sequence Reverse primer sequence
Rp49 CAGGCCCAAGATCGTGAAGAA TGCGCTTGTTCGATCCGTAAGSTD1 TGATCAATCAGCGCCTGTACT GCAATGTCGGCTACGGTAAGGSTD2 TCTGTACTTCGACATGGGAACTC AGTGGACAGGATGGCAATGTGSTD3 GGAACCCTGCATGACTCCTT CGAAAGTGGAAACGCTGGAGSTD4 GGAACCCTGCATGACTCCTT CGAAAGTGGAAACGCTGGAGSTD5 GAAAGCCCGGATCTGATGA CATACCACCTGGCCACATTCGSTD6 AAGCTGTGGGAGTCGAGTTCA CAACAATGGCCCGAGTTTCGSTD7 TGAAGCCAGAGTTCGTGAGG CAGGGTGCCCATATCGAAGTGSTD8 TTCGTCGAGGCCATCTATCC AATGTCGGCAATGGTGAGGGSTD9 GACGATGGTTTCGCCATCT GGCTTCTTCACATCCTCGAAGSTD10 AAGGCACTGGGTGTGGAGTT TGCCGTACTTCTCCACCAGATCG17639 CAACGCCTCCAGTTCGATT GCCCTCCAAGATTGTGTTTAGCGSTE1 CTGAAGCTGCTGGAGACGTT GGAGCTTCGTTGATCTCCTTGGSTE2 TCGCAACTGACCATAGCTGA CCGCAGATTGTCTTCCTCATAGGSTE3 CGGCCGGAATGATTCTCTATAC GCCTGTGGAATCTCCGTCTTGSTE4 GGCGATCAGTTGACCATAGC CCATTGGCCTCCTCGTAGTAGSTE5 TGTATCCCAGAGATCTGCTCCA TGGCATCGTAGCGTTCCTTGSTE6 CTCTTCCAGGGACAGACGAAA GCCACCGATGAAACGAGACTGSTE7 GTAAACACTCGGGCCAAGGA ACGCTGGAGGAGATCTTTCGGSTE8 CGTGGTCTTTGTCAACGGACT TCACCGGCAATGAAATCGGSTE9 TACGAGGCCTATGACTTTCTGG TAACTTGGGATAGCGCTTGGGSTE10 GTTTGGCTGAGTTGAAGGATGC CAACCAGGCGGATAATTTGGCG5224 TGGTGGATGCCCGTTTGTA GACAGTGCTCCAAGCCATCATCG16936 ATTGACTCGCACGCCATCT TCTTGTCGATGGAGCAGTCCCG11784 CTCATACCAGTGGAACGGGAAA CTTTGTTCTCGGCCATGCAGCG4688 CGACTTATCCATCGTGACCACA ATCGTTTGGCGGAGCTTCTGSTS1 CAATGCGGAGGGCTCAATA AGGGAACTGGATGAGACGAAGACG1681 TGGCCACCACGGAGTATTT AACTTGCGGGAGTTGAGGAACG1702 TCACCTGCGCCATGTACTTC CACAGGCTGCAAAGATGTCCCG30005 ACACCTGAACATTCGTCTTGC CCACTCCCTCAATCAGTGCTCG30000 GACAAACTTACCGTGGCAGACA GGCCTCATCGTAGTAGGGATTGCG6776 CGCCTCTCTGTAATCGAGTTGA CCAGAACTCGTTGTGCTGCTCG6673 TTCGAGCAGGAGATCACCAA TTGACAGCCTCATCCTGAGCCG6781 GACCACTCTATCCACGTGATCC GCTCCCTTTCGTAGATGTCCACG6662 CCAGGATCGTGCTGTCAAGT AAACGCCATCATCCCGTAGCG9362 AAACTCGACCTCAGCCAGCA CCCATTGCAGACTCTGATCCTTCG9363 TCAATGCCCGAAGATTCCAC GTCTTACGGCGCTTTGCAGTMgstl ATCCAGCGTTTCACCTTCG GATGTTCTCCAGGTCGTTGC

Midgut transcriptome of Drosophila larvae 337
Journal compilation © 2008 The Royal Entomological Society, 17, 325–339No claims to original US government works
Alin, P., Danielson, U.H. and Mannervik, B. (1985) 4-Hydroxyalk-2-enals are substrates for glutathione transferase. FEBS Lett179: 267–270.
Arbeitman, M.N., Furlong, E.E.M., Imam, F., Johnson, E., Null,B.H., Baker, B.S. et al. (2002) Gene expression during the lifecycle of Drosophila melanogaster. Science 297: 2270–2275.
Arvestad, L., Visa, N., Lundeberg, J., Wieslander, L. and Savolainen,P. (2005) Expressed sequence tags from the midgut and anepithelial cell line of Chironomus tentans: annotation, bioinfor-matic classification of unknown transcripts and analysis ofexpression levels. Insect Mol Biol 14: 689–695.
Bailey, T.L. and Elkan, C. (1995) The value of prior knowledge indiscovering motifs with MEME. Proc Int Conf Intell Syst MolBiol 3: 21–29.
Bauer, L.S. (1995) Resistance: a threat to the insecticidal crystalproteins of Bacillus thuringiensis. Fla Entomol 78: 415–443.
Baum, J.A., Bogaert, T., Clinton, W., Heck, G.R., Feldmann, P.,Ilagan, O. et al. (2007) Control of coleopteran insect peststhrough RNA interference. Nat Biotechnol 25:1322–1326.
Bel, Y. and Escriche, B. (2006) Common genomic structure for theLepidoptera cadherin-like genes. Gene 381: 71–80.
Campbell, P.M. Robin, G.C.D.Q., Court, L.N. Dorrian, S.J., Russell,R.J. and Oakeshott, J.G. (2003) Developmental expressionand gene/enzyme identifications in the alpha esterase genecluster of Drosophila melanogaster. Insect Mol Biol 12: 459–471.
Chapman, R.F. (1998) Alimentary canal, digestion and absorption.In The Insects Structure and Function, 4th edn, pp. 38–69.Cambridge University Press, Cambridge, UK.
Cheriyath, V. and Roy, A.L. (2000) Alternatively spliced isoforms ofTFII-I. Complex formation, nuclear translocation, and differentialgene regulation. J Biol Chem 275: 26300–26308.
Chilcutt, C.F. and Tabashnik, B.E. (2004) Contamination of refugesby Bacillus thuringiensis toxin genes from transgenic maize,Proc Natl Acad Sci USA 101: 7526–7529.
Ebert, M.N., Klinder, A., Peters, W.H., Schaferhenrich, A.,Sendt, W., Scheele, J. et al. (2003) Expression of glutathioneS-transferases (GSTs) in human colon cells and inducibility ofGSTM2 by butyrate. Carcinogenesis 24: 1637–1644.
Enayati, A.A., Ranson, H. and Hemingway, J. (2005) Insectglutathione transferases and insecticide resistance. Insect MolBiol 14: 3–8.
Fabrick, J., Behnke, C., Czapla, T., Bala, K., Rao, A.G., Kramer, K.J.et al. (2002) Effects of a potato cysteine proteinase inhibitor onmidgut proteolytic enzyme activity and growth of the southerncorn rootworm, Diabrotica undecimpunctata howardi (Coleoptera:Chrysomelidae). Insect Biochem Mol Biol 32: 405–415.
Ferre, J. and Van Rie, J. (2002) Biochemistry and genetics of insectresistance to Bacillus thuringiensis. Annu Rev Entomol 47:501–533.
Feyereisen, R. (1999) Insect P 450 enzymes, Annu Rev Entomol44: 507–533.
Feyereisen, R. (2005) Insect cytochrome P450. In ComprehensiveMolecular Insect Science, vol. 4, (Gilbert, L.I., Iatrou, K. andGill, S.S., eds), pp. 1–77. Elsevier, Amsterdam.
Fiers, W., Beyaert, R., Declercq, W. and Vandenabeele, P. (1999)More than one way to die: apoptosis, necrosis and reactiveoxygen damage. Oncogene 18: 7719–7730.
Gill, M. and Ellar, D. (2002) Transgenic Drosophila reveals afunctional in vivo receptor for the Bacillus thuringiensis toxinCry1Ac1. Insect Mol Biol 11: 619–625.
Gnerre, C., Schuster, G.U., Roth, A., Handschin, C., Johansson, L.,Looser, R. et al. (2005) LXR deficiency and cholesterol feedingaffect the expression and phenobarbital-mediated induction ofcytochromes P450 in mouse liver. J Lipid Res 46: 1633–1642.
Gordon, J.J., Towsey, M.W., Hogan, J.M., Mathews, S.A. andTimms, D. (2006) Improved prediction of baterial transcriptionstart sites. Bioinformatics 22: 142–148.
Gorman, M.J. and Paskewitz, S.M. (2001) Serine proteases asmediators of mosquito immune responses. Insect Biochem MolBiol 31: 257–262.
Grant, D.F. and Matsumura, F. (1989) Glutathione S-transferase 1and 2 in susceptible and resistant insecticide resistant Aedesaegypti. Pest Biochem Physiol 33: 132–143.
Ha, E.M., Oh, C.T., Bae, Y.S. and Lee, W.J. (2005) A direct role fordual oxidase in Drosophila gut immunity. Science 310: 847–850.
Hahn, M.W., De Bie, T., Stajichm J.E., Nguyen, C. and Cristianini, N.(2005) Estimating the tempo and mode of gene family evolutionfrom comparative genomic data. Genome Res 15: 1153–1160.
Hanrahan, C.J., Palladino, M.J., Bonneau, L.J. and Reenan, R.A.(1999) RNA editing of a Drosophila sodium channel gene. AnnN Y Acad Sci 868: 51–66.
Hartigan, J.A. (1975). Clustering Algorithms. Wiley, New York.He, H., Soncin, F., Grammatikakis, N., Li, Y., Siganou, A., Gong, J.
et al. (2003) Elevated expression of heat shock factor (HSF) 2Astimulates HSF1-induced transcription during stress. J BiolChem 12278: 35465–35475.
Ikawa, T., Kawamoto, H., Goldrath, A.W. and Murre, C. (2006). E pro-teins and Notch signaling cooperate to promote T cell lineagespecification and commitment. J Exp Med 203: 1329–1342.
Ingle, S.S., Trivedi, N., Prasad, R., Kuruvilla, J., Rao, K.K. andChhatpar, H.S. (2001) Aminopeptidase-N from the Helicoverpaarmigera (Hubner) brush border membrane vesicles as areceptor of Bacillus thuringiensis crylac delta-endotoxin. CurrMicrobiol 43: 255–259.
Jenkins, J.L. and Dean, D.H. (2001) Binding specificity of Bacillusthuringiensis Cry1Aa for purified, native Bombyx moriaminopeptidase N and cadherin-like receptors. BMC Biochem2: 12.
Kaestner, K.H., Knochel, W. and Martinez, D.E. (2000). Unifiednomenclature for the winged helix/forkhead transcriptionfactors. Genes Dev 14: 142–146.
Kaufman, L. and Rousseeuw, P.J. (1990) Finding Groups in Data.Wiley, New York.
Kirchhoff, S., Schaper, F. and Hauser, H. (1993) Interferon regulatoryfactor 1 (IRF-1) mediates cell growth inhibition by transactivationof downstream target genes. Nucleic Acids Res 21: 2881–2889.
Knight, P.J.K., Crickmore, N. and Ellar, D.J. (1994) The receptor forBacillus thuringiensis CryIA(c) delta-endotoxin in the brushborder membrane of the lepidopteran Manduca sexta isaminopeptidase N. Mol Microbiol 11: 429–436.
Krishnan, N. and Kodrik, D. (2006) Antioxidant enzymes inSpodoptera littoralis (Boisduval): Are they enhanced to protectgut tissues during oxidative stress? J Insect Physiol 52: 11–20.
Lehane, M.J., Aksoy, S, Gibson, W, Kerhornou, A., Berriman, M.,Hamilton, J. et al. (2003) Adult midgut expressed sequencetags from the tsetse fly Glossina morsitans morsitans andexpression analysis of putative immune response genes.Genome Biol 4: R63.
Leonhardt SA, Boonyaratanakornkit V, Edwards DP (2004)Progesterone receptor transcription and non-transcriptionsignaling mechanisms. Steroids 68: 761–770.

338 H.-M. Li et al.
Journal compilation © 2008 The Royal Entomological Society, 17, 325–339No claims to original US government works
Li, T.-R. and White, K.P. (2003). Tissue-specific gene expressionand ecdysone-regulated genomic networks in Drosophila. DevCell, 5:59–72.
Liu, X., Brutlag, D.L. and Liu, J.S. (2001) BioProspector: discoveringconserved DNA motifs in upstream regulatory regions ofco-expressed genes. Pac Symp Biocomput 6: 127–138.
Liu, X.S., Brutlag, D.L. and Liu, J.S. (2002) An algorithm for findingprotein-DNA binding sites with applications to chromatin-immunoprecipitation microarray experiments. Nat Biotechnol20: 835–839.
Mittapalli, O., Neal, J.J. and Shukle, R.H. (2005) Differentialexpression of two cytochrome P450 genes in compatible andincompatible Hessian fly/wheat interactions. Insect BiochemMol Biol 35: 981–989.
Murdock, L.L., Brookhart, G., Dunn, P.E., Foard, D.E., Kelley, S.,Kitch, L. et al. (1987) Cysteine digestive proteinase in Coleoptera.Comp Biochem Physiol 87B: 783–787.
Okamoto, K., Tanaka, H., Ogawa, H., Makino, Y., Eguchi, H., Hayashi,S. et al. (1999). Redox-dependent Regulation of Nuclear Importof the Glucocorticoid Receptor. J Biol Chem 274: 10363–10371.
Pavesi, G., Mereghetti, P., Mauri, G. and Pesole, G. (2004) WeederWeb: discovery of transcription factor binding sites in a set ofsequences from co-regulated genes. Nucleic Acids Res 32:W199–203 (web server issue).
Pedra, J.H., Brandt, A., Westerman, R., Lobo, N., Li, H.-M.,Romero-Severson, J. et al. (2003) Transcriptome analysis ofthe cowpea weevil bruchid: identification of putative proteinasesand alpha-amylases associated with food breakdown InsectMol Biol 12: 405–412.
Pedra, J.H.F., McIntyre, L.M., Scharf, M.E. and Pittendrigh, B.R.(2004) Genome-wide transcription profile of field- and laboratory-selected dichlorodiphenyltrichloroethane (DDT)-resistantDrosophila. Proc Natl Acad Sci USA 101: 7034–7039.
Pfaffl, M.W., Horgan, G.W. and Dempfle, L. (2002) RelativeExpression Software Tool (REST) for group-wise comparisonand statistical analysis of relative expression results in Real-Time PCR. Nucleic Acids Res 30: e36.
Reenan, R.A. (2005) Molecular determinants and guided evolutionof species-specific RNA editing. Nature 434: 409–413.
Roth, F.P., Hughes, J.D., Estep, P.W. and Church, G.M. (1998)Finding DNA regulatory motifs within unaligned noncodingsequences clustered by whole-genome mRNA quantitation.Nat Biotechnol 16: 939–945.
van Roon-Mom, W.M., Reid, S.J., Faull, R.L. and Snell, R.G.(2005) TATA-binding protein in neurodegenerative disease.Neuroscience 133: 863–872.
Rushmore, T.H., Morton, M.H and Pickett, C.B. (1991) The anti-oxidant responsive element. J Biol Chem 266: 11632–11639.
Russell, R.J., Robin, G.C., Kostakos, P., Newcomb, R.D., Boyce, T.M.,Medveczky, K.M. et al. (1996) Molecular cloning of an α-esterase gene cluster on chromosome 3R of Drosophilamelanogaster. Insect Biochem Mol Biol 26: 235–247.
Sawicki, R., Singh, S.P., Mondal, A.K., Benes, H. and Zimniak, P.(2003) Cloning, expression and biochemical characterizationof one Epsilon-class (GST-3) and ten Delta-class (GST-1)glutathione S-transferases from Drosophila melanogaster, andidentification of additional nine members of the Epsilon class.Biochem J 370: 661–669.
Schnepf, E., Crickmore, N., Van Rie, J., Lereclus, D., Baum, J.,Feitelson, J. et al. (1998) Bacillus thuringiensis and its pesti-cidal crystal proteins. Microbiol Mol Biol Rev 62: 775–806.
Semenza, G.L., Shimoda, L.A. and Prabhakar, N.R. (2006) Regula-tion of gene expression by HIF-1. Novartis Found Symp 272:2–8.
Sen, C.K. and Packer, L. (1996). Antioxidant and redox regulationof gene transcription. FASEB J 10: 709–720.
Siegfried, B.D., Waterfield, N. and ffrench-Constant, R.H. (2005)Expressed sequence tags from Diabrotica virgifera virgiferamidgut identify a coleopteran cadherin and a diversity ofcathepsins. Insect Mol Biol 14: 137–143.
Singh, S.P., Coronella, J.A., Benes, H., Cochrane, B.J. and Zimniak,P. (2001) Catalytic function of Drosophila melanogasterglutathione S-transferase DmGSTS1–1 (GST-2) in conjugationof lipid peroxidation end products. Eur J Biochem 268: 2912–2923.
Snyder, M.J., Stevens, J.L., Andersen, J.F. and Feyereisen, R.(1995) Expression of cytochrome P450 genes of the CYP4 familyin midgut and fat body of the tobacco hornworm, Manducasexta. Arch Biochem Biophys 321: 13–20.
Tabashnik, B.E., Finson, N., Groeters, F.R., Moar, W.J., Johnson,M.W., Luo, K. et al. (1994) Reversal of resistance to Bacillusthuringiensis in Plutella xylostella. Proc Natl Acad Sci USA 91:4120–4124.
Tijet, N., Helvig, C. and Feyereisen, R. (2001) The cytochromeP450 gene superfamily in Drosophila melanogaster: annotation,intron-exon organization and phylogeny. Gene 262,189–198.
Tu, C.-P.D. and Akgul, B. (2005) Drosophila glutathione S-transferases. Methods Enzymol 401: 204–226.
Ullrich, O., Huser, H.. Ehrlich, W. and Grune, T. (1997) Intracellularmetabolism of 4-hydroxynonenal in primary cultures of rabbitsynovial fibroblasts. Free Radic Biol Med 22: 1153–1157.
Videla, L.A., Arisi, A.C., Fuzaro, A.P., Koch, O.R. and Junqueira,V.B. (2000) Prolonged phenobarbital pretreatment abolishesthe early oxidative stress component induced in the liver byacute lindane intoxication. Toxicol Lett 115: 45–51.
Wang, H., Yang, U., Lee, C. and Blume, J. (2004) Alternative splicing:session introduction. Pac Symp Biocomput 9: 3–4.
Watabe, M., Isogai, Y., Numazawa, S. and Yoshida, T. (2003) Roleof c-Myc in nitric oxide-mediated suppression of cytochromeP450 3A4. Life Sci 74: 99–108.
Wingender, E., Chen, X. and Hehl, R. (2000) TRANSFAC: anintegrated system for gene expression regulation. NucleicAcids Res 28: 316–319.
Wolfson, J.L. and Murdock, L.L. (1990) Diversity in digestiveproteinase activity among insects. J Chem Ecol 16: 1089–1102.
Yan, L.J. and Sohal, R.S. (1998) Mitochondrial adenine nucleotidetranslocase is modified oxidatively during aging. Proc NatlAcad Sci USA 95: 12896–12901.
Yoshinaga, S.K. and Yamamoto, K.R. (1991) Signaling and regula-tion by a mammalian glucocorticoid receptor in Drosophilacells. Mol Endocrinol 5:844–853.
Zhang, L., Savas, U., Alexander, D.L. and Jefcoate, C.R. (1998)Characterization of the mouse cyp1B1 gene. J Biol Chem 273:5174–5183.
Zinke, I., Schütz, C.S., Katzenberger, J.D., Bauer, M., Pankratz, M.J.(2002) Nutrient control of gene expression in Drosophila:microarray analysis of starvation and sugar-dependentresponse. EMBO J 21:6162–6173.
Zou, S., Meadows, S., Sharp, L., Jan, L.Y. and Jan, Y.N. (2000)Genome-wide study of aging and oxidative stress response inDrosophila melanogaster. Proc Natl Acad Sci USA 97: 13726–13731.

Midgut transcriptome of Drosophila larvae 339
Journal compilation © 2008 The Royal Entomological Society, 17, 325–339No claims to original US government works
Supplementary material
The following supplementary material is available for thisarticle:
Figure S1. Sequence logo demonstration of all the transcription factorbinding motifs from glutathione S transferases (GSTs) based on theirresponse to different doses of H2O2. All the factors were observed in the thirdinstar Drosophila melanogaster larval midgut transcriptome.
Figure S2. Searches of antioxidant responsive element-like (ARE-like)(sequence 5′-GTGACNNNG-3′) and xenobiotic responsive element (XRE)(sequence 5′-GCGTG-3′) in the 2 kb upstream region of glutathione Stransferases (GSTs) associated with third instar Drosophila melanogasterlarval midgut.
Figure S3. Searches of antioxidant responsive element (ARE) (sequence5′-GTGACNNNGC-3′) and xenobiotic responsive element (XRE) (sequence5′-GCGTG-3′) in the 2 kb upstream region of cytochrome P450s associatedwith third instar Drosophila melanogaster larval midgut.
Figure S4. Searches of antioxidant responsive element-like (ARE-like)(sequence 5′-GTGACNNNG-3′) and xenobiotic responsive element (XRE)(sequence 5′-GCGTG-3′) in the 2 kb upstream region of carboxylesterasesassociated with third instar Drosophila melanogaster larval midgut.
Table S1. Normalized microarray data with probe IDs using Gene ChipRobust Multi-array Average (GCRMA) method.
This material is available as part of the online article from:http://www.blackwell-synergy.com/doi/abs/10.1111/j.1356-2583.2008.00808.x(This link will take you to the article abstract).
Please note: Wiley–Blackwell are not responsible for thecontent or functionality of any supplementary materialssupplied by the authors. Any queries (other than missingmaterial) should be directed to the corresponding author forthe article.