transcriptional profiling of drought response in …
TRANSCRIPT

TRANSCRIPTIONAL PROFILING OF DROUGHT RESPONSE
IN Sorghum bicolor (L.) MOENCH
by
KAYLA DAWN O'NEAL McCARTOR, B.S.
A THESIS
IN
CROP SCIENCE
Submitted to the Graduate Faculty of Texas Tech University in
Partial Fulfillment of the Requirements for
the Degree of
MASTER OF SCIENCE
Approved

- ^ ACKNOWLEDGEMENTS '^^'
I [yX I would like to thank my co-chairpersons Dr. Nguyen and Dr. Payton for their
% 7 guidance and support. I would also like to thank my committee members Dr.
Rosenow, Dr. Wright, and Dr. Allen for their counsel and advice. I want to also
thank Dr. Auld for his direction and assistance, and Dr. Klueva for her help and
recommendations.

TABLE OF CONTENTS
ACKNOWLEDGEMENTS ii
ABSTRACT v
LIST OF TABLES vii
LIST OF FIGURES viii
CHAPTER
I. INTRODUCTION 1
I ntroduction 1
Literature Review 4
Purpose and Rationale 17
II. MATERIALS AND METHODS 19
Plant Material 19
Phenotypic Analysis 23
EST Processing 26
III. RESULTS AND DISCUSSION 29
Phenotypic Analysis 29
Library Construction and EST Analysis 39
Summary 55

LITERATURE CITED 58
APPENDIX
A, BLAST FILES 63
B. GENE ONTOLOGY 72
IV

ABSTRACT
The identification of genetic factors underlying the complex responses of
plants to drought stress provides a solid basis for improving drought resistance.
The stay-green character in sorghum {Sorghum bicolor L, Moench) is a post-
flowering drought resistance trait, which makes plants resistant to premature
senescence under drought stress during the grain filling stage. The objective of
this study is to integrate phenotypic analysis, physiological data, and expression
profile data to further characterize the genes controlling the stay-green trait. A
detailed description of the stay-green trait, phenotypic characterization, and
expression profiling data will be presented.
To accomplish the objective, two drought-induced, subtracted cDNA
libraries were constructed using the B35 (post-flowering drought resistant/stay-
green parent) and Tx7000 (post-flowering drought-susceptible parent). 10,300
cDNAs were sequenced, representing 3075 5' sequences, 4811 3' sequences,
and 2414 sequences for both 5' and 3' clone ends. Analysis of the contiguous
sequences of the 3' clones shows this collection represents 3235 unique genes.
All sequences were analyzed for those unique to specific stressed parent lines
and assembling a non-redundant collection for gene expression profiling studies.
Tissue for gene expression studies was collected from field trials and
greenhouse experiments from B35, Tx7000, and inbred lines containing specific
QTLs for the stay-green trait. Physiological analyses of stressed plants included

gas-exchange analysis for photosynthesis, transpiration, and stomatal
conductance, as well as leaf green-ness, and chlorophyll content.
VI

LIST OF TABLES
1. Parental, near isogenic (NIL), and recombinant in-bred (RIL) lines 22
2. Stay-green QTL profile and phenotypic characterization of selected drought-stressed near isogenic (NIL) and parental lines 31
3. Stay-green QTL profile, phenotypic characterization, and yield data from selected drought-stressed recombinant inbred (RIL) and parental lines 32
4. Comparison of SPAD measurements (leaf green-ness) and leaf total chlorophyll content 35
5. Summary of ESTs in the Tx7000 Drought Stress Before Flowering (DSBF) and B35 Drought Stress After Flowering (DSAF) libraries 42
6. Summary of contiguous sequences and singleton ESTs in the Tx7000 Drought Stress Before Flowering (DSBF) and B35 Drought Stress After Flowering (DSAF) libraries 43
7. Sample Excel File of Perl Output 72
VII

LIST OF FIGURES
1. Photosynthetic response to post-flowering drought stress in stay-green and non-stay-green sorghum lines 33
2. Percent recovery of photosynthesis for stay-green and non-stay-green sorghum plants 34
3. Stomatal densities for stay-green (B35, RIL 62, NIL 108 and NIL 124) and non-stay-green (Tx7000 and RIL 95) varieties 37
4. Leaf sections at 10X magnification showing stomatal densities 38
5. Average insert size and clones for the B35 and Tx7000 subtracted cDNA libraries 41
6. Perl script written in collaboration with Josh Traweek to parse out useful information from the BLASTcl3 output 44
7. Flow chart illustrating the EST pipeline developed for processing cDNA sequence information generated in this project 50
8. Graphs showing differences between known ESTs in the Tx7000 and B35 cell communication functional groups 53
9. Graphs showing differences between known ESTs in the Tx7000 and B35 cell surface linked signal transduction functional groups 54
10. Single BLASTcl Output 65
11. Complete Gene Ontology List 73
12. Biological Process 1 Step Breakdown 77
13. Signal Transduction Percentages 78
14. Cell Communication Percentages 79
15. Biological Process 2 Step Breakdown 80
16. Cellular Component I Step Breakdown 81
VIII

17. Intracellular Percentages 82
18. Cellular Component 2 Step Breakdown 83
19. Molecular Function 1 -step breakdown 84
20. Enzymes present in EST library 85
21. Known ESTs from Tx7000 nucleic acid binding group 86
22. Known ESTs from B35 nucleic acid binding group 87
IX
CHAPTER I
INTRODUCTION
Introduction
Sorghum is a leading cereal grain in arid and semi-arid regions, ranking
fifth in importance among the world's grain crops, following wheat, maize, rice
and barley (Doggett 1988). An average of 13 million acres are sown to sorghum
each year in the United States alone, with an estimated value of $1,6 billion.
Currently sorghum is a dietary staple for more than 500 million people in over 30
countries (National Research Council 1996). On a worldwide basis, an average
of 50% of the sorghum grown is used for human consumption
(http://www,sorghumgrowers,com/whatis.htm 1999), In addition to human
consumption, sorghum is a popular component in animal feed, for both roughage
and grain, because it is much less expensive to produce than other crops such
as corn. Sorghum is also used in industrial waxes, packing material, wallboard,
ethanol, beverages, and brewing. Despite its worldwide economic importance,
sorghum is less characterized at the genetic and molecular levels than many
other cereal crops. Sorghum is however, considered a good model species for
drought tolerance, especially in grasses, and many researchers are beginning to
realize its importance to dry-land agriculture.
Today's agriculturalists are faced with a unique challenge of how to cope
with the loss of arable land and plateaus in yield increase in the face of a growing

world population. For at least the past century, the population increase has been
exponential. From the present population of approximately 6.5 billion, the world
population is projected to reach 8,3 billion by 2025, To meet the projected food
demand for this increasing population, researchers and producers agree on the
necessity of an increase in the average yield of cereal crops. While it is easy to
conclude that higher yields will help alleviate the predicted food shortages,
turning this idea into reality stretches the limits of science, agriculture, and
technology. The majority of agriculturally important crops have already been fully
exploited genetically in terms of yield potential. However, major improvements in
overcoming the negative impact of environmental stress factors that limit
productivity are still feasible.
Crop production worldwide is limited by environmental factors and much of
this can be attributed to drought stress. Drought stress has been cited as the
most important cause of yield reduction in crop plants (Boyer 1982). Although
sorghum is grown in semi-arid and arid regions and considered a drought
tolerant crop, drought stress can interfere with normal panicle development and
diminish yield. Plants respond to these stresses at the molecular and cellular
levels as well as at the physiological level. The identification of genetic factors
underlying the complex responses of plants to drought stress provides a solid
basis for improving drought resistance.
Drought response in sorghum has been classified into two distinct stages,
pre-flowering and post-flowering (Rosenow 1981). Resistance to water deficit

stress at both of these stages has been reported to occur in the existing
germplasm. However, many genotypes with a high level of resistance at one
stage are susceptible at the other stage (Walulu et al, 1994), Most sorghum
cultivars used for grain production have pre-flowering drought resistance but do
not have any significant post-flowering drought resistance (Subudhi 1999). Pre-
flowering drought stress during grain development often leads to premature leaf
senescence (Rosenow 1981). Post-flowering drought resistance allows plants to
retain their leaves in an active photosynthetic state when stressed during the
grain filling stage and has been referred to as stay-green response (Walulu et al.
1994).
The object of this study is to identify genes that could be associated with the
stay-green phenomenon in sorghum by looking at the differences in gene
expression between and stay-green and non-stay-green varieties. The
identification and characterization of genes controlling the stay-green
phenomenon in sorghum will provide scientists with a better understanding of
drought tolerance. With sorghum as a model grass species, it can be expected
that improvements will eventually be made in all cereal crops that serve as staple
foods for much of the world's population. Scientists can add this new tool to their
arsenal when battling the age-old foe of world hunger.
According to Bohnert et al. (1995) mechanisms by which plants adapt to
abiotic stresses need to be quantified at a physiological, molecular and genetic
level. Future research must be directed at incorporating several disciplines of

science and genetics in order to fully understand the molecular and genetic data
necessary for functional characterization. The first step towards this goal is the
rapid discovery of genes. This can be done through large scale partial
sequencing of randomly selected cDNA clones or expressed sequence tags
(ESTs) (Cushman and Bohnert 2000), Recent advances in high-throughput
genome analysis are making it possible for scientists to quickly sequence entire
genomes in a cost efficient manner. It is also possible to study gene expression
on a larger scale. The advent of microarrays and other similar technologies
allows for the comparison of expression patterns of several thousand genes with
a single hybridization. Once genes of particular interest are identified, scientists
will begin to understand their functions.
Literature Review
Abiotic and biotic stresses have a profound effect on plant growth. It is
estimated that only 1% of the world's arable land can be categorized as free of
stress (Dudal 1987). Plants respond to stress by making adjustments at the
levels of morphology, phenology, physiology and biochemistry (Zhang 2000).
The timing and intensity of the stress plays a major role in determining the
sequence of plant responses contributing to large genotype by environmental
interactions (Fernandez 1993). Given that scientists presume genes regulate
these changes, many labs have focused their efforts on the isolation and
characterization of genes induced by stress, Singh et al, (2002) reported that

multiple signaling pathways regulate plant stress responses, and that there is
significant overlap between the patterns of gene expression in plants and
response to different stresses. They also reported that stress gene induction
occurs primarily at the level of transcription. Understanding the regulation of
temporal and spatial expression patterns of specific stress genes will play an
important part in unlocking the mysteries of plant stress response. Cushman et
al. (2000) believe the functional determination of all genes that participate in
stress adaptation or tolerance reactions are expected to provide an integrated
understanding of the biochemical and physiological basis of stress response in
plants. With the opportunity of deciphering plant stress responses, it will be
possible to engineer tolerance traits for improved crop productivity.
A major goal for sorghum improvement is the development of high-yielding
plants that have an advantage in water-limiting conditions at both pre- and post-
flowering stages of development. In the past, sorghum breeders have used
empirical methods to select for yield under drought conditions. However, more
recently, Borrell et al. (2000a) have reported that some breeders have identified
secondary traits that confer yield advantage under drought and have developed
criteria for selecting these traits. Results from these programs suggest that
advances in crop improvement under drought conditions are more likely if
drought resistance traits are selected in addition to yield. Stay-green or delayed
leaf senescence is one such trait.

Pre- and post-flowering resistance to drought-stress are thought to be
controlled by different genetic mechanisms (Xu 2000), Pre-flowering drought
responses in sorghum are expressed between panicle differentiation and
flowering, Pre-flowering stress affects panicle size, grain number and grain yield
(Kebede et al. 2001). Post-flowering stress occurs during the grain development
stage and can result in premature plant (leaf and stem) death and leaf
senescence, lodging, stalk root disease and significant yield loss (Sanchez et al.
2001). One of the most important post-flowering drought responses is the stay-
green characteristic, which allows for resistance to premature leaf senescence.
Stay-green is indicated by the maintenance of green stems and upper leaves
when water is limiting during grain filling (Rosenow 1987). The expression of
stay-green has also been reported in other cereals including maize, rice, oats
and certain pasture grasses (Borrell 2000a), but sorghum still exhibits a stronger
tolerance to hot, dry conditions. Because sorghum is better adapted to dry
environments than other major cereals, it is likely that the sorghum genome
contains a range of drought resistance mechanisms not yet discovered (Subudhi
et al. 1999). The stay-green trait in sorghum is genetically and physiologically
complex, exhibiting a variety of expression patterns and environmental
sensitivities depending on background genotype (Thomas and Howarth 2000).
Of the five stay-green classes reported, two are functional and the rest are
cosmetic (Sanchez 2000). The cosmetic classes remain green during severe
drought stress but lack photosynthetic functionality. This can partially be

attributed to the greater than normal amounts of cytokinins found in stay-green
varieties (McBee 1984), The two functional classes remain photosythetically
active when water is limiting. According to Luquez and Guiamet (2001), the stay
green trait may result from (1) the onset of leaf senescence, (2) a reduced rate of
senescence, or (3) the inhibition of one of the processes involved in chlorophyll
breakdown.
Leaf senescence occurs as a natural biological process of aging, but can
also be triggered by water deficit. Drought during grain filling speeds up the leaf
senescence, resulting in a premature termination of grain filing and finally death.
Senescence is normally characterized by chlorophyll loss and a progressive
decline in photosynthetic capacity. The rate of senescence determines the
maintenance of quality flowers, fruits and vegetables (Xu 2000). Leaf yellowing
due to chlorophyll degradation is widely used as a phenotypic marker of plant
senescence, although a series of other biochemical and physiological changes
are also involved (Cha 2002).
Leaf yellowing is a sign of chlorophyll degradation in the pigment-protein
complexes of the photosynthetic apparatus (Borrell 2000a). Sorghum hybrids
containing the stay-green trait retain more photosynthetically active leaves under
drought compared to non-stay-green plants (Borrell 2000a), In genetic variants
with delayed leaf senescence, deconstruction of the photosynthetic apparatus
during leaf senescence is partially or completely prevented (Thomas 2000). In a
study by Akhtar et al. (1999), stay-green mutants were cited as valuable tools for

understanding senescence and degradation of different thylakoid constituents.
Their results indicate that the light harvesting complex II (LHCII) polypeptides in
leaves are somehow protected from senescent degradation during senescence,
Cushman and Bohnert (2000) have also come to a similar conclusion by
comparative EST efforts aimed at identifying the transcriptional differences
between stressed and unstressed halophyte plants. Their work revealed a
distinct down-regulation of transcript abundance for components of the
photosynthetic apparatus and an up-regulation of constituents involved in either
protein restructuring or adaptation to osmotic and dehydration stress in the
stressed plants. This indicates a mechanism through which stressed plants
direct resources away from photosynthesis
Leaf senescence has been described as a type of programmed cell death
that recycles nutrients from old, nonfunctional leaves to new and developing
areas of the plant (Jordi et al. 2000), Borrell and Hammer (2000) believe it could
be triggered by an increased demand for nitrogen in developing areas of the
plant. Thomas and Rogers (1990) have reported that nitrogen status is closely
related to the longevity of a plant's leaves. For stay-green leaves to remain
photosynthetically active and retain leaf green-ness, nitrogen must remain in the
leaves to maintain the integrity of the photosynthetic apparatus. With 25% of a
leafs nitrogen status bound in chlorophyll and thylakoid proteins, it is important to
understand the implications of nitrogen retention in the leaves on seed
development and yield (Hauck et al. 1997).
8

Cha et al, (2002) have investigated the stay green character from the
viewpoint of increasing agronomic potentials in crops such as grain yield, plant
biomass, forage quality and resistance to abiotic stress. They used net
assimilation, the difference between the gross amount of resources captured by
photosynthesis and those dissipated by growth and maintenance, to determine
plant production and found that one possible way to increase production is to
retain the photosynthetic activity during grain filling.
Delayed onset and reduction in the rate of leaf senescence are both ways
of increasing green leaf area at maturity (GLAM) which has been shown to
correlate positively with grain yield under terminal water deficit (Borrell 2000b).
Borrell (2000a) supports this by reporting that hybrids containing the B35 source
of stay-green retained significantly more GLAM than non-senescent hybrids. The
duration of leaf senescence is influenced by the timing of the onset of
senescence and the timing of physiological maturity. Timing and severity of
drought are critical in determining both leaf area development and subsequent
senescence. Environmental conditions that encourage high leaf area production
before anthesis followed by severe post-anthesis drought contribute most to the
expression of stay-green. Borrell (2000b) believes that using these coefficients,
together with an understanding of the functional basis of physiological responses
would enable simulation of effects of the stay-green drought resistance trait.
Another important aspect of stay-green genotype is its resistance to
charcoal rot and lodging because it continues to fill grain normally under drought

conditions (Rosenow 1987). Lodging occurs when the stem and root system can
no longer physically support the plant resulting in stem breakage and plant
collapse. Lodging adversely affects yield in mechanized cropping systems due
to the inability to harvest lodged plants. Delayed senescence in sorghum results
in greater functional leaf area during grain filling and after physiological maturity.
Duncan (1984) found this led to an increase in the amount of basal stem-sugars
contained in stay-green cultivars. This increased accumulation of soluble sugars
in stay-green lines thereby reduces the plant's dependence on stored assimilates
from the stem to fill their grains (McBee et al, 1983), ultimately resulting in
maintenance of stem integrity and resistance to lodging. Furthermore, there is a
positive correlation between the rate of leaf senescence and magnitude of stem
reserves mobilized, suggesting that stay-green hybrids are less reliant on
nonstructural stem carbohydrate to fill their grain than are senescent hybrids
(Borrell et al, 2000b). Borrell et al. (2000b) also reported that higher
concentrations of stem sugars improve the digestible energy content of the straw
from stay-green sorghum plants. This makes stay-green a valuable trait for both
grain and fodder production in dual-purpose sorghums crops
The stay-green trait prolongs life and productivity of a plant during water
limiting conditions. While it seems intuitive that any defense mechanism that will
postpone the onset of senescence and keep leaves green will benefit the crop, it
is important to understand whether this translates into yield increase or if it has
an adverse effect on yield in environments that are not water limiting. Borrell and
10

Douglas (1996) reported a positive association between stay-green and grain
yield under water-limited environments. They stated that when water was
limiting, stay-green genotypes retained more green leaf areas than non-stay-
greens and continued to fill their grain normally under drought conditions.
Because yield is often related to the duration of the seed filling period, a long
filling period may generate higher seed yields. Luquez et al. (2001) believes
extending the effective seed filling period requires the maintenance of an active
photosynthetic canopy; therefore, the length of the filling period is partially related
to green leaf area duration. The delayed onset of senescence was also
associated with higher leaf nitrogen status in the stay-green hybrids, resulting in
greater yields under drought (Borrell and Douglas 1996). In another study by
Borrell et al. (2000b), grain yield increased significantly for every day that onset
of leaf senescence was delayed under water-limited conditions. The stay-green
hybrids produced 47% more biomass between anthesis and maturity than their
senescent counterparts under water-limited conditions, suggesting that sorghum
hybrids possessing the stay-green trait have a significant yield advantage under
post-anthesis drought (Borrell 2000b). His study also suggested that there was
no yield cost associated with the stay-green trait under well-watered conditions
with no variation in grain yield observed among hybrids in the fully irrigated
control. In a separate study, Luquez et al. (2001) also found that in some
environments the maintenance of non-senescent leaf area in stay-green
phenotypes of sorghum and other species resulted in higher seed yields than
11

those of their normally senescing counterparts. Overall, stay-green hybrids have
been shown to yield more than senescent hybrids under post anthesis drought
without a yield cost associated with this trait under well-watered conditions.
Growing stay-green plants should benefit sorghum growers in drier years through
increased yield and lodging resistance, without imposing a yield cost in wetter
years.
A principal focus in plant biology is the elucidation of genes that regulate
unique features that distinguish major crop plants from botanical models.
Ostedund and Paterson (2002) agree that while research on the model organism
Arabidopsis thaliana has advanced rapidly, our understanding of most
commercially important plants is not as well developed. According to Devos et
al. (1999), early reports of the conservation of gene order between sorghum and
Arabidopsis have not been as useful a tool as once hoped for when predicting
gene order in sorghum and other grasses. Several sequence analyses of certain
homologous regions of different grass species have confirmed a significant
conservation of gene order within the grasses, showing few inversions,
duplications, chromosome translocations, and individual gene transfer events
(Bennetzen 2000). Given that the grasses compared have diverged over 60
million years and contain different numbers of chromosomes. Mullet et al. (2001)
considered it an important finding that so few rearrangements were detected.
This and other such research on comparative mapping has led Subudhi et al,
(1999) to believe it is likely that all the grasses have a single genetic system.
12

Mullet et al. (2001) concluded that comparisons of orthologous gene sequences
from related grass species and other flowering plants have proven the usefulness
of comparative maps between grasses for the identification of conserved
elements of genes. According to Mullet et al. (2001), functional sections of
genes from sorghum, rice and maize maintain sufficient conservation for
recognition despite the divergence of repetitive sequences that has occurred
since the separation of sorghum from maize and rice (20 and 50 million years,
respectively). The extraction of gene sequences from sorghum should prove to
be a valuable tool in the identification and annotation of sequences from the
genomes of other grasses.
Sorghum's germplasm contains unique genes and beneficial alleles that
enable it to survive in water-limiting conditions such as the arid African
environment in which it originated (Doggett 1988). This extraordinary tolerance
for water and heat stress, make it a prime candidate for improving drought
tolerance in other agronomically important grasses such as maize and rice
through the use of sorghum stay-green genes once they are isolated. Sorghum's
relatively small genome (750 million Mbp), diverse germplasm and incremental
divergence from maize and rice all contribute to its importance as a model grass
species (Mullet et al. 2001), The study of sorghum should play a major role in
developing our understanding of the functions of grass genes through
comparative genomics.
13

Assessment of the genetic diversity of a crop species is essential for its
improvement. Traditional breeding programs try to capture genetic variation
through wild germplasms, hybridization, searching out useful mutations and cell
tissue cultures to improve stress tolerance in plants. While some stress genes
have been conferred, there has been somewhat limited and varied success with
improved stress resistance under field conditions. The complex nature of stress
tolerance traits makes it difficult for breeders to identify and select stress
tolerance traits that do not result in yield losses in non-optimal conditions. Many
stress tolerance traits are controlled by several genes known as quantitative trait
loci (QTLs). To complicate matters many QTLs that are linked to tolerance at
one stage in development can differ from those linked to tolerance at other
stages (Cushman and Bohnert 2000). Regardless of these obstacles, many
scientists still believe marker-assisted selection of specific secondary traits that
are indirectly related to yield will become increasingly useful as the resolution of
the genetic and physical chromosome maps of the major crops improves.
For sorghum, much attention has been given to discovering the QTLs
associated with stay-green. Previous mapping experiments have identified QTLs
four associated with the stay-green trait that remain consistent across several
sorghum lines and across environments (Kebede et al, 2001). These QTLs
correspond to genes regulating leaf abscisic acid response, photosynthetic
carbon metabolism and heat shock proteins, and account for 53,5% of the
14

phenotypic variation in stay-green rating. These QTLs were used when selecting
derived lines for expression analysis in this study.
Once desirable QTLs have been identified, researchers can use this
information breeders will have a better idea of what they are trying to introgress
into a cultivar. As the resolution of physical and genetic maps improve and
whole genomes are sequenced, QTL identification and consequent breeding will
improve (Cushman and Bohnert 2000). Such knowledge will aid in selection of
stress tolerance and yield component traits for expression profiling and functional
characterization.
In the opinion of Osteriund and Paterson (2002), the systematic method of
map-based cloning of QTLs provides a reliable way to locate genes controlling
specific traits, but it is a slow and tedious approach. They believe the new
developments in large-scale expression profiling are providing an improved
method of surveying genome-wide transcription. The first step towards
characterizing the genetically complex stress responses in plants is the rapid
discovery of genes by large scale sequencing of randomly selected cDNA clones
and expressed sequence tags (ESTs) (Cushman and Bohnert 2000). Gene
sequence information obtained across the sorghum genome will allow for the
sequence-based alignment of the sorghum genome map with other grasses, in
particular the nearly completed rice genome (Mullet et al, 2001). This
comparison, along with ongoing EST generation will lay a strong foundation for
15

the discovery of gene function in important stress response genes that are
beneficial to crop production.
Gene expression profiling quantifies the presence or absence of
transcribed RNA at specific stages of plant development or under specific
stresses. The coupling of large-scale sequencing efforts and new technological
advances provides researchers with an opportunity to efficiently and quickly
survey the genome-wide distribution and expression of genes. Serial analysis of
gene expression (SAGE), oligonucleotide arrays, cDNA microarrays, and
massively parallel signature sequencing (MPSS) are just a few examples of the
techniques available (Pollock 2002).
Microarrays, both oligonucleotide and cDNA-based, are among the most
frequently used expression profiling technologies. The most common application
of array technology in gene discovery is the monitoring of the up- or down-
regulation of transcripts in response to specific stimuli (Osteriund and Paterson
2002).
According to Mullet et al. (2001), sorghum EST microarrays are being
created that will be used to characterize global changes in sorghum gene
expression that occur in response to abiotic and biotic factors. With the
availability of high-resolution sorghum genome maps, a more complete
understanding of sorghum gene function, and developing sorghum unigene
slides, we should soon be able to comprehend the genetic basis of sorghum's
ability to adapt and survive in adverse conditions. Improvements in sorghum do
16

not only benefit regions of the world that rely on it as their dietary staple, it offers
an opportunity to increase crop survival for other grain species. As more
sorghum genes providing adaptation to adverse environments or controlling other
beneficial traits, especially stay-green, are identified and understood, they can
successfully be transferred into other crops.
The purpose of this study is to identify a collection of putative stay-green
genes that confer post-flowering drought resistance by screening ESTs
generated from drought stressed sorghum libraries, A collection of ESTs
believed to be associated with drought resistance will be further screened
through microarry analysis for expression profiling with RNA from well watered
and drought stressed sorghum plants. This work will hopefully lay a strong
foundation for future functional characterization of the stay-green trait so that
advances can be made in sorghum improvement, and eventually applicable to
the improvement of all grass species.
Purpose and Rationale
Because the lack of adequate soil moisture, coupled with high
temperatures, is the single greatest source (71%) of yield reduction in plants
woridwide, it is important for crop researchers to focus their attention on drought
resistance (Krieg 1989). Sorghum's superior tolerance to hot and dry
environments and unique ability to withstand drought stress at different
developmental stages make it an excellent candidate for drought stress studies.
17

We hypothesize that there will be differences in expression levels and gene
groups between pre-flowering drought resistant and post-flowering drought
resistant plants. Analysis of ESTs and gene groups in each library will allow us
to detect expression level differences if present. If this hypothesis is true, it will
be possible to identify key regulatory genes in drought response pathways in
further studies, increasing our knowledge of stress physiology, which will lead to
the development of more drought tolerant crops. With the rapid advances of
genomics technologies, it is becoming possible to quickly and efficiently search
entire genomes for interesting sets of genes. The objectives of this study were to
develop tools for monitoring gene expression and to identify putative drought
response genes in sorghum, with an emphasis on drought stress and the stay-
green phenomenon. These tools include an EST library and processing pipeline.
The results obtained from the EST analysis will give us an idea of genes that are
expressed in pre-flowering versus post-flowering drought responses. Further
expression studies will give an indication of which genes are up- or down-
regulated in irrigated versus stressed tissue and what degree of stress is
necessary to induce a response from a particular gene.
18

CHAPTER II
MATERIALS AND METHODS
Plant Material
Six sorghum lines have been targeted for this study: two parental lines,
B35 and Tx7000, two Recombinant Inbred Lines (RIL), 62 and 95, and two Near
Isogenic Lines (NIL), 108 and 124 (Table 1). B35, now officially released as BTx
642, is a post-flowering drought resistant variety that expresses the stay-green
phenotype when exposed to soil moisture stress during the grain development
stage of growth, but is susceptible to pre-flowering drought stress. It is a BC1
derivative of IS12555, a durra landrace cultivar from Ethiopia (Walulu et al,
1994). Tx7000 has excellent pre-flowering drought resistance, but is susceptible
to post-flowering drought stress. Tx7000, also known as the variety Caprock, is
an old sorghum variety developed by R. E. Karper at the Lubbock Experiment
Station over 50 years ago from a Kafir x Milo (Durra) cross (Quinby 1958). The
two RILs were developed at the Texas Agricultural Experiment Station in
Lubbock, Texas under the supervision of Dr. Darrell Rosenow, while the NILs
were developed at Texas Tech University under the supervision of Dr. Henry
Nguyen. The RILs and NILs were obtained from B35 and Tx7000 crosses that
were scored over a period of several years for the stay-green trait under post-
flowering drought stress conditions. The RILs were developed from the direct
cross, B35 x Tx7000, and are part of the mapping population used by Xu et al.
19

(2000) to map stay-green QTLs. The RILs were selected for this study based on
their stay-green rating and the presence or absence of four known stay-green
QTLs. RIL 62 was chosen because it contains all four QTLs and exhibits similar
stay-green ratings and chlorophyll measurements to B35. RIL 95 lacks all four
known QTLs and closely resembles Tx7000 in regard to stay-green rating and
chlorophyll measurement. The NILs are BC6 derivatives of the cross B35 to
Tx7000 with six backcrosses to Tx7000 with selection for stay-green QTLs at
each backcross. Only the presence of two QTLs was taken into consideration
when choosing the NILs for this study. Subudhi et al. (2000) found that QTLs
Sg2 and Sg3 control most of the phenotypic variation. NIL 108 contains only
QTL 2 and NIL 124 contains both QTL 2 and 3. Both NILs show stay-green
ratings and chlorophyll measurements somewhat comparable to B35,
In 2003, plants were grown in 4 trials; 3 field trials (Texas tech field in
Lubbock, TX, TAES field in Lubbock, TX, and TAES field in Halfway, TX) and 1
greenhouse experiment (USDA-ARS in Lubbock, TX). Leaf relative water
content (RWC), photosynthetic activity, stay-green ratings, and chlorophyll
content were measured under irrigated and drought conditions. Leaf and root
samples were collected from well-watered and post-flowering drought stressed
plants.
The greenhouse experiment was conducted over approximately a three-
month period. Plants were grown in 5-gallon pots with a sand and soil mixture.
Each pot contained two plants. The plants were watered with a nutrient mixture.
20
Daily waterings were administered at 45-minute intervals, until water was
suspended for stress initiation. The average greenhouse temperature during the
time of plant growth was 25°-28°C. Plants were stressed at the onset of
flowering by the complete removal of irrigation. After reaching a relative water
content of 60%, the plants were re-watered. Samples were collected at 90%,
80%, and 60% RWC, and after recovery (~ 7 days after the reinstatement of
water). Leaves were sampled approximately every three days to obtain samples
from each of the levels of RWC previously mentioned. Leaf samples were taken
from the second leaf from the flag leaf, de-ribbed and immediately frozen in liquid
nitrogen for storage. One leaf was taken off each of the two plants in each pot.
At the time of each leaf sampling, leaves were taken for RNA extraction, leaf
disks were taken for RWC and total chlorophyll content, leaf green-ness was
measured and the soil volumetric water content was recorded.
For the Lubbock field trials, stay-green was evaluated under full and
limited irrigation for post-flowering drought stress response. Rates of
photosynthesis, leaf RWC, and visual stay-green ratings were taken at or soon
after physiological grain maturity. The visal stay-green ratings were made on 1-5
scale as described by Rosenow et al. 1997. The data set for the 2002 growing
season was incomplete due to late season rainfall and therefore an absence of
water-limiting moisture stress.
21

Table 1. Parental, near isogenic (NIL), and recombinant in-bred (RIL) lines.
Line Description
B35 a post-flowering drought resistant variety that expresses the stay-
green phenotype
"TxTOOO a pre-flowering drought resistant variety that is susceptible to post-
flowering drought stress
RIL 62 a recombinant inbred line, from the cross B35 x Tx7000, that all
four QTLs of interest and exhibits similar stay-green ratings and
chlorophyll measurements to B35
RIL 95 a recombinant inbred line, from the cross B35 x Tx7000, that lacks
all four QTLs of interest and closely resembles Tx7000 in regard to
stay-green rating and chlorophyll measurement
NIL 108 a near isogenic line, a B35 x Tx7000 cross with 6 backcrosses to
Tx7000, that contains QTL 2 and exhibits good stay-green ratings
NIL 124 a near isogenic line, a B35 x Tx7000 cross with 6 backcrosses to
Tx7000, that contains QTLs 2 and3 and exhibits good stay-green
ratings
22

Phenotypic AnalYRi.«s
Photosynthetic Activity
Plant photosynthesis readings were taken using the Li-Cor 6400 to
examine the responses of the plants to post-flowering drought stress.
Photosynthesis was monitored at saturating light (1500 i mol m" s" PPFD)
provided by a red/blue LED light source (model LI 6400-02B), 50% relative
humidity, and a CO2 setting of 400 pmol mol. The Li-Cor 6400 recorded the
leafs internal carbon dioxide (CO2) status, relative humidity (RH) and stomatal
conductance (cond). Readings were taken from the leaf closest to the top that
was receiving full sun. Photosynthesis readings were taken from each plant
every three days in order to capture information from plants stressed to 90%,
80%, and 60% RWC, and at recovery.
Leaf Green-ness
Leaf green-ness was measured non-destructively using the Minolta SPAD
502 chlorophyll meter. SPAD readings are based on the amount red light that is
absorbed by the leaf chlorophyll relative to the amount of light transmitted
(http://www.ianr,unl.edu/arslincoln/swcru/chlor_meter.htm 2003). The more red
light that is absorbed, the more chlorophyll is present, which indicates a greener
plant. A study investigating the correlation between actual chlorophyll content
and leaf greenness as measured by the Minolta SPAD meter reported that the
23

chlorophyll per leaf area had a near linear relationship with the SPAD readings
(Xu et al. 2000). This result suggests a SPAD meter can provide an unbiased
quantitative measure of the severity of leaf chlorosis. Each value was taken as
an average of three readings from two leaves on each of two plants per pot.
Higher SPAD values indicate a higher total chlorophyll content.
Chlorophyll Content
Leaf disks were taken from the second or third leaf from the flag leaf and
immediately stored in liquid nitrogen. Disks were taken with a cork borer from
each of the two plants in a pot and averaged. The disks (1,767 cm^) were
ground into powder in the presence of liquid nitrogen. The powder was then
soaked in 80% acetone for 1-2 hours in the dark at 4°C. After soaking, the
mixture was centrifuged briefly so the supernatant could be removed and read in
the spectrophotometer. Spectrophotometer readings were taken at wavelengths
of 470, 663, and 647 to measure the content of chlorophylls A and B and
caroteniods according to the method established by Lichtenthaler (1987).
Volumetric Water Content
Volumetric water content (VWC) was measured using the Field Scout
TDR 100 Soil Moisture Meter. VWC is a ratio of the volume of water in a given
volume of soil to the total volume of soil. It describes what portion or volume of
the voids remains water filled as the soil drains. Measurements were taken as
24

an average of two readings from each pot. VWC was taken near the base of
each plant in the pot. According to the manufacturers, the TDR measures the
travel time of an electromagnetic wave along a wave-guide. The speed of the
wave in the soil depends on the bulk dielectric permittivity of the soil matrix
(http://www.specmeters.com/Soil_Moisture_Measurement/TDR_300_Soil_Moistu
re_Probe.html). The fact that water has a much greater dielectric constant than
air or soil solids is exploited to determine the VWC of the soil. The VWC
measured by TDR is an average over the length of the wave-guide.
Leaf Relative Water Content
Leaf relative water content (RWC) was used as a measure of plant water
status. RWC is an estimate of the current water content of the sampled leaf
tissue relative the maximum water content it can hold at full turgidity. Normal
values of RWC range between 90% and 98% in turgid and transpiring leaves. In
most cereal crop species the typical RWC at leaf wilting is approximately 60%
(http://www.plantstress.com/admin/Files/RWC.htm), Two leaf disks were taken
with a cork borer from each plant in a pot. The disks were taken from the area
between the midrib and the leaf edge, from the second or third leaf below the flag
leaf. The samples were stored on ice until measured at the lab for the fresh
sample weight (FW). Leaf disks were then placed in airtight vials with distilled
water and left overnight at 4°C to reach full turgidity. Afterwards, the samples
were are taken out of water and blotted on absorbent paper to remove any
25

surface moisture quickly weighted to obtain the turgid weight (TW), Samples are
then placed in small paper bags and left in a drying oven at 60°C for at least 24
hours. They were then weighed to determine dry weight (DW), The relative
water content was calculated using the following measurement,
RWC (%)=[(FW-DW)/TW-DW)] x 100
EST Processing
EST Libraries
Two subtracted EST libraries were created under the direction of Dr.
Deshui Zhang for this study. The subtraction process was adapted from
comparative analysis methods developed in Dr, Bento Scares' lab (Bonaldo et al.
1996), The phagemid libraries were amplified with TJC121 cells. The
transformation of both libraries was done with XL 1-Blue-MRF (Strategene) cells.
Cells were spread and grown on an agar plate with 75 mg/ml of ampicillin.
Colonies were randomly selected from these plates and arrayed into 96 well
plates. The Tx7000 drought stress cDNAs were subtracted against a Tx7000
irrigated library to create the Drought Stress Before Flowering (DSBF) library.
Subtraction was performed to enrich this library in genes expressed in a pre-
flowering drought-resistant, non-stay-green line. Similarly, a subtracted library
enriched for genes expressed in a post-flowering, drought-resistant, stay-green
line was created by subtracting the B35 drought stress cDNAs against an
irrigated B35 cDNA library. This is the Drought Stress After Flowering (DSAF)
26

library. Both libraries consist of pooled RNA from leaf materials with 90% RWC,
80% RWC and 60% RWC.
EST Pipeline
From the two cDNA libraries, 10,000 Expressed Sequence Tags (ESTs)
were sequenced and annotated in Lee Pratf s lab at the University of Georgia in
Athens: 6,500 from the B35 stressed cDNA library and 3,500 from the Tx7000
stressed cDNA library. The raw sequence from each EST was trimmed for
remaining vector and quality checked at the University if Georgia.
The resulting sequences were submitted to the National Center for
Biotechnology Information (NCBI) for comparison against known sequences
using their Basic Local Alignment Search Tool (BLAST) with the aid of
BLASTclient version 3, a software package that performs batch BLAST searches
(http://www.ncbi.nlm.nih,gov/IEB/ToolBox/CPP_DOC/doxyhtml/blastclient 8cp
p.html). Two searches were made: a neucleotide search in the EST database
(BLASTn) and a translated protein search in the non-redundant database
(BLASTx).
The BLAST returns were parsed using a peri script specifically designed
for this project. The script recovered the length, e value, score, percent identity,
hyperiink, GenBank accession number and annotation for each query.
Each EST sequence makes up a part of a gene that controls or influences
a specific function. Many ESTs are different segments of the same gene. To
27

determine the genes present, the ESTs must be placed into contig groups. The
University of Georgia contiged the 3' sequences that were used for analysis.
Once the ESTs were contiged into representative genes, the genes were placed
into functional groups to analyze the gene families being expressed in the two
libraries. A gene ontology search was conducted using GeneSpring's
GeneStpider (GeneSpring, Silicon Genetics, Redwood City, CA, USA).
Annotated sequences were submitted to the Gene Ontology database
(www.geneontology.org) to assign putative functional descriptors to each
unigene EST.
28

CHAPTER III
RESULTS AND DISCUSSION
Phenotypic Analysis
Parental and inbred lines were planted and grown under greenhouse
conditions simulating irrigated and moisture stressed conditions similar to those
of previous field experiments conducted by the Texas Agricultural Experiment
Station in 2001 (Tables 2 and 3). Experimental data from a second field trial,
irrigated and dry-land, planted in Lubbock, Texas at the TAES field site and the
Texas Tech University was not usable due to late season rainfall in the summer
of 2002.
For the greenhouse experiment photosynthesis under ambient conditions
(1500 lamol m- s- PPFD, 50% RH, and 400 ^mol mol-^) was monitored to
measure plant metabolic fitness in irrigated and stressed plants. Measurements
were taken using the Li-Cor 6400, and compared against leaf RWC.
Photosynthetic rates for both parents and all four crosses followed similar
patterns when compared against changes in relative water content (Figure 1).
B35 and one of its stay-green crosses, NIL 124 showed slightly higher
photosynthetic activity during severe stress, but the difference was not
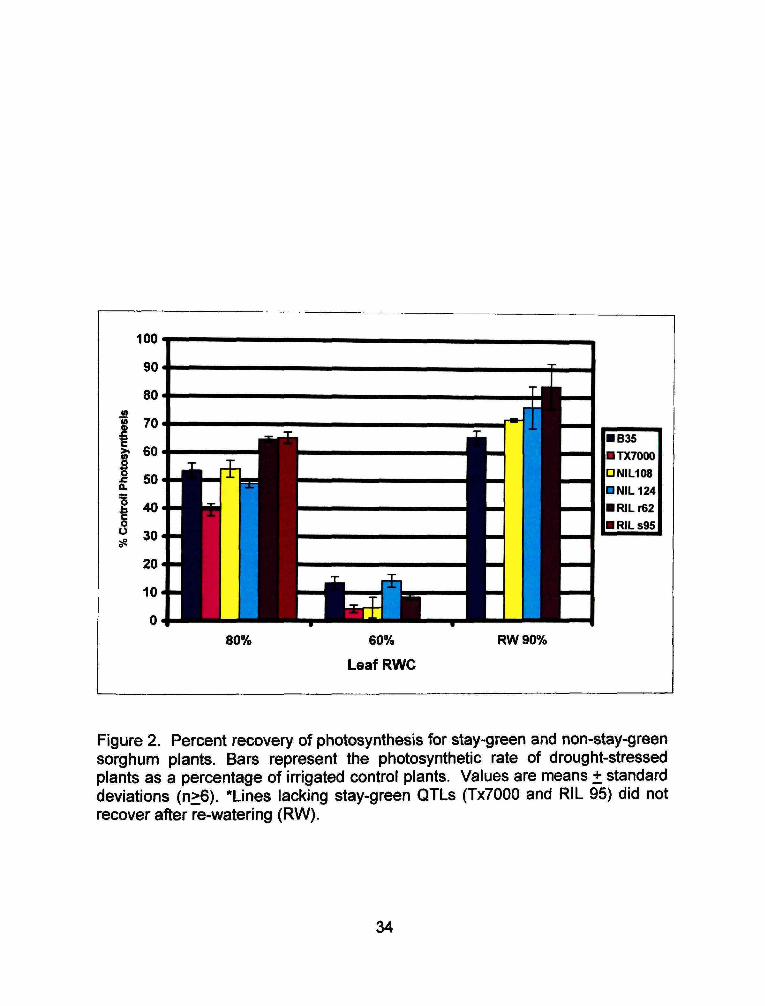
statistically significant. Figure 2 shows photosynthetic activity in stressed plants
as percent of well-watered control assimilation rates at different levels of RWC.
At 80% leaf RWC B35 lost 50 % of its initial photosynthetic capability and Tx7000
29

lost 60%, The inbred lines lost between 50% and 60% of their photosynthetic
activity when the RWC fell from 90% to 80%, All lines lost approximately 90% of
their initial photosynthetic activity when the RWC dropped to 60%. Tx7000 and
RIL 95, both of which lack all four stay-green QTLs of interest, did not recover
photosynthetic ability after the reinstatement of water, B35 regained 65% of its
initial photosynthetic capability with the reinstatement of water. The remaining
three lines regained approximately 75% of their initial photosynthetic activity.
The loss of chlorophyll is closely associated with a decline in plant
photosynthetic capacity. Stay-green genotypes delay senescence and maintain
leaf greenness during water limiting periods. Because there are different classes
of stay-green it is important to make sure the leaf greenness is not just cosmetic,
but that the leaf has retained chlorophyll and is still photosynthetically active.
Because some stay-green classes are cosmetic and not functional we
wanted to see how actual chlorophyll content correlates with the SPAD leaf
green-ness readings. Table 4 shows that the increase in the Minolta SPAD leaf
green-ness reading reflected a general increase in the plant's chlorophyll
content, confirming the relationship between SPAD readings and leaf chlorophyll
content. Furthermore, the maintenance of leaf chlorophyll was coincident with
the maintenance of photosynthetic capacity, but not associated with a
maintenance of photosynthetic rates (Figures 1 and 2).
30
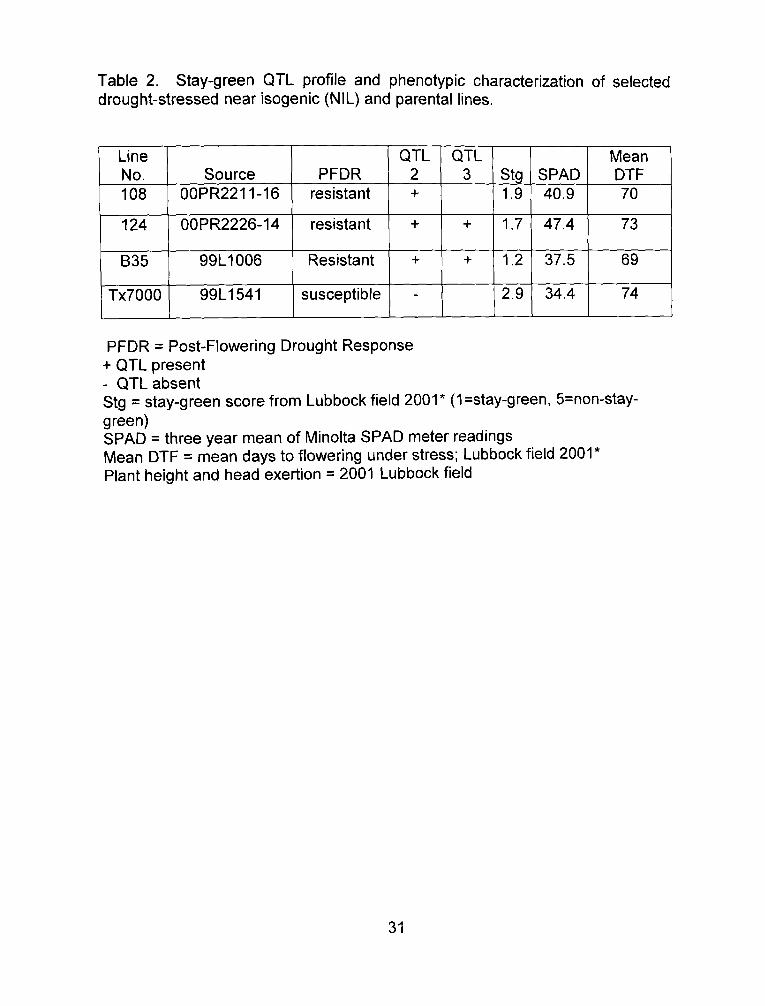
Table 2. Stay-green QTL profile and phenotypic characterization of selected drought-stressed near isogenic (NIL) and parental lines.
Line No. 108
124
B35
Tx7000
Source 00PR2211-16
00PR2226-14
99L1006
99L1541
PFDR resistant
resistant
Resistant
susceptible
QTL 2 +
+
+
-
QTL 3
+
+
Stg 1,9
1.7
1.2
2,9
SPAD 40,9
47.4
37.5
34,4
Mean DTF 70
73
69
74
PFDR = Post-Flowering Drought Response + QTL present - QTL absent Stg = stay-green score from Lubbock field 2001* (1=stay-green, 5=non-stay-green) SPAD = three year mean of Minolta SPAD meter readings Mean DTF = mean days to flowering under stress; Lubbock field 2001* Plant height and head exertion = 2001 Lubbock field
31

Table 3. Stay-green QTL profile, phenotypic characterization, and yield data from selected drought-stressed recombinant inbred (RIL) and parental lines.
Line No,
62
95
B35
Tx7000
Source
97L298
97L7339
00L2001
00L2519
PFDR
resistant
susceptible
resistant
resistant
QTL 1
+
-
+
-
QTL 2
+
+
-
QTL 3
+
+
-
QTL 4 +
-
+
-
Stg
1.9
3.7
1.9
4.3
SPAD
48.7
28.6
47,8
16.8
Line No. 62
95
B35
Tx7000
MDTF-S 67
70
68
68
MDTF-F
61
66
66
61
RWC-F
94.5
92.3
94.0
94,4
RWC-7
94.0
88.1
91.3
97.0
RWC-14
93.5
84.5
86.0
88.2
RWC-21
87.9
62.5
62.5
75.6
RWC-R
87,6
93,9
93.8
85.6
••• QTL present QTL absent
PFDR = Post-Flowering Drought Response Stg = stay-green score from Lubbock field 2001 (1=stay-green, 5=non-stay-green) SPAD = three year mean of leaf greenness; Minolta SPAD 502 chlorophyll meter MDTF-S = mean days to flowering under stress; Lubbock field 2001 MDTF-F = mean days to flowering under full irrigation; Lubbock field 2001 RWC = relative water content; full irrigation (F), # of days after stress (7, 14, 21), and re-hydrated recovery (R); TTU greenhouse
32

90% 80% 60%
Leaf RWC
RW 90%
Figure 1. Photosynthetic response to post-flowering drought stress in stay-green and non-stay-green sorghum lines. Photosynthesis (A) was measured at 1500 p,mol m" s' PPFD and a CO2 concentration of 400 pmol mol-V Values represent mean rates (n>6). Leaf RWC values represent mean Relative Water Content rounded to the nearest one, with RW indicating re-watered plants.
33
100
60%
Leaf RWC
RW 90%
Figure 2. Percent recovery of photosynthesis for stay-green and non-stay-green sorghum plants. Bars represent the photosynthetic rate of drought-stressed plants as a percentage of irrigated control plants. Values are means + standard deviations (n>6). *Lines lacking stay-green QTLs (TxTOOO and RIL 95) did not recover after re-watering (RW).
34

Table 4, Comparison of SPAD measurements (leaf green-ness) and leaf total chlorophyll content.
Post-Flowering Control Stressed Line Drought Response RWC CHL SPAD RWC CHL SPAD DAS RIL 62 resistant 95.3 0,27 46.3 60.4 0.23 41.3 11
RIL 95 susceptible 93.0 0.29 46.6 60,7 0.23 26.1 9
NIL 108 resistant 95,4 0.33 47,6 58,7 0.27 38.2 15
NIL 124 resistant 95.2 0.30 43.1 57.2 0.24 47,6 15
B35 resistant 94.3 0.32 48,6 64,8 0.27 42.0 11
Tx7000 susceptible 95.3 0.27 47,4 61.9 0.15 28.1 11
RWC = Mean relative water content CHL = Mean total chlorophyll content mg/cm2 SPAD = Mean leaf green-ness as measured by the Minolta SPAD 502 DAS = Number of days after stress for plant to reach a RWC of 60%
35

Because slight differences in the ability to sustain leaf relative water
content (Table 3) seen between stay-green and non-stay-green plants, a cursory
examination of leaf morphology was conducted to determine whether differences
in stomatal densities existed between stay-green and non-stay-green plants.
Leaf samples were taken from each of the six plant lines and examined under the
microscope. The number of stomates in the field of vision at 10X magnification
were counted and compared (Figure 3). B35 has a stomatal density 20% higher
than that of Tx7000, RIL r62 has a significantly higher stomatal density than all
other crosses and both parents. However, all other lines were similar to Tx7000.
Samples of the leaf sections used for this analysis are shown in Figure 4,
36

835 Tx7000 RIL 62 RIL 95 NIL108 NIL124
Figure 3. Stomatal densities for stay-green (B35, RIL 62, NIL 108 and NIL 124) and non-stay-green (Tx7000 and RIL 95) varieties. Bars represent the mean stomatal densities at 10X magnification, approximately 6.9 cm^ (n=4).
37

a. B35 b. Tx7000 c. RIL 62
Figure 4. Leaf sections at 10X magnification showing stomatal densities. The parental lines, B35 and Tx7000, have similar stomatal densities. All NILs and RILs except for RIL 62 have similar densities. RIL r62 has a significantly higher stomatal density.
38

Library Construction and EST Analysis
EST Library
One of the primary goals of this study was the development of tools for
gene expression profiling in sorghum. Two subtracted Expressed Sequence Tag
(EST) libraries, from pre-flowering and post-flowering drought stressed tissues
were developed to achieve this goal. Under the direction of Deshui Zhang, a
non-subtracted cDNA library from mass excised sorghum Tx7000 pre-flowering
drought-stressed leaf phagemid library was used to produce the pre-flowering
cDNA library and a non-subtracted cDNA library from mass excised sorghum
B35 post-flowering drought-stressed leaf phagemid library was used to produce
the post-flowering cDNA library. Both libraries consist of pooled RNA from leaf
materials with 90% RWC, 80% RWC and 60% RWC. Average insert sizes were
1021 bp for the B35 library, and 1037 bp for the Tx7000 library (Figure 5), To
potentially enrich the collection for genes expressed in the stay-green phenotype,
87 plates were picked from the B35 post-flowering drought stress library, while
44 from the Tx7000 pre-flowering drought stress library.
From these plates, 10,300 EST's were sequenced and annotated at the
University of Georgia in Athens: 6,500 from the B35 stressed cDNA library and
3,500 from the Tx7000 stressed cDNA library. Of those ESTs, 3075 were
sequenced from the 5' end, 4811 were sequenced from the 3' end and 2414
were sequenced from both ends. The ESTs sequenced from the 3' end (6018)
were used for contig analysis. Of the 6018 sequences submitted for analysis.
39

3861 assembled in to 1253 contigs with two or more ESTs and 1982 were
designated as contigs of one, representing a total of 3235 unique genes (Table
5). 153 sequences submitted were discarded because of poor sequence quality.
From the 3235 genes represented (singletons plus contigs), 1239 were
unique to the Tx7000 library, 1330 were unique to the B35 library, and 666
(contigs) were made up of EST's from both libraries. Of the 666 genes present in
both libraries, 355 contigs have an equal distribution of ESTs from both B35 and
Tx7000, 193 of the 666 contigs are made up of primarily Tx7000 ESTs, and 118
are made up of mostly B35 ESTs (Table 6), These results show that at least half
of the genes in this study are specific to either pre- or post-flowering drought
stress and represent potentially novel genes for gene expression studies for
drought stressed tissues.
EST Pipeline
An EST processing pipelines was developed at Texas Tech University and
the USDA-ARS CSRL to quality score, vector trim, assemble, and BLAST ESTs
generated in this project. This pipeline was assembled simultaneously, but as a
distinct effort, with a pipeline at the University of Georgia. Raw sequences were
scored for base quality and reformatted into FASTA files using Phred, followed
vector trimming and low quality base removal using LUCY (www.tigr.org).
Fragments were assembled by repeat detection and contig-level overiap using
TIGR Assembly and Consed (www.tigr.org).
40

R ro
i 10
0C
0)
E © ^ 5 4
o
2 u
0
i 1 1 T W
I .4 .6 .8 1 1.2 1.4 1.6 1.8 2
cDNA size (kb)
a. 835 Subtracted Library
o ^ o o o
£ X -Q to E a> 3 c Z o
O
8
1 1 1 — 1 — 1 —
'
D .4 .6 .8 1 1,2 1.4 1.6 1.8
cDNA size (kb)
b. 1x7000 Subtracted Library
Figure 5. Average insert size and clones for the B35 and TxTOOO subtracted cDNA libraries. Both libraries consist of pooled RNA from leaf materials with 90% RWC, 80% RWC, and 60% RWC.
41

Table 5. Summary of ESTs in the Tx7000 Drought Stress Before Flowering (DSBF) and B35 Drought Stress After Flowering (DSAF) libraries.
Sequenced End
5'
3'
5' and 3'
Total
Number of ESTs
DSAF
42
2218
1486
3746
DSBF
3033
2593
928
6554
Total
3075
4811
2414
10300
153 ESTs were discarded from the contig analysis because of poor sequencing
quality. 3861 ESTs were incorporated into contigs with 2 or more ESTs,
1982 ESTs were assembled into contigs of 1 EST (singletons),
A total of 3235 unique genes (contigs + singletons) are represented by 5843
ESTs (6018-153).
42

Table 6. Summary of contiguous sequences and singleton ESTs in the Tx7000 Drought Stress Before Flowering (DSBF) and B35 Drought Stress After Flowering (DSAF) libraries. Unique genes equal contigs plus singletons.
DSBF
DSAF
a ESTs from DSBF & DSAF
>2X ESTs
from DSBF
>2X ESTs
from DSAF
Total
Unique Genes
1239
1330
. . . .
—
—
3235
Contigs
281
306
355
193
118
1253
Singletons
958
1024
—
—
1982
Subgroup
A
B
C
A
B
EST subgroups are putative ESTs unique to stressed stay-green and non-stay-green phenotypes.
A = genes unique to Tx7000, non-stay-green parent
B = genes unique to B35, stay-green parent C = general drought response genes and house-keeping genes
43
Both trimmed and quality checked sequences and contigs were BLASTed
against the NCBI database. Each sequence in this project was BLASTed twice.
Once as a nucleotide search in the EST database and once as a translated
protein in the non-redundant database. BLASTclient version 3
(http://www,ncbi.nlm.nih.gov/) was used to batch BLAST the assembled unigene
ESTs. Blastcl3 can search all the sequences in a FASTA file, produce one-to-
many alignments as well as HTML, and it can perform searches against multiple
databases.
The size of the output file from BLASTcl3 is extremely large and
cumbersome to work with. FigurelO shows just the results from one sequence.
This makes it necessary to parse out useful information from the file into a more
manageable format. Such programs are usually written with scripts in Practical
Extraction and Report Language (Peri), an interpreted programming language, A
specific peri script was written for this project to parse BLAST data for gene
annotation, GeneBank ID number and E-value (Figure 6), The Perl output can
be opened in a spreadsheet, where the data can easily be sorted and searched
for relevant information.
44

# ! /usr/bin/perl -w
open(MYIN, "c:/perl/blast.txt") || die "can not open input"; #open{MYOUT, ">c:/perl/output.txt") || die "can not open output"; open(Myname, ">c:/perl/outname.txt") || die "can not open outname"; # For More Than one file use #2
open(MYOUT, "»c:/perl/output. txt") || die "can not open output";
$unkno=0; $flag=l; $coun=0; $rec=0; print "Running Program\n";
while (<MYIN>) { # do this while there is still a line in the input file
if ($flag == 1) { # find the word query if (m/\<b\>Query\=/) {
$query = substr($_,14) ; # substr = a position starting in 14 and going to the end of the line
chomp $query; # delete the c/r at the end of the var $query
$flag=2; }
} if ($flag == 2) {
if (m/Searchingdone/) { $done = substr($_,14,3) ; # substr = a position starting
in 14 and going to the end of the line chomp $done; if ($done eq PRE){
$rec++; $coun++; $flag=3;
}else{ $hyyp = "unknown"; $output = "$query ; $hyyp"; print MYOUT "$output\n"; $query = substr($_,27) ; chomp $query; $unkno++; $coun++; $flag=2;
} }
}
Figure 6. Peri script written in collaboration with Josh Traweek to parse out useful information from the BLASTcl3 output.
45

if ($flag == 3) { if (m/\<a/) {
$cou=5; $hyyp = substr($_,0,115) ; #$typ = substr($_,118,1) ; #$loc = substr($_,96,1) ; #chomp $typ; tchomp $loc; #if ($typ eq 'g') { #} else { # $cou++; #} #if ($loc == '0') {$cou--} tchomp $hyyp; $flag=4; }
}
if {$flag == 4) { if (m/name/) {
#$fin = $cou + 182; $name = substr($_,0) ; chomp $name;
$_= <MYIN>;
if (m/Length/) { $len = substr($_,20) ; chomp $len; $flag=6;
} else {
$namel = substr($_,12) ; chomp $namel; $name = "$name $namel"; $_ = <MYIN>;
if (m/Length/) { $len = substr($_,20) ; chomp $len; $flag=6;
} else { $name2 = substr($_,12) ; chomp $name2; $flag=5; $name = "$name $name2";
} }
} }
Figure 6. Continued.
46

if ($flag == 5) {
if (m/Length \=/) { $len = substr{$_,20) ; chomp $len; $flag=6;
} }
if ($flag == 6) { if (m/Score \=/) {
$score = substr($_,9,4); $ecode = substr($_,34); chomp $score; chomp $ecode; $_ = <MYIN>; $ident = substr($_,14,7) ; chomp $ident;
# all of the var for output are $score, $ecode, $ident, $len, $name, $hyyp, $query # you can put these in any order and with any seperator.
$output = "$query ; $score ; $ecode ; $ident ; $len ; $hyyp ; $ query ; $name";
print MYOUT "$output\n";
$outname = "$name"; print MYname "$outname\n";
$flag=l; }
}
$counn = $coun++;
} # end while print "\n"; print "Number of Unknowns = $unkno\n"; print "Number of Querys = $rec\n"; print "Total Querys Found = $coun\n"; close MYIN ; close MYOUT;
Figure 6. Continued.
47
GeneSpring's GeneSpieder was used to perform a gene ontology search
with the Gene Ontology Consortium (GO). GeneSpider takes the GenBank
accession number, uses to retrieve the sequence annotation and submits the
annotation to GO. The Gene Ontology Consortium offers a controlled vocabulary
that can be applied to all organisms as knowledge of gene and protein roles in
cells is accumulating and changing. It breaks classification into three categories,
molecular function, biological process and cellular components. Molecular
function includes the tasks performed by individual gene products like
transcription factor and DNA helicase. Biological process encompasses broad
biological goals such as mitosis and signal transduction, that are accomplished
by ordered assemblies of molecular functions. Cellular components involve
subcellular structures and locations like the nucleus and the cytoplasm.
With the completion of the EST processing pipeline, illustrated in Figure 7,
it is possible to enter a list of sequences into the pipeline, and have those
sequences vector trimmed, quality checked, contiged and submitted to Gene
Bank for a BLAST search automatically. The BLAST results can then be
manually entered into the parsing program to extract all relevant and useful data.
The EST processing pipeline created will provide a valuable tool to aide
researchers genome level expression experiments.
48

Gene Ontology
The simplified gene ontology search was performed by submitting each of
the 10,300 ESTs to three category searches through Gene Bank, These
categories are biological process, cellular component, and molecular function
(Figure 13),
A biological process was assigned to 241 of the ESTs submitted. Two
main subgroups were identified, cell communication and signal transduction. Of
the 241 EST assigned a biological function, 71% are involved in signal
transduction (Figure 14). Neariy half of the signal transduction ESTs, 49%, are
cell surface linked. These are involved with Ca++ receptor signaling and
glutamine signaling. The remaining signal transduction ESTs are involved with
intracellular signaling (6%), developmental processes (7%), and physiological
processes (38%) (Figure15).
49

DN^seqLaiaeri
X^ctorfiles 1^
Btelc^rtificstjon (Rred)
ADGT
Qjality/^esessmErt fiCCJ • • • • I
t ^ RagTHt/^eserrtly (TlGR-^^sentler)
CKXyjPCC
1 NCH
hbrdogy Idertficsticn (BLQSTn&BT^x)
OQOQOGFOC till 111 II OOOGTOC
I I Dstabesing&N^sualizstJcn Aialvsis
{PO£J^ (lnnBiG&ie&G&TS6|3ing)
Figure 7. Flow chart illustrating the EST pipeline developed for processing cDNA sequence information generated in this project. This pipeline was developed in collaboration with Texas Tech University (N. Klueva) and the USDA-ARS (J. Hargis, S. Mauget, M. Oliver, and P. Payton).
50

Cellular communication ESTs, the remaining 29% of biological process
ESTs are primarily involved in cell growth and maintenance (Figure 16). Cell
growth and maintenance ESTs make up 94% of cell communication ESTs and
66% of all biological process ESTs (Figure 17), The remaining six percent of the
cell communication ESTs are involved in cell death.
Of the 251 ESTs assigned a cellular component, 96% are intracellular, 3%
are in the membrane and 1% is extracellular (Figure 18). The extracellular ESTs
are all collagen related. Half of the membrane ESTs are part of the plasma
membrane and the other half are part of the intragal membrane. The largest
portion of the intracellular ESTs are part of the cytochrome. They make up 26%
of intracellular ESTs (Figure 19) and 23% of all cellular component ESTs (Figure
20).
The gene ontology search identified 1401 ESTs that have a known
molecular function. Most of these ESTs, 75%, are involved in enzyme activity
(Figure 21). Twenty-nine enzyme groups are represented in the EST libraries
(Figure 22), The rest of the molecular function ESTs are involved in nucleic acid
binding (10%), transport (9%), cell cycle regulation, microtubular dynamics,
structural proteins, signal transducers, RNA, and chaperones.
51

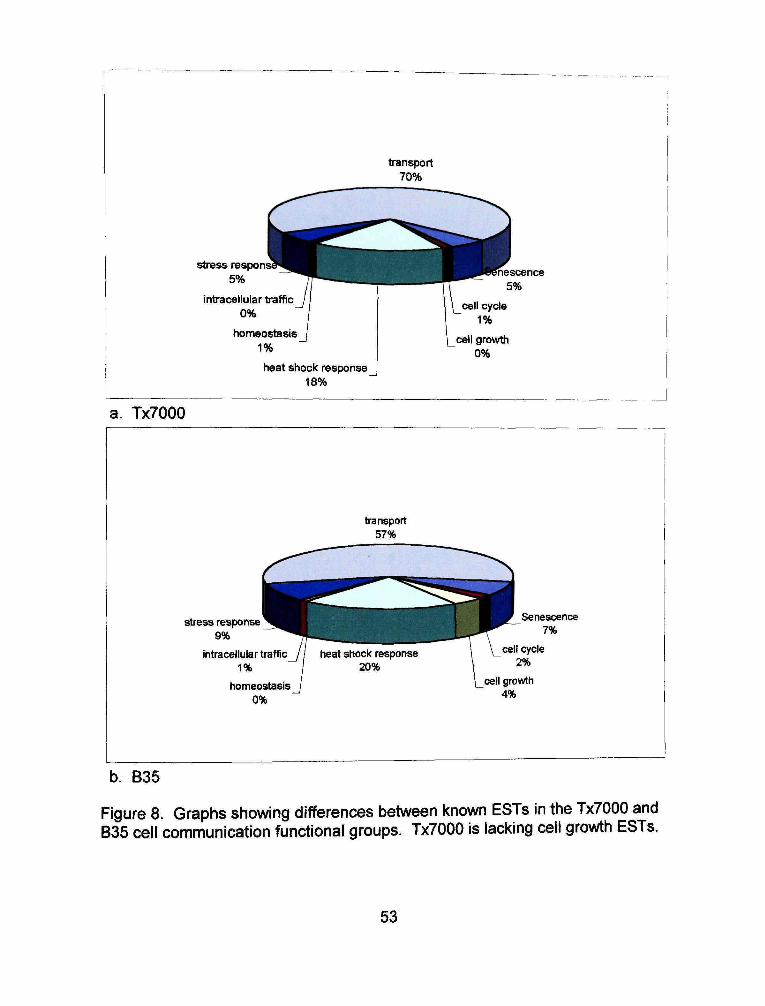
To begin detecting differences between the two EST libraries, the EST
groups with specific functions found in gene families were compared. In the cell
communication group, B35 has a group of cells not in the Tx7000 cell
communication group, cell growth (Figure 8). Appendices 13 and 14 show that
in the nucleic acid binding group the translation initiation factor ESTs make up a
much smaller percentage (17%) in the B35 library than they do in the Tx7000
library (66%).
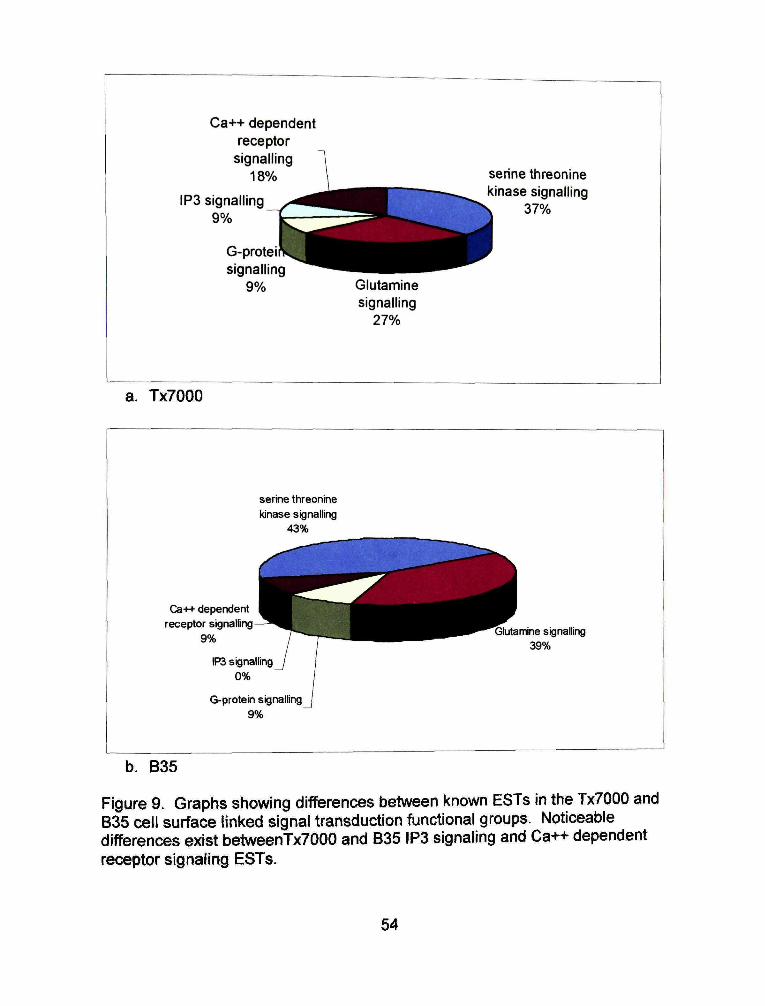
There are two notable differences in the cell suri'ace linked signal
transduction group. In the Tx7000 library IP3 signaling makes up nine percent of
the ESTs while B35 has no IP3 signaling ESTs (Figure 9). Calcium ion (Ca++)
dependent receptor signaling ESTs make up a larger percentage of the ESTs in
the B35 signal transduction group (43%) than in the Tx7000 signal transduction
group (18%).
52
transport 70%
stress respon: 5%
intracellular traffic 0%
homeostasis 1 %
cell growth 0%
heat shock response 18%
a. Tx7000
transport 57%
stress response 9%
intracellular traffic 1%
homeostasis 0%
Senescence 7%
cell cycle 2%
cell growth 4%
b. B35
Figure 8. Graphs showing differences between known ESTs in the Tx7000 and 835 cell communication functional groups. Tx7000 is lacking cell growth ESTs.
53
Ca++ dependent receptor
signalling 18°/c
IP3 signalling 9%
G-protei signalling
9%
serine threonine kinase signalling
37%
Glutamine signalling
27%
a. Tx7000
serine threonine
kinase signalling 43%
Ca++ dependent ^ ^ H ^ receptor s i g n a l l i n g — ^ ^ H H H I M H I
9% / ^ ^ ^ ^
IP3 signalling / 1
0% 1
C3-protein signalling 1
9%
^^^^^^^^K^ff^^^Ghtarnne signalling 39%
b. 835
Figure 9. Graphs showing differences between known ESTs in the Tx7000 and 835 cell surface linked signal transduction functional groups. Noticeable differences exist betweenTx7000 and B35 IP3 signaling and Ca++ dependent receptor signaling ESTs.
54

Summary
Crop production woridwide is limited by environmental stress and much of
this can be attributed to drought stress. The lack of adequate soil moisture
coupled with high temperatures is the single greatest source (71%) of yield
reduction in crop plants globally (Krieg 1989). Nearly half of the US land surface
(45%) is subjected to continuous drought or frequent water deficit stress (Boyer
1982). Sorghum is one of the major cereal crops in semiarid regions of the worid
where prolonged periods of drought are frequent. Sorghum's unusual tolerance
to hot and dry environments makes it an important crop for grain and forage.
Although sorghum is considered a drought tolerant crop, and grown in semi-arid
and arid regions, drought stress can interfere with normal panicle development
and diminish yield. Krieg and Lascano (1990) reported that due to water deficit
limitations, the genetic potential for sorghum grain yield is at least 2 to 5 times
the average yield realized at the farm level. Because more than 80% of
commercial sorghum in the US is grown under non-irrigated conditions where
water is a major limiting factor for yield, overcoming these yield limitations is
crucial to sorghum growers and breeders (Crasta et al, 1999).
Plants respond to environmental stresses at the molecular and cellular
levels as well as at the physiological level. Understanding the complex
mechanisms of drought tolerance, both morphological and physiological, and the
genetic basis of adaptation, will have a significant impact on increasing crop
productivity. The identification of the genetic factors underiying the complex
55

responses of plants to drought stress will provide a solid basis for improving
drought resistance.
The primary aim of this project was to examine the underlying genetic
differences between sorghum plants with distinct differences in their ability to
survive pre- and post-flowering drought stress. In order to accomplish this goal,
EST libraries were developed from a pre-flowering drought resistant variety
(Tx7000) and a post-flowering drought resistant variety (B35). The working
hypothesis behind this work was that the dramatic differences between stay-
green and non-stay green plants in response to drought at specific
developmental stages are due to differences in gene expression. If this
hypothesis were true, gene statement comparisons of resistant and susceptible
plants under stress conditions should reveal the genetic basis for these
differences. The results of this study suggest that the ability to maintain leaf
relative water content during post-flowering drought stress enables plants
expressing the stay-green trait to maintain photosynthetic capacity, and more
importantly recover full photosynthetic activity following a rehydration event. In
most cereal crop species the typical RWC at leaf wilting is approximately 60%.
Therefore sorghum's ability to survive drought conditions resulting in as low as
60% leaf RWC is critical in grain filling and harvestable seed yield.
This project resulted in the development of a collection of EST clones from
two sorghum lines exhibiting distinct responses to water deficit stress. These
responses are dependent on the timing of stress relative to the developmental
56
state of the plant. Furthermore, a cursory analysis of the physiological response
to water-deficit stress was performed to evaluate stay-green expression and its
effect on photosynthesis and the plants ability to maintain leaf relative water
content under stress. With the development of subtracted cDNA libraries from
Tx7000, a pre-flowering drought resistant variety (susceptible to post-flowering
stress) and B35, a post-flowering drought resistant, stay-green variety,
susceptible to pre-flowering drought stress, a tool has been created to study
these responses on a transcriptome level. Subsequent analyses using cDNA
microarrays should identify candidate genes (ESTs) putatively involved in the
stay-green character. Furthermore, mapping of these ESTs and coincidence with
known QTLs should allow for the identification of key genes regulating drought
responses in sorghum and should provide opportunities to create stress
resistance in other crop species. Current efforts and future work include
fabrication and employment of cDNA microarrays for gene expression studies,
the development of a database to catalogue sequence information and gene
expression data, and a detailed physiological study, including field trials under
irrigated and dryland conditions. The culmination of gene expression
experiments, physiological examinations, and genetic mapping studies should
provide a wealth of information for the production of stress resistant crop plants.
57

LITERATURE CITED
^ " " " ^ ^ ' n ^ ,oAi^° l?, f ^"?'^*' ^- E- J°hn, I., Rodoni, S„ Matile, P, and Grierson, D. 1999. Altered patterns of senescence and ripening in of a stay-green mutant of tomato {Lycopersicon esculentum Mill.) Journal of Experimental Botany. 50(336): 1115-1122,
Borrell, A. K. and Hammer, G. I. 1996. Nitrogen dynamics and the physiological basis of stay-green in sorghum. Crop Science. 40: 1295-1307,
Borrell, A. K., Hammer, G. L. and Douglas, A, C. L, 2000, Does maintaining green leaf area in sorghum improve yield under drought? I. Leaf growth and senescence. Crop Science. 40:1026-1037
Borrell, A. K., Hammer, G. L. and Henzell, R. G. 2000. Does maintaining green leaf area in sorghum improve yield under drought? II. Dry matter production yield. Crop Science. 40:1037-1048.
Boyer, J. S. 1982. Plant productivity and environment Science. 218:444-448.
Cha, K. W., Lee, Y J., Koh, H.J., Lee, B. M., Nam, Y. W. and Paek, N, C. 2002. Isolation, characterization, and mapping of the stay green mutant in rice. Theoretical and Applied Genetics. 104: 526-532.
Cheung, A. Y., McNeills, T. and Piekos, B. 1993, Maintenance of chloroplast components during chromoplast differentiation in the tomato mutant green flesh. Plant physiology. 101:1223-1229.
Crasta, O. R., Xu, W. W., Rosenow, D. T., Mullet, J, and Nguyen, H, T, 1999. Mapping of post-flowering drought resistance traits in grain sorghum: association between QTLs influencing premature senescence and maturity. Molecular and General Genetics. 262:579-588.
Cushman, J. C, Bohnert, H. J. 2000. Genomic approaches to plant stress tolerance. Current Opinion In Plant Biology. 3: 117-124.
Devos, K. M., Beales, J., Nagamura, Y. and Sasaki, T. 1999. Arabldopsis-y\ce: will colinearity allow gene prediction across the eudicot-monocot divide? Genome Research. 9: 381-391.
58

Doggett, H. 1988. Sorghum. Longman Scientific and Technical Essex England, pp. 187.
Duncan, R. R, 1984. The association of plant senescence with root and stalk disease in sorghum. In: Mughogho, L,K., ed. Sorghum root and stalk diseases, a critical review. Proc. Consultive group discussion of research needs and strategies for control of sorghum root and stalk diseases Bellagio, Italy. 27 Nov-2 Dec 1983 ICRISAT, Pantancheru, AP, India, pp 99-110,
Fernandez, G, C. J. 1993. Effective criteria for assessing plant stress tolerance. Adaptation of food crops to temperature and water stress. Proc, Intl. symposium. Taiwan, 13-18 Aug. 1992 GC Kuo (ed). Asian Vegetable Research and Development Center, Pub. No, 93-410. pp, 257-270.
Hart, G. E., Schertz, K. F, Peng, Y. and Syed, N. H. 2001. Genetic mapping of Sorghum bicolor (L.) Moench QTLs that control variation in tillering and other morphological characters. Theoretical and Applied Genetics. 103: 1232-1242.
Hauck, B., Gay, A. P., Macduff, J., Griffiths, C, M. and Thomas, H. 1997, Leaf senescence in a non-yellowing mutant Festuca pratensis: implications of the stay-green mutation for photosynthesis, growth and nitrogen nutrition. Plant Cell and Environment. 20: 1007-1018.
Jordi, W., Schapendonk, A., Davelaar, E., Stoopen, G. M., Pot, C.S., De Visser, R., Van Rhijn, J. A., Gan, S. and Amasino, R. M. 2000. Increased cytokinin levels in transgenic PSAGI2-/P7 tobacco plants have large direct and indirect effects on leaf senescence, photosynthesis and N partitioning. Plant Cell and Environment. 23: 279-289.
Kansas Grain Sorghum Producers Association. 2003. http://www.kgrains,com/sorghum.
Kawasaki, S., Borchert, C, Deyholos, M., Wang, H., Brazille, S., Kawai, K.,Galbraith, DW. and Bohnert, H.J. 2001. Gene expression profiles during the initial phase of salt stress in rice. Plant Cell. 13: 889-906,
Kebede, H., Subudhi, P K., Rosenow, D, T. and Nguyen, H, T. 2001, Quantitative trait loci influencing drought tolerance in grain sorghum {Sorghum bicolor L. Moench). Theoretical and applied Genetics. 103: 266-276.
59

Kelly, T. G., Parthasarathy, R. P. and Walker, T. S. 1991. The relative value of cereal straw odder in semi-arid tropics of India: implications for cereal breeding programmes at ICRISAT. In: Dvorak K, ed. Social science research for agricultural technology development. CABI,
Krieg, D. R. 1989. Water use efficiency in grain sorghum. In: Wilkinson D C D ed. Proceedings of the 43'' annual com and sorghum Industry research conference. Washington American seed trade association, pp. 27-41,
Krieg, D. R, and Lascano, R. J. 1990. Sorghum. Irrigation of agricultural crops-Agronomy monograph. EDN, ASA-CSSA-SSSA (Ed). ASA-CSSA-SSSA Madison, Wl, 30:719-738,
Lichtenthaler, H. K. 1987, Chlorophylls and Carotenoids: Pigments of Photosynthetic Biomembranes. Methods In Enzymology. 148:351-382.
Luquez, V. M. and Guiamet, J. J. 2001. Effect of the 'Stay Green" Genotype GGd1d1d2d2 on Leaf Gas Exchange, Dry Matter Accumulation and Seed Yield in Soybean {Glycine max L, Merr.). Annals of Botany. 87: 313-318.
McBee, G. G. 1984. Relation of senescence, and kernel maturity to carbohydrate metabolism in sorghum, pp, 119-129 In LK Mughogho (ed). Sorghum root and stalk diseases, a critical review. Proc. Consulttive group discussion of research needs and strategies for control of sorghum root and stalk diseases. Bellagio, Italy. 27 Nov-2 Dec 1983 ICRISAT, Pantancheru, AP, India
McBee, G. G., Waskom, R. M,, Miller, F. R. and Creelman, R. A, 1983, Effect of senescence and nonsenescence on carbohydrates in sorghum during late kernel maturity states. Crop Science. 23: 372-376.
Mullet, J. E., Klein, R, R. and Klein, P, 2001. Sorghum bicolor- an important species for comparative grass genomics and a source of beneficial genes for agriculture. Current Opinion In Plant Biology. 5: 118-121.
National Academy Press. 1996. Lost crops of Africa Vol. 1 Grains. Board of science and Technology for International Development. National Research Council. Washington, DC. 1:127-144.
National Sorghum Producers Foundation (NSPF), 1999, http://www.sorghumgrowers.com/whatis.htm
Osteriund, M. T. and Paterson, A, H. 2002. Applied plant genomics: the secret is integration. Current Opinion In Plant Biology 5:141-145.
60

Rosenow, D.T. 1987. Breeding sorghum for drought resistance, pp. 19-23. In Proceedings of the International Drought Symposium. OAU/STRC-SAFGRAD. Ouagadougou, Burkina, Faso,
Rosenow, D. T. and Clark, L, E. 1981, Drought tolerance in sorghum, p, 18-30. In Proceedings of the 36* Annual Corn and Sorghum Research Conference. Chicago, III,
Rosenow, D, T., Ejeta, G., Clark, L. E., Gilbert, M. L„ Henzell, R. G., Borrell, A. K. and Muchow, R. C. 1997 p, 400-411. In Proceedings of the International Conference on Genetic Improvement of Sorghum and Peari Millet VINTRORMIL Publication No, 97-5. September 22-27, 1996. Lubbock, TX.
Sanchez, A. C, Subudhi, P. K., Rosenow, D, T. and Nguyen, H. T. 2001, Mapping QTLs associated with drought resistance in sorghum {Sorghum bicolor L. Moench). Plant Molecular Biology. 48:713-726.
Seki, M., Narusaka, M., Abe, H., Kasuga, M., Yamaguchi-Shinozaki, K., Carninci, P., Hayashizaki, Y. and Shinozaki, K. 2001, Monitoring the Expression Pattern of 1300 Arabidopsis Genes under Drought and Cold Stresses by Using a Full-Length cDNA Microarray. The Plant Cell. 13:61-72.
Singh, K. B., Foley, R. C. and Onate-Sanchez, L. 2002. Transcription factors in plant defense and stress response. Current Opinion in Plant Biology. 5: 430-436.
Subudhi, P. K., Magpantay, G. B., Rosenow, D. T, and Nguyen, H. T. 1999. In: Ito, O., O'Toole, J. and Hardy, B. ed. Genetic Improvement of rice for water- limited environments. Proceedings of the Workshop on Genetic Improvement of Rice for Water-Limited Environments, 1-3 December 1998, Los Bancs, Philippines, Manila: International Rice Research Institute, pp. 353.
Subudhi, P. K., Rosenow, D. T. and Nguyen, H. T. 2000. Quntitative trait loci for the stay green trait in sorghum {Sorghum bicolor L. Moench): consistency across genetic backgrounds and environments. Theoretical and Applied Genetics. 101:733-741.
Tattersall, D. B., Bak, S., Jones, P. R., Olsen, C. E., Nielsen, J. K„ Hansen, M, L., Hoj, P B. and Moller, B. L. 2001. Resistance to a herbivore through engineered cyanogenic glucoside synthesis. Science. 293: 1826-1828,
61

Thomas, H. and Howarth, C. J. 2000. Five ways to stay green Journal of Experimental Botany. GMP Special Issue. 51:329-337.
Thomas, H., Morgan, W. G., Thomas, A. M, and Ougham, H, J. 1999, Expression of the stay-green character introgressed into Lolium temulentum Ceres from a senescence mutant of Festuca petensis. Theoretical and Applied Genetics. 99: 92-99.
Walulu, R. S., Rosenow, D. T., Wester, D. B. and Nguyen, H. T. 1994. Inheritance of the stay-green trait in sorghum. Crop Science 34- 970-972.
Xu W., Rosenow, D. T. and Nguyen, H. T. 2000. Staygreen trait in grain sorghum: relationship between visual rating and leaf chlorophyll concentration. Plant Breeding. 119:365-367.
Xu, W., Subudhi, P. K., Crasta O. R., Rosenow, D. T., Mullet, J. E. and Nguyen, H. T, 2000. Molecular mapping of QTLs conferring stay-green in grain sorghum ('Sorg/7t/Ar7ib/co/orL. Moench). Genome. 43:461-469.
Yamada, S., Katsuhara, M., Kelly, W. B., Michalowski, C. B, and Bohnert, H. J. 1995. A family of transcripts encoding water channel proteins: Tissue-specific expression in the common ice plant. Plant Cell. 7: 1129-1142.
Zhang, J., Klueva, N. Y., Wang, Z„ Wu, R„ Ho, T. H. D, and Nguyen, H. T. 2000. Genetic engineering for abiotic stress resistance in crop plants. In Vitro Cell Dev. Biol - Plant. 36: 108-114.
Zhang, L,, Zhou, W., Velculescu, V. E., Kern, S. E., Hruban, R, H., Hamilton, S, R., Vogelstein, B. and Kinzler K, W. 1997. Gene expression profiles in normal and cancer cells. Science. 276:1268-1272.
62

Appendix A
BLAST FILES
BLASTx retum for a single query that has been submitted in batch with
BLASTclient 3.
<b>Query=</b> DSAF1_1_A02,b1_A002
(454 letters)
Database: All non-redundant GenBank CDS
translations+PDB+SwissProt+PIR+PRF
1,247,039 sequences; 397,579,747 total letters
Searchingdone<PRE>
Score E
Sequences producing significant alignments: (bits) Value
<a
href="http://www,ncbi,nlm,nih,gov:80/entrez/query,fcgi?cmd=Retrieve&db=Protein&list_uids=254
53308&dopt=GenPept">sp|Q8LHP0|U222_ORYSA</a> Hypothetical protein P0519E12,3
>gi|22,„ <ahref = #25453308>159</a> 1e-038
<a
href="http://www,ncbi,nlm,nih,gov:80/entrez/query,fcgi?cmd=Retrieve&db=Protein&list_uids=184
22622&dopt=GenPept">ref|NP_568654,1||</a> expressed protein; protein id: At5g46030,,,, <a
href = #18422622> 137</a> 6e-032
Figure 10. Single BLASTcl3 output
63

<a
href="http://www,ncbi,nlm,nih,gov:80/entre2/query,fcgi?cmd=Retrieve&db=Protein&list_uids=063
22689&dopt=GenPept">ref|NP_012762,1||</a> Hypothetical ORF; Ykl160wp [Saccharomyces,,,
<a href = #6322689> 94</a> 6e-019
<a
href="http://www,ncbi,nlm,nih,gov:80/entrez/query,fcgi?cmd=Retrieve&db=Protein&list_uids=097
57723&dopt=GenPept">dbj|BAB08248,1|</a> geneJd:MCL19,8~pir||T27174~similar to unkn,,,
<a href = #9757723> 88</a> 3e-018
<a
href="http://www,ncbi,nlm,nih,gov:80/entrez/query,fcgi?cmd=Retrieve&db=Protein&list_uids=175
37567&dopt=GenPept">ref|NP_496983,1||</a> Putative protein of eukaryotic origin (9,,,, <a
href = #17537567> 87</a> 9e-017
<PRE>
<a name = 25453308> </a><a
href="http://www,ncbi,nlm,nih,gov:80/entrez/query,fcgi?cmd=Retrieve&db=Protein&list_uids=254
53308&dopt=GenPept">sp|Q8LHP0|U222_ORYSA</a> Hypothetical protein P0519E12,3
>gi|22296365|dbj|BAC10134,1|
contains EST AU085817(C60912)~similar to Arabidopsis
thaliana chromosome 5, At5g46030~unknown protein [Oryza
sativa (japonica cultivar-group)]
Length = 89
Score = 159 bits (401), Expect = 1e-038
Identities = 74/77 (96%), Positives = 74/77 (96%)
Frame = -2
Figure 10. Continued.
64
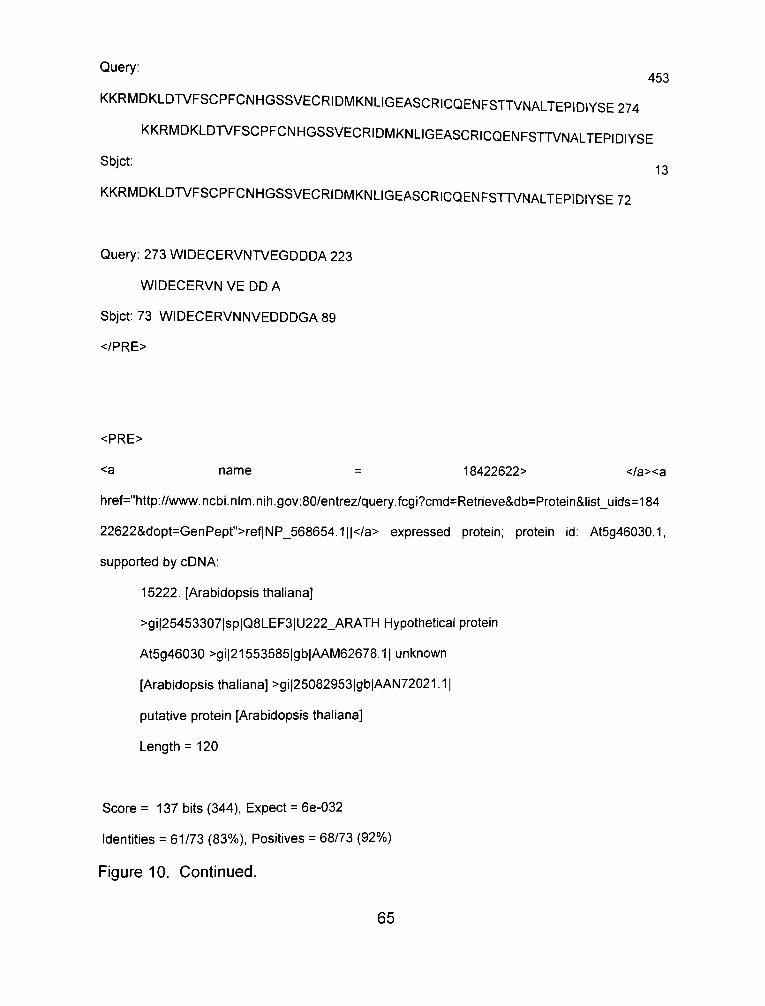
Query: 453
KKRMDKLDTVFSCPFCNHGSSVECRIDMKNLIGEASCRICQENFSTTVNALTEPIDIYSE274
KKRMDKLDTVFSCPFCNHGSSVECRIDMKNLIGEASCRICQENFSrrVNALTEPIDIYSE
Sbjct: ^3
KKRMDKLDTVFSCPFCNHGSSVECRIDMKNLIGEASCR1CQENFSTTVNALTEPIDIYSE72
Query: 273 WIDECERVNTVEGDDDA 223
WIDECERVN VEDDA
Sbjct: 73 WIDECERVNNVEDDDGA 89
</PRE>
<PRE>
<a name = 18422622> </a><a
href="http://www,ncbi,nlm,nih,gov:80/entrez/query,fcgi?cmd=Retrieve&db=Protein&list_uids=184
22622&dopt=GenPept">ref|NP_568654,1||</a> expressed protein; protein id: At5g46030,1,
supported by cDNA:
15222, [Arabidopsis thaliana]
>gi|25453307|sp|Q8LEF3|U222_ARATH Hypothetical protein
At5g46030 >gi|21553585|gb|AAM62678,1| unknown
[Arabidopsis thaliana] >gi|25082953|gb|AAN72021,1|
putative protein [Arabidopsis thaliana]
Length = 120
Score = 137 bits (344), Expect = 6e-032
Identities = 61/73 (83%), Positives = 68/73 (92%)
Figure 10, Continued.
65

Frame = -2
Q^^^- 450
KRMDKLDTVFSCPFCNHGSSVECRIDMKNLIGEASCRICQENFSTTVNALTEPIDIYSEW271
KRMDKLDT+FSCPFCNHGSSVEC iDMK+LIG+A+CRiC+E+FSTT+ ALTE IDIYSEW
Sbjct: 14 KRMDKLDTIFSCPFCNHGSSVECIIDMKHLIGKAACRICEESFSTTITALTEAIDIYSEW
73
Query: 270 IDECERVNTVEGD 232
IDECERVNT E D
Sbjct: 74 IDECERVNTAEDD 86
</PRE>
<PRE>
<a name = 6322689> </a><a
href="http://www,ncbi,nim,nih,gov:80/entrez/query,fcgi?cmd=Retrieve&db=Protein&list_uids=063
22689&dopt=GenPept">ref|NP_012762,1||</a> Hypothetical ORF; Ykl160wp [Saccharomyces
cerevisiae]
>gi|549732|sp|P36053|YKQ0_YEAST Hypothetical 16,2 kDa
protein in PIR3-APE2 intergenic region
>gi|481110|pir||S37791 hypothetical protein YKL160w-
yeast (Saccharomyces cerevisiae)
>gi|407488|emb|CAA81494,1| unknown [Saccharomyces
cerevisiae] >gi|486279|emb|CAA82002,1| ORF YKL160w
[Saccharomyces cerevisiae] >gi|1582545|prf||2118404F ORF
Figure 10. Continued.
66

Length = 145
Score = 94,0 bits (232), Expect = 6e-019
Identities = 38/75 (50%), Positives = 53/75 (70%)
Frame = -2
Query: ' 453
KKRMDKLDTVFSCPFCNHGSSVECRIDMKNLIGEASCRICQENFSTTVNALTEPIDIYSE274
K+ + KLDT F+C FCNH SV C +D KN IG SC+IC ++F T +N+L++P+D+YS+
Sbjct: ^3
KRLVQKLDTKFNCLFCNHEKSVSCTLDKKNSIGTLSCKICGQSFQTRINSLSQPVDVYSD72
Query: 273 WIDECERVNTVEGDD 229
W D EVN+ GD
Sbjct: 73 WFDAVEEVNSGRGSD 87
</PRE>
<PRE>
<a name = 9757723> </a><a
href="http://viww,ncbi,nlm,nih,gov:80/entrez/query,fcgi?cmd=Retrieve&db=Protein&iist_uids=097
57723&dopt=GenPept">dbj|BAB08248,1|</a> gene_id:MCL19,8~pir||T27174~similar to unknown
protein [Arabidopsis
thaliana]
Length = 238
Figure 10. Continued.
67

Score = 88,2 bits (217), Expect(2) = 3e-018
Identities = 41/55 (74%), Positives = 49/55 (88%), Gaps = 4/55 (7%)
Frame = -2
Query: 396 SSVECR—IDMKNLiGEASCRICQENFSTTVNALTEPIDIYSEWIDECERVNT\/EGD
232
S+ 0+ IDMK+LIG+A+CRIC+E+FSTT+ ALTE IDIYSEWIDECERVNT E D
Sbjct: 146 SNASCKMNHNIDMKHLIGKAACRICEESFSTTITALTEAIDIYSEWIDECERVNTAEDD
204
</PRE>
<PRE>
Score = 23,9 bits (50), Expect(2) = 3e-018
Identities = 13/24 (54%), Positives = 14/24 (58%)
Frame = -3
Query: 452 RSGWTSLTLSFPAHSAIMGAVLSA 381
RS W SLT S SAI G V +A
Sbjct: 125 RSEWISLTQSLWLSAITGLVSNA 148
</PRE>
<PRE>
<a name = 17537567> </a><a
Figure 10, Continued.
68

href="http://www,ncbi,nlm,nih,gov:80/entrez/query,fcgi?cmd=Retrieve&db=Protein&list_uids=175
37567&dopt=GenPept">ref|NP_496983,1||</a> Putative protein of eukaryotic origin (9,7 kD)
[Caenorhabditis
elegans] >gi|25453314|sp|Q9XVZ8|U222_CAEEL Hypothetical
protein Y54G11A,11 in chromosome II
>gi|7510199|pir||T27174 hypothetical protein Y54G11A,11
- Caenorhabditis elegans >gi|4008447|emb|CAA22454,1|
Hypothetical protein Y54G11A,11 [Caenorhabditis elegans]
Length = 84
Score = 86,7 bits (213), Expect = 9e-017
Identities = 34/68 (50%), Positives = 48/68 (70%)
Frame = -2
Query: 450
KRMDKLDTVFSCPFCNHGSSVECRIDMKNLIGEASCRICQENFSTTVNALTEPIDIYSEW271
K + LDT F+CPFCNH E ++D + +G SCR+C E+F T +N L+EPID+YS+W
Sbjct: 15
KAVMPLDTQFNCPFCNHERVCEVKMDREKNVGYISCRVCSEDFQTNINYLSEPIDVYSDW74
Query: 270 IDECERVN 247
+DCE+N
Sbjct: 75 VDACEQAN 82
</PRE>
Database: All non-redundant GenBank CDS
translations+PDB+SwissProt+PIR+PRF
Figure 10. Continued.
69

Posted date: Dec 9, 2002 8:40 PM
Number of letters in database: 397,579,747
Number of sequences in database: 1,247,039
Lambda K H
0,318 0,135-9,99e+145
Gapped
Lambda K H
0,267 0,0410-3,07e+149
Matrix: BLOSUM62
Gap Penalties: Existence: 11, Extension: 1
Number of Hits to DB: 304,350,154
Number of Sequences: 1247039
Number of extensions: 5642633
Number of successful extensions: 20906
Number of sequences better than 1,0e-06: 33
Number of HSP's better than 0,0 without gapping: 20413
Number of HSP's successfully gapped in prelim test: 0
Number of HSP's that attempted gapping in prelim test: 0
Number of HSP's gapped (non-prelim): 20900
length of database: 397,579,747
effective HSP length: 111
effective length of database: 259,158,418
effective search space used: 10107178302
frameshift window, decay const: 50, 0,1
J. 12
A: 40
Figure 10. Continued.
70
XI : 16 (7,3 bits)
X2: 38 (14,6 bits)
X3: 64 (24,7 bits)
SI : 41 (21,7 bits)
Figure 10, Continued.
71

Table 7. Sample Excel File of Peri Output, The peri output file can be easily opened in a spreadsheet where it can be searched and sorted for relevant information.
Query DSAF1 61 G02,b1 A002 DSAF1 61 G03,b1 A002 DSAF1 61 G05,b1 A002 DSAF1 61 G06,b1 A002 DSAF1 61 G07,b1 A002 DSAF1 61 G09,b1 A002
score 243
67,8 192 158 270 103
e value 9,00E-64 3,00E-11 3,00E-48 2,00E-38 6,00E-72 1,00E-21
identities 115/151 29/42 87/95 76/92 128/145 49/51
length 419 157 482 736 322 253
hyperlink <a href="http: <a href="http: <a href="http: <a href="http: <a href="http: <a href="http:
annotation hypothetical protein unknown Se binding protein prolyl endopeptidase hypothetical protein ferritin [Zea mays]
72

APPENDIX B
GENE ONTOLOGY
Biological process 241 Cell communication 172
Cell death 11 Senescence 11
Cell growth and maintenance 161 Cell cycle 3 Cell growth 4 Heat schock response 33 Homeostasis 1 Intracellular traffic 1 Stress response 13 Transport 106
Signal transduction 69 Cell surface linked signal transduction 34
Enzyme linked 14 Serine threonine kinase signaling 14
G-protein dependent 16 Glutamine signalling 12 G-protein signalling 3 IP3 signalling 1
Ca++ dependent receptor signalling 4 Development process 5
Germ cell 4 Mitotic cell 1
Intracellular signalling 4 Protein kinase cascade 1
STAT cascade 1 Voltage dependent signalling 3
Physiological process 26 Pregnancy 14
Embryo related 14 Viral life cycle 8
Virus related 8
Figure 11 Complete Gene Ontology List. List of categories and the number of ESTs in each category retumed by the gene ontology search with GeneSpider.
73

Lactation 1 Pathogenesis 2 Respiration 1
Cellular component 251 Extracellular 2
Extracellular matrix 2 Collagen 2
Intracellular 241 Chromosome 1
Chromatin 1 Nucleosome 1
Cytochrome 60 Cytoplasm 43
Cytoskeleton 42 Actin 33 Microtubule 3 Myosin 6
Ubiqutin ligase complex Cytosol 20 Endoplasmic reticulum 3
Translocon 3 Golgi apparatus 7
Golgi 7 Kinetochrome 2 Lysosome 2 Mitochondrial 37 Mitotic chromosome 1 Nuclear 32 Peroxisome 6 Vacuole 27
Membrane 8 Intragal membrane 4 Plasma membrane 4
Molecular function 1401 Cell cycle regulation2
cyclin 2 Chaperone 24
Cytoskeletal regulation 1 Molecular chaperone 23
Figure 11. Continued.
74

Enzyme 1122 Aldolase 13 ATPase 55 Carboxylase 12 CoA enzyme 14 Dehydrogenase 133 Desaturase 1 Enzymes, general 27 Epimerase 15 Esterase 14 Helicase 40 Histone deacetylase 6 Hydrolase 47 Hydroxylase 5 Isomerase 36 Kinase 60
Casin kinase 11 Fructo kinase 2 Glycerate kinase 4 Glycerol kinase 10 Hexokinase 7 Map kinase 1 Nucleotide diphosphate kinase 1 Phosphatidylinositol 3-kinase 2 Protein C kinase 3 Pyruvate kinase 3 Serine threonine kinase 14
Figure 11,
Tyrosine Ligase 16 Lyase 22 Mutase 29 Oxidase 70 Oxidereductase Phosphatase Phospholipase
kinase
20 79
4 Phosophotransferase 3 Polymerase Protease Reductase Synthase Thiolase Transferase
Continued.
2 17 56 109 2 160
75

Microtubular dynamics 3 kinesin 3
Nucleic acid binding 153 Ribonucleoprotein 30 DNA binding 31
DNA binding protein 7 DNA helicase 1 Transcription factor 23
RNA polymerase II 4 RNA polymerase I 4 Transcription factor 12 Transcription initiation 3
RNA binding 31 RNA binding protein 10 RNA helicase 21
Translation factor 61 Translation elongation factor an
Translation initiation factor 59 Other groups 52
Elongation factor 18 Lysin 3 Ubiquitin 31
RNA 3 Ribosomal RNA 3
Signal transducer 3 Ligand 3
Cytokine 1 Insulin receptor ligand
Hormone 1 Insulin 1
Growth factor receptor ligand Structural protein 8
Plasma protein 6 Structural protein 2
Transport 130 Ligand binding carrier 24
Transporter 106
Figure 11. Continued.
76

Signal transduction
29%
Cell communication
71%
Figure 12. Biological Process 1-step breakdown. The gene ontology search returned two broad categories within biological process.
77

Physiological process
38%
Intracellular signalling
6%
Development process
7%
Cell surface linked signal transduction
49%
Figure 13. Signal transduction percentages. One of the two main categories of biological process returns is signal transduction. This chart shows the different processes within that category and the percentage of ESTs in that category that are involved in those particular processes.
78

Cell death 6%
Cell growth and maintenance
94%
Figure 14. Cell communication percentages. The other main category of biological process returns is cell communication. This chart shows the different processes within that category and the percentage of ESTs in that category that are Involved in those particular processes.
79

r2%
14% j [^'^
^ m ^ ^ ^ M i i ^ ^ a ^ B — 5 %
66%
• Cell death
• Cell growth and maintenance
• Cell surface linked signal transduction
• Development process
• Intracellular signalling
• Physiological process
Figure 15. Biological process 2-step breakdown. This chart shows the specific processes within the two main categories as a percentage of the total number of ESTs involved in biological processes.
80
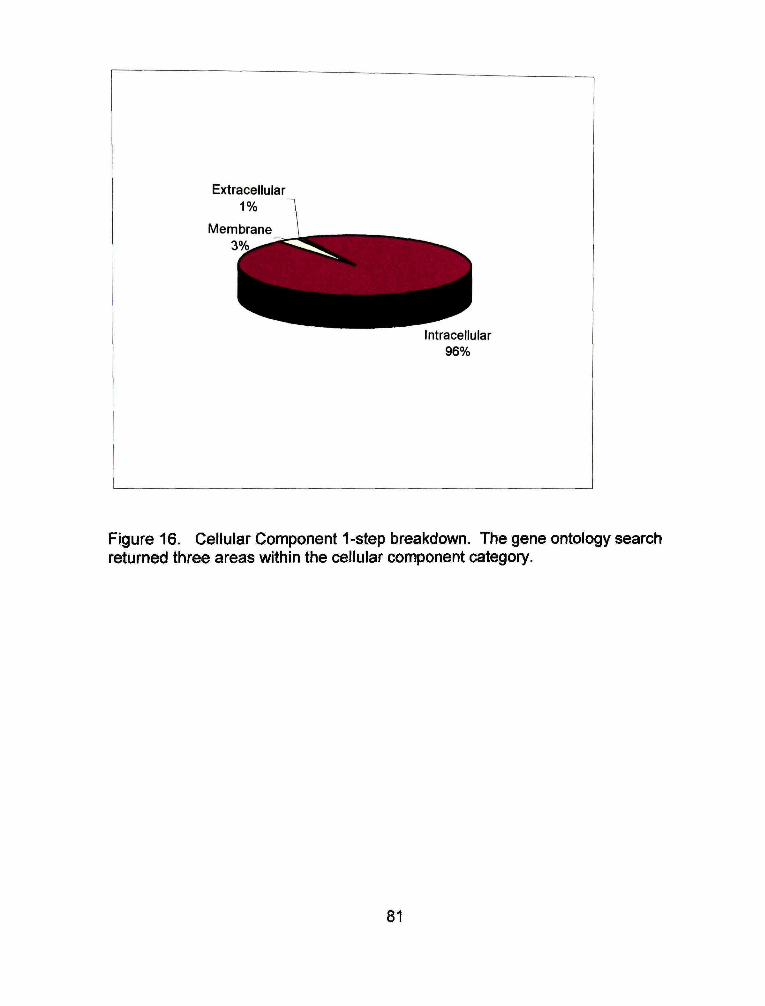
Extracellular 1%
Membrane 3'
Intracellular 96%
Figure 16. Cellular Component 1-step breakdown. The gene ontology search returned three areas within the cellular component category.
81

0%
15%- i
1%-
13%^
1%-// 1
1%- '
8%-'
2%
1 19%
26%
• Chromosome
• Cytochrome • Cytoplasm
• Cytosol
• Endoplasmic reticulum • Golgi apparatus • Kinetochrome
• Lysosome • Mitochondrial
• Mitotic chromosome
• Nuclear
• Peroxisome • Vacuole
Figure 17. Intracellular percentages. This chart shows the classes of ESTs found within the intacellular portion of the cell.
82

23%
• Extracellular matrix
• Chromosome
• Cytochrome
• Cytoplasm
• Cytosol
Q Endoplasmic reticulum
• Golgi apparatus
D Kinetochrome
• Lysosome
• Mitochondrial
• Mitotic chromosome
• Nuclear
• Peroxisome
• Vacuole
• intragal membrane
• Plasma membrane
Figure 18. Cellular Component 2-step breakdown. This chart shows all the classes of the three cellular locations (intacellular, extracellular, and membrane) as a percentage of the total number of ESTs having a cellular component.
83

1%-
0%n
3%n
10%^ 1 0 % - ^ L ^ ^ \
rO% 9% /
^ ^ ^ ^ i . ^ 0
75%
• Cell cycle regulation
• Chaperone
• Enzyme
• Mcrotubular dynamics
D Nucleic acid binding
D Other groups
• RNA
• Signal transducer
• Structural protein
• Transport
Figure 19. Molecular Function 1-step breakdown. The gene ontology search returned ten categories of molecular functions. This chart shows the percentages of the ESTs involved in each category.
84

0% 15% 1% 5%
10% -T"^**^*^^-—--..^ ^ ^ S
5%-^I^Hliipiif OOA. —1 // T ^
^'" / 2% 7%
0%-'
0%-^
7%-!
p1%
p1%
3%
1'
6%
- 2 %
r-12%
J /r3% Ja—1%
• 1 — 1 % T T \ ^ 4 %
1^1% L-4%
1-0%
- 3 %
0 Aldolase
• ATPase
D Carboxylase
Q CoA enzyme
• Dehydrogenase
D Desaturase
• Enzymes, general
P Epimerase
• Esterase
• Helicase
n Histone deacetylase
• Hydrolase
• Hydroxylase
• Isomerase
• Kinase
• Ligase
• Lyase
D Mutase
n Oxidase
n Oxidereductase
D Phosphatase
• Phospholipase
Q Phosophotransferase
n Ftolymerase
• Protease
• Reductase
n Synthase
n Thiolase
D Transferase
Figure 20. Enzymes present in EST library. The largest molecular function category was enzymes. This chart shows the different types of enzymes present in the two EST libraries.
85

translation initiation factor 66%
translation elongation factor
1%
RNA helicase 6%
RNA binding protein 0%
DNA binding transcription
initiation 3%
bonudeoprotein 11%
DNA binding protein 4%
DNA helicase 0%
RNA polymerase I 1%
RNA polymerase II 1%
DNA binding transcription factor
7%
Figure 21. Known ESTs from Tx7000 nucleic acid binding group.
86

translation initiation factor 17%
translation elongation factor
1%
ribonucleoprotein 27%
RNA helicase ^ ^ • ' " " " " ' " ' ' ^ M M l 20% ^ ^ ^ g g i ^ ^ ^ H
KNA Dinding proteinj/ 12%
_ _ _ ^ H I B DNA binding protein
\ ^ D N A helicase
L R N A polymerase 1 4%
i_RNA polymerase II 4%
DNA binding '-transcription factor
8%
DNA binding -transcription initiation
1%
Figure 22. Known ESTs from 835 nucleic acid binding group.
87

PERMISSION TO COPY
In presenting this thesis in partial fulfillment of the requirements for a
master's degree at Texas Tech University or Texas Tech University Health Sciences
Center, I agree that the Library and my major department shall make it freely
available for research purposes. Permission to copy this thesis for scholarly purposes
may be granted by the Director of the Library or my major professor. It is
understood that any copying or publication of this thesis for financial gain shall not
be allowed without my further written permission and that any user may be liable for
copyright infringement.