transapical and transfemoral aortic valve …
TRANSCRIPT

Mémoire de Maîtrise n°2474 en médecine
TRANSAPICAL AND TRANSFEMORAL AORTIC VALVE
IMPLANTATION: OPERATIVE OUTCOME IN 180
CONSECUTIVE PATIENTS
Etudiant
Sanjiv Keller
Tuteur
Dr. Enrico Ferrari, PD MER
Chirurgie cardio-vasculaire, CHUV
Expert
Prof. Eric Eeckhout
Cardiologie, CHUV
Lausanne, janvier 2016
brought to you by COREView metadata, citation and similar papers at core.ac.uk
provided by Serveur académique lausannois

ABSTRACT
Objectives
The new Transcatheter Aortic Valve Replacement (TAVR) represents a valid alternative to
the standard surgical approach for the treatement of aortic stenosis in patients with prohibitive
surgical risk, and at the moment, the two main access routes employed are transapical and
transfemoral TAVR. Aim of the study is to compare the outcome of 180 consecutive patients
who underwent transapical and transfemoral aortic valve procedures.
Method
From 2008 to 2014, 180 consecutive patients underwent transapical (90 patients) or
transfemoral (90 patients) TAVR procedures at our institute. Preoperative, intraoperative and
postoperative variables were retrospectively collected and analysed to identify risk factors for
mortality, vascular and neurological complications. Surgical outcomes were compared.
Results
Mean age was 80±8.5 years and 83±8.4 years, in the TA and TF group, respectively. TA-
TAVR group presented a higher prevalence of comorbidities with more peripheral vascular
disease, COPD, previous vascular surgery, coronary disease, previous coronary surgery and
previous cardiac surgery.
The logistic Euroscore I was 36±15% in the TA group and 25±14% in the TF group
(p<0.001).

Hospital mortality was similar (TA: 9%, TF: 10%, p=0.799) and early extubation seems to be
a protective factor against hospital mortality (p=0.001). Access related vascular complications
occurred more often in TF (TA: 3%, TF: 11%, p=0.081) whereas major or life threatening
bleeding (TA: 3%, TF: 4%, p=1) and major stroke (TA: 2%, TF: 3%, p=1) were equally
distributed. Postoperative acute renal failure and the need for a postoperative dialysis was
associated with impaired neurological outcome (respectively p=0.035 and p=0.020).
Paravalvular leaks (degree 2-4) were more prevalent in TF patients (TA: 6%, TF: 26%,
p<0.001).
Conclusion
The TF and the TA TAVR groups include two different patients’ risk profiles (the TA being
at higher risk) but mortality rate and adverse neurological outcome have a similar incidence.
The transfemoral approach carries a higher risk of vascular complications and paravalulvar
leaks (degree 2 or greater).
Key words: Transcatheter aortic valve replacement; Aortic valve stenosis; Transfemoral
aortic valve replacement; Transapical aortic valve replacement.

INTRODUCTION
Aortic valve stenosis represents the most common acquired heart valve disease in the adult.
The standard surgical aortic valve replacement (SAVR) remains the treatment of choice with
proved good surgical outcome and excellent long-term results (1-4). However, elderly
patients at high risk for surgery and suffering from severe concomitant comorbidities can
have more benefits when new minimally invasive and riskless surgical procedures are
employed. Moreover, because of the increasing life expectancy in western countries, we will
face soon a greater number of patients suffering from severe aortic valve stenosis and,
therefore, minimally invasive approaches will become even more attractive.
Since 2007, the transcatheter aortic valve replacement (TAVR) has become a widely accepted
alternative to standard cardiac surgery in elderly high-risk patients suffering from aortic
stenosis and presenting a high-risk profile. In particular, two devices, the Medtronic
CoreValve™ and the Edwards SAPIEN™ Transcatheter Heart Valve, have been already
implanted in more than 100000 patients worldwide, with outstanding results in terms of
hospital mortality and morbidity.
The PARTNER trials have proven the safety and efficacy of the TAVR procedure, its
superiority to the medical treatment and the non-inferiority to standard SAVR (5, 6). Several
published studies have also shown good outcome, survival and hemodynamic parameters in
early, midterm and even long-term follow-ups (7–13).
Several alternative access routes for TAVR have been explored: the transapical, the
transfemoral, the transaortic, the trans-subclavian and the trans-carotid. However, the two
most popular approaches are still the transapical and the transfemoral one but the attribution
of a patient to either a transfemoral (TF) or a transapical (TA) procedure is still debatable in
the absence of a severe peripheral vascular disease, because of lack of randomised clinical
trials (14–16).

The aim of the present study is to assess and compare the characteristics and the clinical
outcome of our first 90 consecutive patients treated with a transapical approach (TA-group),
and the first 90 patients treated with a transfemoral approach (TF-group).
METHODS
We retrospectively analysed the first 90 patients who underwent TA-TAVR and the first 90
patients who underwent TF-TAVR at our institution from November 2008 to June 2014.
Preoperative, intraoperative and postoperative variables from the cardiovascular surgery
database and from the clinical dossiers were prospectively collected and retrospectively
analysed. All patients signed the informed consent for TA or TF-TAVR.
Patients selection
Elderly patients suffering from severe symptomatic aortic valve stenosis and carrying other
severe comorbidities were studied for potential inclusion in the TAVR group. Then, standard
inclusion criteria were employed to identify the good candidates and the logistic Euroscore I
was calculated to evaluate the predicted hospital mortality. However, the final judgement
from the in-hospital heart-team was considered essential in order to proceed with the
transcatheter intervention, especially in case of patients not fulfilling standard criteria for
TAVR (i.e. younger patients with severe liver disease or patients with a porcelain ascending
aorta). In our institution the in-hospital heart-team is composed of a cardiologist, a cardiac
surgeon (both coordinators for the TAVR program), an anaesthesiologist, a radiologist and a
geriatrician.
Patients enrolled in the TAVR group underwent coronary angiogram and vascular CT-scan to
analyse alternative access routes. Patients with severe peripheral vascular disease or severe
aortic atherosclerosis were included in the transapical TAVR group.
A ratio of 1/3 TA-TAVR and 2/3 TF-TAVR was observed.

Transapical TAVR
Preoperative assessment for TA cases included a three-dimensional Computed Tomography
scan (CT-scan), a coronary angiogram and a trans-thoracic echocardiogram. Transapical
TAVR was performed under general anesthesia through a left antero-lateral mini-thoracotomy
at fifth intercostal space. Intraoperative cardiac imaging included trans-esophageal
echocardiogram and fluoroscopy. The apex was always prepared with two reinforced
concentric purse-string sutures (Polipropylene 3-0 or 2-0 sutures with pledgets) and the
devices were the balloon-expandable Edwards Sapien™ (2008-2010), Edwards Sapien™ XT
(2010-2014) and Edwards Sapien™ 3 (2014) transcatheter heart valves (THV) (Edwards
Lifesceinces, Irvine, CA, US).
In the very beginning of our series, even non-complicated patients were transferred intubated
in the intensive care unit while, after the preliminary experience, patients were rapidly
extubated in the cath lab and then transferred to the intermediate care unit.
Transfemoral TAVR
Patients at high surgical risk with good peripheral vascular access underwent transfemoral
procedures under general anesthesia. In our institution, the transfemoral access is performed
through a 3cm skin incision at the groin in order to punction the femoral artery under direct
vision and prevent vascular damages. Preoperative and intraoperative assessment and imaging
were the same as TA-TAVR while the employed devices were the balloon-expandable
Sapien™, Sapien XT™ and Sapien™ 3 (2014) THV from Edwards Lifesciences and the self-
expandable CoreValve™ (Medtronic corporation, Minneapolis, MN, USA). All non-
complicated patients were rapidly extubated in the cath lab and transferred to the intermediate
care unit.
Statistical analysis

The statistical analysis was performed using R (version 3.2.2). Continuous variables are
summarized as mean ± Standard Deviation (SD) and a t-test is used to compare the two
groups (TA and TF). Categorical variables are presented as numbers and proportions (%) and
a χ2 test or a Fisher exact test is used to compare the two groups. Selected categorical and
continuous preoperative and postoperative variables were analyzed as risk factors for hospital
mortality (defined as any death occurring within 30 days or during the same hospital
admission) or neurological and vascular complications, using univariate logistic regression. A
p-value below 0.05 was considered statistically significant. Authors had full access to data
and they take responsibility for their integrity.
RESULTS
From November 2008 to June 2014, 90 patients underwent TA-TAVR and 90 patients TF-
TAVR at our institution. Baseline characteristics and preoperative assessment data are
described in Table 1 and Table 2.
Mean age was different in the 2 groups (mean age of 80 ± 8.5 years and 83 ± 8.4 years, in the
TA and TF group, respectively; p=0.014), while the sex distribution was similar (50% male
patients in the TA group and 41% in the TF group, p=0.231). The TA-TAVR group presented
a higher prevalence of concomitant comorbidities: more peripheral vascular disease in the TA
group (TA: 79%, TF: 22%, p<0.001), more COPD in the transapical group (TA: 32%, TF:
10%, p<0.001), higher prevalence of previous vascular surgery (TA: 14%, TF: 4%, p=0.039),
coronary disease (TA: 60%, TF: 40%, p=0.007), previous coronary surgery (TA: 21%, TF:
9%, p=0.022) and previous cardiac surgery (TA: 28%, TF: 17%, p=0.073) in the TA group.

Also, 13% of patients in the TA group had a porcelain aorta, versus none in the TF group
according to the fact that this condition was a criteria of assignation to the TA-TAVR group.
More patients with a critical preoperative state were included in the TA group (TA: 14%, TF:
2%, p=0.005), and the calculated logistic Euroscore was higher in the TA group (36 ± 15 %
for the TA group compared to 25 ± 14 % for the TF group; p<0.001). The mean left ventricle
ejection fraction (LVEF) was better in the TF group, with a LVEF>50% in the 66% of TF
patients and 47% of TA patients (p=0.008).
To what may concern the intraoperative data, the successful implantation rate was 100% and
the mean procedural time was longer in the TF group (TA: 98 ± 33 minutes, TF: 127 ± 56
minutes, p<0.001). Eleven patients were redo valve-in-valve procedures for degenerated
aortic bioprosthesis, while seven patients received two transcatheter heart valves because of
malpositioning or migration of the first one.
Mean valve size and size distribution are listed in Table 3.
With regards to the mortality and hospital outcome, variables were collected following VARC
criteria and are listed in Table 4 (see Figure 1). Hospital mortality for the two groups was
similar (TA: 9%, TF: 10%, p=0.799) with a learning curve effect in the beginning of our
experience (Figure 2). The main cause of death in the TA group was respiratory failure
(37%), whereas in the TF group was the major stroke (33%). Major vascular complications
(access related) occurred more often in the TF group (TA: 3%, TF: 11%, p=0.081) whereas
major or life threatening bleeding (TA: 3%, TF: 4%, p=1), major stroke (TA: 2%, TF: 3%,
p=1), and bailout Sapien-in-Sapien procedures (TA: 3%, TF: 4%, p=1) were equally
distributed.
Re-thoracotomy for bleeding was performed in three TA patients and a percutaneous
pericardial drainage for tamponade was urgently performed in two TF patients. Patients
requiring postoperative dialysis were 3 in the TA group and none in the TF.

With regards to the onset of new conduction abnormalities leading to pacemaker
implantation, there were five implanted devices in the TF group and two in the TA group
(p=0.444).
Postoperative echocardiographic controls showed similar mean transaortic peak (TA: 17 ± 9.4
mmHg, TF: 18 ± 9.5, mmHg; p=0.219) and mean gradients (TA: 9.2 ± 5.1 mmHg, TF: 9.7 ±
5.5 mmHg; p=0.563). Paravalvular leaks degree 2 to 4 were detected more often in TF
patients (TA: 6%, TF: 26%, p<0.001) with 20 grade 2 paravalvular leaks in the TF group and
5 in the TA group, two grade 3 in the TF group and none in the TA group, and only 1
paravalvular leak grade 4 in the TF population.
Selected variables were analyzed as potential risk factors for hospital mortality, major
vascular complications and neurological complications (Table 5).
Concerning the hospital mortality, several variables were statistically related to a higher risk
of procedural and hospital death, these variables were: a critical preoperative state (p=0.026;
OR, 4.25; 95% CI, 1.19-15.24), the occurrence of complications (p<0.001; OR, 33.25; 95%
CI, 7.22-153), of major vascular complications (p=0.001; OR, 8.07; 95% CI, 2.28-28.53), of
valve migration (p=0.014; OR, 21.6; 95% CI, 1.85-252), of life-threatening bleeding
(p=0.001; OR, 16.41; 95% CI, 3.31-81.29), of postoperative stroke (p=0.003; OR, 17.25; 95%
CI, 2.66-112), of postoperative acute renal failure (p=0.022; OR, 10.73; 95% CI, 1.41-81.73),
of postoperative dialysis (p=0.014; OR, 21.6; 95% CI, 1.85-252) and the need for a
cardiopulmonary bypass (p=0.003; OR, 34.71; 95% CI, 3.38-356). Whereas the early
extubation represents a protective factor against hospital mortality (p=0.001; OR, 0.16; 95%
CI, 0.05-0.48).
About risk factors for major vascular complications, the cardiopulmonary bypass use seems to
be associated with higher rate of severe vascular complications (p=0.010; OR, 15; 95% CI,
1.93-116). Concerning the risk factors for stroke, the onset of postoperative acute renal failure

and the use of a postoperative dialysis were associated with a poor neurological outcome
(p=0.035; OR, 14.33; 95% CI, 1.21-169; and p=0.020; OR, 21.62; 95% CI, 1.61-290,
respectively).
DISCUSSION
Major findings of our study are that, despite the transfemoral and the transapical groups
represent two different populations with two different risk profiles, the hospital mortality rate
is similar, whereas the presence of postoperative paravalvular leaks degree 2 to 4 and major
access related vascular complications occurred more often in the TF group.
Our study compared the outcomes of 180 consecutive patients included in a transapical and a
transfemoral transcatheter aortic valve implantation group and registry (hospital database).
Patients in the transapical group had a higher prevalence of comorbidities, a higher calculated
logistic Euroscore and were more often in a preoperative critical state. Therefore, according to
the fact that patients with severe peripheral vascular disease or severe aortic atherosclerosis
were included in the transapical group, we had to deal with two patient populations carrying
two different risk profiles.
However, the mortality rate and the neurological outcome are similar despite a longer
intensive care unit length of stay and extubation time for the TA group. This is due to the fact
that at the very beginning of our TAVI experience the transapical TAVI patients were all
transferred, intubated, to the intensive care unit and extubated after few hours.
On the other hand, the transfemoral TAVI began few years later and the majority of the
uncomplicated cases were rapidly extubated in the CathLab and transferred to an intermediate
care unit.

To what may concern the mortality rate in previously reported cohorts of patients, several
cohorts report lower mortality rates. In a prospective study with a cohort of 1000 patients,
Schymik and al. reported mortality rates of 6.5 % for the TF group and 6.1 % for the TA
group (18). In a single-center experience in the US with a retrospective design, Murarka and
al. observed mortality rates of 4.5 % for the TF group and 5.3 % for the TA group (17). In
another retrospective cohort study, Van der Boon and al. reported mortality rates of 6.4 % for
the TF group and 15.7 % for the TA group (15). But none of these 3 aforementioned studies
were able to demonstrate a statistically significant difference between the two approaches and
this is in line with our findings.
The neurological outcome in our series shows similar results for the TA and the TF approach
and we didn’t observe a significant difference. Our results are in line with data presented in
literature. For instance, in the study of Schymik et al. with the prospective cohort of 1000
patients, there was a 2.3 % of stroke rate in the TF group and 1.7 % in the TA group with a
non-significant p-value (18). Other studies reported similar conclusions (14, 15, 17).
Concerning the paravalvular leak after TAVI, we have seen a great improvement after the
introduction of the new Sapien 3 THV that provides better valve coaptation to the native
aortic annulus. The paravalvular leak degree 2 to 4 was observed more often in TF cases and
this finding is in line with a retrospective study from Greason and al., who reported 12 % of
moderate and severe paravalvular leaks in the TF group versus 8.4 % in the TA group.
However, other TAVI series didn’t show this trend. In a retrospective study from Murarka
and al. quite similar results between the two groups were observed, with an incidence of 7.6
% in the TF group versus 7 % in the TA group and a p-value of 0.999.

Last but not least, the incidence of major vascular complications in our series seems to be
higher in the TF group but the result is not statistically significant. If we take into
consideration recently published cohorts of TAVI patients, we can see that the incidence of
this complication is much more prevalent in the TF subgroup. Schymik and al. reported 17.5
% of major vascular complications in the TF group versus 2.5 % in the TA group with a p-
value of <0.0001 (18). In their retrospective study, Murarka and al. observed a similar trend,
with 12.1 % of major vascular complications in the TF group versus 0 % in the TA group,
also with a highly significant p-value (17).
An important point of discussion is the technical development of our TAVI devices: the new
generations of stent-valve equipments have more performant valve designs and low-profile
delivery systems that assure a lower incidence of paravalvulare leak, a lower risk of vascular
damages and a more friendly and easy-to-use valve sizing and deployment during the
procedure. This development can have a great impact in the mortality and morbidity rate
during TAVI procedures allowing for the use of such transcatheter devices in mid-risk profile
patients and younger patients with aortic valve stenosis.
LIMIT OF THE STUDY
Our study is a retrospective, single centre experience with a relatively small number of
enrolled patients. Moreover, this patient population represents the preliminary experience in
TAVI procedures of our centre and, therefore, a physiologic learning curve can have
negatively affected the clinical outcome.

CONCLUSION
This study shows our preliminary experience in TA and TF TAVI in elderly high-risk patients
and the results are in line with recently published data. Based on our findings, we can confirm
that there is a trend towards a lowering mortality and morbidity rate in the TAVI patient
population mostly due to both the improved surgeons’ and cardiologists’ transcatheter skills
for TAVI and the advent of new less traumatic and easy-to-use second-generation TAVI
devices. Nevertheless, further clinical studies are necessary to corroborate our findings and to
confirm the long-term durability of stent-valves.
CONFLICT OF INTEREST
None declared.
ACKNOWLEDGMENTS
We thank our statistician Jérôme Pasquier.

TABLES
Table 1. Demographics, symptoms, and risk factors.
Overall
(N=180)
TA-TAVR
(N=90)
TF-TAVR
(N=90)
p
No. of patients 180 90 90
Age (years)
82 ± 8.6
(range 45-95,
median 84)
80 ± 8.5
(range 54-95,
median 81)
83 ± 8.4
(range 45-94,
median 85)
0.014
Men 82 (46%) 45 (50%) 37 (41%) 0.231*
COPD 38 (21%) 29 (32%) 9 (10%) < 0.001*
Peripheral vascular
disease
91 (51%) 71 (79%) 20 (22%) < 0.001*
Previous vascular
surgery
17 (9%) 13 (14%) 4 (4%) 0.039
Coronary disease 90 (50%) 54 (60%) 36 (40%) 0.007*
Previous coronary
surgery
27 (15%) 19 (21%) 8 (9%) 0.022*
Previous cardiac surgery 40 (22%) 25 (28%) 15 (17%) 0.073*
Previous coronary
angioplasty/stenting
28 (16%) 13 (14%) 15 (17%) 0.681*
Systemic hypertension 117 (65%) 56 (62%) 61 (68%) 0.435*
Chronic renal
insufficiency
75 (42%) 38 (42%) 37 (41%) 0.880*
Dialysis 7 (4%) 4 (4%) 3 (3%) 1

Previous stroke 20 (11%) 11 (12%) 9 (10%) 0.635*
Diabetes (under insulin
treatment)
30 (17%) 18 (20%) 12 (13%) 0.230*
Liver disease (CHILD A,
B, C)
5 (3%) 3 (3%) 2 (2%) 1
Previous PM
implantation
21 (12%) 9 (10%) 12 (13%) 0.486*
Chest X-Ray therapy for
cancer
16 (9%) 7 (8%) 9 (10%) 0.600*
Critical preoperative
state
15 (8%) 13 (14%) 2 (2%) 0.005
Porcelain aorta 12 (13%) 12 (13%) 0 (0%) 1
Mean logistic Euroscore
I (%)
31 ± 16 36 ± 15 25 ± 14 < 0.001
Data are presented as mean ± SD or N (%).
* Chi2 value, otherwise it’s a Fischer test or a T-Test value
COPD = Chronic Obstructive Pulmonary Disease; PM = pacemaker.

Table 2. Preoperative CT-scan assessment and aortic valve hemodynamic.
Overall
(N=180)
TA-TAVR
group
(N=90)
TF-TAVR
group
(N=90)
p
Transaortic peak gradient (mmHg) 67 ± 26 62 ± 25 71 ± 28
Mean aortic valve area (cm²) 0.9 ± 3.4 1.2 ± 4.8 0.7 ± 0.2
Indexed mean aortic valve area
(cm²/m²)
0.4 ± 0.1 0.4 ± 0.1 0.4 ± 0.1
Mean left ventricle ejection
fraction (%)
54 ± 13 52 ± 12 56 ± 13
>50% 101 (56%) 42 (47%) 59 (66%) 0.008*
30 – 50% 70 (39%) 42 (47%) 28 (32%)
<30% 8 (4%) 6 (6%) 2 (2%)
Pulmonary hypertension 101 (56%) 48 (53%) 53 (59%) 0.453*
Mean aortic annulus diameter at
CT-scan (mm)
23 ± 2.3 23 ± 2.5 24 ± 2.1
Mean aortic annulus diameter at
TEE (mm)
23 ± 2.2 22 ± 2 22 ± 2.4
Mean distance between aortic
annulus and LCA (mm)
13 ± 2.9 12 ± 2 14 ± 3.2
Mean distance between aortic
annulus and RCA (mm)
134 ± 4 12 ± 3 15 ± 4.4
Data are presented as mean ± SD or N (%).
* Chi2 value

CT = Computed Tomography; TEE = Trans-Esophageal Echocardiography; LCA = Left
Coronary Artery; RCA = Right Coronary Artery.
Table 3. Intraoperative data.
Overall
(N=180)
TA-TAVR
group
(N=90)
TF-TAVR
group
(N=90)
p
Sapien™ and Sapien XT™
THV
146 (81%) 86 (96%) 60 (67%)
Sapien 3™ 8 (4%) 4 (4%) 4 (4%)
CoreValve™ 26 (29%) 0 (0%) 26 (29%)
Valve-in-valve (in degenerated
bioprosthesis)
12 (7%) 7 (8%) 5 (6%) 0.550*
Bailout valve-in-valve 7 (4%) 3 (3%) 4 (4%) 1
Mean valve size (mm) 25 ± 2.1 25 ± 1.9 25.3 ± 2.2
Size distribution:
23 mm 75 (42%) 40 (44%) 35 (39%)
26 mm 77 (43%) 43 (48%) 44 (49%)
29 mm 14 (8%) 7 (8%) 7 (8%)
31 mm 4 (4%) 0 (0%) 4 (4%)
Mean procedural time (min) 113 ± 48 98 ± 33 127 ± 56 < 0.001
Data are presented as mean ± SD or N (%).
* Chi2 value, otherwise it’s a Fischer test or a T-Test value
THV = Transcatheter Heart Valve

Table 4. Postoperative clinical results.
Overall
(N=180)
TA-TAVR
group
(N=90)
TF-TAVR
group
(N=90)
p
Hospital mortality 17 (9%) 8 (9%) 9 (10%) 0.799*
Cause of death
Respiratory failure 3 (2%) 3 (3%) 0 (0%)
Cardiac tamponade for aortic
annulus rupture
2 (1%) 0 (0%) 2 (2%)
Valve migration 1 (1%) 0 (0%) 1 (1%)
Myocardial infarction 1 (1%) 1 (1%) 0 (0%)
Cardiac failure 1 (1%) 0 (0%) 1 (1%)
Sudden death 1 (1%) 1 (1%) 0 (0%)
Cardiac arrest 2 (1%) 0 (0%) 2 (2%)
Life threatening bleeding 1 (1%) 1 (1%) 0 (0%)
Multiple organ failure 1 (1%) 1 (1%) 0 (0%)
Major stroke 4 (2%) 1 (1%) 3 (3%)
Complicated procedures 48 (27%) 21 (23%) 23 (26%) 0.729*
Kind of complication
Major vascular complication
(access related)
13 (7%) 3 (3%) 10 (11%) 0.081
Valve migration 3 (2%) 1 (1%) 2 (2%) 1
Major or life-threatening
bleeding
7 (4%) 3 (3%) 4 (4%) 1
Major stroke 5 (3%) 2 (2%) 3 (3%) 1

Coronary occlusion 1 (1%) 1 (1%) 0 (0%) 1
Bailout Sapien-in-Sapien 7 (4%) 3 (3%) 4 (4%) 1
Pneumonia 6 (3%) 5 (6%) 1 (1%) 0.211
Rethoracotomy for bleeding or
pericardial drainage for
tamponade
5 (3%) 3 (3%) 2 (2%) 1
Postoperative acute renal
failure
4 (2%) 3 (3%) 1 (1%) 0.621
Transitory dialysis 3 (2%) 3 (3%) 0 (0%) 0.246
PM implantation for onset of
new conduction abnormality
7 (4%) 2 (2%) 5 (6%) 0.444
Conversion to full sternotomy 2 (1%) 2 (2%) 0 (0%) 0.497
Bailout CPB use 4 (2%) 4 (4%) 0 (0%) 0.121
Extubation in OR or Cath lab 123 (68%) 40 (44%) 83 (92%) < 0.001*
Mean ICU stay (days)
1.4 ± 4.1
(median: 0)
2.6 ± 5.5
(median: 1)
0.2 ± 0.7
(median: 0)
< 0.001
Mean hospital stay (days)
11.7 ± 9.1
(median: 9)
13.9 ± 9.5
(median: 10)
9.4 ± 8.2
(median: 8)
< 0.001
Mean transaortic peak gradient
(mmHg)
17.6 ± 9.5 16.7 ± 9.4 18.5 ± 9.5 0.219
Mean transaortic mean
gradient (mmHg)
9.5 ± 5.3 9.2 ± 5.1 9.7 ± 5.5 0.563
Paravalvular leak = 0 101 (56%) 70 (78%) 31 (34%)
Paravalvular leak 2-4 28 (16%) 5 (6%) 23 (26%) < 0.001*
Paravalvular leak = 1 48 (27%) 15 (17%) 33 (37%)

Paravalvular leak = 2 25 (14%) 5 (5%) 20 (22%)
Paravalvular leak = 3 2 (1%) 0 (0%) 2 (2%)
Paravalvular leak = 4 1 (1%) 0 (0%) 1 (1%)
Data are presented as mean ± SD or N (%).
* Chi2 value, otherwise it’s a Fischer test or a T-Test value
CPB = Cardio-pulmonary Bypass; OR = Operating Room; ICU = Intensive Care Unit

Figure 1. Distribution of complications following the VARC criteria.
p = 0.799
p = 0.081
p = 1
p < 0.001
p = 0.444
p = 1
0
5
10
15
20
25
30
Hospital mortality Major vascularcomplication
Post-operative stroke Paravalvular leak 2-4 PM implantation Life-threateningbleeding
%
TF TA

Figure 2. Time evolution of hospital mortality.
0
0,5
1
1,5
2
2,5
3
3,5
4
4,5
2009 2010 2011 2012 2013 2014
Evolution of hospital mortality
TA group TF group
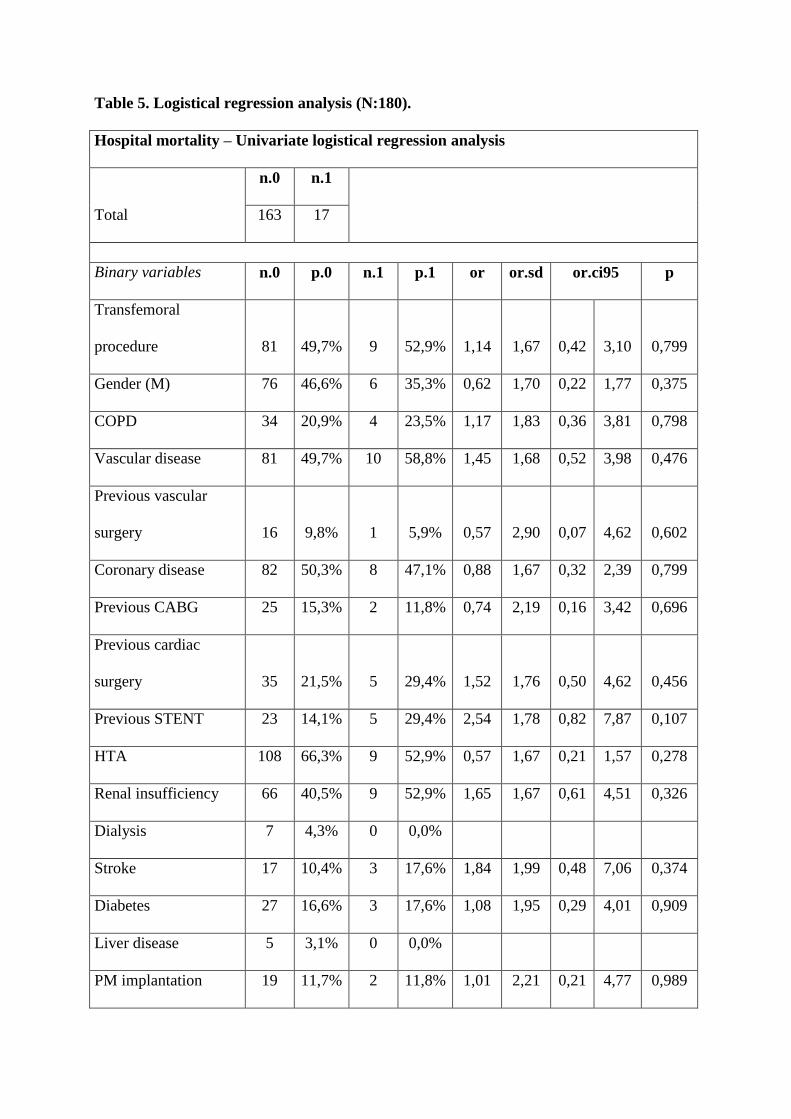
Table 5. Logistical regression analysis (N:180).
Hospital mortality – Univariate logistical regression analysis
Total
n.0 n.1
163 17
Binary variables n.0 p.0 n.1 p.1 or or.sd or.ci95 p
Transfemoral
procedure 81 49,7% 9 52,9% 1,14 1,67 0,42 3,10 0,799
Gender (M) 76 46,6% 6 35,3% 0,62 1,70 0,22 1,77 0,375
COPD 34 20,9% 4 23,5% 1,17 1,83 0,36 3,81 0,798
Vascular disease 81 49,7% 10 58,8% 1,45 1,68 0,52 3,98 0,476
Previous vascular
surgery 16 9,8% 1 5,9% 0,57 2,90 0,07 4,62 0,602
Coronary disease 82 50,3% 8 47,1% 0,88 1,67 0,32 2,39 0,799
Previous CABG 25 15,3% 2 11,8% 0,74 2,19 0,16 3,42 0,696
Previous cardiac
surgery 35 21,5% 5 29,4% 1,52 1,76 0,50 4,62 0,456
Previous STENT 23 14,1% 5 29,4% 2,54 1,78 0,82 7,87 0,107
HTA 108 66,3% 9 52,9% 0,57 1,67 0,21 1,57 0,278
Renal insufficiency 66 40,5% 9 52,9% 1,65 1,67 0,61 4,51 0,326
Dialysis 7 4,3% 0 0,0%
Stroke 17 10,4% 3 17,6% 1,84 1,99 0,48 7,06 0,374
Diabetes 27 16,6% 3 17,6% 1,08 1,95 0,29 4,01 0,909
Liver disease 5 3,1% 0 0,0%
PM implantation 19 11,7% 2 11,8% 1,01 2,21 0,21 4,77 0,989

Thorax Xray therapy 14 8,6% 2 11,8% 1,42 2,23 0,29 6,85 0,663
Critical state 11 6,7% 4 23,5% 4,25 1,92 1,19 15,24 0,026
Porcelain aorta 12 14,6% 0 0,0%
EuroScore>20% 117 71,8% 12 70,6% 0,94 1,75 0,31 2,83 0,917
LVEF>50% 91 55,8% 10 62,5% 1,32 1,72 0,46 3,80 0,608
Pulmonary
hypertension 95 58,3% 6 35,3% 0,39 1,70 0,14 1,11 0,077
Valve in valve 11 6,7% 1 5,9% 0,86 2,94 0,10 7,13 0,892
Complications 30 18,4% 15 88,2% 33,25 2,18 7,22 153 0,000
Major vascular
complication 8 4,9% 5 29,4% 8,07 1,90 2,28 28,53 0,001
Valve migration 1 0,6% 2 11,8% 21,60 3,50 1,85 252 0,014
Lifethreatening
bleeding 3 1,8% 4 23,5% 16,41 2,26 3,31 81,29 0,001
Postoperative stroke 2 1,2% 3 17,6% 17,25 2,60 2,66 112 0,003
Coronary occlusion 0 0,0% 1 5,9%
Bailout Sapien in
Sapien 7 4,3% 0 0,0%
Pneumonia 4 2,5% 2 11,8% 5,30 2,48 0,90 31,37 0,066
Pericardial drainage or
rethoracotomy for
bleeding 5 3,1% 0 0,0%
Postoperative ARF 2 1,2% 2 11,8% 10,73 2,82 1,41 81,73 0,022
Postoperative dialysis 1 0,6% 2 11,8% 21,60 3,50 1,85 252 0,014
PM implantation post 6 3,7% 1 5,9% 1,64 3,04 0,19 14,45 0,658

TAVI
Conversion to
sternotomy 0 0,0% 2 11,8%
CPB 1 0,6% 3 17,6% 34,71 3,28 3,38 356 0,003
Extubation in OR or
CathLab 118 72,4% 5 29,4% 0,16 1,75 0,05 0,48 0,001
Paravalvular leak
(degree 2-4) 25 15,4% 3 20,0% 1,37 1,98 0,36 5,21 0,644
OR = odds ratio; OR.SD = odds ratio standard deviation; OR.CI95 = odds ratio 95%
confidence interval; p = p value; COPD = chronic obstructive pulmonary disease; CABG =
coronary artery bypass graft; PM = pacemaker; LVEF = left ventricular ejection fraction;
ARF = acute renal failure; CPB = Cardio-pulmonary Bypass
Major vascular complications - Univariate logistical regression analysis
n.0 n.1
Total 167 13
Binary variables n.0 p.0 n.1 p.1 or or.sd or.ci95 p
Way (TF) 80 47,9% 10 76,9% 3,62 1,97 0,96 13,64 0,057
Gender (M) 78 46,7% 4 30,8% 0,51 1,86 0,15 1,71 0,274
COPD 36 21,6% 2 15,4% 0,66 2,21 0,14 3,12 0,602
Vascular disease 84 50,3% 7 53,8% 1,15 1,78 0,37 3,58 0,806
Previous vascular
surgery 15 9,0% 2 15,4% 1,84 2,26 0,37 9,10 0,453

Coronary disease 85 50,9% 5 38,5% 0,60 1,81 0,19 1,92 0,392
Previous CABG 26 15,6% 1 7,7% 0,45 2,89 0,06 3,62 0,455
Previous cardiac
surgery 38 22,8% 2 15,4% 0,62 2,20 0,13 2,91 0,542
Previous coronary
stenting 28 16,8% 0 0,0%
HTA 110 65,9% 7 53,8% 0,60 1,79 0,19 1,88 0,385
Renal insufficiency 72 43,1% 3 23,1% 0,40 1,97 0,11 1,49 0,171
Dialysis 7 4,2% 0 0,0%
Stroke 20 12,0% 0 0,0%
Diabetes 29 17,4% 1 7,7% 0,40 2,89 0,05 3,17 0,383
Liver disease 5 3,0% 0 0,0%
PM implantation 20 12,0% 1 7,7% 0,61 2,91 0,08 4,97 0,646
Thorax Xray therapy 14 8,4% 2 15,4% 1,99 2,27 0,40 9,87 0,401
Critical state 14 8,4% 1 7,7% 0,91 2,94 0,11 7,53 0,931
Porcelain aorta 12 13,8% 0 0,0%
EuroScore>20% 121 72,5% 8 61,5% 0,61 1,81 0,19 1,96 0,404
LVEF>50% 95 57,2% 6 46,2% 0,64 1,78 0,21 1,99 0,441
Pulmonary
hypertension 96 57,5% 5 38,5% 0,46 1,81 0,15 1,47 0,192
Valve in valve 11 6,6% 1 7,7% 1,18 2,96 0,14 9,94 0,878
Complications 32 19,2% 13 100%
Hospital mortality 12 7,2% 5 38,5% 8,07 1,90 2,28 28,53 0,001
Valve migration 3 1,8% 0 0,0%

Lifethreatening
bleeding 0 0,0% 7 53,8%
Postoperative stroke 4 2,4% 1 7,7% 3,40 3,18 0,35 32,82 0,291
Coronary occlusion 1 0,6% 0 0,0%
Bailout Sapien in
Sapien 7 4,2% 0 0,0%
Pneumonia 6 3,6% 0 0,0%
Pericardial drainage or
rethoracotomy for
bleeding 4 2,4% 1 7,7% 3,40 3,18 0,35 32,82 0,291
Postoperative ARF 3 1,8% 1 7,7% 4,56 3,30 0,44 47,19 0,204
Postoperative dialysis 2 1,2% 1 7,7% 6,87 3,53 0,58 81,36 0,126
PM implantation post
TAVI 7 4,2% 0 0,0%
Conversion to
sternotomy 1 0,6% 1 7,7% 13,83 4,24 0,81 235 0,069
CPB 2 1,2% 2 15,4% 15,00 2,85 1,93 116 0,010
Extubation in OR or
CathLab 117 70,1% 6 46,2% 0,37 1,79 0,12 1,14 0,084
Paravalvular leak
(degree 2-4) 26 15,8% 2 16,7% 1,07 2,23 0,22 5,16 0,934
OR = odds ratio; OR.SD = odds ratio standard deviation; OR.CI95 = odds ratio 95%
confidence interval; p = p value; COPD = chronic obstructive pulmonary disease; CABG =
coronary artery bypass graft; PM = pacemaker; LVEF = left ventricular ejection fraction;
ARF = acute renal failure; CPB = Cardio-pulmonary Bypass

Postoperative Stroke - Univariate logistical regression analysis
n.0 n.1
Total 175 5
Binary variables n.0 p.0 n.1 p.1 or or.sd or.ci95 p
Way (TF) 87 49,7% 3 60,0% 1,52 2,52 0,25 9,30 0,652
Gender (M) 81 46,3% 1 20,0% 0,29 3,09 0,03 2,65 0,273
COPD 37 21,1% 1 20,0% 0,93 3,11 0,10 8,59 0,951
Vascular disease 88 50,3% 3 60,0% 1,48 2,52 0,24 9,09 0,670
Previous vascular
surgery 17 9,7% 0 0,0%
Coronary disease 88 50,3% 2 40,0% 0,66 2,52 0,11 4,04 0,652
Previous CABG 26 14,9% 1 20,0% 1,43 3,12 0,15 13,33 0,752
Previous cardiac
surgery 38 21,7% 2 40,0% 2,40 2,54 0,39 14,91 0,346
Previous coronary
stenting 27 15,4% 1 20,0% 1,37 3,12 0,15 12,74 0,782
HTA 114 65,1% 3 60,0% 0,80 2,53 0,13 4,93 0,812
Renal insufficiency 75 42,9% 0 0,0%
Dialysis 7 4,0% 0 0,0%
Stroke 19 10,9% 1 20,0% 2,05 3,14 0,22 19,33 0,530
Diabetes 29 16,6% 1 20,0% 1,26 3,12 0,14 11,67 0,840
Liver disease 5 2,9% 0 0,0%
PM implantation 21 12,0% 0 0,0%

Thorax Xray therapy 16 9,1% 0 0,0%
Critical state 15 8,6% 0 0,0%
Porcelain aorta 12 13,6% 0 0,0%
EuroScore>20% 124 70,9% 5 100%
LVEF>50% 97 55,7% 4 80,0% 3,18 3,09 0,35 28,99 0,306
Pulmonary
hypertension 98 56,0% 3 60,0% 1,18 2,52 0,19 7,23 0,859
Valve in valve 12 6,9% 0 0,0%
Complications 40 22,9% 5 100%
Hospital mortality 14 8,0% 3 60,0% 17,25 2,60 2,66 112 0,003
Major vascular
complication 12 6,9% 1 20,0% 3,40 3,18 0,35 32,82 0,291
Valve migration 3 1,7% 0 0,0%
Lifethreatening
bleeding 7 4,0% 0 0,0%
Coronary occlusion 1 0,6% 0 0,0%
Bailout Sapien in
Sapien 7 4,0% 0 0,0%
Pneumonia 6 3,4% 0 0,0%
Pericardial drainage
or rethoracotomy for
bleeding 5 2,9% 0 0,0%
Postoperative ARF 3 1,7% 1 20,0% 14,33 3,53 1,21 169 0,035
Postoperative dialysis 2 1,1% 1 20,0% 21,62 3,76 1,61 290 0,020
PM implantation post 7 4,0% 0 0,0%

TAVI
Conversion to
sternotomy 2 1,1% 0 0,0%
CPB 4 2,3% 0 0,0%
Extubation in OR or
CathLab 121 69,1% 2 40,0% 0,30 2,53 0,05 1,83 0,191
Paravalvular leak
(grade 2-4) 28 16,3% 0 0,0%
OR = odds ratio; OR.SD = odds ratio standard deviation; OR.CI95 = odds ratio 95%
confidence interval; p = p value; COPD = chronic obstructive pulmonary disease; CABG =
coronary artery bypass graft; PM = pacemaker; LVEF = left ventricular ejection fraction;
ARF = acute renal failure; CPB = Cardio-pulmonary Bypass

REFERENCES
1. Carabello BA. Aortic Stenosis. N Engl J Med. 2002;346:677‑682.
2. Nishimura RA, Otto CM, Bonow RO, Carabello BA, Erwin III JP, Guyton RA, et al.
2014 AHA/ACC guideline for the management of patients with valvular heart disease: A
report of the American College of Cardiology/American Heart Association Task Force on
Practice Guidelines. J Thorac Cardiovasc Surg. 2014;148:e1‑e132.
3. Czarny MJ, Resar JR. Diagnosis and management of valvular aortic stenosis. Clin Med
Insights Cardiol. 2014;8(Suppl 1):15‑24.
4. Iung B, Baron G, Butchart EG, Delahaye F, Gohlke-Bärwolf C, Levang OW, et al. A
prospective survey of patients with valvular heart disease in Europe: The Euro Heart
Survey on Valvular Heart Disease. Eur Heart J. 2003;24:1231‑1243.
5. Leon MB, Smith CR, Mack M, Miller DC, Moses JW, Svensson LG, et al. Transcatheter
aortic-valve implantation for aortic stenosis in patients who cannot undergo surgery. N
Engl J Med. 2010;363:1597‑1607.
6. Smith CR, Leon MB, Mack MJ, Miller DC, Moses JW, Svensson LG, et al. Transcatheter
versus surgical aortic-valve replacement in high-risk patients. N Engl J Med.
2011;364:2187‑2198.
7. Codner P, Assali A, Dvir D, Vaknin-Assa H, Porat E, Shapira Y, et al. Two-year
outcomes for patients with severe symptomatic aortic stenosis treated with transcatheter
aortic valve implantation. Am J Cardiol. 2013;111:1330‑1336.
8. D’Onofrio A, Salizzoni S, Agrifoglio M, Cota L, Luzi G, Tartara PM, et al. Medium term
outcomes of transapical aortic valve implantation: results from the Italian Registry of
Trans-Apical Aortic Valve Implantation. Ann Thorac Surg. 2013;96:830‑835.
9. Schymik G, Schröfel H, Schymik JS, Wondraschek R, Süselbeck T, Kiefer R, et al. Acute
and late outcomes of Transcatheter Aortic Valve Implantation (TAVI) for the treatment of
severe symptomatic aortic stenosis in patients at high- and low-surgical risk. J Intervent
Cardiol. 2012;25:364‑374.
10. Gotzmann M, Korten M, Bojara W, Lindstaedt M, Rahlmann P, Mügge A, et al. Long-
term outcome of patients with moderate and severe prosthetic aortic valve regurgitation
after transcatheter aortic valve implantation. Am J Cardiol. 2012;110:1500‑1506.
11. Ussia GP, Barbanti M, Cammalleri V, Scarabelli M, Mulè M, Aruta P, et al. Quality-of-
life in elderly patients one year after transcatheter aortic valve implantation for severe
aortic stenosis. EuroIntervention J Eur Collab Work Group Interv Cardiol Eur Soc
Cardiol. 2011;7:573‑579.
12. Georgiadou P, Kontodima P, Sbarouni E, Karavolias GK, Smirli A, Xanthos T, et al.
Long-term quality of life improvement after transcatheter aortic valve implantation. Am
Heart J. 2011;162:232‑237.
13. Gonçalves A, Marcos-Alberca P, Almeria C, Feltes G, Hernández-Antolín RA, Rodríguez
E, et al. Quality of life improvement at midterm follow-up after transcatheter aortic valve
implantation. Int J Cardiol. 2013;162:117‑122.
14. Greason KL, Suri RM, Nkomo VT, Rihal CS, Holmes DR, Mathew V. Beyond the
learning curve: transapical versus transfemoral transcatheter aortic valve replacement in
the treatment of severe aortic valve stenosis. J Card Surg. 2014;29:303‑307.
15. Van der Boon RMA, Marcheix B, Tchetche D, Chieffo A, Van Mieghem NM, Dumonteil
N, et al. Transapical versus transfemoral aortic valve implantation: a multicenter
collaborative study. Ann Thorac Surg. 2014;97:22‑28.
16. Gaasch WH, D’Agostino RS. Transcatheter aortic valve implantation: The transfemoral
versus the transapical approach. Ann Cardiothorac Surg. 2012;1:200‑205.
17. Murarka S, Lazkani M, Neihaus M, Boggess M, Morris M, Gellert G, et al. Comparison
of 30-Day Outcomes of Transfemoral Versus Transapical Approach for Transcatheter
Aortic Valve Replacement: A Single-Center US Experience. Ann Thorac Surg.
2015;99:1539‑1544.
18. Schymik G, Würth A, Bramlage P, Herbinger T, Heimeshoff M, Pilz L, et al. Long-term
results of transapical versus transfemoral TAVI in a real world population of 1000
patients with severe symptomatic aortic stenosis. Circ Cardiovasc Interv. 2015;8(1).