trans isomers of epa and dha in refining and concentration
TRANSCRIPT

Norwegian College of Fishery Science Faculty of Biosciences, Fisheries and Economy
Trans isomers of EPA and DHA in refining and concentration of fish oils. Lars Dalheim Master thesis in Fishery and Aquaculture Science | FSK-3960 (60 ECT) 15 May 2015

I

II
Acknowledgements This master thesis marks the end of five years of study at the Norwegian College of Fishery
Science, five years that have given me a lot of new knowledge and friendships.
First and foremost I would like to thank my supervisor, Ragnar L. Olsen, for guiding me
through this process, giving me priceless advice and being kind and helpful at all times.
I would also like to thank my co-supervisors Stig Jansson og Jørgen Lødemel for inspiring
thoughts and helping me understand the principles of processing fish oil, and to Bjarne
Landfald for helping me with the writing and asking important and critical questions about
this thesis.
Thank you to Guro Edvinsen for helping me out in the lab and offering kind words every time
an experiment went wrong.
To all my fellow students for being good people and to everybody at Nordic Pharma Inc. for
all your help, it is much appreciated.
Cynthia Srigley also deserves a big thank you for being so kind and helpful and answering my
questions concerning isomerization of FAMEs.
A billion thanks to my mother and father, for supporting me in every possible way and for
motivating me every step of the way. Thank you to my girlfriend Thea for being patient and
caring and supporting me in every situation. An immense thank you to my brother (1985-
2012) for being the greatest person while he lived, and being the best brother one could
imagine.
Tromsø, May 2015
Lars Dalheim

III

IV
Abstract The omega-3 long-chain polyunsaturated fatty acids (LC-PUFA) eicosapentaenoic acid (EPA)
and docosahexaenoic acid (DHA) are strongly recommended to be part of a normal diet due
to the many positive health effects in humans. Health authorities in many countries
recommend an average daily intake of 0.25 – 0.5 grams of EPA and DHA by eating fish at
least twice a week or alternatively, consume fish oil supplements. The unsaturated fatty acids
in native marine and vegetable lipids are all present as cis-isomers while trans-isomers are
found in industrially hydrogenated oils and in minor amounts in fat from ruminants. The
intake of large amounts of trans-fatty acids is considered to have serious negative health
effects and the advices are to reduce the consumption as much as possible.
Several processing steps are necessary to produce high quality fish oil supplements,
including concentrated forms of EPA and DHA. These steps include high temperature
processes that might induce transformation of cis-double bonds to trans-double bonds in the
unsaturated fatty acids. The objectives of this thesis was determine if the processing
conditions used at Nordic Pharma Inc. resulted in the formation of trans fatty acids in both
natural “1812” fish oils (18 % EPA, 12 % DHA) and EPA/DHA concentrates and to
investigate how time and temperature used in the processing steps affected the formation of
trans fatty acids in fish oil concentrates. Initially, a method for the analysis of trans fatty
acids in fish oils was established.
Methylated standards of trans EPA and DHA were produced using p-toluenesulfinic
acid as catalyst and separating the different isomers on high performance thin layer
chromatography (HPTLC) plates impregnated with silver nitrate. A 100 meter SLB-IL111,
the most polar gas chromatography (GC) column commercially available, was used to analyze
the samples. The preparation and the separation of the trans standards on HPTLC plates was
successful and gave sufficient amounts to optimize a temperature program for GC separation.
The results from samples of processed fish oil showed that only minor amounts of trans fatty
acids were formed during the processing conditions applied at Nordic Pharma Inc. The
content of trans fatty acids was far below the amount allowed for such products. The SLB-
IL111 column worked well as a tool for analysis of trans fatty acids in fish oil, but some
further investigations are needed for this analysis system to be optimized. The temperature
experiment showed that 200 °C for more than an hour was needed for the formation of larger
amounts of trans LC-PUFA to occur.
Keywords: Fish oil, industrial processing, trans fatty acids, EPA, DHA, SLB-IL111, silver
ion TLC

V

VI
Sammendrag De langkjedede, flerumettede omega-3-fettsyrene eikosapentaensyre (EPA) og
dokosaheksaensyre (DHA) er sterkt anbefalt som en del av det normale kostholdet på grunn
av de mange positive helseeffektene disse har. Helsemyndighetene i flere land anbefaler at en
bør få i seg 0,25-0,5 gram EPA og DHA daglig, enten ved å spise fisk to ganger i uka eller
alternativt å få i seg tilsvarende mengder fra fiskeoljetilskudd. De umettede fettsyrene som
forekommer i naturlig marint og vegetabilsk fett foreligger som cis-isomerer, mens trans-
isomerer finnes i industrielt herdet fett og i små mengder i fett fra drøvtyggere. Et høyt inntak
av trans-fettsyrer er ansett å ha en negativ effekt på helsa, og inntaket anbefales å reduseres til
et minimum.
For å oppnå høy kvalitet på fiskeoljetilskuddene, inkludert konsentrater av EPA og
DHA, må flere raffineringstrinn gjennomføres. Flere av disse prosessene involverer høye
temperaturer som potensielt kan indusere omdannelse av cis-dobbeltbindinger til trans-
dobbeltbindinger. Målene med denne oppgaven var å finne ut om prosessbetingelsene som
brukes hos Nordic Pharma Inc. resulterte i dannelse av trans-fettsyrer, i både naturlige
«1812»-oljer (18% EPA og 12% DHA) og EPA/DHA-konsentrater, og å finne ut hvilken
effekt tid og temperatur, i prosesseringen, har på dannelsen av trans-fettsyrer i
fiskeoljekonsentrater. Først ble en metode for analyse av trans-fettsyrer etablert.
Metylerte standarder av trans EPA og DHA ble laget ved hjelp av p-toluensulfinsyre
som katalysator og separert ved hjelp av tynnsjiktskromatografiplater (HPTLC) impregnert
med sølvnitrat. En 100 meter lang SLB-IL111 kolonne, den mest polare kolonnen som er
kommersielt tilgjengelig for gasskromatografi (GC), ble brukt for å analysere prøvene.
Tillagingen og separasjon av trans-standardene på HPTLC-platene fungerte godt, og gav
tilstrekkelige mengder til å optimalisere et temperaturprogram for separasjon på GC.
Resultatene fra de prosesserte fiskeoljeprøvene viste at bare små mengder trans-fettsyrer ble
dannet under de prosessbetingelsene som brukes ved Nordic Pharma Inc. Innholdet av trans-
fettsyrer var langt lavere enn hva som er tillatt i slike produkter. SLB-IL111-kolonnen
fungerte bra som et verktøy for analyse av trans-fettsyrer i fiskeolje, men det trengs videre
undersøkelser for å optimalisere dette analysesystemet. Temperatureksperimentet viste at
fiskeoljekonsentratet måtte varmes til 200 °C i over en time for at det skulle dannes større
mengder av trans-fettsyrer.
Nøkkelord: fiskeolje, industriell prosessering, trans-fettsyrer, EPA, DHA, SLB-IL111,
sølvion-kromatografi

VII

VIII
Abbreviations ALA – α-linolenic acid
AOCS – American Oil Chemists Society
ARA – arachidonic acid
BHT – butylated hydroxytoluene
BLF 1812 – bleached fish oil containing 18% EPA and 12% DHA
DAG – diacylglycerol
DEO 1812 – deodorized fish oil containing 18% EPA and 12% DHA
DHA – docosahexaenoic acid
DPA – docosapentaenoic acid
DTD 3020 – concentrate from SPD containing 30% EPA and 20% DHA
DTL – volatile fraction distillate from SPD
DTR – heavy fraction residue from SPD
ELOVL2 – elongation of very long chain fatty acids 2 enzyme
ELOVL5 – elongation of very long chain fatty acids 5 enzyme
EPA – eicosapentaenoic acid
ETY 2412 – fish oil in ethyl ester form containing 24% EPA and 12% DHA
FA – fatty acid
FAEE – fatty acid ethyl ester
FAME – fatty acid methyl ester
FID – flame ionization detector
GC – gas chromatography
HDL – high density lipoproteins
HEPT – height equivalent per theoretical plate
HPTLC – high performance thin layer chromatography
IL – ionic liquid
LA – linoleic acid
LC-PUFA – long chain polyunsaturated fatty acids
LDL – low density lipoproteins
MAG – monoacylglycerol
MS – mass spectrometry
PHFO – partially hydrogenated fish oil
PHVO – partially hydrogenated vegetable oil
PLC – preparative layer chromatography
POPs – persistent organic pollutants
PTSA – p-toluenesulfinic acid
rt – retention time
SPD – short path distillation
STF 1812 – stripped fish oil containing 18% EPA and 12% DHA
TAG – triacylglycerol
VKM – Norwegian Scientific Committee for Food Safety
VNT 1812 – winterized fish oil containing 18% EPA and 12% DHA

IX
Contents 1 Introduction ......................................................................................................................... 1
2 Background ......................................................................................................................... 4
2.1 Fatty acids .................................................................................................................... 4
2.1.1 The structure of fatty acids ................................................................................... 4
2.1.2 The roles of fatty acids in the body ...................................................................... 5
2.2 Industrial Processing and Refining of Fish Oil ......................................................... 11
2.3 Analysis of fatty acids ............................................................................................... 14
2.3.1 Chromatography ................................................................................................. 14
2.3.2 Silver ion chromatography ................................................................................. 14
2.3.3 Gas chromatography .......................................................................................... 16
3 Materials and methods ...................................................................................................... 22
3.1 Chemicals, standards and equipment ......................................................................... 22
3.2 Isomerization of EPA and DHA standards ................................................................ 23
3.2.1 Acidification of sodium p-toluenesulfinate ........................................................ 23
3.2.2 Isomerization ...................................................................................................... 23
3.3 Silver ion TLC ........................................................................................................... 23
3.3.1 Preparation of TLC plates .................................................................................. 23
3.3.2 Applying sample to TLC plate ........................................................................... 24
3.3.3 Developing the plates ......................................................................................... 24
3.3.4 Method testing .................................................................................................... 24
3.3.5 Sample recovery ................................................................................................. 24
3.4 Column installation and conditioning........................................................................ 25
3.5 Optimization of temperature programs for analysis of trans fatty acids ................... 25
3.6 Fatty acid composition............................................................................................... 26
3.6.1 Methylation ........................................................................................................ 26
3.6.2 GC instrumentation and programming ............................................................... 27
3.7 Oil samples from production ..................................................................................... 27
3.8 Temperature experiment ............................................................................................ 28
3.9 Calculations ............................................................................................................... 28
4 Results ............................................................................................................................... 29
4.1 Separation of FAME isomers on HPTLC plates ....................................................... 29
4.2 Preparation of trans FAME standards on PLC .......................................................... 30

X
4.3 Preparation of trans FAME standards on HPTLC .................................................... 32
4.4 Separations of trans isomers on GC column using different temperature programs 34
4.5 Trans fatty acids formed during processing of fish oil .............................................. 38
4.5.1 VNT 1812 and STF 1812 ................................................................................... 38
4.5.2 BLF 1812 and DEO 1812 ................................................................................... 40
4.5.3 ETY 2412 ........................................................................................................... 42
4.5.4 DTL EE and DTR EE ......................................................................................... 44
4.5.5 DTD 3020 (R1) and DTD 3020 (R1D2) ............................................................ 46
4.6 Temperature experiments .......................................................................................... 48
5 Discussion ......................................................................................................................... 50
6 Conclusions and further work ........................................................................................... 59
7 References ......................................................................................................................... 61

1
1 Introduction In recent years, the importance for the general health of including sufficient long-chain
omega-3 fatty acids in the diet and balancing the ratio between omega-6 and omega-3 fatty
acids have received a lot of attention, both as subject for research and in the media. The term
omega in relation to fatty acids refers to the carbon atom in the hydrocarbon chain furthest
away from the carboxyl group. An omega-3 fatty acid has the last double bond inserted
between the third and the fourth carbon atom counted from the omega end and likewise, the
omega-6 fatty acid has the last double bond inserted between carbon six and seven from the
omega end.
For mammals, including humans, the fatty acids (FA) linoleic acid (LA; 18:2n-6) and α-
linolenic acid (ALA; 18:3n-3) are essential. Plants and phytoplankton are the only organisms
with the enzymes to synthesize double bonds at the omega-3 and omega-6 site of the fatty
acid, and are therefore the only ones who are able to synthesize LA and ALA. Every human
need these fatty acids to function optimally. Our main sources of ALA are currently soybean
oil, linseed oil and rapeseed oil (Gunstone 2012), while our main sources of LA are soybean
oil, corn oil and safflower oil (Schmitz & Ecker 2008). From the omega-6 fatty acid LA,
humans are able to synthesize arachidonic acid (ARA; 20:4n-6), and from the omega-3 fatty
acid ALA, humans are able to synthesize eicosapentaenoic acid (EPA; 20:5n-3),
docosapentaenoic acid (DPA; 22:5n-3) and docosahexaenoic acid (DHA; 22:6n-3). ARA,
EPA and DHA are long chain polyunsaturated fatty acids (LC-PUFA), which are precursors
of important signaling molecules (Calder 2009), and important for cell structure and function
(Sidhu 2003). Both LA and ALA use the same elongation and desaturation enzymes (Schmitz
& Ecker 2008), which presents a bottle neck to the production of ARA, EPA and DHA. If
omega-6 fatty acids make up a larger proportion of our diet than omega-3 fatty acids then
larger amounts of ARA will be produced than of EPA and DHA. In addition to the
competition for the enzymes, the synthesis of ARA, EPA and DHA in mammals is slow
compared to ingesting these fatty acids directly. A diet containing sufficient amounts these
long chain polyunsaturated fatty acids is therefore recommended (Jain et al. 2015).
The physiological effects and characteristics of omega-6 and omega-3 fatty acids are quite
different. The inflammatory activities of omega-6 derived signaling molecules are generally,
but not always, recognized as more potent than the ones derived from omega-3 (Calder 2009),
and it is therefore important with a balanced ratio between these two groups. Simopoulos
(2006) claims that human beings evolved on a diet with, roughly, equal amounts of omega-6

2
and omega-3, but during the last century the western diet has shifted towards a ratio of at least
15 to 1. This shift towards a diet rich in omega-6 fatty acids may have a negative effect on
several aspects of health, including diseases with an inflammatory component (Calder 2006).
An excellent way to even out the ratio between omega-6 and omega-3 fatty acids is to
consume fatty fish or take fish oil supplements. Consumption of seafood or marine oils rich in
omega-3 fatty acids may also help prevent heart disease and help patients recover after such
illnesses (Kris-Etherton et al. 2002; Salem et al. 2015). Kris-Etherton, Grieger and Etherton
(2009) mention recommendations made by several health authorities, and most of them agree
on two servings of fatty fish per week, equivalent to 250-500 mg of EPA + DHA per day, or
consuming the equivalent amount of fish oil supplements.
The annual production of fish oil is relatively small compared to major vegetable oils like
palm oil and soybean oil (1.1 versus 42.4, and 37.7 million metric tonnes, respectively, in
2007-2008) (Gunstone 2011). Out of this relatively modest production volume of fish oil,
75% is used for fish feed, 22% for human consumption (supplements and functional foods),
and 3% for other uses (Tocher 2015). The production of fish oils can be divided into two
steps; extraction of the oil from the fish or parts of it, and the refining of the fish oil. The
different refining processes have different goals, like removal of undesirable taste and odor,
removal of environmental pollutants, and change of fatty acid composition of the oil. Some of
these processing steps, although meant to improve the quality of the fish oil, may have a
detrimental side effects if used erroneously. Some of the processing steps apply a high
temperature to the oil, thereby inducing the transformation of cis-configured double bonds
into trans-configured double bonds.
Trans fatty acids have received a lot of attention since the 1990’s because of their
negative effect on health. Most of the attention has been devoted to the shorter, less
unsaturated fatty acids, which have been shown to cause heart disease (Oomen et al. 2001),
metabolic disease (Menaa et al. 2013) and inflammation diseases (Lopez-Garcia et al. 2005).
A few studies (e.g Chardigny et al. 1995) have focused on trans isomers of EPA and DHA
and found that they have different functions from their cis isomers. This is to be expected
because the characteristics of trans and cis isomers are very different. It is therefore important
to be able to analyze how much trans isomerization occurs under the processing of fish oils,
and the trans content of the final product.
While there are official methods for quantification of trans isomers in milk fat and
vegetable oils, there is no official method for the analysis of trans isomers in fish oil (Mjøs &
Haugsgjerd 2011). The composition of fatty acids in fish oils is quite different from the

3
composition in milk fat and vegetable oils, as the former contains more of the longer and
more unsaturated fatty acids than the latter two. This makes it difficult to apply exactly the
same methods for analysis of the fatty acid composition. From 16 January 2014 the
governmental health regulations in Norway states that no more than 2 g trans fatty acids per
100 g fat is allowed (Helse- og omsorgsdepartementet 2014).
The primary objective of this master thesis was to investigate whether trans isomers of
EPA and DHA fatty acids were formed during normal processing conditions at the fish oil
refining company Nordic Pharma Inc. The second objective was to establish a method for the
analysis of trans fatty acids in fish oil. The third objective was to explore how temperature
and time affected the formation of trans isomers of EPA and DHA.

4
2 Background
2.1 Fatty acids
2.1.1 The structure of fatty acids
Fatty acids are hydrocarbon chains with one methyl (-CH3) end and one carboxyl (-COOH)
end. They are often esterified to other molecules, forming for example triacylglycerols or
phospholipids, depending on where they occur and what function they serve. A
triacylglycerol has three fatty acids esterified to a glycerol molecule, whilst a phospholipid
has two fatty acids esterified to a glycerol molecule, with a phosphate group attached to the
third glycerol hydroxyl group.
The hydrocarbon chain of the fatty acids may contain no double bonds (saturated fatty
acids) or they may contain one or more double bonds (unsaturated fatty acids). Fatty acids
with two or more double bonds are called PUFA (polyunsaturated fatty acids). In nature the
double bonds usually have a cis (Z) configuration, which means that the hydrogen atoms are
found on the same side of the planar double bond (figure 1). The alternative are the trans (E)
configuration, where the hydrogen atoms are found on the opposite sides of the planar double
bond (figure 1). Most of the naturally occurring trans fatty acids are found in ruminants and
are formed by bacteria in the rumen via biohydrogenation, whereas most of the trans fatty
acids formed industrially comes from partially hydrogenated fats and oils. Carbon atoms with
double bonds cannot rotate freely, so a spontaneous switch between the two isomers is not
possible. However a shift will occur if enough energy is applied, for instance by heating the
oil to a certain temperature. A cis double bond will turn into a trans double bond if the oil is
heated to a high temperature since the trans double bond is energetically more favorable due
to less steric strain.
Figure 1. The difference between a cis and a trans double bond. The straight lines are the bonds, C = carbon, H =
hydrogen, and R = the hydrocarbon chain.

5
The double bonds affect the structure of the fatty acids. A cis double bond will give
the hydrocarbon chain a bend, while a trans double bond will not. This bending of the
structure has implications for the melting point of the fatty acids, because the trans fatty acids
can pack more tightly together so they crystallize more easily. Generally, the longer the
carbon chain in the fatty acid, the higher the melting point, but an unsaturated fatty acid will
have a lower melting point than its saturated counterpart. For fatty acids with the same chain
length, cis unsaturated fatty acids have the lowest and saturated fatty acids the highest melting
point. In between these two, but closer to the saturated fatty acid lay the trans unsaturated
fatty acids melting points.
There are several ways to name fatty acids. Sometimes the trivial name is used, e.g.
eicosapentaenoic acid (EPA) and sometimes the number of carbons and double bonds, e.g.
C20:5n-3, is used. This nomenclature tells us that there are 20 carbon atoms in the chain, with
five double bonds where the last double bond occurs at the omega-3 site. Another way of
naming fatty acids is by the IUPAC system, (5Z, 8Z, 11Z, 14Z, 17Z)-5,8,11,14,17-
eicosapentaenoic acid. The first two mentioned will be the ones used in this thesis. When
referring to trans isomers the number of trans double bonds will be indicated before the
trivial name, e.g. mono-trans EPA, which implies one trans double bond. The IUPAC name
could have been used, e.g. (5Z, 8Z, 11Z, 14Z, 17E)-5,8,11,14,17-eicosapentaenoic acid which
specifies EPA with a trans double bond at the omega-3 site of the hydrocarbon chain.
2.1.2 The roles of fatty acids in the body
Fats and oils are a good source of energy in the cell respiration, and have a higher energy
yield per carbon atom than carbohydrates (Campbell & Farrell 2008). But energy generation
is not the only function of the fatty acids; they also have important structural and
physiological functions. Particularly important fatty acids are the essential linoleic acid (LA)
and α-linolenic acid (ALA). Only plants and phytoplankton are able to synthesize them,
because they are the only organisms with the enzymes delta-12- and delta-15-desaturase,
which insert double bonds at the omega-6 and omega-3 sites in the C18 fatty acid chain
(Napier & Sayanova 2005). An overview of the synthesis can be seen in the figure 2.

6
Figure 2. An overview of the enzymatic pathway for the insertion of double bonds at the omega-6 and omega-3 sites of
the fatty acid hydrocarbon chain in all plants, and the ability of phytoplankton to produce the longer and more
unsaturated fatty acids EPA and DHA. Delta-12- and delta-15-desaturase insert double bonds at the omega-6 and
omega-3 carbons, respectively, of the 18 carbon fatty acid.
When mammals ingest LA and ALA they can synthesize longer and more unsaturated
fatty acids. This is done through a series of enzymes, known as desaturases and elongases
(figure 3). LA or ALA are ingested and stored before being metabolized in cells. First the
delta-6-desaturase inserts an extra double bond into the fatty acids, and then the chain is
elongated to a 20-carbon chain. After the elongation, a new double bond is introduced into the
carbon chain via delta-5-desaturase. At this point, LA and ALA have been turned into ARA
and EPA, respectively. Through further elongation, via two steps involving elongases, the
carbon chain now consists of 24 carbons. At this point, delta-6-desaturase introduces yet
another double bond before a β-oxidation cycle removes two carbon atoms from the chain and
DPA (n-6) and DHA are produced. The process of synthesizing ARA, EPA and DHA in

7
mammals is slow compared to marine algae. There is a competition between omega-3 and
omega-6 fatty acids for the enzymes involved (Calder 2014), and therefore it is recommended
that humans get supplementary EPA and DHA from their food.
Figure 3. The enzymatic pathway of synthesizing LC-PUFA from LA and ALA. ELOVL = elongation of very long
chain fatty acid enzyme (modified from Schmitz and Ecker (2008)).
2.1.2.1 Signaling molecules
Several diseases have an inflammatory component, and it is important that the body is capable
of properly regulating and adjusting the inflammatory responses to maintain homeostasis
(Calder 2009). LC-PUFAS are the precursors of many substances involved in inflammation
processes. One of these lipid derived substances is the group of eicosanoids, consisting of
prostaglandins, thromboxanes and leukotrienes (Wall et al. 2010). Eicosanoids are
synthesized from 20-carbon PUFA, usually ARA and EPA (figure 4). The synthesis involves

8
cyclooxygenase and lipoxygenase enzymes. This is yet another example where n-3 and n-6
fatty acids compete for the same enzymes. Eicosanoids derived from ARA are usually more
potent than the ones derived from EPA, and often the EPA-derived eicosanoids are referred to
as anti-inflammatory (Calder 2012). This effect might be ascribed to the competition for
enzymes. The more EPA that is present the less cyclooxygenase will be available for ARA
and hence, there will be milder inflammatory reactions. Other groups of molecules involved
in inflammation are resolvins, protectins (figure 4), lipoxins and maresins, which are also
synthesized from LC-PUFAs. These substances have anti-inflammatory functions, as well as
being tissue protective and resolution stimulating (Bannenberg & Serhan 2010).
Figure 4. The synthesis of eicosanoids, resolvins and protectin via cyclooxygenase (COX) and lipoxygenase (LOX)
from EPA and DHA, with and without aspirin present (Calder 2009).
Peroxisome proliferator activated receptors (PPARs) are closely connected to lipids,
and play a part in regulating inflammatory responses. The PPARs can interpret fatty acid
signals from dietary lipids, pathogenic lipoproteins and essential fatty acid metabolites, and
respond accordingly (Varga et al. 2011).
2.1.2.2 Structural fatty acids
DHA is an important fatty acid in the cell structures of the brain, retina, and spermatozoa
because of its physiochemical properties. For proper development of organs such as the brain
and eyes, one needs adequate amounts of omega-3 fatty acids from the diet, or else DHA will
be replaced by the omega-6 fatty acid docosapentaenoic acid (DPA) (Connor et al. 1992).
Studies on the effect of omega-3 deficiency in rhesus monkeys have shown that low levels of
DHA leads to reduced function of the eyes (Neuringer et al. 1986). The reason for this might
come from DHA being more flexible than DPA, which may affect membrane proteins such as
rhodopsin (Eldho et al. 2003). Rhodopsin is a G-protein coupled receptor (GPCR) in the
retina, which is light sensitive. Feller & Gawricsh (2005) found that flexibility and
adaptability in the lipid bilayer of the cell favored the activation of GPCR rhodopsin. The
flexibility and adaptability is enhanced when DHA is present. It seems that omega-3

9
deficiency is most harmful for the development of eyes and brain for fetuses and infants,
because the nervous system is good at retaining DHA (Salem et al. 2001).
2.1.2.3 Trans fatty acids
As mentioned, trans fatty acids are unsaturated fatty acids with one or more double bonds
having a trans configuration. The trans configuration is energetically favored compared to
cis, because of steric strain. The larger carbon chains come very close to each other in the cis
configuration while in the trans configuration, they are further apart (McMurry 2008). In
nature, the double bond of fatty acids are synthesized as cis. The double bond cannot freely
switch between cis and trans, but if enough energy is applied (e.g. high temperature) the fatty
acid can be converted to its more energetically stable trans isomer. The activation energy for
this reaction can be reduced in the presence of a strong acid (McMurry 2008). In thermal
isomerization, there is mostly a switch between cis and trans as the double bond does not
change its position (Sciotto & Mjøs 2012). This means that EPA, that has five double bonds,
can have 25 or 32 different isomers after thermal isomerization.
Most of the research on the health impacts of trans fatty acids has focused on the
mono- and polyunsaturated isomers of 16 and 18 carbon chain fatty acids. They have been
found to increase the risk of heart disease (Oomen et al. 2001, Laake et al. 2012). Intake of
trans fat increases the plasma activity of cholesteryl transfer protein, the enzyme that transfers
HDL cholesterol to LDL and VLDL cholesterol, and so, the ratio of LDL to HDL cholesterol
in blood serum gets higher. This is a predictor of coronary heart disease (CHD) risk
(Mozaffarian et al. 2006). Almendingen et al. (1995) compared partially hydrogenated fish
oil (PHFO) to partially hydrogenated soy bean oil (PHSO) and butter and saw how these
affected the serum lipoproteins and Lp[a]. This study reported that PHFO had the worst effect
of all three on cholesterol levels, and the authors suggested that this effect might come from
the LC-PUFA trans isomers, but could not conclude on this. Laake et al (2013) found that
trans fatty acids from PHFO increased the risk of cancer, whereas trans fatty acids from
partially hydrogenated vegetable oil did not. This article hypothesized that trans isomers of
EPA and DHA were the cause of increased risk of cancer because of metabolic effects caused
by their chemical structure, and that modified eicosanoids might be produced from these
isomers. It has also been found that trans fatty acids might have a negative effect on
endothelial function and inflammation. Lopez-Garcia et al. (2005) found higher levels of
biomarkers related to inflammation and endothelial dysfunction in people with diets
containing higher levels of trans fatty acids.

10
Trans isomers of fatty acids may also be recognized as other fatty acids with fewer
double bonds. EPA with a trans double bond at the omega-3 site might for example be
recognized as ARA. In an experiment focusing on the effects of mono-trans isomers of EPA
on bovine endothelial cells, Loi et al. (2000) found that they were incorporated into cells and
were metabolized by cyclooxygenase, like ARA and EPA, thus inhibiting the synthesis of
prostacyclin. This inhibition could come from the isomers of EPA competing for the
cyclooxygenase pathway and/or that incorporation of these isomers resulted in less ARA
being available.
DHA is, as previously explained, important for the development and functionality of the
central nervous system and the eyes. It has been found that the eyes of rats fed trans isomers
of ALA are susceptible to trans isomers of DHA (Acar et al. 2006). The incorporation of
these isomers into the eyes reduces the eyes’ functionality.

11
2.2 Industrial Processing and Refining of Fish Oil
The fish meant for fish oil production is first caught and stored aboard fishing boats, then
cooked and pressed. This results in crude fish oil which can be used for example, for fish
feed. For crude fish oil to be suitable for human consumption the crude fish oil has to undergo
several processing steps. Many different products of fish oil are available on the market; the
natural types such as cod liver oil and Anchoveta oil, or concentrates having various
compositions of EPA and DHA. Fish oils often contain numbers in their names, like “1812”
or “3020”, these names refer to the fraction of EPA and DHA in the fish oil. The “1812” oil
contains 18% EPA and 12% DHA, likewise the “3020” contains 30% EPA and 20% DHA.
The different processing steps (figure 5) are applied to both concentrates of fish oil (red
arrows) and 1812 fish oils which have the fatty acid composition common to fish caught
outside South America (blue arrows). The processing is done to enhance the quality and
edibility of the oil. In this section, the most common processing steps will be described, with
emphasis on the steps that may involve the formation of trans isomers of EPA and DHA.
Neutralization and washing involves heating the oil to 80-90 °C and mixing it with
caustic soda, before adding hot water. This removes free fatty acids (FFA), reduces the
content of phospholipids, pigments, trace metals, and water soluble components like free
amino acids, oxidation products, trace metals, and soap residuals (VKM 2011).
Winterization removes components with high melting points, e.g. waxes and the
stearin fraction. By reducing the temperature to 0-2 °C these high melting point components
crystallize and settle, so they can be filtered from the oil (VKM 2011). Samples from the
olein fraction after the winterization process are named VNT 1812 in this thesis.
The bleaching process utilizes the adsorptive properties of activated carbon, bleaching
earth, and silica to remove pigments (De Greyt 2012), reduce the amount of FFA, oxidation
products (García-Moreno 2013), trace metals (Bimbo 2012), and environmental pollutants
(Usydus et al. 2009, Ortiz et al. 2011). Activated carbon and bleaching earth are added to the
oil and the mixture is heated (VKM 2011). The negative consequences of bleaching is the
removal of the antioxidants that are naturally present in the fish oil, but bleaching improves
the oxidative stability of the oil, and antioxidants can be added to the oil in later processing
steps, such as final refining and formulation. Samples from the bleaching process are named
BLF 1812 in this thesis.

12
Figure 5. Flowchart showing the processing of fish oils. The black arrow shows processes that are necessary for all the
different products. The red arrow shows the processing pathway for concentrates. The blue arrow shows processing
pathway for “natural” oils. 1812 implies 18% EPA and 12% DHA, while 3020 implies 30% EPA and 20% DHA.
Deodorization combines high temperature, low pressure and steam to remove volatiles
from the oil by continually removing the gas phase. These volatiles include FFA and
oxidation products (Crexi et al. 2009). The temperature range is between 150-250 °C, which
are quite high temperatures. Fournier et al. (2006 B) found that trans isomers of EPA and
DHA were formed at temperatures above 180 °C, at first only mono-trans, but at higher
temperatures (220, 250 °C), di- and tri-trans fatty acids were formed, as well (Fournier et al.
2006 A). Fournier et al. (2006 A) also found that EPA and DHA were isomerized to a much
higher degree than LA and ALA when they compared their results with other studies. Mjøs &
Solvang (2006) found that the fatty acids were more isomerized by increasing number of
double bonds, giving DHA>EPA>ALA>LA in fractions of trans isomers formed. Samples
from the deodorization process are named DEO 1812 in this thesis.

13
Short path distillation (SPD) can be used for a number of different tasks, e.g. removal
of persistent organic pollutants (POPs) (Olli et al. 2013), removal of other volatile
compounds, such as aldehydes, ketones, etc. (VKM 2011), and for concentration of EPA and
DHA. In the fish oil industry the SPD unit consists of two columns, their functions will be
described in the following paragraphs. Samples from the SPD stripping process are named
STF 1812, and samples from the SPD concentration process are named distillate light fraction
(DTL), distillate residual fraction (DTR) and distillate-distillate fraction (DTD).
For purification purposes (removal of POPs and other unwanted volatile compounds)
the bleached fish oil is run through one SPD-column. In the column the fish oil is heated
under vacuum (>0.001 mbar). The impurities will evaporate from the BLF and condense on
the colder inner surface of the column. The high temperature applied in this process may
remove desired compounds such as anti-oxidants and induce isomerization of PUFAs
(Oterhals & Berntsen 2010). The two fractions, condensate and residue, are collected for
further treatment/processing. The product (STF) is the residue fraction.
For concentrating purposes, the SPD unit has to be able to separate EPA and DHA
from other fatty acids present in the oil, so TAGs must be esterified to fatty acid ethyl esters
(FAEE). By mixing TAG with ethanol and the catalyst sodium ethylate, glycerol, FAEE,
some DAG (< 6%) and MAG (< 4%) are formed (VKM 2011). Samples taken after the
ethylation process are named ETY2412 (24% EPA and 12% DHA). The shorter FAEEs and
the heavier DAGs and MAGs have different boiling points from EPA and DHA. Hence by
adjusting temperatures, vacuum and flow in and through the two SPD columns in series the
desired proportions of EPA and DHA will be obtained by removal of the volatile fraction in
the first column and the heavy fraction in the second column.
After the concentration process, the FAEE might be re-esterified to TAG. This is done
in part because TAG is considered more natural (VKM 2011) and because the oxidative
stability of the fatty acids in TAG is better than in the form of FAEE. To re-esterify the fatty
acids to TAG one mixes FAEE with glycerol in the presence of a catalyst or an enzyme. The
outcome is mostly TAG, but also some DAG, MAG and FAEE.

14
2.3 Analysis of fatty acids
There are several ways to analyze fatty acids, depending on the purpose of the investigation.
In this section two of the most common methods for analysis of fatty acid isomers will be
described.
2.3.1 Chromatography
Both methods applied in this study are chromatographic methods. Chromatography is a
separation method. Common to all chromatographic systems are the mobile and stationary
phase. Analytes can be separated due to differences in the solubility or affinity to either the
stationary or mobile phase. For example two components, X and Y, are present in a sample, X
has a high and the Y has little affinity to the stationary phase, they are both soluble in the
mobile phase. In this sample X will be retained more strongly than Y, and so Y will move
further than X in a given time. In thin layer chromatography (TLC), this difference is referred
to as the retention factor. In for example gas chromatography (GC), the difference in speed of
travel for the components is referred to as retention time.
2.3.2 Silver ion chromatography
L.J. Morris (1966) published a review on the analysis of lipids using silver ion
chromatography, where he discussed the history, mechanisms, and the uses. The method of
separating lipids with silver ion chromatography was developed in the early 1960’s, and
rapidly became a popular field of research. The use of transition metals for separating lipids
by number, type, and position of double bonds was an excellent tool for scientist in the field
of lipids. Among the transition metals, silver has some major advantages. It is relatively
inexpensive compared to e.g. gold, and compared to the other, less expensive, transition
metals such as copper it is more stable (AOCS 2011).
The Dewar concept is generally accepted as the explanation of the mechanisms
controlling the separation of unsaturated compounds (figure 7) (Morris 1966; Nikolova-
Damyanova 2009). A carbon-carbon double bond consists of two sp2-hybridized carbon
atoms (figure 6). In the sp2-hybridized carbon atom the 2s orbital combines with two of the
three available 2p orbitals, forming three hybrid sp2-orbitals and leaving one 2p orbital. The
three sp2 orbitals lie flat with an angle of 120 ° to each other, while the 2p orbital is situated at
a 90 ° angle to the plane. In the carbon-carbon double bond there is a strong sp2-sp
2 σ bond
and a weaker 2p-2p π bond. In an unsaturated fatty acid the remaining sp2 orbitals are bonded
to either hydrogen or carbon atoms. The σ bond is centered between the nuclei of the carbons,
while the π bond occupies the regions above and below the σ bond. In a single bond the

15
carbon atom is sp3 hybridized. The sp
2 hybridized carbon atom attracts electrons more
strongly than sp3 hybridized carbons, which means that surrounding sp
3-hybidized carbon
atoms gives a charge to the sp2 hybridized carbon atoms.
Figure 6. Two sp2 hybridized carbon atoms bound together through a σ-bond and a π-bond. It also shows the angle
between sp2 orbitals and p orbitals.
When unsaturated compounds bind with silver ions a σ-bond is formed by overlap of
the filled π orbital of the carbon-carbon double bond with the free s orbital of the silver ion,
and a π bond formed by overlap of the vacant antibonding π orbital of the carbon-carbon
double bond with the filled d orbitals of the silver (figure 7). The bonding is reversible, and
will be affected by the availability of electrons in the filled orbitals and the ease of overlap
between these orbitals. This is determined by steric factors, and therefore one can separate
different compounds by number, position, and type of the double bonds (Morris 1966).
Figure 7. The Dewar concept. Figure is taken from Morris (1966).

16
As mentioned, the availability of electrons is important to the binding between silver
ions and carbon-carbon double bonds. In cis double bonds, the electrons are more available
than in the trans double bonds because of steric factors (larger carbon chains hiding the
electrons in the trans configuration), causing cis isomers of one compound to be more
strongly retained than its trans isomer (Nikolova-Damyanova 2009). The position of the
double bond plays an important role as well; Gunstone et al. (1967) proved that fatty acids of
the same length and same unsaturation but with the double bond at different positions had
different retention factors. This showed that the fatty acid interacted with two different
components of the stationary phase; the silver ions form a complex with the carbon-carbon
double bond, while the silica particles of the stationary phase forms a complex with the
oxygen in the ester bond of the fatty acid methyl ester. For both complexes to form there must
be a certain distance between the double bond and the ester, i.e. if the double bond is placed
too close to the ester bond the component will elute faster than if it is placed a bit further
away. A double bond placed at carbon number six from the ester group is retained most
strongly (Gunstone et al. 1967). The mobile phase should also be considered, as it will
increase or decrease the retention time of the analyte in the chromatographic system
according to its polarity. The most common mobile phases usually consist of a mixture
between two of the following components; toluene, methanol, chloroform, diethyl ether and
others. Silver ion chromatography for separation of unsaturated fatty acids should be
performed at low temperatures, because the stability of the silver ion-double bond complex
increases with decreasing temperature, and a temperature of about -20 ° C was found to be the
best (Morris et al. 1967).
Chromatography with silver ions in the stationary phase can be performed using TLC or
HPLC. It is not suitable for GC because of the low temperatures needed. Silver ion HPLC has
a couple of drawbacks as well. Firstly the column is rapidly deteriorating and therefore the
retention time of the analytes will change over time making it difficult to automate this
method (Fournier et al. 2006 A). Secondly an HPLC system is quite expensive compared to
the much cheaper TLC plates. Pre-impregnated TLC plates can be bought, but can just as
easily be made in the laboratory.
2.3.3 Gas chromatography
The gas chromatography (GC) system can be used to analyze substances that are volatile or
can be made volatile by heating. A schematic overview of a GC system is shown in figure 8.
As with other chromatographic systems there is a mobile and a stationary phase that is used to

17
separate the analytes. The mobile phase in the GC is a gas, called the carrier gas. This gas
must be inert. The gas is delivered from a high pressure cylinder and passes through a
reduction valve that reduces the pressure before it enters the GC instrument where the flow
and temperature are regulated to make sure that a constant inlet pressure is maintained. The
gas goes via an injector that is either a split/splitless injector or a “cool on column” injector.
Split/splitless injectors are the most common and makes it possible to decide whether one
wants the whole sample to be injected onto the column or just a small fraction of it. These
injectors are heated so the sample turns into gas immediately after it is injected. From the
injector, the sample moves into the column, which is a long tube made of fused silica or
metal, where the inside wall is lined with a stationary phase. There are lots of different
stationary phases that can be used, and they can be non-volatile liquids or solids. The solid
stationary phases are made from polymers and the analytes are separated by differences in
adsorption to the surface of the polymer or by sieving through pores in the polymer. Non-
volatile organic liquids are the most popular stationary phases; here the analytes are separated
by differences in distribution between the gas phase and the stationary liquid phase. The
column is placed in an oven with a fan; this provides good circulation and an even
distribution of the heat. The detector, which is situated at the end of the column, often is a
flame ionization detector (FID). The temperature of the detector is often a bit higher than the
temperature in the oven to make sure analytes do not condense in the detector. In the FID,
there is a flame tip and a constant stream of hydrogen, air and a make-up gas. When the
analyte enters the FID it reacts with the flame and the hydrogen and ions are formed, the
electrical tension is measured and a signal is sent to a computer.
Figure 8 Schematic overview of the GC system. Picture taken from http://www.chromatographer.com/gas-
chromatography/ (11/03/2015)

18
The main parameters deciding the retention time of the analytes are:
1. Temperature is the most important parameter. The analytes can only move forward in
the column when they are in their gas phase. An increase in temperature increases the
volatility of the substances. A higher temperature drives the distribution towards the
gas phase instead of the stationary phase, and the retention time is reduced. The
temperatures in the GC can be regulated, and one has the choice of an isothermal run
or temperature programming. In an isothermal run, the temperature is kept constant
from start to finish. This works very well when the analytes in the sample are similar
to each other in size and volatility, but can produce broad peaks when some analytes
in the sample are much less volatile than the others. A temperature program is often
used, and the temperature is increased throughout the GC run, producing peaks with
better shapes when there are big differences between the volatility of the substances.
2. Type and amount of stationary phase is important for the retention time of analytes,
because different analytes have different solubility in different stationary phases. The
stationary phase is made from temperature stable liquids with very low vapor pressure.
The basis of the stationary phase is often polysiloxanes or polyethylene glycols with
various functional groups attached, depending on the desired characteristics. The
solubility of the analytes in the stationary phase is dependent on these characteristics.
A polar substance will for example be more soluble in a polar stationary phase than in
an apolar stationary phase, due to intermolecular interactions. One should not operate
the GC outside the maximum or minimum temperatures of the column. The first case
will lead to the destruction of the stationary phase and the latter case will lead to the
stationary phase becoming more viscous and the analytes will travel too slowly
through the column, leading to broad peaks. Alternative columns for the analysis of
trans fatty acids will be discussed in detail later.
3. Column dimensions are also very important. Columns can be either capillary or
packed. Nowadays, the capillary columns are most widely used. They are most often
made of fused silica which is inactive and very robust. The inner diameter ranges from
20 to 500 µm. The stationary phase sits as a thin film on the inside wall of column,
and the thickness of this film is 0.05-10.0 µm. Analytes are retained more strongly in
thick films than in thin films. Capillary columns are very effective in separating
analytes, and the longer the column the better the separation. However, a column with
twice the length does not have twice as good separations. One must decide whether

19
increasing column length is worthwhile because the analysis time increases with
increasing column length.
4. Type and speed of carrier gas affects the separation of the analytes. The carrier gas
must not react with the analytes in the sample or the stationary phase. Nitrogen,
helium and hydrogen can all be used, and they have different uses because of different
optimum velocities. If the speed of the gas is too low or too high the peaks in the
chromatogram will become broader. Nitrogen is mostly used in packed columns
because the optimum velocity for this gas is very low compared to the other gases
(figure 9). Both helium and hydrogen works well at high velocities, and has broad
ranges of optimum velocities. Hydrogen is best at the highest speeds, but helium is
used more often for safety reasons.
Figure 9. van Deemter plot for nitrogen, helium, and hydrogen. The Y-axis show the height equivalent to a theoretical
plate (mm) and the X-axis has the average velocity of the gas (cm/sec). A lowest possible height equivalent per
theoretical plate (HEPT) is desired to obtain the best separation between the analytes.
Several different columns have been used for the analysis of trans fatty acids in fish oil.
The results have been variable considering the separations of isomers of EPA and DHA. The
current method, recommended by AOCS, for determination of trans isomers in fats and oils
from non-ruminant sources (AOCS Ce 1h-05), recommends using the highly polar BPX-70,
CP-Sil88, or SP-2560 columns. Ratnayake et al. (2006) evaluated this method and found that,
under the right chromatographic conditions, the CP-Sil88 and SP-2560 could separate the
different isomers of the 18:1, 18:2, and 18:3 fatty acids. This means that this method is
suitable for analysis of trans-isomers in vegetable oils and fats. However this evaluation did

20
not study the longer, more unsaturated fatty acids that are present in fats and oils of marine
origin. According to Mjøs & Solvang (2006), the longer and more unsaturated fatty acids are
isomerized much faster than the shorter ones, so in oils of marine origin, one would expect to
find more trans-isomers of EPA and DHA than trans-isomers of LA and ALA. Therefore, the
columns must also be able to separate the peaks of the different EPA and DHA isomers. By
using a 60 m BPX-70 column, Sciotto & Mjøs (2012) found that the mono-trans isomers of
EPA eluted as three peaks, where one of the peaks co-eluted with a different fatty acid, the
mono-trans isomers of DHA eluted as five peaks with no overlap with other fatty acids.
Fournier et al. (2006 A) used a 100 m CP-Sil88 column for determination of trans-fatty acids
in deodorized fish oil and were able to obtain four peaks for the mono-trans isomers of EPA
and five for DHA, but one of the trans EPA peaks overlapped with the all-cis EPA peak. The
authors concluded that a better stationary phase for analyzing trans isomers in fish oil was
needed.
The SLB-IL111 column from Supelco (Bellefonte, PA, USA) is the most polar column
commercially available (Ragonese et al. 2012), and it is therefore of interest for the analysis
of trans fatty acids. An ionic liquid (IL) is defined as salts that are liquids below an arbitrary
temperature (Weber & Anderson 2014). One of the advantages of IL stationary phases is their
low volatility and high thermal stability (Twu et al. 2011), and this allows for separation of
compounds that require a high temperature to evaporate. ILs also have a high peak capacity so
that complex samples can be analyzed with little or no overlap between peaks (Ho et al.
2013). The mechanisms of interactions between analyte and the stationary phase that are most
important in the SLB-IL columns have been thoroughly studied, using both
Rohrschneider/McReynolds constants and Abrahams solvation parameter model. There are a
couple of different IL columns available, and Weber & Andersson (2014) found that a
significant difference between these columns is the hydrogen-bond acidity. This study also
reported that the most important factor for separations in these columns is the hydrogen-bond
basicity. Another interesting thing is the ability of ILs to separate non-polar molecules,
meaning that ILs can act as relatively non-polar stationary phases when the analytes are non-
polar (Anderson et al. 2002). The structure of the stationary phase in SLB-IL111 (1,5-Di(2,3-
dimethylimidazolium)pentane bis(trifluoromethylsull)imide) can be seen in figure 10. SLB-
IL111 is the column utilized in the present study. The imidazolium in the stationary phase
increases the interaction with polar compounds, such as π-electrons in double bonds (Zeng et
al. 2013) which makes it possible to separate cis and trans isomers of fatty acids. The SLB-

21
IL111 column also show dipole-dipole and dipole induced dipole interactions, along with
cavity formation and dispersion interactions (Zeng et al. 2013).
Figure 10. The structure of the stationary phase in the SLB-IL111 column (1,5-di(2,3-methyl imidazolium)pentane
bis(trifluoromethylsulfonyl)imide). From: https://www.sigmaaldrich.com/content/dam/sigma-
aldrich/docs/Supelco/Posters/1/ISCC_2013-Ionic-Liquid-GC.pdf
A couple of studies on separations of trans fatty acids have been performed utilizing this
column, with promising results. Delmonte et al. (2012) managed to separate the trans isomers
usually found in milk fat using a 200 meter SLB-IL111 column, and Fardin-Kia et al. (2013)
managed to separate 125 FAMEs from menhaden oil using the same GC conditions. By
applying the same conditions yet again, Srigley & Rader (2014) were able to separate five
peaks of mono-trans EPA and four peaks for mono-trans DHA, where one of the DHA-
isomer peaks co-eluted with another fatty acid. The GC conditions applied in these studies
were optimized for milk fat, and could perhaps be improved.

22
3 Materials and methods
3.1 Chemicals, standards and equipment
Table 1 list of chemicals, standards and equipment. SRM 3275, GLC 68D and supelco 37 collectively contained C14:0,
C15:0, C14:1, C16:0, C17:0, C16:1n-7, C18:0, C17:1n-11, C18:1n-9t, C18:1n-9c, C18:1n-7, C18:2n-6t, C18:2n-6c,
C20:0, C20:1n-11, C20:1n-9, C21:0, C18:3n-6, C18:3n-3, C22:0, C20:2n-6, C22:1n-9, C20:3n-6, C20:3n-3, C20:4n-6,
C24:0, C22:2, C24:1, C20:5n-3, C22:5n-3, C22:6n-3.
Chemicals Quality Supplier
1,4-dioxane 99,8% Sigma-Aldrich (St. Louis, MO, USA)
2’,7’-dichlorofluorescein
solution
<10% in
isopropanol
Sigma-Aldrich (St. Louis, MO, USA)
Acetonitrile ≥ 99.9% Sigma-Aldrich (St. Louis, MO, USA)
BHT Sigma-Aldrich (St. Louis, MO, USA)
Copper(II)sulfate-
pentahydrate
Merck (Darmstadt, Germany)
Diethyl ether ≥ 99.8% Sigma-Aldrich (St. Louis, MO, USA)
Hexane ≥ 99% Sigma-Aldrich (St. Louis, MO, USA)
Hydrochloric acid ≥ 37% Sigma-Aldrich (St. Louis, MO, USA)
Isooctane ≥ 99% Merck (Darmstadt, Germany)
Methanol ≥ 99.8% Sigma-Aldrich (St. Louis, MO, USA)
Na2SO4 VWR Chemicals (Leuven, Belgium)
Phosphoric acid ≥ 85% Sigma-Aldrich (St. Louis, MO, USA)
Silver nitrate VWR Chemicals (Leuven, Belgium)
Sodium p-toluenesulfinate 95% Sigma-Aldrich (St. Louis, MO, USA)
Sodium methylate 30% in
methanol
Merck (Darmstadt, Germany)
Toluene (anhydrous) 99.8% Sigma-Aldrich (St. Louis, MO, USA)
Standards Quantity Supplier
FAME EPA 1 g Nu chek prep (Elysian, MN, USA)
FAME DHA 1 g Nu chek prep (Elysian, MN, USA)
FAME C23:0 1 g Nu chek prep (Elysian, MN, USA)
SRM 3275 (FAME standard) 7.2 ml National institute of standards and
technology (NIST)
GLC 68D (FAME standards) Nu chek prep (Elysian, MN, USA)
Supelco 37 (FAME
standards)
Sigma-Aldrich (Bellefonte, PA, USA)
Plate Size Supplier
HPTLC Silica gel 60 10 x 10 cm Merck (Darmstadt, Germany)
PLC Silica gel 60 (0.5 mm
thick)
20 x 20 cm Merck (Darmstadt, Germany)

23
3.2 Isomerization of EPA and DHA standards
The method for isomerization of EPA and DHA was taken from Snyder and Scholfield
(1982), with minor modifications. In this method, p-toluenesulfinic acid (PTSA) was used as
a catalyst for isomerization of the fatty acids.
Firstly, the sodium p-toluenesulfinate had to be acidified to p-toluenesulfinic acid, as
described by Delmonte et al. (2008).
3.2.1 Acidification of sodium p-toluenesulfinate
Deionized water (30 mL), 2 mL 37% HCl, 30 mL diethyl ether and 1 g of sodium p-
toluenesulfinate were added to a 100 mL separatory funnel. The contents were then mixed
until the sodium p-toluenesulfinate was fully dissolved and the organic phase appeared clear.
The aqueous phase was then discarded. 30 mL of deionized water and 1 mL of 37% HCl was
once again added to the organic phase and mixed, and the aqueous phase was again discarded.
The organic phase was then transferred to a round bottom flask, and the contents were dried
under vacuum using a rotary evaporator (IKA, Staufern im Breisgau, Germany). After the
liquid had been evaporated 125 mg of the PTSA was dissolved in 25 mL of 1,4-dioxane (5
mg/ml), and stored in a dark flask (Mjøs 2005).
3.2.2 Isomerization
Approximately 5 mg of all-cis EPA or all-cis DHA FAME were dissolved in 1 ml dioxane
with 5 mg of p-toluenesulfinic acid in a test tube. The contents were then heated for 60
minutes (Mjøs 2005) or 120 minutes at 60 °C. After the heat treatment, the reaction was
stopped by adding 1 ml of 1 M NaOH. The oil was extracted with 1 ml hexane. The organic
phase was transferred to a dark vial, flushed with nitrogen and stored in a freezer at -30 ° C.
3.3 Silver ion TLC
The methods applied in this section are partly taken from the AOCS web sites and partly from
Fournier et al. (2006 A).
3.3.1 Preparation of TLC plates
Plates were impregnated with AgNO3 by immersing them in an AgNO3 solution (10%, w/v in
acetonitrile) for 30 minutes in a glass container (Fournier et al. 2006 A). Afterwards the plates
were dried, put in plastic bags and kept in the dark at room temperature.

24
3.3.2 Applying sample to TLC plate
For the 10 x 10 cm HPTLC plate used as a test to see if the isomerization was successful, a
straight line was drawn about 1.5 cm above the bottom of the plate. Points where the samples
were to be applied was marked and numbered, and 5 µl of the sample was applied to the plate
using a micropipette.
HPTLC plates were also used for separation of the isomer standards. Here larger
samples were applied. The isomerized standards were dissolved in hexane (approximately 20
mg/ml). Six spots of 10 µl were applied to the plate, 5 µl at a time.
3.3.3 Developing the plates
Freshly prepared and well-mixed toluene/methanol (85:15, v/v) was used as mobile phase
(Srigley & Rader 2014, Fournier et al. 2006 A). The mobile phase was poured into the
developing tank before the plate with the samples was inserted. The sample application line
was above the level of the mobile phase. The atmosphere in the tank was not saturated with
mobile phase prior to developing the plate because avoiding saturation seems to give better
separations between the analytes (AOCS 2009)
The plates were developed at -25 °C. The HPTLC plates for testing the isomerization
reaction was developed for 1.5 hours, while the HPTLC plates for preparing the standards
were developed for 4 hours, to ensure appropriate separation between the different isomers.
3.3.4 Method testing
The 10 x 10 cm HPTLC plates were sprayed with a 10% copper sulfate in an 8% phosphoric
acid solution. Afterwards they were heated to 160 °C for approximately 30 minutes or until
brown spots appeared on the plate.
3.3.5 Sample recovery
The plates were sprayed with 2’,7’-dichlorofluorescein in isopropanol as a ready-to-use
solution. After being sprayed, the plate was viewed under UV light at 366 nm, and the
boundaries of the different cis- and trans-bands were marked with a scalpel and scraped off
onto filter paper, and then transferred to a test tube. In the test tube the fractions were
recovered by adding 5 mL of 1% NaCl in methanol:water 90:10 (v/v) solution, mixed
thoroughly, then extracted twice with 2 ml of hexane (Fournier et al. 2006 A). The latter step
was performed to remove silver ions and 2’,7’-dichlorofluorescein. After having cleaned up
the samples they were transferred to dark vials and placed in the freezer for later analysis.

25
3.4 Column installation and conditioning
The installation of the SLB-IL111 column (100 m length, 0.25 mm inner diameter and 0.2 µm
film thickness) (Supelco, Bellefonte, PA, USA) was performed according to the instruction
papers delivered with the column.
1. The GC system was first turned off.
2. About 1 cm of one end of the column was cut off using a ceramic glasscutter. The nut
and the ferrule were fitted onto the column and the column was cut so that it measured
3.7 cm from nut to column end.
3. The cut end was then attached to the split/splitless injector.
4. The other end of the column was cut off and the flow of the GC system was turned on.
The loose end was dipped in methanol to see if a constant stream of gas bubbles came
out.
5. After the flow had been checked, a nut and a ferrule was fitted onto the loose end and
cut, measuring 9.5 cm from nut to column end.
6. The column was then attached to the FID. All the nuts were then checked to see if they
were tightly enough fitted and a gas leak check was performed.
7. After the gas flow had been allowed to run through the column for 30 minutes the GC
oven was turned on. The temperature was gradually increased up to 220 °C, and kept
at that temperature for some hours before it was reduced to 170 °C. The conditioning
of very polar columns such as the SLB-IL111 takes a while, so bleeding and spikes
were observed after several days.
3.5 Optimization of temperature programs for analysis of trans fatty acids
The hexane was evaporated from the trans standards. Then 250 µl of isooctane with BHT
(0.15 g/liter) was added before the sample was transferred to GC-vials with inserts. For each
temperature program one sample of mono-trans EPA, di-trans EPA, mono-trans DHA, di-
trans DHA and GLC 68D was tested.
Table 2, 3, 4 and 5 shows the different temperature programs that were analyzed. In
temperature program 4 the flow was 1 ml/min, in the other three temperature programs it was
1.5 ml/min.

26
Table 2. Temperature program 1.
Rate (° C/min) Temp (° C) Time (min) Total time (min)
Initial 110 4 4
20 150 0 6
2 170 20 36
2 185 20 63,5
Table 3. Temperature program 2.
Rate (° C/min) Temp (° C) Time (min) Total time (min)
Initial 110 4 4
20 150 0 6
1 170 20 46
2 185 10 63,5
Table 4. Temperature program 3.
Rate (° C/min) Temp (° C) Time (min) Total time (min)
Initial 110 4 4
10 150 0 8
2 170 20 38
2 185 15 60,5
Table 5. Temperature program 4 with carrier gas flow 1.5 ml/min.
Rate (° C/min) Temp (° C) Time (min) Total time (min)
Initial 110 4 4
20 150 0 6
2 168 20 35
2 180 10 51
3.6 Fatty acid composition
The FAME standards SRM 3275, GLC 68D and Supelco 37 were used to identify the peaks
of the chromatogram.
3.6.1 Methylation
The methylation process was performed according to the in-house method at Nordic Pharma
Inc. (Tromsø, Norway):
1. Approximately 200 mg of oil was weighed into a test tube, and the exact weight noted.
2. 1.5 ml of toluene containing 11.24 mg of C23:0 (internal standard) was added to the
test tube, using a syringe.
3. 1.5 ml sodium methylate (3% in methanol) was added to the test tube, using a pipette,
and the contents were mixed thoroughly.
4. Test tubes were then placed in a water bath at 60 °C.

27
5. After ten minutes the test tubes were removed from the water bath and cooled down to
approximately 40 °C in room temperature before 5 ml of isooctane with BHT
(butylated hydroxytoluene) (0.15 g/liter) and 3 ml of distilled water was added. The
contents were then shaken vigorously again.
6. After the aqueous and the organic phases had separated into two layers, 2 ml of the
organic phase was transferred to a new test tube with some Na2SO4 at the bottom for
water removal and shaken.
7. When the liquid in the new test tubes appeared clear, 200 µl were pipetted to a vial
and 1 ml of isooctane with BHT was added. The mixture was properly mixed and
ready for the GC.
3.6.2 GC instrumentation and programming
The GC system was a Scion 436-GC (Bruker). The column was a 100 meter Ionic Liquid
Stationary phase (SLB-IL111). Injector temperature was 250 °C, and was run in split mode
1:50. The FID was kept at 270 °C. Carrier gas was hydrogen, and column flow was 1 ml/min.
1 µl of the sample was injected. Temperature program 1 was used (table 2).
3.7 Oil samples from production
For additional information about the different oil samples in table 6 and 7 see chapter 2.2. Table 6. Samples of naural fish oil.
Sample name Treatment/processing conditions Number of replicates
VNT 1812 Winterized fish oil. Before stripping. 3
STF 1812 Stripped fish oil. Temperature = 199 °C 3
BLF 1812 Bleached fish oil. Before deodorization. 3
DEO 1812 Deodorized fish oil. Temperature = 190 °C 3
Table 7. Samples from the concentration process.
Sample name Treatment/processing conditions Number of
replicates
ETY 2412 FEED After ethylation, before degasser 3
ETY 2412
DEGASSER
Before SPD, after degasser. Temperature = 110 °C 3
DTL EE Light fraction from SPD. Temperature = 127.7 °C 3
DTD 3020 (R1) After the first column in SPD. Temperature = 127.7 °C 3
DTR EE Heavy residue fraction from SPD. Temperature = 143 °C 3
DTD 3020 (R1D2) Product after the two columns of SPD. Temperature = 143
°C
3

28
3.8 Temperature experiment
Samples of fish oil concentrates, approximately 5 ml each, were transferred to dark vials and
wrapped in aluminum foil. Samples were inserted into the oven at 180, 190 or 200 °C. For
each temperature the samples were heated for 1, 15, 30 or 60 minutes. One sample remained
untreated. After heating, the samples were stored in a fridge at 4 °C, before being analyzed in
the GC.
3.9 Calculations
The calculation of mg FA in the oil was performed using C23:0 as internal standard in the oil
sample using equation 1.
𝑚𝑔 𝐼𝑆
𝑎𝑟𝑒𝑎 𝐼𝑆=
𝑚𝑔 𝐹𝐴
𝑎𝑟𝑒𝑎 𝐹𝐴 (1)
In this equation IS = internal standard, FA = fatty acid. The amount of IS is known, the area
for both IS and FA are found by integrating the peaks in the chromatogram. By multiplying
both sides with area FA one achieves mg FA. Approximately 200 mg of sample is weighed
in, so by multiplying by a factor of approximately 5 (depending on the exact weight of the
sample) one gets mg FA/g fish oil.

29
4 Results
4.1 Separation of FAME isomers on HPTLC plates
HPTLC plates (10 x 10 cm) were used to check whether the reaction of all-cis FAME with p-
toluenesulfinic acid (PTSA) at 60 °C had formed trans isomers, and to see what happened to
the FAME if only PTSA or only heat was applied. Figure 11 shows different samples of EPA
after being developed on the HPTLC plate and charred in the oven. The spot for EPA without
any treatment (1) was similar to the spots for EPA that had only been treated with heat (2) and
only PTSA (3). Sample 4, which is EPA FAME treated with PTSA for one hour at 60 °C
contained all the different isomers of EPA, from all-cis to all-trans, with mono-, di- and tri-
trans being most abundant. Sample 5, which contains EPA FAME treated with PTSA at 60
°C for two hours, also showed all the different isomers, but here there was almost no all-cis
left and the more trans-isomerized molecules were the most abundant.
Figure 11: Shows 10 x 10 HPTLC plate impregnated with AgNO3. 1 = EPA FAME no treatment, 2 = EPA FAME
heated for one hour at 60 °C without PTSA, 3 = EPA FAME with PTSA for one hour without heat treatment, 4 =
EPA FAME heated for one hour at 60 °C with PTSA, 5 = EPA FAME heated for two hours at 60 °C with PTSA. A =
all-cis, B = mono-trans, C = di-trans, D = tri-trans, E = tetra-trans, and F = all-trans. The plate was charred in the oven
to visualize the isomers.

30
Separation of DHA FAME isomers (not shown) gave similar results as for EPA
FAME isomers. Based on visual inspection the amount of different isomers was
approximately the same as for EPA. Heating for one hour at 60 °C with PTSA was judged to
be the best approach for making trans FAME standards.
4.2 Preparation of trans FAME standards on PLC
To obtain larger amounts of isomers, the use of preparative layer plates (PLC; 20 x 20 cm)
was attempted. Several experiments were carried out, with for example different methods for
applying samples. The results were always a smeared sample where no separation had
occurred (figure 12). A dark band alongside the sample spots appeared when viewed under
UV-light, and the elution of the sample was bended. Also the whole plate showed a bright
green glow after it had been sprayed with 2’,7’-dichlorofluorescein, the same bright green
glow that should be seen from the fatty acids. No bands or spots of separation were detected.
Figure 12. Part of a PLC plate after development, watched under UV light after being sprayed with 2’,7’-
dichlorofluorescein spray. The sample is smeared out, and no separation occurs.
Preparation of trans FAME standards was also studied using the 10 x 10 cm HPTLC
plates in the large development chamber. As can be seen in figure 13 the entire plate showed a
bright green glow and a darker mark some distance up the plate, just like the PLC plate. No
separation between isomers could be spotted.

31
Figure 13. HPTLC plate developed in the large chamber, watched under UV-light after being sprayed with 2’,7’-
dichlorofluorescein. The background has the same bright green color as the fatty acids are supposed to have. A
slightly brighter green stripe can be seen, but no separations between the different isomers.
Figure 14 shows the size of the plates and the development chambers. The volume of
the large chamber is 4.1 liters, whereas the volume of the small chamber is 0.46 liters. The lid
for the small chamber is made of metal, whereas the lid for the large chamber is a glass plate.
Figure 14. The large and small developing chamber with their respective plates.
Because of these problems it was decided to use the small chamber and HPTLC plates
to prepare isomerized standards.

32
4.3 Preparation of trans FAME standards on HPTLC
Figure 15 shows separations of isomerized EPA FAME, as visualized by 2’,7’-
dichlorofluorescein under UV-light. Five spots can be seen as bright green spots on a darker
background, the most highly isomerized is barely visible. There was separation between all
spots, and increasing resolution with increasing number of trans double bonds. The separation
between the first and the second spot, containing all-cis and mono-trans, was very narrow.
The separations for DHA were similar, but the resolution was not as good as for the different
EPA isomers.
Figure 15. Visualization of isomerized EPA FAME standards on HPTLC plate under UV light, using non-destructive
2’,7’-dichlorofluorescein. Six replicate samples treated with PTSA at 60 °C for one hour were applied to the plate
along a line 1.5 cm above the bottom of the plate.
The samples were scraped off the plate using a scalpel (figure 16). The blade was
replaced after each individual isomer had been scraped off. Isomers containing three or more
trans double bonds were pooled. All-cis, mono- and di-trans isomers were collected
individually.

33
Figure 16 The plate after the isomers have been scraped off.

34
4.4 Separations of trans isomers on GC column using different temperature
programs
In this section the ability of the different temperature programs to separate trans isomers from
each other and from compounds present in the GLC 68D standard, were investigated.
Chromatograms with mono-trans isomers of EPA and DHA were superimposed onto
the chromatogram for the standard GLC 68D (figure 17). All chromatograms were obtained
using temperature program 1. As can be seen in (A) there was almost no co-elution of mono-
trans isomers of EPA and the fatty acids in GLC 68D. However, one minor peak co-eluted
with all-cis EPA (peaks 4). Peak 5 probably contained three isomers of mono-trans EPA
based on calculations of area percent of the integrated peaks, but was integrated as two peaks
in the computer program. The peak for C24:1 (2) eluted between the first and the second
mono-trans EPA peak. For DHA and GLC 68D (B) there was again almost no co-elution of
mono-trans isomers and components of GLC 68D. As in 17A a small peak co-eluted with all-
cis DHA. Peak 9 and 10 probably contains two isomers each, based on calculations of area
percent of the integrated peaks.
Figure 17. Chromatograms with retention time (rt) in minutes, for mono-trans EPA (red line) and GLC 68D (black
line) (A) and mono-trans DHA (blue line) and GLC 68D (black line) (B) under temperature program 1 (gas flow
1ml/min). 1 = mono-trans EPA, 2 = C24:1, 3 = mono-trans EPA, 4 = all-cis EPA, 5 = mono-trans EPA, 6 = mono-trans
DHA, 7 = mono-trans DHA, 8 = all-cis DHA, 9 = mono-trans DHA, and 10 = mono-trans DHA.
The chromatograms for di-trans isomers of EPA and DHA obtained using temperature
program 1 can be seen in figure 18. The di-trans isomers of EPA (A) were not completely
separated from each other, and some peaks had the same retention time (rt) as all-cis EPA (rt
= 35.82 minutes). In addition, two of the peaks most likely contained three isomers of di-trans
EPA each, based on calculations of the area percent of the integrated peaks. Some of the di-
trans isomers of DHA (B) co-eluted with all-cis DHA at approximately 47 minutes. Two the

35
peaks most likely contained two isomers each, and two of the peaks contained four isomers
each, based on calculations of area percent.
Figure 18. The chromatograms with retention time (rt) in minutes, for di-trans EPA (A) and di-trans DHA (B)
obtained under temperature program 1.
Figure 19 contains the chromatograms for GLC 68D with mono-trans EPA (A) and
mono-trans DHA (B) obtained using temperature program 2. The peaks showed more tailing
than in the previously shown chromatogram, which made the separation between the different
analytes poorer. Peak 2 (C24:1) was very broad and dragged into peak 3 (mono-trans EPA),
and the tail of peak 3 was barely separated from peak 4 (all-cis EPA). Peak 5 most likely
contained three mono-trans isomers of EPA, based on calculations of the integrated area of
the peaks, but was integrated as two peaks in the computer program. In (B) peak 7 (mono-
trans DHA) went into peak 8 (all-cis DHA). Peak 9 and 10 contained two mono-trans DHA
isomers each, based on calculations of integrated peak area. As with temperature program 1, a
small peak was found to co-elute with all-cis EPA and all-cis DHA.
Figure 19. Chromatograms with retention time (rt) in minutes, for mono-trans EPA (red line) and GLC 68D (black
line) (A) and mono-trans DHA (pink line) and GLC 68D (black line) (B) under temperature program 2 (gas flow
1ml/min). 1 = mono-trans EPA, 2 = C24:1, 3 = mono-trans EPA, 4 = all-cis EPA, 5 = mono-trans EPA, 6 = mono-trans
DHA, 7 = mono-trans DHA, 8 = all-cis DHA, 9 = mono-trans DHA, and 10 = mono-trans DHA.

36
The chromatograms for di-trans EPA (A) and di-trans DHA (B) obtained using
temperature program 2 are shown in figure 20. The separation was quite similar to that
obtained using temperature program 1. The resolution between the peaks was not as good as
in temperature program 1. All the components could not be completely separated, and some
of the components would co-elute with the all-cis isomers.
Figure 20. The chromatograms with retention time (rt) in minutes, for di-trans EPA (A) and di-trans DHA (B)
obtained under temperature program 2.
The chromatograms for mono-trans EPA (A) and mono-trans DHA (B) together with
GLC 68D, obtained using temperature program 3 are shown in figure 21. There was little co-
elution of compounds using this temperature program. As with the previously shown
chromatograms, small peaks co-eluted with the all-cis isomers. The peaks were quite sharp,
and little to no tailing was observed. The chromatogram was similar to that obtained using
temperature program 1, except the retention time was a bit longer in temperature program 3.
Figure 21. The chromatograms with retention time (rt) in minutes, for mono-trans EPA (black line) GLC 68D (red
line) (A) and mono-trans DHA (blue line) and GLC 68D (red line) (B) under temperature program 3 (gas flow
1ml/min). 1 = mono-trans EPA, 2 = C24:1, 3 = mono-trans EPA, 4 = all-cis EPA, 5 = mono-trans EPA, 6 = mono-trans
DHA, 7 = mono-trans DHA, 8 = all-cis DHA, 9 = mono-trans DHA, and 10 = mono-trans DHA.

37
The chromatograms for di-trans EPA (A) and di-trans DHA (B), obtained using
temperature program 3 can be seen in figure 22. Again the chromatograms were quite similar
to those obtained using temperature program 1. There was, again, not complete separation
between all the components present, and co-elution between some of the di-trans isomers and
all-cis isomers would occur.
Figure 22. The chromatograms with retention time (rt) in minutes, for di-trans EPA (A) and di-trans DHA (B)
obtained under temperature program 3.
Figure 23 contains the chromatograms for GLC 68D, mono-trans EPA (A) and mono-
trans DHA (B) obtained using temperature program 4 were the flow had been changed to 1.5
ml/minute. The resolution between peak 2 (mono-trans EPA) and peak 3 (all-cis EPA) was
not good. C24:1 was not detected using these temperature conditions. In addition, peak 4,
which in the previously shown equivalent chromatograms eluted as a peak with a split in the
middle, eluted more like a single peak using this temperature and flow program. The mono-
trans isomers of DHA appeared more stretched, and one of the peaks co-eluted with all-cis
DHA (peak 6). The di-trans isomers were not tested in this temperature program.
Figure 23. The chromatograms with retention time (rt) in minutes, for mono-trans EPA (red line) and GLC 68D (blue
line) (A) and mono-trans DHA (pink line) and GLC 68D (blue line) (B) under temperature program 4 (gas flow 1
ml/min). 1 = mono-trans EPA, 2 = mono-trans EPA, 3 = all-cis EPA, 4 = mono-trans EPA, 5 = mono-trans DHA, 6 =
all-cis DHA, 7 = mono-trans DHA, and 8 = mono-trans DHA.

38
4.5 Trans fatty acids formed during processing of fish oil
In this section the results from the analysis of oils from different processing steps are
presented (figure 5). All the samples with “1812” in their names follow the pathway of the
blue arrow in figure 5, whereas all the other samples follow the pathway of the red arrow in
figure 5. The tables (6-10) only contain results of integrated peaks for which standards were
available, leaving out a few peaks from the chromatograms.
4.5.1 VNT 1812 and STF 1812
VNT 1812 (table 8) had the fatty acid composition of anchoveta oil. The amounts of C14:0,
C16:0, C16:1n-7, C18:1n-9c, EPA and DHA were high. The trans fatty acid 18:1n-9t was
detected as 0.82 ± 0.71 mg/g. One isomer of mono-trans EPA was also detected, at 1.51 ±
0.11 mg/g, giving a total trans fatty acid content of 2.32 ± 0.59 mg/g. The standard deviance
for most fatty acids in these samples was relatively low, except for C24:1, which was detected
at 0.40 ± 0.70 mg/g.
STF 1812 is the same oil as VNT 1812, but after the SPD stripping process. The fatty
acid composition of STF 1812 is shown in table 8. In STF 1812 the trans fatty acid 18:1n-9t
was detected at 0.73±0.64 mg/g. One isomer of mono-trans EPA was also detected in this
sample, the amount was 1.62±0.05 mg/g. Total trans fatty acid content was 2.35 ± 0.64 mg/g.
C24:1 had a very high relative standard deviance compared to the rest of the fatty acids
present in this sample.

39
Table 8 The fatty acid composition of VNT 1812 and STF 1812. Values are expressed as mean of three replicates ±
standard deviation. “t” refers to trans isomers, “c” refers to cis isomers. ND = not detected. The results for each
analyzed fatty acid are given as area percent and mg/g. Sum trans FA = the sum of trans FA for which standards were
available in this study, i.e. 18:1n-9t, 18:2n-6t, mono-trans EPA and mono-trans DHA.
VNT 1812 STF 1812
FA Area percent Mg/g Area percent Mg/g
C14:0 8.27 ± 0.08 81.64 ± 3.52 8.38 ± 0.08 84.06 ± 2.05
C15:0 0.68 ± 0.01 6.68 ± 0.30 0.69 ± 0.00 6.87 ± 0.12
C16:0 16.58 ± 0.07 163.56 ± 5.84 16.45 ± 0.07 164.99 ± 3.10
C17:0 0.29 ± 0.00 2.86 ± 0.12 0.29 ± 0.00 2.93 ± 0.06
C16:1n-7 9.37 ± 0.05 92.45 ± 3.43 9.50 ± 0.05 95.33 ± 1.89
C18:0 3.16 ± 0.03 31.20 ± 0.79 3.14 ± 0.03 31.46 ± 0.71
C17:1n-11 0.38 ± 0.03 3.79 ± 0.45 0.38 ± 0.01 3.86 ± 0.09
C18:1n-9t 0.08 ± 0.07 0.82 ± 0.71 0.07 ± 0.06 0.73 ± 0.64
C18:1n-9c 8.12 ± 0.02 80.08 ± 2.59 8.10 ± 0.02 81.21 ± 1.13
C18:1n-7 3.21 ± 0.03 31.63 ± 1.29 3.18 ± 0.02 31.92 ± 0.68
C18:2n-6t ND ND ND ND
C20:0 0.22 ± 0.01 2.18 ± 0.08 0.21 ± 0.00 2.09 ± 0.02
C18:2n-6c 1.28 ± 0.01 12.62 ± 0.45 1.29 ± 0.01 12.95 ± 0.16
C20:1n-11 2.14 ± 0.02 21.07 ± 0.61 2.09 ± 0.05 20.92 ± 0.52
C20:1n-9 0.97 ± 0.00 9.52 ± 0.33 0.99 ± 0.06 9.88 ± 0.63
C21:0 0.27 ± 0.01 2.70 ± 0.06 0.27 ± 0.01 2.73 ± 0.03
C18:3n-6 0.26 ± 0.01 2.53 ± 0.11 0.25 ± 0.01 2.54 ± 0.05
C18:3n-3 0.65 ± 0.01 6.39 ± 0.13 0.65 ± 0.01 6.48 ± 0.10
C20:2n-6 0.13 ± 0.00 1.24 ± 0.03 0.13 ± 0.01 1.29 ± 0.05
C22:1n-11 0.40 ± 0.03 3.93 ± 0.14 0.40 ± 0.02 4.04 ± 0.28
C20:3n-6 0.28 ± 0.02 2.81 ± 0.13 0.27 ± 0.02 2.75 ± 0.27
C20:4n-6 1.00 ± 0.01 9.83 ± 0.36 1.00 ± 0.01 10.02 ± 0.24
Mono-t EPA 0.15 ± 0.01 1.51 ± 0.11 0.16 ± 0.00 1.62 ± 0.05
C24:1 0.04 ± 0.07 0.40 ± 0.70 0.11 ± 0.10 1.14 ± 0.99
Mono-t EPA ND ND ND ND
C20:5n-3 18.82 ± 0.11 185.68 ± 5.16 18.74 ± 0.08 187.94 ± 2.38
Mono-t EPA ND ND ND ND
Mono-t EPA ND ND ND ND
Mono-t DHA ND ND ND ND
C22:5n-3 1.77 ± 0.03 17.41 ± 0.43 1.80 ± 0.04 18.02 ± 0.17
Mono-t DHA ND ND ND ND
C22:6n-3 11.75 ± 0.12 115.90 ± 2.70 11.68 ± 0.15 117.10 ± 0.69
Mono-t DHA ND ND ND ND
Mono-t DHA ND ND ND ND
Sum trans FA 2.32 ± 0.59 2.35 ± 0.64

40
4.5.2 BLF 1812 and DEO 1812
Fish oil bleaching (BLF 1812) is the processing step preceding deodorization. BLF 1812
(table 9) had the same natural fatty acid composition as the other “1812” oils. The only trans
fatty acid detected in this sample was C18:1n-9t, which was present at 1.99±0.09 mg/g. No
trans isomers of EPA or DHA were detected. The standard deviation was relatively low for
every fatty acid except C20:3n-3.
Deodorized fish oil DEO 1812 (table 9) had, like the other “1812”-oils, a natural fish
oil fatty acid composition. 1.87±0.11 mg/g of 18:1n-9t was detected, but no trans isomers of
EPA or DHA were observed. The standard deviation for C20:3n-3 was also very high in DEO
1812.
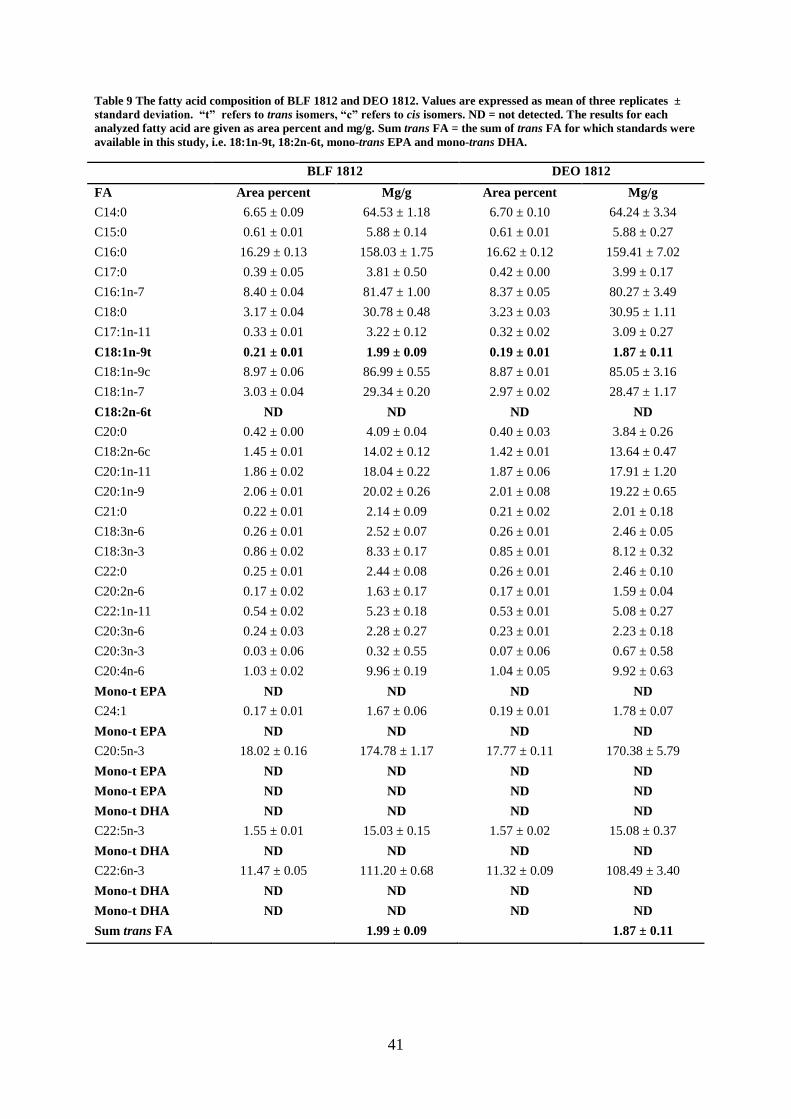
41
Table 9 The fatty acid composition of BLF 1812 and DEO 1812. Values are expressed as mean of three replicates ±
standard deviation. “t” refers to trans isomers, “c” refers to cis isomers. ND = not detected. The results for each
analyzed fatty acid are given as area percent and mg/g. Sum trans FA = the sum of trans FA for which standards were
available in this study, i.e. 18:1n-9t, 18:2n-6t, mono-trans EPA and mono-trans DHA.
BLF 1812 DEO 1812
FA Area percent Mg/g Area percent Mg/g
C14:0 6.65 ± 0.09 64.53 ± 1.18 6.70 ± 0.10 64.24 ± 3.34
C15:0 0.61 ± 0.01 5.88 ± 0.14 0.61 ± 0.01 5.88 ± 0.27
C16:0 16.29 ± 0.13 158.03 ± 1.75 16.62 ± 0.12 159.41 ± 7.02
C17:0 0.39 ± 0.05 3.81 ± 0.50 0.42 ± 0.00 3.99 ± 0.17
C16:1n-7 8.40 ± 0.04 81.47 ± 1.00 8.37 ± 0.05 80.27 ± 3.49
C18:0 3.17 ± 0.04 30.78 ± 0.48 3.23 ± 0.03 30.95 ± 1.11
C17:1n-11 0.33 ± 0.01 3.22 ± 0.12 0.32 ± 0.02 3.09 ± 0.27
C18:1n-9t 0.21 ± 0.01 1.99 ± 0.09 0.19 ± 0.01 1.87 ± 0.11
C18:1n-9c 8.97 ± 0.06 86.99 ± 0.55 8.87 ± 0.01 85.05 ± 3.16
C18:1n-7 3.03 ± 0.04 29.34 ± 0.20 2.97 ± 0.02 28.47 ± 1.17
C18:2n-6t ND ND ND ND
C20:0 0.42 ± 0.00 4.09 ± 0.04 0.40 ± 0.03 3.84 ± 0.26
C18:2n-6c 1.45 ± 0.01 14.02 ± 0.12 1.42 ± 0.01 13.64 ± 0.47
C20:1n-11 1.86 ± 0.02 18.04 ± 0.22 1.87 ± 0.06 17.91 ± 1.20
C20:1n-9 2.06 ± 0.01 20.02 ± 0.26 2.01 ± 0.08 19.22 ± 0.65
C21:0 0.22 ± 0.01 2.14 ± 0.09 0.21 ± 0.02 2.01 ± 0.18
C18:3n-6 0.26 ± 0.01 2.52 ± 0.07 0.26 ± 0.01 2.46 ± 0.05
C18:3n-3 0.86 ± 0.02 8.33 ± 0.17 0.85 ± 0.01 8.12 ± 0.32
C22:0 0.25 ± 0.01 2.44 ± 0.08 0.26 ± 0.01 2.46 ± 0.10
C20:2n-6 0.17 ± 0.02 1.63 ± 0.17 0.17 ± 0.01 1.59 ± 0.04
C22:1n-11 0.54 ± 0.02 5.23 ± 0.18 0.53 ± 0.01 5.08 ± 0.27
C20:3n-6 0.24 ± 0.03 2.28 ± 0.27 0.23 ± 0.01 2.23 ± 0.18
C20:3n-3 0.03 ± 0.06 0.32 ± 0.55 0.07 ± 0.06 0.67 ± 0.58
C20:4n-6 1.03 ± 0.02 9.96 ± 0.19 1.04 ± 0.05 9.92 ± 0.63
Mono-t EPA ND ND ND ND
C24:1 0.17 ± 0.01 1.67 ± 0.06 0.19 ± 0.01 1.78 ± 0.07
Mono-t EPA ND ND ND ND
C20:5n-3 18.02 ± 0.16 174.78 ± 1.17 17.77 ± 0.11 170.38 ± 5.79
Mono-t EPA ND ND ND ND
Mono-t EPA ND ND ND ND
Mono-t DHA ND ND ND ND
C22:5n-3 1.55 ± 0.01 15.03 ± 0.15 1.57 ± 0.02 15.08 ± 0.37
Mono-t DHA ND ND ND ND
C22:6n-3 11.47 ± 0.05 111.20 ± 0.68 11.32 ± 0.09 108.49 ± 3.40
Mono-t DHA ND ND ND ND
Mono-t DHA ND ND ND ND
Sum trans FA 1.99 ± 0.09 1.87 ± 0.11

42
4.5.3 ETY 2412
Oils from after the ethylation process and before concentration in SPD (ETY 2412) were also
analyzed for the presence of trans fatty acids. Samples were taken after the ethylation before
the degasser (ETY 2412 FEED) and after degassing before concentration in SPD (ETY 2412
DEGASSER). ETY 2412 FEED (table 10) contained high amounts of C14:0, C16:0, C16:1n-
7, C18:1n-9c, EPA and DHA. Of trans fatty acids, C18:1n-9t, C18:2n-6t and one mono-trans
EPA isomer were detected. The amounts were 0.31±0.54 mg/g, 0.68±0.60 mg/g and
1.89±0.07 mg/g, respectively. The total trans fatty acid content was 2.88 ± 0.82 mg/g. The
standard deviations were in general relatively small for most fatty acids, except the two
aforementioned 18-carbon trans fatty acids and C20:0.
ETY 2412 DEGASSER (table 10) was similar to ETY 2412 FEED in fatty acid
composition. The same trans fatty acids were detected, but the means and standard deviations
were a bit different for 18:1n-9t (0.65±0.56 mg/g) and 18:2n-6t (1.13±0.20 mg/g). The mono-
trans isomer of EPA was similar in amount to ETY 2412 FEED at 1.86±0.08 mg/g. The total
amount of trans fatty acids was 3.63 ± 0.61 mg/g. The relative standard deviations were in
general a bit lower for ETY 2412 DEGASSER than for ETY 2412 FEED.

43
Table 10 The fatty acid composition of ETY 2412 (FEED), ETY 2412 (DEGASSER) and ETY 2412. Values are
expressed as mean of three replicates ± standard deviation. “t” refers to trans isomers, “c” refers to cis isomers. ND
= not detected. The results for each analyzed fatty acid are given as area percent and mg/g. Sum trans FA = the sum of
trans FA for which standards were available in this study, i.e. 18:1n-9t, 18:2n-6t, mono-trans EPA and mono-trans
DHA.
ETY 2412 FEED ETY 2412 DEGASSER
FA Area percent Mg/g Area percent Mg/g
C14:0 6.06 ± 0.18 56.32 ± 3.47 5.89 ± 0.09 53.00 ± 1.35
C15:0 0.48 ± 0.01 4.47 ± 0.21 0.47 ± 0.01 4.22 ± 0.14
C16:0 14.95 ± 0.22 138.84 ± 6.29 14.74 ± 0.12 132.66 ± 2.46
C15:1 0.22 ± 0.01 2.07 ± 0.15 0.20 ± 0.01 1.83 ± 0.11
C17:0 0.30 ± 0.00 2.80 ± 0.10 0.34 ± 0.00 3.06 ± 0.04
C16:1n-7 7.18 ± 0.11 66.66 ± 3.08 6.71 ± 0.04 60.45 ± 1.02
C18:0 4.21 ± 0.02 39.12 ± 1.33 4.25 ± 0.03 38.28 ± 0.29
C17:1n-11 0.27 ± 0.03 2.50 ± 0.31 0.25 ± 0.01 2.24 ± 0.05
C18:1n-9t 0.03 ± 0.06 0.31 ± 0.54 0.07 ± 0.06 0.65 ± 0.56
C18:1n-9c 8.99 ± 0.06 83.42 ± 2.85 8.94 ± 0.04 80.51 ± 0.96
C18:1n-7 3.49 ± 0.05 32.40 ± 1.31 3.45 ± 0.01 31.09 ± 0.33
C18:2n-6t 0.07 ± 0.06 0.68 ± 0.60 0.13 ± 0.02 1.13 ± 0.20
C20:0 0.21 ± 0.18 1.93 ± 1.67 0.57 ± 0.02 5.12 ± 0.10
C18:2n-6c 1.30 ± 0.01 12.03 ± 0.35 1.30 ± 0.02 11.68 ± 0.16
C20:1n-11 2.88 ± 0.05 26.76 ± 0.48 2.84 ± 0.02 25.58 ± 0.40
C21:0 0.32 ± 0.02 2.95 ± 0.07 0.31 ± 0.00 2.81 ± 0.05
C18:3n-6 0.34 ± 0.01 3.14 ± 0.04 0.33 ± 0.01 2.97 ± 0.10
C18:3n-3 0.86 ± 0.07 7.94 ± 0.62 0.85 ± 0.09 7.70 ± 0.92
C22:0 0.20 ± 0.04 1.87 ± 0.33 0.24 ± 0.03 2.16 ± 0.29
C20:2n-6 0.16 ± 0.01 1.50 ± 0.05 0.19 ± 0.01 1.68 ± 0.11
C22:1n-11 0.39 ± 0.01 3.60 ± 0.05 0.40 ± 0.01 3.58 ± 0.06
C20:3n-6 0.20 ± 0.01 1.89 ± 0.07 0.19 ± 0.01 1.75 ± 0.09
C20:4n-6 1.15 ± 0.07 10.64 ± 0.49 1.20 ± 0.00 10.81 ± 0.10
Mono-t EPA 0.20 ± 0.01 1.89 ± 0.07 0.21 ± 0.01 1.86 ± 0.08
C24:1 0.29 ± 0.05 2.71 ± 0.34 0.34 ± 0.01 3.08 ± 0.07
Mono-t EPA ND ND ND ND
C20:5n-3 21.01 ± 0.27 194.96 ± 5.07 21.05 ± 0.14 189.53 ± 1.62
Mono-t EPA ND ND ND ND
Mono-t EPA ND ND ND ND
Mono-t DHA ND ND ND ND
C22:5n-3 1.94 ± 0.05 17.96 ± 0.24 1.98 ± 0.01 17.85 ± 0.14
Mono-t DHA ND ND ND ND
C22:6n-3 10.81 ± 0.22 100.30 ± 1.55 11.00 ± 0.09 98.98 ± 0.73
Mono-t DHA ND ND ND ND
Mono-t DHA ND ND ND ND
Sum trans FA 2.88 ± 0.82 3.63 ± 0.61

44
4.5.4 DTL EE and DTR EE
DTL EE (table 11) is a volatile fraction that is removed from the fish oil concentrate during
the short path distillation (SPD). High amounts of the short fatty acids, such as C14:0, C16:0
and C16:1, and low amounts of LC-PUFA were observed in the chromatograms of DTL EE.
No trans EPA or DHA was observed in DTL EE, however, 0.66±0.58 mg/g of 18:1n-9t and
2.52±1.92 mg/g of 18:2n-6t was detected. Total trans fatty acid content was 3.18 ± 1.63 mg/g.
For most of the fatty acids detected, the standard deviations were relatively small, except for
C18:1n-9t, C18:2n-6t, C20:0 and C22:0.
DTR EE (table 11) is the heavy fraction of the oil. The sum of FAME made up only
504.6 mg/g in this sample compared to 834.3 mg/g in DTL EE (data not shown). No trans
isomers of any fatty acid was detected in DTR EE. The standard deviations were relatively
small in two-thirds of the detected fatty acids, whereas C15:0, C20:0, C21:0, C18:3n-6,
C22:0, C22:1n-11 and C24:0 had large standard deviations.

45
Table 11. The fatty acid composition of DTL EE and DTR EE. Values are expressed as mean of three replicates ±
standard deviation. “t” refers to trans isomers, “c” refers to cis isomers. ND = not detected. The results for each
analyzed fatty acid are given as area percent and mg/g. Sum trans FA = the sum of trans FA for which standards were
available in this study, i.e. 18:1n-9t, 18:2n-6t, mono-trans EPA and mono-trans DHA.
DTL EE DTR EE
FA Area percent Mg/g Area percent Mg/g
C14:0 9.49 ± 0.31 90.83 ± 4.17 3.87 ± 0.20 21.45 ± 1.17
C15:0 0.74 ± 0.02 7.07 ± 0.26 0.12 ± 0.20 0.66 ± 1.14
C16:0 22.19 ± 0.50 212.30 ± 7.58 10.26 ± 0.38 56.85 ± 2.28
C15:1 0.33 ± 0.02 3.16 ± 0.12 ND ND
C17:0 0.42 ± 0.05 3.97 ± 0.41 0.07 ± 0.12 0.38 ± 0.65
C16:1n-7 10.65 ± 0.18 101.86 ± 3.01 5.07 ± 0.20 28.07 ± 1.29
C18:0 4.21 ± 0.05 40.24 ± 0.81 2.88 ± 0.08 15.93 ± 0.30
C17:1n-11 0.37 ± 0.02 3.54 ± 0.29 0.23 ± 0.02 1.26 ± 0.12
C18:1n-9t 0.07 ± 0.06 0.66 ± 0.58 ND ND
C18:1n-9c 9.70 ± 0.16 92.80 ± 2.72 6.46 ± 0.21 35.81 ± 1.33
C18:1n-7 3.69 ± 0.09 35.26 ± 1.27 2.44 ± 0.07 13.51 ± 0.57
C18:2n-6t 0.26 ± 0.20 2.52 ± 1.92 ND ND
C20:0 0.49 ± 0.33 4.68 ± 3.13 0.09 ± 0.15 0.50 ± 0.86
C18:2n-6c 1.53 ± 0.16 14.60 ± 1.51 0.92 ± 0.02 5.10 ± 0.15
C20:1n-11 3.52 ± 0.09 33.63 ± 1.29 2.26 ± 0.05 12.55 ± 0.44
C21:0 0.18 ± 0.00 1.72 ± 0.04 0.13 ± 0.22 0.71 ± 1.23
C18:3n-6 0.35 ± 0.00 3.33 ± 0.06 0.08 ± 0.15 0.48 ± 0.83
C18:3n-3 0.95 ± 0.02 9.12 ± 0.27 0.61 ± 0.03 3.36 ± 0.23
C22:0 0.08 ± 0.07 0.76 ± 0.66 0.30 ± 0.27 1.66 ± 1.49
C22:1n-11 0.32 ± 0.01 3.04 ± 0.09 0.08 ± 0.14 0.45 ± 0.78
C20:3n-6 0.13 ± 0.01 1.21 ± 0.10 ND ND
C20:4n-6 0.71 ± 0.01 6.80 ± 0.14 0.97 ± 0.02 5.40 ± 0.13
C24:0 ND ND 0.35 ± 0.30 1.92 ± 1.67
Mono-t EPA ND ND ND ND
C24:1 ND ND 4.80 ± 0.15 26.61 ± 0.42
Mono-t EPA ND ND ND ND
C20:5n-3 13.15 ± 0.09 125.73 ± 2.47 19.07 ± 0.48 105.66 ± 3.27
Mono-t EPA ND ND ND ND
Mono-t EPA ND ND ND ND
Mono-t DHA ND ND ND ND
C22:5n-3 0.53 ± 0.02 5.08 ± 0.16 4.74 ± 0.14 26.28 ± 0.48
Mono-t DHA ND ND ND ND
C22:6n-3 3.17 ± 0.06 30.35 ± 0.26 25.27 ± 0.49 140.02 ± 3.79
Mono-t DHA ND ND ND ND
Mono-t DHA ND ND ND ND
Sum trans FA 3.18 ± 1.63 0

46
4.5.5 DTD 3020 (R1) and DTD 3020 (R1D2)
DTD 3020 (R1) (table 12) contained the heavier fraction from the first column of the SPD.
Small amounts of the short fatty acids, such as C14:0 and C16:0 were detected. EPA and
DHA were the most abundant fatty acids. In DTD 3020 (R1) only one trans isomer of EPA
was detected, and the amount, 2.24 mg/g, was quite low. Generally the standard deviance for
most fatty acids was relatively small, except in the case of C20:0, C21:0 and C22:0.
DTD 3020 (R1D2) (table 12) contained the heavy fraction from the first column of the
SPD, which had been distilled in the second column, thereby removing the heavier unwanted
compounds, such as cholesterol, DAG and MAG. In this sample, only one isomer of mono-
trans EPA was detected and the amount was 2.64 mg/g.
The fatty acid composition of DTD 3020 (R1) and DTD 3020 (R1D2) was
approximately the same. Only small differences in the amount of short fatty acids could be
observed.

47
Table 12 The fatty acid composition of DTD 3020 (R1) and DTD 3020 (R1D2). Values are expressed as mean of three
replicates ± standard deviation. “t” refers to trans isomers, “c” refers to cis isomers. ND = not detected. The results
for each analyzed fatty acid are given as area percent and mg/g. Sum trans FA = the sum of trans FA for which
standards were available in this study, i.e. 18:1n-9t, 18:2n-6t, mono-trans EPA and mono-trans DHA.
DTD 3020 (R1) DTD 3020 (R1D2)
FA Area percent Mg/g Area percent Mg/g
C14:0 0.38 ± 0.01 3.48 ± 0.19 0.13 ± 0.01 1.18 ± 0.09
C16:0 3.19 ± 0.08 29.11 ± 1.24 2.78 ± 0.07 25.29 ± 1.08
C17:0 ND ND 0.17 ± 0.03 1.58 ± 0.29
C16:1n-7 1.51 ± 0.01 13.73 ± 0.30 1.08 ± 0.04 9.78 ± 0.56
C18:0 4.85 ± 0.06 44.26 ± 1.30 4.74 ± 0.14 43.06 ± 2.02
C18:1n-9t ND ND ND ND
C18:1n-9c 8.23 ± 0.09 75.08 ± 2.13 8.23 ± 0.11 74.78 ± 2.38
C18:1n-7 3.66 ± 0.19 33.42 ± 2.17 3.51 ± 0.04 31.92 ± 0.98
C18:2n-6t ND ND ND ND
C20:0 0.38 ± 0.22 3.44 ± 1.96 0.49 ± 0.01 4.46 ± 0.14
C18:2n-6c 1.11 ± 0.06 10.12 ± 0.46 1.13 ± 0.01 10.23 ± 0.33
C20:1n-11 0.38 ± 0.05 3.43 ± 0.50 0.28 ± 0.04 2.51 ± 0.29
C20:1n-9 1.25 ± 0.03 11.39 ± 0.25 1.25 ± 0.15 11.37 ± 1.25
C21:0 0.36 ± 0.31 3.26 ± 2.82 0.50 ± 0.12 4.56 ± 1.09
C18:3n-6 0.35 ± 0.05 3.20 ± 0.49 0.28 ± 0.10 2.54 ± 0.87
C18:3n-3 0.71 ± 0.03 6.50 ± 0.24 0.74 ± 0.02 6.72 ± 0.27
C22:0 0.04 ± 0.06 0.34 ± 0.59 0.12 ± 0.02 1.07 ± 0.16
C20:2n-6 0.18 ± 0.03 1.67 ± 0.25 0.22 ± 0.02 1.98 ± 0.14
C22:1n-11 0.56 ± 0.09 5.08 ± 0.84 0.47 ± 0.04 4.27 ± 0.32
C20:3n-6 0.72 ± 0.08 6.54 ± 0.82 0.51 ± 0.05 4.62 ± 0.45
C20:4n-6 1.77 ± 0.09 16.15 ± 0.64 1.92 ± 0.02 17.40 ± 0.18
Mono-t EPA 0.25 ± 0.01 2.24 ± 0.09 0.29 ± 0.01 2.64 ± 0.07
Mono-t EPA ND ND ND ND
C20:5n-3 36.54 ± 0.60 333.26 ± 9.82 36.49 ± 0.30 331.56 ± 9.21
Mono-t EPA ND ND ND ND
Mono-t EPA ND ND ND ND
Mono-t DHA ND ND ND ND
C22:5n-3 3.32 ± 0.26 30.25 ± 1.99 3.69 ± 0.05 33.50 ± 0.31
Mono-t DHA ND ND ND ND
C22:6n-3 23.61 ± 0.18 215.29 ± 3.67 23.44 ± 0.06 212.95 ± 4.48
Mono-t DHA ND ND ND ND
Mono-t DHA ND ND ND ND
Sum trans FA 2.24 ± 0.09 2.64 ± 0.07

48
4.6 Temperature experiments
Heating a fish oil concentrate (30% EPA and 20% DHA) for 1, 15, 30 and 60 minutes at 180,
190 and 200 °C was executed to see how time and temperature affected the formation of
trans-fatty acids in the fish oil. The results are found in table 13.
All the samples contained the same amount of C18:1n-9t, of approximately 0.06-
0.07%. There was no increase in the amount of C18:1n-9t with increasing temperature or
time. In addition to C18:1n-9t, all the samples contained the same peak, with a retention time
corresponding to an isomer of mono-trans EPA. All the heated samples had a larger area
percent of the mono-trans EPA than the control sample (no heat). However, this peak seemed
to decrease in size as time of heating increased. The only sample to contain two peaks
corresponding to the retention time of isomers of mono-trans EPA was the one that had been
heated for 60 minutes at 200 °C, so there was an increase in the area percent of mono-trans
EPA in this sample compared to the sample that had been heated for 30 minutes at 200 °C.
Table 13. The area percent (A%) of trans fatty acids in oil samples that had been heated for 1, 15, 30 and 60 minutes
at 180, 190 and 200 °C. Two replicates were tested for each sample. Total trans FA = the sum of trans FA for which
standards were available in this study, i.e. 18:1n-9t, 18:2n-6t, mono-trans EPA and mono-trans DHA.
Oil sample 18:1n-9t
(A%)
Mono-trans EPA
(A%)
Mono-trans DHA
(A%)
Total trans FA
(A%)
No heat
(control)
0,06 0,27 0 0,33
1 min 180 °C 0,06 0,37 0 0,42
15 min 180 °C 0,06 0,35 0 0,40
30 min 180 °C 0,06 0,32 0 0,37
60 min 180 °C 0,06 0,29 0,03 0,38
1 min 190 °C 0,06 0,36 0 0,41
15 min 190 °C 0,06 0,32 0 0,37
30 min 190 °C 0,07 0,29 0 0,35
60 min 190 °C 0,06 0,29 0,13 0,48
1 min 200 °C 0,06 0,39 0 0,44
15 min 200 °C 0,06 0,31 0,05 0,42
30 min 200 °C 0,06 0,29 0,12 0,47
60 min 200 °C 0,06 0,34 0,24 0,64
The sample which had been heated for one hour at 180 °C contained 0.03% mono-
trans DHA. The samples which had been heated for 15 and 30 minutes at 200 °C, contained
0.05 and 0.12% mono-trans DHA, respectively. The sample that was heated for one hour at
190 °C contained 0.13% mono-trans DHA, distributed over two peaks corresponding to the
retention time of mono-trans DHA. The sample which had been heated for one hour at 200 °C
also contained two peaks corresponding to the retention time of mono-trans DHA, the area
percent of these peaks amounted to 0.24%.
The total amount of trans fatty acids in the control sample was 0.33%. The content of
trans fatty acids in most of the heat-treated samples were around 0.4%. The sample that had
been heated for 60 minutes at 190 °C and the sample which had been heated for 30 minutes at

49
200 °C contained a total of 0.48 and 0.47% trans fatty acids, respectively. The total amount in
the sample which had been heated for 60 minutes at 200 °C was 0.64% trans fatty acids.

50
5 Discussion The concentration of PTSA in 1,4-dioxane described by Mjøs (2005) worked well for
producing trans isomers from all-cis FAME standards of EPA and DHA. The tests showed
that 60 minutes at 60 °C produced a proper amount of mono-trans isomers, which were
considered the most important ones. Applying 60 °C for 120 minutes also worked well, but
produced much higher amounts of the poly-trans isomers. Hence 60 minutes of heat treatment
was considered the best approach. The smudged appearance of all-cis EPA, EPA + PTSA (no
heat) and EPA without PTSA for one hour at 60 °C (figure 11), could be explained by sample
overload, as there was only one component in the applied samples that appeared smudged and
the amount applied to the plate was as large as the samples containing multiple components
(different trans isomers).
Several experiments were carried out using the 20x20 cm PLC plates in the large
development chamber to obtain larger amounts of trans FAME standards. The results were
always smudged samples, no separation, and a dark band following the eluting streaks. Using
10x10 cm HPTLC plates in the large chamber under the exact same conditions as in the small
chamber, revealed that the development chamber, not the 20x20 cm PLC plates, was the
source of error. It may be attributed to its relatively larger size in relation to the plates, and
that this relatively larger volume resulted in the atmosphere of the tank not being saturated
with mobile phase at the low temperature. This, however, is unlikely, since the large chamber
is made for the development of 20x20 cm plates and several studies have reported using
20x20 cm PLC with success (Fournier et al. 2006 A; Fournier et al. 2006 B; Srigley & Rader
2014). Another possible explanation might be found in the material of the lid. The large
chamber had a lid made of glass, whereas the small chamber had a lid made from metal.
Metal and glass react differently to temperature, i.e. they have different thermal expansion;
metal contracts more at low temperatures than glass does. The metal lid could have made the
small chamber more gas tight at -25 °C than the glass lid made the large chamber. This was
not tested, as there were no metal lids available for the large chamber and no glass lids
available for the small chamber.
Using 10x10 cm HPTLC plates for preparation of trans isomer standards of EPA and
DHA FAME worked well. It was expected that not enough standard would be produced and
that several plates would be needed to obtain enough sample for GC separation. This was not
the case, however, and one plate was sufficient to test the different temperature programs and
to check later whether the retention time of the trans isomers had been altered after all the
sample runs. The gap between all-cis and mono-trans isomers on the plates was narrow, and

51
the small apparent trans-isomers co-eluting with all-cis isomers in the optimization of GC
conditions are probably all-cis isomer residuals from scraping off the plates, contaminating
the trans FAME standards.
It seems that the usual approach to the analysis of trans fatty acids is running the GC
oven isothermally. This was also tested in an early stage of this study, but it was found to give
poorer separation between the low boiling point fatty acids. In addition, the antioxidant BHT
was added to the solvent used for sample preparation. This led to BHT being eluted very close
to C14:0. For these reasons, the temperature programs were made.
The different temperature programs were tested to achieve the best possible separation of
isomers of EPA, DHA and other compounds with closely coinciding retention times. GLC
68D which contained C24:1, EPA and DHA, was compared with the previously made trans
isomer standards of FAME EPA and DHA. Under the conditions of temperature program 1,
sharp peaks with no co-elution between the compounds of GLC 68D and the mono-trans
isomers were observed. Some co-elution was observed between the di-trans isomers and the
all-cis isomer, but this may not be overcome by any temperature program. Temperature
program 2 did not show as sharp peaks and good resolution as temperature program 1. In the
chromatograms for temperature program 2, the peaks were more tailed and more broadened,
which led to components eluting closer to each other, especially in the DHA-region, where
peak 7 eluted into all-cis DHA. Temperature program 3 very closely resembled temperature
program 1, with sharp peaks and resolution between the peaks. The main difference between
temperature program 1 and 3 was the longer retention times of the components in the latter
program. The di-trans isomers were once again not properly separated. Temperature program
4 did not give useful results as the chromatograms showed poor separations and the C24:1
peak did not show up. It had probably become too broad for detection. One of the mono-trans
EPA peaks eluted halfway into the all-cis EPA peak. The peaks in the DHA region of the
chromatogram showed both tailing and broad peaks, and one of the mono-trans DHA isomers
co-eluted with all-cis DHA. Because the mono-trans isomers showed such poor results it was
decided not to check the di-trans isomers in this temperature program. The reason that
temperature program 1 and 3 gave similarly good results could probably be ascribed to the
temperature increase from 150 °C to 170 °C by 2 °C/min. This seems to be important for the
sharpness of the peaks. With a slower increase in temperature between 150 °C and 170 °C
band-broadening became a problem. The rate of increase from 110 to 150 °C by 10 °C/min or
20 °C/min did not seem to have any large impact on the shape of the peaks. A carrier gas flow
of 1 ml/min gave better results than 1.5 ml/min, as can be seen in the results of temperature

52
program 4. It could however, be argued that temperature program 4 should have been tested
with the same flow as the other temperature programs.
Temperature program number 1 was chosen for the subsequent analyses. It showed good
separations and relatively short retention times compared to temperature program 3, which
also showed good separations. When standards which contained DPA (C22:5n-3) was tested,
it was found that one mono-trans DHA isomer co-eluted with this fatty acid. A standard
containing this fatty acid should have been used during the testing of temperature programs,
and this presents another weakness to the study.
Compared to the BPX-70 used by Sciotto & Mjøs (2012) the SLB-IL111 gave better
results for mono-trans EPA with four peaks, and little apparent co-elution with other
compounds. For mono-trans DHA the results were better on the BPX-70 column with five
peaks and no co-elution compared to the SLB-IL111, where four peaks were detected and one
peak co-eluted with DPA. The CP-Sil88 column, which was used in Fournier et al. (2006 A),
separated four peaks of mono-trans EPA and five peaks of mono-trans DHA, but one of the
EPA peaks co-eluted with all-cis EPA. This meant that the 100 meter SLB-IL111 showed
better results for the EPA region, but worse results for the DHA region. Mjøs (2008)
investigated the use of a 50 meter polyethylene glycol (PEG) stationary phase column for
determination of trans isomers of EPA and DHA. Four peaks were observed for mono-trans
EPA, where one isomer co-eluted with C22:0 and one isomer co-eluted partially with C22:1n-
9. Four peaks were also observed for mono-trans DHA, and no co-elution was observed.
Srigley & Rader (2014) also used the SLB-IL111 column, but they used 200 meters instead of
the 100 meters that were used in this present study. In their study they were able to separate
five peaks of mono-trans EPA and four peaks for mono-trans DHA, where one of the mono-
trans DHA peaks co-eluted with DPA. The longer column therefore gave the same results for
mono-trans DHA, but better results for mono-trans EPA, at the cost of a longer analysis time.
Fardin-Kia et al. (2013) found 125 FAMEs in their samples, using a 200 meter SLB-
IL111 column. In the present study, many peaks were also detected, but not presented here
because a limited selection of standards for identifying the peaks was available at the
laboratory. It would also have been useful to know which trans isomer eluted in the different
peaks, i.e. which double bond had isomerized. Finding out which compounds were present in
the samples could have been investigated with the use of mass spectrometry (MS), but such
equipment was not available at the laboratory where the present study was executed.

53
Samples from different processing steps were analyzed for fatty acid composition,
with emphasis on trans fatty acids. None of the samples from the processing of fish oils
contained large amounts of trans fatty acids.
The fish oil before stripping (VNT 1812) was similar to the stripped fish oil (STF
1812). The stripping process was performed at 199 °C, which is a very high temperature, and
one might expect some trans fatty acids to form (Oterhals & Berntsen 2010). However, the
fatty acid composition of the oil before and after stripping was the same. VNT 1812 contained
0.82±0.71 mg/g of 18:1n-9t, but this trans fatty acid was not detected in one replicate, and if
that replicate was removed the average was 1.23 mg/g. If the “outlier” was removed from
STF 1812, the result for 18:1n-9t was the same as for VNT. One isomer of mono-trans EPA
was also detected at similar levels in VNT 1812 and STF 1812. The total amount of trans
fatty acids was far below the allowed content of 2% (Helse- og omsorgsdepartementet 2014).
The reason that no increase in trans fatty acid content was observed, even though the fish oil
had been processed at 199 °C, might be attributed to the short residence time of the oil in the
SPD-column.
DEO 1812 was deodorized at 190 °C and had the same fatty acid composition as BLF
1812, which was sampled before deodorization. The only trans fatty acid detected was 18:1n-
9t, and the concentrations were approximately the same in both samples. Deodorization has
been mentioned in several studies as a potential source of trans fatty acid formation (e.g.
Kemény et al. 2001, Fournier et al. 2007), but the deodorization temperature and time applied
to this sample seemed not to be sufficient to isomerize detectable amounts of cis double bonds
to trans double bonds. At Nordic Pharma Inc. they perform continuous deodorizing, as
opposed to traditional batch deodorizing, thereby exposing the oil to the high processing
temperature for a shorter time.
The ETY 2412 samples had similar fatty acid compositions; the degassing did not
seem to alter the amount of any fatty acid to any notable extent. The temperature of the
degasser was 110 °C. Three different trans fatty acids were detected in the ETY 2412
samples, namely 18:1n-9t, 18:2n-6t and one isomer of mono-trans EPA. 18:1n-9t was not
detected in two of the replicates of the FEED samples, but was detected as 0.93 mg/g in one
of the replicates. The same trans fatty acid was detected in two of the replicates of the
DEGASSER samples, with an average of the two amounting to 0.97 mg/g. The fatty acid
18:2n-6t was detected in two of the replicates from the FEED sample, the average of the two
replicates being 1.03 mg/g, whereas all the replicates of the DEGASSER sample contained
this trans fatty acid, at an average of 1.13 mg/g. Both ETY samples contained approximately

54
1.80 mg/g of mono-trans EPA. There was little difference between the two samples,
regarding the fatty acid composition. The true amount of trans fatty acids is probably close to
the values presented in this paragraph, where the outliers have been removed, though one
should be careful with removing potential outliers when so few replicates have been tested.
The total amount of trans fatty acids in the ETY 2412 samples was close to 4 mg/g, which
means that these samples have the highest content of trans fatty acids of all the different
process samples in this study. However, 4 mg/g is still low compared to the allowed content
in oils of 20 mg/g.
If there were any “short” trans fatty acids in the samples they were expected to be
found in DTL EE, the distillate light fraction, which is a concentrate of the low boiling point
fatty acids. The highest temperature for this process was 127.7 °C. The trans fatty acids
present in DTL EE were 18:1n-9t and 18:2n-6t, amounting to 0.66±0.58 mg/g and 2.52±1.92
mg/g respectively. The standard deviations were relatively high, and implied some
uncertainty on the real amounts. However, in one of the replicates 18:1n-9t was not detected,
and the other two had peak areas just above the set integration level. The average of the two
replicates in which 18:1n-9t was detected equaled 1.00 mg/g. For 18:2n-6t one of the
replicates showed three times more of this fatty acid than the two other replicates, and if this
high value was removed from the calculations the amount of 18:2n-6t where calculated to be
1.40 mg/g. If the extreme values for each fatty acid was removed the total trans fatty acid
content was 2.40 mg/g, which is about a tenth of the allowed content.
The highest temperature exerted in the DTR EE process was 143 °C. No trans isomers of
any fatty acid was detected in DTR EE. Only 50% of the weight in this sample was attributed
to fatty acids, the rest probably being heavy compounds such as cholesterol, MAG, DAG and
pigments. Because only half the sample was FAEE the trans fatty acids present in this
fraction might have been below the limit of detection. The DTR fraction is not meant for
human consumption directly, but some of the desired fatty acids from this sample, such as
EPA and DHA, can be distilled from the heavier compounds. Such a distillate, having a
higher ratio of FAEE, might have contained some trans fatty acids, even though they were not
detected in this sample. The large standard deviations observed for some of the fatty acids in
DTR EE arose from the FAME not being detected in some replicates and detected in others.
The heavier compounds present in the sample may have interfered with the methylation of the
FAEE, making the injected samples heterogeneous. Since it was known that DTR EE had a
large fraction of heavier compounds blanks were injected between each replicate. This was
done to prevent heavy compounds from interfering with the subsequent analysis.
55
DTD 3020 (R1) and (R1D2) was treated with maximum 127.7 °C and 143 °C,
respectively. R1 was previously separated from DTL EE and contained R1D2 and DTR EE
before entering the second SPD-column, where the latter two fractions were separated. R1
and R1D2 had approximately the same fatty acid composition. Only one trans fatty acid was
detected in both samples. This was one isomer of mono-trans EPA. In R1, the amount of this
trans fatty acid was 2.24 ±0.09 mg/g and in R1D2 it amounted to 2.64±0.07 mg/g. This is a
slight difference, just as there is a slight difference observed for the other fatty acids in these
samples. The total amount of trans fatty acids was low, especially compared to the large
proportions of the healthy omega-3 fatty acids.
By comparing the ETY 2412 samples to DTL EE and the DTD 3020 samples one gets an
indication of whether the trans fatty acids are concentrated along with the other fatty acids.
The same amount of C18:1n-9t was detected in ETY 2412 DEGASSER and DTL EE, as they
both contained approximately 1 mg/g, if disregarding the outlier as discussed previously in
this chapter. C18:1n-9t was not detected in any of the DTD 3020 samples or in the DTR EE
sample. In ETY DEGASSER, 1.13 mg/g of C18:2n-6t was found. The same trans fatty acid
was not detected in the DTD 3020 samples and DTR EE. In DTL EE, 1.40 mg/g of C18:2n-6t
was detected, if the outliers were removed. This indicated a small increase of this trans fatty
acids in the volatile fraction of the distillate. The amount of mono-trans EPA detected in ETY
2412 DEGASSER was 1.86 mg/g, whereas it was not detected in DTL EE or DTR EE. In
DTD 3020 R1, 2.24 mg/g of mono-trans EPA was detected and in DTD 3020 R1D2 2.64
mg/g was detected. There was a slight increase of mono trans EPA in the concentrate.
However, the total content of identified trans fatty acid was reduced in all samples compared
to ETY 2412 degasser. These comparisons of the product entering the concentration process
and the different fractions produced indicate that there is no real danger of concentrates
having very high amounts of trans fatty acids under the present processing conditions. The
trans fatty acids analyzed in this thesis were divided into the two fractions, the shorter trans
fatty acids entered the volatile fraction and the ones entered the concentrate. In total, the
amount of trans fatty acids is reduced from ETY to fish oil concentrate.
Analyses of trans fatty acid content of commercially available marine oils have been
performed. Sciotto & Mjøs (2012) found low amounts of trans fatty acids in all the oil
samples of marine origin. The 1812 oils contained an average of 0.3 ± 0.2%, and fish oil
concentrates contained an average of 0.7 ± 0.6% trans fatty acids. Srigley & Rader (2014)
found an average of 0.4 ± 0.3% trans EPA + trans DHA in their samples of “natural” fish oil
supplements and an average of 0.6 ± 0.4% trans EPA + trans DHA in their samples of fish oil

56
concentrates. Srigley & Rader (2014) did not comment the amount of other trans fatty acids
present in their samples. In the present study, the 1812 fish oils contained an average of 0.2%
trans fatty acids and the concentrates (3020) contained 0.2-0.3% trans fatty acids. The
samples from the processes at Nordic Pharma Inc. were in the lower range compared to
samples of commercially available fish oils.
It has become clear that values of about to 1 mg/g or below, of trans fatty acids, are very
uncertain values because the area is sometimes detected and sometimes not. This may be
solved in two possible ways: one is closer scrutiny of the chromatograms by more manual
integration or setting a lower minimum area. The other solution could be to have more
concentrated samples. The problem with having samples that are too concentrated is the
possibility of broader peaks that may interfere with the integration of neighboring fatty acids
with only a slight difference in retention times.
It has also become clear that the processing conditions applied to the fish oils at Nordic
Pharma Inc. do not have a detrimental effect on the oil when it comes to the formation of
trans fatty acids. A remaining question is where the observed trans fatty acids originate from,
as there was no samples showing any clear increase in trans fatty acids during a specific
processing step. The cis double bonds are the naturally occurring ones in fatty acids, not the
trans double bonds. This means that at some processing point, before the ones that have been
tested here isomerization must have occurred. Trans fatty acids might have been formed
during cooking, pressing, neutralization or they might even have come from the diet of the
fish. This study contained samples from all the high temperature processes at this fish oil
plant and samples from the processes directly preceding the high temperature processes.
However, this study did not have samples of fish oil from processes preceding the bleaching
step. Other negative impacts might arise from the processing conditions applied, such as
oxidation. Oxidation measurements were not part of this thesis, but internal results from
Nordic Pharma Inc. show that under correct and well-controlled production processes,
oxidation is and kept at a minimum and not a quality issue (personal communication
Lødemel).
In the temperature experiment, high but realistic processing temperatures were tested
against time to see how they affected the formation of trans fatty acids in a fish oil
concentrate. The experiment gave clear indications that both time and temperature had an
effect. All the samples that had been heated for one hour showed an increase in the amount of
mono-trans DHA, although the increased amount in the sample that had been heated at 180
°C was very small. At 200 °C an increase in mono-trans DHA could be observed after only

57
15 minutes, indicating that 200 °C is a critical temperature for the formation of trans isomers
from the LC-PUFAs. After one hour at 200 °C more isomers of mono-trans EPA also started
to form. Mjøs & Solvang (2006) performed a similar temperature experiment with fish oil
concentrates and temperatures ranging from 140 to 240 °C at intervals of 2 hours. Their study
found an increase in the amount of mono-trans EPA after 4 hours at 180 °C, and after 2 hours
at 200 °C. Similar results were found for mono-trans DHA, but these started to form after 4
hours at 160 °C and 2 hours at 180 °C. Mjøs & Solvang (2006) did not investigate how one
hour of heat treatment affected the formation of trans EPA and DHA, but data from the
present study, having oils heated for a shorter time, seemed to agree with their data on the
formation of trans fatty acids.
My findings that mono-trans isomers of DHA started to increase before mono-trans
isomers of EPA fits well with the findings in Mjøs & Solvang (2006) and Fournier et al.
(2006 A), but leaves the question whether the mono-trans isomer of EPA observed in several
samples from the processing of fish oil and in all the samples in the temperature experiment
really is mono-trans EPA or some other compound having the same retention time? The fact
that this peak is present in so many samples without accompanying mono-trans DHA, and the
fact that the area of the peak seemed to decrease with increased time of heating, underlines
this uncertainty. One way this could be determined is by mass spectrometry (MS), a tool that
offers a way of confirming the identity of the compound that is detected. The FID detector has
many benefits. It is easy to use, it gives a clear indication of the amount of each compound
that is detected and it is versatile. However, one must rely on the retention time of standards
to identify the compounds in the samples. Several compounds may have the same retention
time on a given stationary phase with a given temperature program. By using MS and
referring to a library of the mass spectra of the possible analytes, one could probably be more
certain of the identity of the compounds being eluted. To verify the increase and decrease of
the different fatty acids, and to be able to calculate the quantities in mg/g, an internal standard
should have been added to the samples in the temperature experiment.
From the results of the temperature experiment, it seems that the conditions applied to
the fish oil in the processing plant do not result in detrimental effects regarding the oils’
content of trans fatty acids. The only process with temperatures close to 200 °C is the
stripping, but the residence time of the oil in the SPD column is very short, and the time of
heating clearly affects the formation of trans fatty acids. The fish oil has a longer residence
time in the deodorizer, but evidently not long enough for the formation of trans fatty acids to
occur. Higher temperatures than 200 °C should have been investigated in the temperature

58
experiment to achieve a better understanding of how temperature and time would have
affected the content of trans fatty acids in the fish oil concentrate, and to establish a
maximum operating temperature. For example one might want to apply higher temperatures
in the SPD stripping for removal of cholesterol. Hence it could be interesting to see how a
short time interval at a higher temperature would have affected the formation of trans fatty
acids.
The total trans fatty acid that was measured and reported in this thesis was not complete,
because standards were not obtained for important trans fatty acids such as C18:3n-3t. This
may have led to an under-estimation of total amount of trans fatty acids. More comprehensive
trans fatty acid standards should have been bought to give a more complete picture, and more
certainty. In addition, standards containing a broader selection of fatty acids should have been
tested to see if there were any rare fatty acids that could have co-eluted with the different
trans standards in the sample. Mjøs & Haugsgjerd (2011) mention the possibility of co-
elution between C16:4n-1, C16:4n-3 and C18:1n-9t on highly polar stationary phases. The
reported amount of C18:1n-9t may be false, the peak may in fact contain a completely
different fatty acid. Even though they did not test SLB-IL111, it is still a possibility that this
could have happened in the present study since no standards containing these highly
unsaturated C16 fatty acids were available.
There are several sources of error in this study that, in hindsight, could have been
checked. A detection limit of the GC peaks should have been investigated using different
concentrations of fatty acids with varying volatility. A response factor between the internal
standard and different fatty acids at varying concentrations should also have been established,
since this would have given a lot more certainty to the calculated amounts of fatty acids
present in the samples. Testing the recovery of samples with known amounts of fatty acids
should also have been performed, to see whether over- or under-estimation was inherent in
the system. There is always some uncertainty involved in chemical analysis, but the goal
should be to reduce this uncertainty as much as possible. No statistical tests were performed
on the data, because the data sets were too small. If more replicates had been tested analyses
of variance could have been performed to establish whether the observed differences were
significant or not. With no such tests it is difficult to conclude on the results obtained,
especially when the amount of trans fatty acids were as small as they were in basically all the
samples.

59
6 Conclusions and further work The main objective of this study was to investigate whether or not trans fatty acids were
formed during the processing of fish oils at Nordic Pharma Inc. The analyses of the samples
indicated that trans fatty acids are not formed under the current processing conditions. Trans
fatty acids were detected, or at least components with the same retention time as the standards
of certain trans fatty acids, but these were present in all the samples in comparable amounts
and therefore one can conclude that the processing conditions did not contribute to the
formation of trans fatty acids. The total trans fatty acid content of concentrates was lower
than the content of the fish oil before concentration. In addition, the observed amounts of
trans fatty acids were well below the permissible amount, set by the authorities in several
countries.
The secondary objective was to establish a method for the analysis of trans fatty acids
present in fish oils. The method for producing trans standards of FAME EPA and DHA, using
PTSA, was successful. The use of HPTLC plates for separation and preparation of the
aforementioned standards also worked out well, so there was no real need for the bigger PLC
plates. The use of a 100 meter SLB-IL111 column proved as efficient as previously reported
columns for separation of trans isomers in fish oil. Some co-elution was observed, but this
has been reported for other columns as well. For the method described in this thesis to be able
to report the total trans fatty acid content, additional standards should be tested that contain a
wider spectrum of all-cis and trans fatty acids.
The temperature experiment showed that high temperatures and long residence time
were necessary for trans fatty acids to form. After one hour at 200 °C, i.e. the harshest
conditions applied, several trans isomers started to form. No process at Nordic Pharma Inc.
applies such high temperatures for this long period of time.
There are a lot of interesting aspects that should be included in future work in this
field. Firstly, a detection limit should be established by testing different concentrations of
known components with different volatilities. Recovery of samples with known amounts of
different fatty acids should be measured against the internal standard, both to see if the system
under- or over-estimates the contents and to see if C23:0 is the best suited internal standard
for this analysis. FAME standards containing a larger variety of fatty acids should be tested to
see if there are more co-elutions and to be able to identify every peak in the chromatogram. It
would also be very interesting to use a GC-MS to gain more certainty to which compounds
were present and to determine if peaks eluting really are trans fatty acids. The temperature
experiment should also be extended to higher temperatures than the ones tested in this study

60
to see how the fish oil concentrates react to different time intervals. This is interesting because
there is a need to test if higher temperatures in the stripping process could remove cholesterol
from the fish oil. Isomerizing for example the GLC 68D standard, which contains many fatty
acids but not DPA, would be very interesting. By doing this one could investigate at what rate
the different isomers of DHA form and establish a correction factor for the isomer co-eluting
with DPA.

61
7 References Acar, N., Bonhomme, B., Joffre, C., Bron, A. M., Creuzot-Garcher, C., Bretillon, L., Doly M.
& Chardigny, J. M. (2006). The retina is more susceptible than the brain and the liver
to the incorporation of trans isomers of DHA in rats consuming trans isomers of alpha-
linolenic acid. Reproduction Nutrition Development, 46, 515-525.
Almendingen, K., Jordal, O., Kierulf, P., Sandstad, B., & Pedersen, J. I. (1995). Effects of
partially hydrogenated fish oil, partially hydrogenated soybean oil, and butter on
serum lipoproteins and Lp [a] in men. Journal of Lipid Research, 36, 1370-1384.
Anderson, J. L., Ding, J., Welton, T., & Armstrong, D. W. (2002). Characterizing ionic
liquids on the basis of multiple solvation interactions. Journal of the American
Chemical Society, 124, 14247-14254.
AOCS (2009) http://lipidlibrary.aocs.org/Silver/bnd_rev/index2.htm (11/12/2014)
AOCS (2011) http://lipidlibrary.aocs.org/Silver/mechanism/index.htm (11/12/2014)
Bannenberg, G., & Serhan, C. N. (2010). Specialized pro-resolving lipid mediators in the
inflammatory response: an update. Biochimica et Biophysica Acta -Molecular and Cell
Biology of Lipids, 1801, 1260-1273.
Bimbo, A. P. (2012) Processing of marine oils. Breivik, H. (Ed.). Long-chain omega-3
specialty oils 2nd
edition (p. 77-109). Cambridge: Woodhead Publishing.
Calder, P. C. (2006). Polyunsaturated fatty acids and inflammation. Prostaglandins,
Leukotrienes and Essential Fatty Acids, 75, 197-202.
Calder, P. C. (2009). Polyunsaturated fatty acids and inflammatory processes: new twists in
an old tale. Biochimie, 91, 791-795.
Calder, P. C. (2012). The role of marine omega‐3 (n‐3) fatty acids in inflammatory processes,
atherosclerosis and plaque stability. Molecular Nutrition & Food Research, 56, 1073-
1080.
Calder, P. C. (2014). Very long chain omega‐3 (n‐3) fatty acids and human health. European
Journal of Lipid Science and Technology, 116, 1280-1300
Campbell, M. K., & Farrell, S. O. (2008). Lipid metabolism. Biochemistry. 6th
edt (p. 607-
644). Belmont: Brooks/Cole, Cengage Learning.
Chardigny, J. M., Sébédio, J. L., Juanéda, P., Vatèle, J. M., & Grandgirard, A. (1995). Effects
of trans n-3 polyunsaturated fatty acids on human platelet aggregation. Nutrition
Research, 15, 1463-1471.
Connor, W. E., Neuringer, M., & Reisbick, S. (1992). Essential fatty acids: The importance of
n‐3 fatty acids in the retina and brain. Nutrition Reviews, 50, 21-29.

62
Crexi, V. T., Grunennvaldt, F. L., de Souza Soares, L. A., & Pinto, L. A. A. (2009).
Deodorisation process variables for croaker (M. furnieri) oil. Food Chemistry, 114,
396-401.
De Greyt, W. F. (2012). Current and future technologies for the sustainable and cost‐efficient
production of high quality food oils. European Journal of Lipid Science and
Technology, 114, 1126-1139.
Delmonte, P., Fardin-Kia, A. R., Kramer, J. K., Mossoba, M. M., Sidisky, L., Tyburczy, C., &
Rader, J. I. (2012). Evaluation of highly polar ionic liquid gas chromatographic
column for the determination of the fatty acids in milk fat. Journal of
Chromatography A, 1233, 137-146.
Delmonte, P., Hu, Q., Kia, A. R. F., & Rader, J. I. (2008). Preparation, chromatographic
separation and relative retention times of cis/trans heptadecaenoic (17: 1) fatty acids.
Journal of Chromatography A, 1214, 30-36.
Eldho, N. V., Feller, S. E., Tristram-Nagle, S., Polozov, I. V., & Gawrisch, K. (2003).
Polyunsaturated docosahexaenoic vs docosapentaenoic acid differences in lipid matrix
properties from the loss of one double bond. Journal of the American Chemical
Society, 125, 6409-6421.
Fardin-Kia, A. R., Delmonte, P., Kramer, J. K., Jahreis, G., Kuhnt, K., Santercole, V., &
Rader, J. I. (2013). Separation of the fatty acids in menhaden oil as methyl esters with
a highly polar ionic liquid gas chromatographic column and identification by time of
flight mass spectrometry. Lipids, 48, 1279-1295.
Feller, S. E., & Gawrisch, K. (2005). Properties of docosahexaenoic-acid-containing lipids
and their influence on the function of rhodopsin. Current Opinion in Structural
Biology, 15, 416-422.
Fournier, V., Juanéda, P., Destaillats, F., Dionisi, F., Lambelet, P., Sébédio, J. L., &
Berdeaux, O. (2006 A). Analysis of eicosapentaenoic and docosahexaenoic acid
geometrical isomers formed during fish oil deodorization. Journal of Chromatography
A, 1129, 21-28.
Fournier, V., Destaillats, F., Lambelet, P., Dionisi, F., Sébédio, J. L., & Berdeaux, O. (2007).
Degradation products formed from long‐chain PUFA during deodorization of fish
oil. Lipid Technology, 19, 9-11.
Fournier, V., Destaillats, F., Juanéda, P., Dionisi, F., Lambelet, P., Sébédio, J. L., &
Berdeaux, O. (2006 B). Thermal degradation of long‐chain polyunsaturated fatty acids

63
during deodorization of fish oil. European Journal of Lipid Science and
Technology, 108, 33-42.
García-Moreno, P. J., Guadix, A., Gómez-Robledo, L., Melgosa, M., & Guadix, E. M. (2013).
Optimization of bleaching conditions for sardine oil. Journal of Food
Engineering, 116, 606-612.
Gunstone, F.D. (2012) Omega-3 fatty acids – Introduction. Breivik, H. (Ed.). Long-chain
omega-3 specialty oils 2nd
edition (p. 1-22). Cambridge: Woodhead Publishing.
Gunstone, F. D. (2011) The world’s oils and fats. Turchini, G. M., Ng, W. K., & Tocher, D.
R. (Eds.). Fish oil replacement and alternative lipid sources in aquaculture feeds (p.
61-95). Boca Raton: CRC Press.
Gunstone, F. D., Ismail, I. A. & M. Lie Ken Jie (1967). Fatty acids, part 16. Thin layer and
gas-liquid chromatographic properties of the cis and trans methyl octadecenoates and
of some acetylenic esters. Chemistry and Physics of Lipids, 1, 376-385.
Helse- og omsorgsdepartementet (2014) (https://lovdata.no/dokument/SF/forskrift/2014-01-
16-34) (03/03/2015)
Ho, T. D., Zhang, C., Hantao, L. W., & Anderson, J. L. (2013). Ionic liquids in analytical
chemistry: fundamentals, advances, and perspectives. Analytical Chemistry, 86, 262-
285.
Jain, A. P., Aggarwal, K. K., & Zhang, P. Y. (2015). Omega-3 fatty acids and cardiovascular
disease. European Review for Medical and Pharmacological Sciences, 19, 441-445.
Kemény, Z. S., Recseg, K., Henon, G., Kővári, K., & Zwobada, F. (2001). Deodorization of
vegetable oils: prediction of trans polyunsaturated fatty acid content. Journal of the
American Oil Chemists' Society, 78, 973-979.
Kris-Etherton, P. M., Grieger, J. A., & Etherton, T. D. (2009). Dietary reference intakes for
DHA and EPA. Prostaglandins, Leukotrienes and Essential Fatty Acids, 81, 99-104.
Kris-Etherton, P. M., Harris, W. S., & Appel, L. J. (2002). Fish consumption, fish oil, omega-
3 fatty acids, and cardiovascular disease. Circulation, 106, 2747-2757.
Laake, I., Pedersen, J. I., Selmer, R., Kirkhus, B., Lindman, A. S., Tverdal, A., & Veierød, M.
B. (2012). A prospective study of intake of trans-fatty acids from ruminant fat,
partially hydrogenated vegetable oils, and marine oils and mortality from CVD. Br J
Nutr, 108, 743-54.
Laake, I., Carlsen, M. H., Pedersen, J. I., Weiderpass, E., Selmer, R., Kirkhus, B., Thune I., &
Veierød, M. B. (2013). Intake of trans fatty acids from partially hydrogenated

64
vegetable and fish oils and ruminant fat in relation to cancer risk. International
Journal of Cancer, 132, 1389-1403.
Loi, C., Chardigny, J. M., Cordelet, C., Leclere, L., Genty, M., Ginies, C., Noël, J.P. &
Sebedio, J. L. (2000). Incorporation and metabolism of trans 20∶ 5 in endothelial cells.
Effect on prostacyclin synthesis. Lipids, 35, 911-918.
Lopez-Garcia, E., Schulze, M. B., Meigs, J. B., Manson, J. E., Rifai, N., Stampfer, M. J.,
Willett W.C., & Hu, F. B. (2005). Consumption of trans fatty acids is related to
plasma biomarkers of inflammation and endothelial dysfunction. The Journal of
Nutrition, 135, 562-566.
McMurry, J. E. (2008) Organic Chemistry (8th
edt). International Edition: Brooks/Cole
Cengage Learning.
Menaa, F., Menaa, A., Menaa, B., & Tréton, J. (2013). Trans-fatty acids, dangerous bonds for
health? A background review paper of their use, consumption, health implications and
regulation in France. European Journal of Nutrition, 52, 1289-1302.
Mjøs, S. A. (2005). Properties of trans isomers of eicosapentaenoic acid and docosahexaenoic
acid methyl esters on cyanopropyl stationary phases. Journal of Chromatography
A, 1100, 185-192.
Mjøs, S. A. (2008). Retention behavior of trans isomers of eicosapentaenoic and
docosahexaenoic acid methyl esters on a polyethylene glycol stationary
phase. European Journal of Lipid Science and Technology, 110, 547-553.
Mjøs, S. A., & Haugsgjerd, B. O. (2011). Trans fatty acid analyses in samples of marine
origin: the risk of false positives. Journal of Agricultural and Food Chemistry, 59,
3520-3531.
Mjøs, S. A., & Solvang, M. (2006). Geometrical isomerisation of eicosapentaenoic and
docosahexaenoic acid at high temperatures. European Journal of Lipid Science and
Technology, 108, 589-597.
Morris, L. J. (1966). Separations of lipids by silver ion chromatography. Journal of Lipid
Research, 7, 717-732.
Morris, L. J., Wharry, D. M., & Hammond, E. W. (1967). Chromatographic behaviour of
isomeric long-chain aliphatic compounds: II. Argentation thin-layer chromatography
of isomeric octadecenoates. Journal of Chromatography A, 31, 69-76.
Mozaffarian, D., Katan, M. B., Ascherio, A., Stampfer, M. J., & Willett, W. C. (2006). Trans
fatty acids and cardiovascular disease. New England Journal of Medicine, 354, 1601-
1613.

65
Napier, J. A., & Sayanova, O. (2005). The production of very-long-chain PUFA biosynthesis
in transgenic plants: towards a sustainable source of fish oils.Proceedings of the
Nutrition Society, 64, 387-393.
Neuringer, M., Connor, W. E., Lin, D. S., Barstad, L., & Luck, S. (1986). Biochemical and
functional effects of prenatal and postnatal omega 3 fatty acid deficiency on retina and
brain in rhesus monkeys. Proceedings of the National Academy of Sciences, 83, 4021-
4025.
Nikolova-Damyanova, B. (2009). Retention of lipids in silver ion high-performance liquid
chromatography: Facts and assumptions. Journal of Chromatography A, 1216, 1815-
1824.
Olli, J. J., Breivik, H., & Thorstad, O. (2013). Removal of persistent organic pollutants in fish
oils using short-path distillation with a working fluid. Chemosphere, 92, 273-278.
Oomen, C. M., Ocké, M. C., Feskens, E. J., van Erp-Baart, M. A. J., Kok, F. J., & Kromhout,
D. (2001). Association between trans fatty acid intake and 10-year risk of coronary
heart disease in the Zutphen Elderly Study: a prospective population-based study. The
Lancet, 357, 746-751.
Ortiz, X., Carabellido, L., Martí, M., Martí, R., Tomás, X., & Díaz-Ferrero, J. (2011).
Elimination of persistent organic pollutants from fish oil with solid
adsorbents. Chemosphere, 82, 1301-1307.
Oterhals, Å., & Berntssen, M. H. (2010). Effects of refining and removal of persistent organic
pollutants by short-path distillation on nutritional quality and oxidative stability of fish
oil. Journal of Agricultural and Food Chemistry, 58, 12250-12259.
Ragonese, C., Sciarrone, D., Tranchida, P. Q., Dugo, P., & Mondello, L. (2012). Use of ionic
liquids as stationary phases in hyphenated gas chromatography techniques. Journal of
Chromatography A, 1255, 130-144.
Ratnayake, W. N., Hansen, S. L., & Kennedy, M. P. (2006). Evaluation of the CP-Sil 88 and
SP-2560 GC columns used in the recently approved AOCS official method Ce 1h-05:
Determination of cis-, trans-, saturated, monounsaturated, and polyunsaturated fatty
acids in vegetable or non-ruminant animal oils and fats by capillary GLC method.
Journal of the American Oil Chemists' Society, 83, 475-488.
Salem Jr, N., & Eggersdorfer, M. (2015). Is the world supply of omega-3 fatty acids adequate
for optimal human nutrition?. Current Opinion in Clinical Nutrition & Metabolic
Care, 18, 147-154.

66
Salem Jr, N., Litman, B., Kim, H. Y., & Gawrisch, K. (2001). Mechanisms of action of
docosahexaenoic acid in the nervous system. Lipids, 36, 945-959.
Sciotto, C., & Mjøs, S. A. (2012). Trans Isomers of EPA and DHA in Omega-3 Products on
the European Market. Lipids, 47, 659-667.
Schmitz, G., & Ecker, J. (2008). The opposing effects of n− 3 and n− 6 fatty acids. Progress
in Lipid Research, 47, 147-155.
Sidhu, K. S. (2003). Health benefits and potential risks related to consumption of fish or fish
oil. Regulatory Toxicology and Pharmacology, 38, 336-344.
Simopoulos, A. P. (2006). Evolutionary aspects of diet, the omega-6/omega-3 ratio and
genetic variation: nutritional implications for chronic diseases. Biomedicine &
Pharmacotherapy, 60, 502-507.
Snyder, J. M., & Scholfield, C. R. (1982). cis-trans isomerization of unsaturated fatty acids
with p-toluenesulfinic acid. Journal of the American Oil Chemists Society, 59, 469-
470.
Srigley, C. T., & Rader, J. I. (2014). Content and Composition of Fatty Acids in Marine Oil
Omega-3 Supplements. Journal of Agricultural and Food Chemistry, 62, 7268-7278.
Tocher, D. R. (2015). Omega-3 long-chain polyunsaturated fatty acids and aquaculture in
perspective. Aquaculture. (doi:10.1016/j.aquaculture.2015.01.010)
Twu, P., Zhao, Q., Pitner, W. R., Acree, W. E., Baker, G. A., & Anderson, J. L. (2011).
Evaluating the solvation properties of functionalized ionic liquids with varied
cation/anion composition using the solvation parameter model. Journal of
Chromatography A, 1218, 5311-5318.
Usydus, Z., Szlinder-Richert, J., Polak-Juszczak, L., Malesa-Ciećwierz, M., & Dobrzański, Z.
(2009). Study on the raw fish oil purification from PCDD/F and dl-PCB-industrial
tests. Chemosphere, 74, 1495-1501.
Varga, T., Czimmerer, Z., & Nagy, L. (2011). PPARs are a unique set of fatty acid regulated
transcription factors controlling both lipid metabolism and inflammation. Biochimica
et Biophysica Acta -Molecular Basis of Disease, 1812, 1007-1022.
VKM (2011). Description of the processes in the value chain and risk assessment of
decomposition substances and oxidation products in fish oils. Oslo, Norwegian
Scientific Committee for Food Safety (VKM).

67
Wall, R., Ross, R. P., Fitzgerald, G. F., & Stanton, C. (2010). Fatty acids from fish: the anti-
inflammatory potential of long-chain omega-3 fatty acids. Nutrition Reviews, 68, 280-
289
Weber, W., & Andersson, J. T. (2014). Ionic liquids as stationary phases in gas
chromatography—an LSER investigation of six commercial phases and some
applications. Analytical and Bioanalytical Chemistry, 406, 5347-5358.
Zeng, A. X., Chin, S. T., Nolvachai, Y., Kulsing, C., Sidisky, L. M., & Marriott, P. J. (2013).
Characterisation of capillary ionic liquid columns for gas chromatography–mass
spectrometry analysis of fatty acid methyl esters. Analytica Chimica Acta, 803, 166-
173