trans. inst. indian geographers hybrid image classiication...
TRANSCRIPT

Trans. Inst. Indian Geographers
Hybrid Image Classiication Technique for Spatio-temporal Analysis of Pune City
Ravindra G. Jaybhaye and Nitin N. Mundhe, Pune, Maharashtra
Introduction
India is the second largest country after
China in population and is projected to cross
China’s population with 1.5 billion people by
2040.The urban population in India increased
from 62.4 million in the year 1951 to 377.1
million in 2011. It is estimated to grow to
around 540 million by the year 2021. To
sustain this rapid urban development should
be planned in a sustainable manner to fulill all the utility services like infrastructure,
transportation, water supply, sanitation and
drainage etc. urban developers, planners and
administrators should have knowledge of
the present trend of urbanisation. Therefore
there is need to understand the pattern of
built-up land over period of time using
advanced techniques of remote sensing and
geographical information system.
Abstract
Classiication techniques in remotely sensed image interpretation are based on spectral relectance values with an assumption of the training data being normally distributed. Hence it is dificult to add ancillary data in exiting classiication procedures to improve accuracy. In hybrid classiication technique, integration of Geographical Information System and remote sensing data has become important techniques for change detection applications. This paper
emphasizes on a hybrid image classiication approach for remotely sensed images obtained from various sensors viz. IRS LISS-II and LISS-III are used. The proposed classiication approach effectively integrates ancillary information into the classiication process and combines ISODATA clustering, rule-based classiier and the Multilayer Perceptron (MLP) classiier which uses artiicial neural network (ANN) that produce higher accuracy classiied map. This technique has been applied to produce high accuracy map of Pune city.
Keywords: Hybrid Classiication, GIS, Remote Sensing, Spatial-temporal Analysis
The spatio-temporal change detection
analysis includes the integration of GIS
and remote sensing methods and the output
in pure GIS platform. The advantage of
using GIS is the ability to incorporate
different source data into change detection
applications (Lo and Shipman, 1990). In
recent years, incorporation of multi-source
data (e.g. aerial photographs, TM, IRS and
previous thematic maps) has become an
important method for land-use and land-
cover (LULC) change detection (Mouat and
Lancaster 1996, Salami 1999, Salami et al.
1999, Reid et al. 2000, Petit and Lambin
2001, Chen 2002, Weng 2002). Especially,
when the change detection involved long
period intervals associated with different
data sources, formats and accuracies or
multi-scale land-cover change analysis
(Petit and Lambin 2001). Weng (2002)

214 | Transactions | Vol. 35, No. 2, 2013
has used the integration of remote sensing,
GIS and stochastic modelling to detect
land-use change in the Zhujiang Delta of
China and indicated that such integration
was an effective approach for analysing the
direction, rate and spatial pattern of land-
use change. Yang and Lo (2002) has used
an unsupervised classiication approach, GIS-based image spatial reclassification
and post-classiication comparison with GIS overlay to map the spatial dynamics of urban
land-use/land-cover change in the Atlanta
and Georgia metropolitan area.
Most previous applications of GIS and
remote sensing methods in change detection
analysis were focused on urban studies.
This is probably because traditional change
detection methods often have poor change
detection results due to the complexity of
urban landscapes, coarse resolution and also
these techniques could not eficient to use multi-source data analysis.
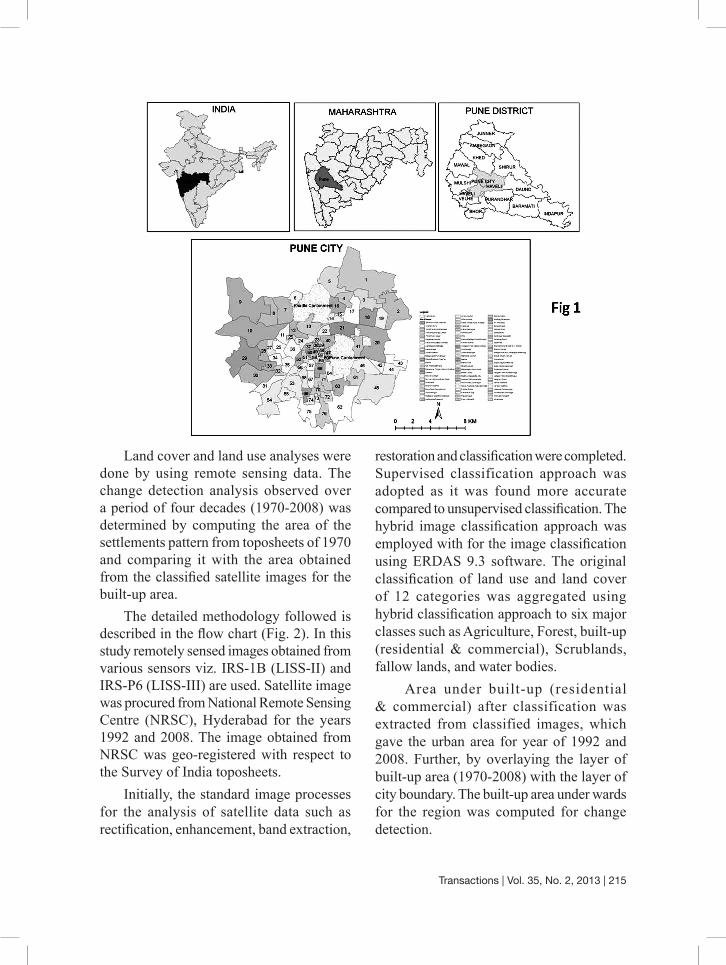
Study Area
Pune city lies between latitudes 18° 25’N and
18° 37’N and longitudes between73° 44’E
and 73° 57’E and cover an area of 250.56
sq km with a population of over 3 million
composed of 76 general electoral wards. On
the basis of 2011 census, these wards were
converted in 14 administrative wards by
Pune Municipal Corporation (PMC).
Pune city is located at an altitude of
560m above mean sea level. The city is
bounded by Thane district to the north-west,
Raigad district to the west, Satara district to
the south, Solapur district to the south-east
and Ahmednagar district to the north and
north-east (Fig 1).
Pune has emerged as a prominent
location for manufacturing industries, and
has now been recognized as the information
technology hub and education hub of the
country. The rapid growth of the city has
transformed from its character as Pensioner’s
city to Educational – Administrative Center
and now to a bustling economic center.
Problem DeinitionChang detection analysis of land use / land
cover classes are not easily separated using
spectral brightness values and dificult to add ancillary data in classiication procedures.
This work is motivated and guided
by the research need to apply a new
classiication technique for higher accuracy. The proposed classification approach is
effectively integrates ancillary information
into the classiication process.
Research Objectives
The main objectives of the present paper are:• To identify existing land use and land
cover of study area.
• To study changing pattern of built-
up area using hybrid classification
technique.
Methodology
The complexity of a dynamic phenomenon
such as urban growth could be understood
with the analysis of land use/ land cover
changes. At the irst toposheets shown in Table 1 were scanned and geo referenced
using WGS 1984 UTM Zone 43N Projection.
Various GIS layers such as built-up area,
roads and railway network, contour, drainage
network and administrative boundaries from
Survey of India toposheets were digitized
using Arc GIS 9.3 software.
Transactions | Vol. 35, No. 2, 2013 | 215
Land cover and land use analyses were
done by using remote sensing data. The
change detection analysis observed over
a period of four decades (1970-2008) was
determined by computing the area of the
settlements pattern from toposheets of 1970
and comparing it with the area obtained
from the classiied satellite images for the built-up area.
The detailed methodology followed is
described in the low chart (Fig. 2). In this study remotely sensed images obtained from
various sensors viz. IRS-1B (LISS-II) and
IRS-P6 (LISS-III) are used. Satellite image
was procured from National Remote Sensing
Centre (NRSC), Hyderabad for the years
1992 and 2008. The image obtained from
NRSC was geo-registered with respect to
the Survey of India toposheets.
Initially, the standard image processes
for the analysis of satellite data such as
rectiication, enhancement, band extraction,
restoration and classiication were completed. Supervised classification approach was
adopted as it was found more accurate
compared to unsupervised classiication. The hybrid image classiication approach was employed with for the image classiication using ERDAS 9.3 software. The original
classiication of land use and land cover of 12 categories was aggregated using
hybrid classiication approach to six major classes such as Agriculture, Forest, built-up
(residential & commercial), Scrublands,
fallow lands, and water bodies.
Area under built-up (residential
& commercial) after classification was
extracted from classified images, which
gave the urban area for year of 1992 and
2008. Further, by overlaying the layer of
built-up area (1970-2008) with the layer of
city boundary. The built-up area under wards
for the region was computed for change
detection.

216 | Transactions | Vol. 35, No. 2, 2013
Data Collection
The data collection involved collection of
toposheets, ward maps, satellite data and
demographic details. The nature of these
data and their source are shown in Table 1.
The Survey of India toposheets of 1:25,000 scale was used for the current study of the
following features:• Drainage, water bodies;
• Contours;
• Built-up area;
• Roads and rail network; and
• Administrative boundaries.
Other data sources are satellite images
of Pune city (IRS 1 B LISS-II (1992) and
IRS P6 LISS- III of 2008), various maps
collected from published materials and
from related web sites.
Field Work
Field work is important step ground truth
of the results to understand the land use
/ land cover change of study area. This
step indicates the visit to the study area
in different time or seasons using Global
Poisoning System (GPS) surveys and digital
photographs. That helped to understand the
existing land use / land cover and the actual
changes that took place in the study area
from 1970 to 2008.
Table 1: Primary and secondary data details for the study area
Segment : Pune City Sources
Toposheets No. 47F/14/1 to 47F/14/6
F/15/NE, F/15/NW and 47F/15/SE
Survey of India, scale 1:25000
Google Image Internet
Satellite Imagery - LISS III; Path: 100 Row: 64 & Path: 99 Row: 65
National Remote Sensing Center (NRSC),
Hyderabad
Demographic details from Primary Census
abstracts for, 1991 , 2001 and 2011
Directorate of census operations, Census of
India
All Secondary data
(Demographic, Landuse/ Landcover etc.)
City Development Plan [CDP]
(2006-2012)
Ward map and Administrative Boundary Pune Municipal Corporation (PMC)
Result and Discussion
Land Utilization:
The irst town planning scheme was prepared for Shivaji Nagar in 1918 and a Master plan
was prepared in 1952 for the Poona city. The
irst Development Plan (DP), for PMC was prepared in 1966 (10 year horizon till 1976)
in accordance with the new legislation that is
the Maharashtra Town and Country Planning
Act, 1966. Revision was made in 1982
which was sanctioned by the GoM in 1987.
The second DP was prepared for horizon of
20 year (to be valid till 2007) for PMC area
of 138.36 sq. km. In 2001, PMC jurisdiction
was extended by merging 23 neighboring
villages (in parts) and DP was exclusively

Transactions | Vol. 35, No. 2, 2013 | 217
Fig. 2 : Flowchart of Methodology
prepared for this fringe area for a horizon
of 20 years (valid till 2021). The combined
percentage distribution for various land
utilization categories is presented in the
Fig. 3. It is evident that the developed area
is almost 70 % of the total land utilization
leaving only 30 % for ecological resources.
The percentage of green area and forest adds
together to 20%.
Built-up area from Toposheets (1970):
The built-up area for 1970 was extracted
from the digitized SOI toposheets scale of
1:25,000 and is shown in ig 4 (see page 210). Then built-up area was computed by
overlaying the layer with administrative
boundaries and added to the attribute
database for further analysis.

218 | Transactions | Vol. 35, No. 2, 2013
Built-up area from Satellite Images (1992
& 2008):
Land use / land cover classes that are not
easily separated using spectral brightness
values, ancillary data have often been
used. Ancillary data such as elevation,
slope, aspect, soil, and hydrology have
been incorporated directly into hybrid
classiication.The methodology for the hybrid
classification considered three different
classiiers that are commonly used in remote sensing image classiication i.e. knowledge based (expert) classiication, unsupervised and a non- parametric classiier, multi-layer perceptron (MLP) that utilizes artificial
neural network. The approach was to
combine the three classiiers to classify the satellite image data with ancillary geo-spatial
data and form a multiple classiier system which combined the relative strengths from
the different classiiers and applied them in a sequence in such a way that the overall
accuracy was the maximized.
First, a knowledge based classiication was applied after gathering knowledge in
the form of hierarchical rule set. Then, the
pixels that were not being classiied by the rules were masked out and an ISODATA
clustering was applied to classify those
pixels and then they were merged with the
previous classiied pixels. A MLP classiier with two hidden layers was applied which
took the three or four bands of IRS image.
Finally those classes of each classifier
having higher kappa values were merged
together to get the inal classiied image.Fig. 5 (see page 211) the classified
satellite images of Liss-II and ig. 6 (see page 211) Liss-III are classiied by using the hybrid classiication method. Binary maps of urban extents showing land use/ land cover classes
were extracted from the classiied images. Land use/land cover layers of 1992 and 2008
showing six classes named as agriculture,
settlement, river and lakes, vegetation, fallow
land and scrub land have been prepared with
the help of classiied images.
Fig. 3 Land Utilization PMC (1987 DP +2001 DP) (Source: Revising CDP of Pune city-2041)

Transactions | Vol. 35, No. 2, 2013 | 219
Accuracy Assessment
To check the accuracy of the land use /
land cover classiication with ground truth data before it can be used in scientific
investigations and decision making policies
(Jensen, 2005). The results of the accuracy
assessments were used to compare the results
of the different classiication techniques. A stratiied random sampling technique was applied for collecting the ground truth data
for accuracy assessment. In this technique
a minimum number of samples are selected
from each class and samples are allocated
to all the classes for accuracy assessment
without depending on the proportion of
each individual class in the entire study
area. Sample data (pixels) collected for two
ways, one for training base and the other
for testing.
Overall Accuracy:
The overall accuracy is determined by the
sum of all samples on the diagonal (total
correct pixels) divided by the total number
of samples. Table 2 and 3 shows the overall
accuracies for each of the three different
classiiers.
Table 2 : Comparison of overall accuracies
for the three different classifiers of LISS-II
Classiied Satellite image (1992).
Classiiers Total
number
of pixels
Number
of correct
pixels
Overall
accuracy
%
Unsupervised
ISODATA
clustering
75 54 72.00
Supervised
classiication with Feature
Analyst
75 49 65.33
Proposed
Hybrid
Classiier75 61 81.33
Table 3 : Comparison of overall accuracies
for the three different classiiers of LISS-III Classiied Satellite image (2008).
Classiiers Total
number
of pixels
Number
of correct
pixels
Overall
accuracy
%
Unsupervised
ISODATA
clustering
90 65 72.22
Supervised
classiication with Feature
Analyst
90 61 67.78
Proposed
Hybrid
Classiier90 73 81.11
Table 2 shows LISS-II (1992) classiied satellite image represent the hybrid classiier had the highest overall accuracy rate of
81.33% (61 correct pixels out of 75) in
comparison to unsupervised ISODATA
clustering (72.00%; 54 out of 75) and
supervised classification with Feature
Analyst (65.33%; 49 out of 75), having the
lowest overall accuracy.
Table 3 shows LISS-III (2008) classiied satellite image represent the hybrid classiier had the highest overall accuracy rate of
81.11% (73 correct pixels out of 90) in
comparison to unsupervised ISODATA
clustering (72.22%; 65 out of 90) and
supervised classification with Feature
Analyst (67.78%; 61 out of 90), having the
lowest overall accuracy.

220 | Transactions | Vol. 35, No. 2, 2013
The Kappa Statistic:
Accuracy assessment which uses Khat
statistic as a measure of agreement or
accuracy between classified map and
reference data (Jensen, 2005). Khat
uses
the major diagonal elements of the error
matrix and the chance agreement indicated
by the row and column totals (marginals),
thus considering interclass agreement. Khat
statistic is computed as (Jensen, 2005,
Congalton, 1991):
where k is the number of rows in the
matrix, xii is the number of observation in row i
and column i, and xi+ and x+I are the marginal
totals for row i and column i, respectively, and
N is the total number of observations.
Kappa coeficient ranges between Table 4: Comparison of the kappa values for
the three classiiers
Classiied Satellite
Image
Unsupervised
ISODATA
clustering
Supervised
classiication with Feature
Analyst
Proposed
Hybrid
Classiier
LISS-II
(1992)
0.62 0.57 0.73
LISS-III
(2008)
0.64 0.59 0.74
0-1 and a negative kappa is an indicator of
very poor classiication (Lillesand et al., 2004). Table 4 shows compar ison of
the proposed hybrid classifier with two
other standard classification techniques: unsupervised ISODATA clustering and
supervised classiication with Feature Analyst, a comparison between 1992 and 2008.
The overall kappa values (Table
4) also suggest that the proposed hybrid
classiier 0.73 (LISS-II) and 0.74 (LISS-III) are superior to unsupervised ISODATA
clustering and supervised classiication with Feature Analyst.
This research showed that using the
hybrid classiication technique to classify IRS data to achieve higher classiication accuracy than other classiication techniques used in this area.
Comparison of Built-up area of Pune
city from 1970-2008:
The land use / land cover changes were
studied from Survey of India toposheets
and LISS II and III satellite image. The
study mainly concentrated on the built-up
area, since that was considered as prime
indicator of urban development. The built-
up area of 1992 and 2008 from satellite
image was converted raster into vector data
set in Arc GIS software and was compared
with the toposheet of 1970-71.
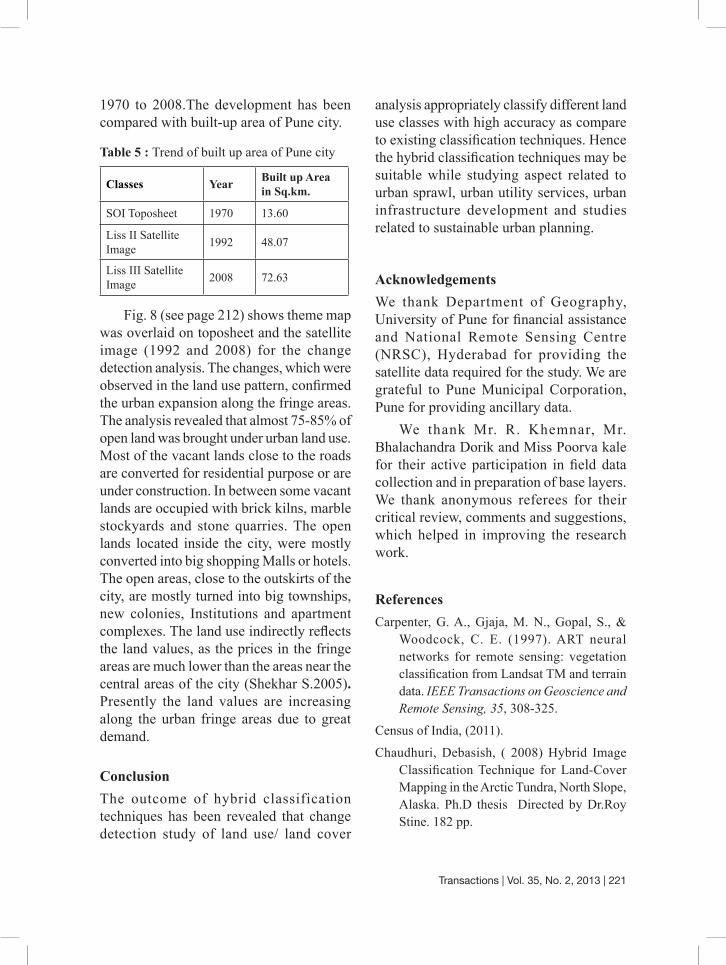
Fig. 7 demonstrated the trend of built-up
area of Pune during 1970 was just 13.60 km²
and in 2008, it was 72.63 km².
However, the result of the table 5 shows
a rapid growth in built-up land between
Fig. 7 Trend of built up area from 1970 to 2008
Transactions | Vol. 35, No. 2, 2013 | 221
1970 to 2008.The development has been
compared with built-up area of Pune city.
Table 5 : Trend of built up area of Pune city
Classes YearBuilt up Area
in Sq.km.
SOI Toposheet 1970 13.60
Liss II Satellite
Image1992 48.07
Liss III Satellite
Image2008 72.63
Fig. 8 (see page 212) shows theme map
was overlaid on toposheet and the satellite
image (1992 and 2008) for the change
detection analysis. The changes, which were
observed in the land use pattern, conirmed the urban expansion along the fringe areas.
The analysis revealed that almost 75-85% of
open land was brought under urban land use.
Most of the vacant lands close to the roads
are converted for residential purpose or are
under construction. In between some vacant
lands are occupied with brick kilns, marble
stockyards and stone quarries. The open
lands located inside the city, were mostly
converted into big shopping Malls or hotels.
The open areas, close to the outskirts of the
city, are mostly turned into big townships,
new colonies, Institutions and apartment
complexes. The land use indirectly relects the land values, as the prices in the fringe
areas are much lower than the areas near the
central areas of the city (Shekhar S.2005).
Presently the land values are increasing
along the urban fringe areas due to great
demand.
Conclusion
The outcome of hybrid classification
techniques has been revealed that change
detection study of land use/ land cover
analysis appropriately classify different land
use classes with high accuracy as compare
to existing classiication techniques. Hence the hybrid classiication techniques may be suitable while studying aspect related to
urban sprawl, urban utility services, urban
infrastructure development and studies
related to sustainable urban planning.
Acknowledgements
We thank Department of Geography,
University of Pune for inancial assistance and National Remote Sensing Centre
(NRSC), Hyderabad for providing the
satellite data required for the study. We are
grateful to Pune Municipal Corporation,
Pune for providing ancillary data.
We thank Mr. R. Khemnar, Mr.
Bhalachandra Dorik and Miss Poorva kale
for their active participation in ield data collection and in preparation of base layers.
We thank anonymous referees for their
critical review, comments and suggestions,
which helped in improving the research
work.
References
Carpenter, G. A., Gjaja, M. N., Gopal, S., &
Woodcock, C. E. (1997). ART neural
networks for remote sensing: vegetation classiication from Landsat TM and terrain data. IEEE Transactions on Geoscience and
Remote Sensing, 35, 308-325.
Census of India, (2011).
Chaudhuri, Debasish, ( 2008) Hybrid Image
Classiication Technique for Land-Cover Mapping in the Arctic Tundra, North Slope,
Alaska. Ph.D thesis Directed by Dr.Roy
Stine. 182 pp.

222 | Transactions | Vol. 35, No. 2, 2013
City Development Plan (CDP) of Pune City from
2006-2012
Congalton, R.G. (1996). Accuracy Assessment: A Critical Component of Land Cover
Mapping. In Scott, J.M., Tear, T.H., &
Davis, F., (Eds.), Gap analysis: a landscape
approach to biodiversity planning (pp. 119–
131). American Society for Photogrammetry
and Remote Sensing.
Desai C.G., Patil M.B., Mahale V.D. and
Umrikar B. (2009) Application of remote
sensing and geographic information system
to study land use / land cover changes: a case study of Pune Metropolis, Advances in
Computational Research, ISSN: 0975–3273, Volume 1, Issue 2, 2009, pp-10-13
Environment Status Report of PMC (2001 to
2012)
ERDAS Imagine Field Guide. (2011).
ESRI, ArcGIS Desktop Help. (2010).
Jensen, J. R. (2005). Introductory Digital Image
Processing: A Remote Sensing Perspective.
NJ: Prentice Hall.
Jensen, J.R., Qiu, F. & Patterson, K. (2001).
A Neural Network Image Interpretation
System to Extract Rural and Urban Land Use
and Land Cover Information from Remote
Sensor Data. GeoCarto International,
A Multidisciplinary Journal of Remote
Sensing and GIS, 16, 19-28.
Lillesand, M.S, Kiefer, R.W.and Chipman,
J. W., (2004) Remote Sensing Image
Interpreatation, John Wiley and Sons.
Liu, X.H., Skidmore, A.K. & Oosten, H.V.
(2002). Integration of Classiication
Methods for Improvements of Land-cover Map
Accuracy, ISPRS Journal of
Photogrammetry & Remote Sensing, 56, 257-
268.
Lo, C. P., and Shipman, R. L., (1990) A GIS
approach to land-use change dynamics
detection. Photogrammetric Engineering
and Remote Sensing, 56, 1483–1491.
Lu, D. S., Mausel, P., Brondi´Zio, E. S., and
Moran, E., (2002) Change detection of
successional and mature forests based
on forest stand characteristics using
multitemporal TM data in the Altamira,
Brazil. XXII FIG International Congress,
ACSM–ASPRS Annual Conference
Proceedings, Washington, DC, USA, 19–26
April (Bethesda, MD: American Society of Photogrammetry and Remote Sensing)
(CD-ROM).
Mouat, D. A., and Lancaster, J., (1996) Use
of remote sensing and GIS to identify
vegetation change in the upper San
Pedro river watershed, Arizona. Geocarto
International, 11, 55–67.
National Resource Research Institute (1997).
Land cover characteristics based on Landsat
Imagery. Retreived on July19, 2005, from
www.nrri.umn.edu/toolik/vegetation.html.
Shekhar S.(2005) Monitoring urban sprawl of
Pune city by using RS & GIS Techniques.,
Ph.D thesis submitted to University of Pune.
Singh, A., (1989) Digital change detection
techniques using remotely sensed data.
International Journal of Remote Sensing,
10, 989–1003.
Skidmore, A.K., Turner, B.J., Brinkhof, W.,
& Knowles, E. (1997). Performance of a
neural network: mapping forests using GIS and remote sensing data. Photogrammetric
Engineering and Remote Sensing, 63, 501-
514.
Stow, D., Coulter, L., Kaiser, J., et al. (2003).
Irrigated Vegetation Assessment for Urban
Environments. Photogrammetric Engineering
and Remote Sensing, 69, 381-390.

Transactions | Vol. 35, No. 2, 2013 | 223
Sudhira, H. S., & Ramachandra, T. V. Karthik S.
Raj And Jagadish K.S. (2003). Urban Growth
Analysis Using Spatial and Temporal Data,
Journal of the Indian Society of Remote
Sensing, Vol. 31, No. 4, 2003
Sulochana Shekhar, Changing space of Pune,
A GIS perspective GIS & Development
Map world form Hyderabad India paper ref
MWFPN 116
Taubenböck H., Wegmann M., Berger C.
,Breunig M. (2008) Spatiotemporal Analysis
of Indian Mega Cities, The International
Archives of the Photogrammetry, Remote
Sensing and Spatial Information Sciences.
Vol. XXXVII. Part B2. Beijing 2008
Petit, C. C., And Lambin, E. F., (2001) Integration
of multi-source remote sensing data for
land cover change detection. International
Journal of Geographical Information
Science, 15, 785–803.
Updating City Development Plan (CDP) of Pune
City – 2041
Van Genderen, J. L. and Lock, B. F. (1976) Testing
Land-use map Accuracy. Photogrammetric
Engineering and Remote Sensing, 43 (9): 1135-1137
Ravindra G. Jaybhaye
Associate Professor,
Department of Geography,
University of Pune, India
Nitin N. Mundhe
Assistant Professor,
Department of Geography,
S. P. College, Pune
