trajectory voting and classification based on
TRANSCRIPT

Trajectory Voting and Classification based on
Spatiotemporal Similarity in Moving ObjectDatabases
Costas Panagiotakis1, Nikos Pelekis2, and Ioannis Kopanakis3
1 Dept. of Computer Science, University of Crete, P.O. Box 2208, Greece,[email protected]
2 Dept. of Informatics, University of Piraeus, Greece, [email protected] E-Business Intelligence Lab, Dept. of Marketing, Technological Educational
Institute of Crete, Greece [email protected]
Abstract. We propose a method for trajectory classification based ontrajectory voting in Moving Object Databases (MOD). Trajectory votingis performed based on local trajectory similarity. This is a relatively newtopic in the spatial and spatiotemporal database literature with a varietyof applications like trajectory summarization, classification, searchingand retrieval. In this work, we have used moving object databases inspace, acquiring spatiotemporal 3-D trajectories, consisting of the 2-Dgeographic location and the 1-D time information. Each trajectory ismodelled by sequential 3-D line segments. The global voting method isapplied for each segment of the trajectory, forming a local trajectorydescriptor. By the analysis of this descriptor the representative paths ofthe trajectory can be detected, that can be used to visualize a MOD. Ourexperimental results verify that the proposed method efficiently classifiestrajectories and their sub-trajectories based on a robust voting method.
1 Introduction
Nowadays, there is a tremendous increase of moving objects databases due tolocation-acquisition technologies like GPS and GSM networks [1], and to com-puter vision based tracking techniques [2]. This explosion of information com-bines an increasing interest in the area of trajectory data mining and more gen-erally the knowledge discovery from movement-aware data [3]. All these techno-logical achievements require new services, software methods and tools for under-standing, searching, retrieving and browsing spatiotemporal trajectories content.
A MOD consists of spatiotemporal trajectories of moving objects (e.g. hu-mans, vehicles, animals, etc.). In general case, these trajectories encode the 2-D(two dimensional) or 3-D geographic location and the 1-D time information.Many of the existing approaches are interested in the trajectory shape analysisconsidering that the trajectory consists of sequential 2-D or 3-D spatial samplingpositions ignoring the temporal dimension [4], [5]. In [6], a trajectory clusteringalgorithm is proposed that partitions a 2-D trajectory into a set of line seg-ments, and then, groups similar line segments together into a cluster, while the

2
notion of the representative trajectory of a cluster is defined. The algorithm isbased on geometrical distances between line segments taking into account posi-tion and orientation. These methods can be applied on trajectory segmentation,classifications, searching and retrieval problems using shape based descriptors.Based on the idea of partial trajectories, Lee et al. [7] proposed an algorithmfor trajectory classification showing that it is necessary and important to mineinteresting knowledge on partial trajectories rather than on the whole. However,both of these algorithms cannot be applied with complex time-aware trajectoriesconsidering the whole route of the moving objects.
In addition, temporal dimension is ignored by almost all computer visionbased methods, that are interested in human action and activity recognition.Many of them use 2-D trajectories from specific human points that are trackedin video sequences with constant frame rate [8], [9]. Another class of methodsuse temporally annotated sequences [10], [1], performing mining tasks. In thesemethods, as temporal dimension is used the transition time between sequentiallypoints of the trajectory. Therefore, a trajectory of n+1 points S = (s0, s1, ..., sn),is stored as T = (S, Δt1, Δt2, ..., Δtn), where Δti, denotes the transition timebetween the points si−1 and si. The use of transition time takes into account thatthe sampling rate could be varied, providing information about speed. However,the format in temporal dimension changes and important information for somereal world applications is missing. In real world, there are applications where thetemporal dimension should be used unchanged. These applications concern traf-fic monitoring, security applications (e.g. identifying “illegal” trajectories undershape and space-time requirements), searching using space-time constraints, andso on.
In [11], distance-based criteria have been proposed for segmentation of ob-ject trajectories using spatiotemporal information. First, Minimum BoundingRectangles (MBRs) is used in order to simplify the trajectories, taking advan-tage their tight integration with existing multidimensional indexes in commer-cial database management systems (such as R-trees). The use of R-trees reducesthe computation cost of trajectory searching to O(log(n)), where n denotes thenumber of trajectories. The distance between two trajectories is defined usedMBRs representation. Finally, the segmentation problem is given as a solutionof a maximization problem, that attempts to create MBRs in such a way, thatthe original pairwise distances between all trajectories are minimized. In [12],a framework consisting of a set of distance operators based on primitive (spaceand time) as well as derived parameters of trajectories (speed and direction)has been introduced. They assume linear interpolation between sampled loca-tions, so that a trajectory consists of a sequence of 3-D line segments, whereeach line segment represents the continuous development of the moving objectduring sampled locations. In [13], representative motion paths (frequently trav-eled trails of numerous moving objects) are detected in a distributed systemunder the assumption that the moving objects can communicate with a centralunit (coordinator) and all processing must be performed in a single pass overthe stream. The location measurements of each object is modeled with some

3
uncertainty tolerance ε and a one-pass greedy algorithm, termed RayTrace, isrunning on each object independently. They have proposed a one-pass greedyalgorithm, termed RayTrace, running on each object independently. The coor-dinator utilizes a lightweight index structure, termed MotionPath, which storesthe representative motion paths. The goal of this work is in the same contextwith the aim of our research. However, they ignore segments’ orientation takinginto account only the points of the trajectories. Moreover, they propose to theuse of a step function to formulate the closeness of two points. On the other handthe use of a continuous decision function derived robust and smooth results (inour approach).
Most of the above mentioned approaches propose different similarity metricswhich they utilize either for introducing indexing structures for vast trajectoryretrieval, or for clustering purposes, focusing either on space criteria, ignoringtemporal variation, minimizing predefined metric criteria on feature domain,simplifying the given trajectories or applying simple clustering-based techniques.We argue that all of the above approaches, as well as those which are dealingwith vast volumes of trajectory datasets would benefit if they would be appliedin a representative subset (consisting of the representative trajectories) that bestdescribes the whole dataset. Consider for example the domain of visual analyticson movement data [14] in which it is meaningless to visualize datasets over acertain small size, as the human eye cannot distinguish any movement patterndue to the immense size of the data. On the contrary, in this paper, we don’tsimplify the given trajectories, as we use the original data unchanged. Moreover,the temporal information is taken into account.
We are proposing a global voting method that is applied for each segment oftrajectory without any simplification. Then, we analyze the voting descriptor inorder to detect the representative paths of the trajectory, that followed by manyobjects at almost the same time and space. Moreover, we classify the trajectoriesand the trajectory segments. The results of classification have been used tovisualize a MOD. The proposed methodology can be applied under differentdistance metrics (e.g. non Euclidean) and higher trajectory dimensions.
The rest of the paper is organized as follows: Section 2 gives the problemformulation describing the proposed modelling. Section 3 presents the proposedmethod for trajectory voting and classification. The experimental results aregiven in Section 4. Finally, conclusions and discussion are provided in Section 5.
2 Problem Formulation
In this section the problem formulation is given. Let us assume a MOD D ={T1, T2, · · · , Tn}, of n trajectories, where Tk denotes the k-trajectory of thedataset, k ∈ {1, 2, ..., n}. We assume that the objects are moving in the xy plane.Let pk(i) = (xk(i), yk(i), tk(i)), be the i-point, i ∈ {1, 2, ..., Lk} of k-trajectory,where Lk denotes the number of points of k-trajectory. xk(i), yk(i) and tk(i))denote the 2-D location and the time coordinate of point pk(i), respectively.

4
Similar to the work of [12], [6], we consider linear interpolation betweensuccessive sampled points pk(i), pk(i + 1), so that each trajectory consists of asequence of 3-D line segments ek(i) = pk(i)pk(i + 1), where each line segmentrepresents the continuous moving of the object during sampled points. The goalof this work is to detect representative paths4 and trajectories, that followedby many objects at almost the same time and space. A method to detect themis to apply a voting process for each segment ek(i) of the given trajectory Tk.This means that ek(i) will be voted by the trajectories of MOD, according tothe distance of ek(i) to each trajectory. The sum of these votes is related tothe number of trajectories that are close to ek(i). If this number is high, meansthat the segments is representative, followed by many objects at almost the sametime and space. Thus, the voting results will be used to detect the representativepaths and trajectories. First, we have to determine the distance d(ek(i), Tm)between ek(i) and a trajectory Tm of the dataset that consists of line segments.d(ek(i), Tm) is defined as the distance between ek(i) and the closest line segmentof Tm to ek(i):
d(ek(i), Tm) = minjd(ek(i), em(j)) (1)
So, we have to compute distances between 3-D line segments (d(ek(i), em(j))). Inthis framework, the meaning of (d(ek(i), em(j))) is equal to the minimum energyof transportation of line segment ek(i) to em(j), or line segment em(j) to ek(i).Between these two choices, the transportation of minimum energy is selected.This idea has been introduced on Earth Movers Distance (EMD) framework[15] and it has been successfully applied on pattern recognition and computervision applications [16]. In our case, this energy can be defined by the sum oftwo energies:
– translation energy d⊥(ek(i), em(j)) and– rotation energy d∠(ek(i), em(j)),
that depend on the Euclidean distance and on angle between the line segments,respectively. Therefore, taking into account the orientation of line segments, wehave added an expression d∠(ek(i), em(j)) to the distance formula related to theangle θ between the line segments,
d(ek(i), em(j)) = d⊥(ek(i), em(j)) + d∠(ek(i), em(j)) (2)d∠(ek(i), em(j)) = min(|ek(i)|, |em(j)|) · sin(θ) (3)
where d⊥(ek(i), em(j)) denotes the Euclidean distance between the 3-D line seg-ments and |ek(i)| the Euclidean norm (length) of 3-D line segment ek(i). Inorder to minimize the energy according to EMD definition, we select to rotatethe line segment of minimum length, see Equation 3. Moreover, d∠(ek(i), em(j))has been expressed in “Euclidean distance” units, measuring the maximum dis-tance that a point of line segment of minimum length will cover during rotation.If d∠(ek(i), em(j)) was expressed in rads, we should introduce a weight to maked⊥(ek(i), em(j)) and d∠(ek(i), em(j)) comparable (similar with Equation 4). Fig.4 In this framework, “path” is used for a trajectory part.
5
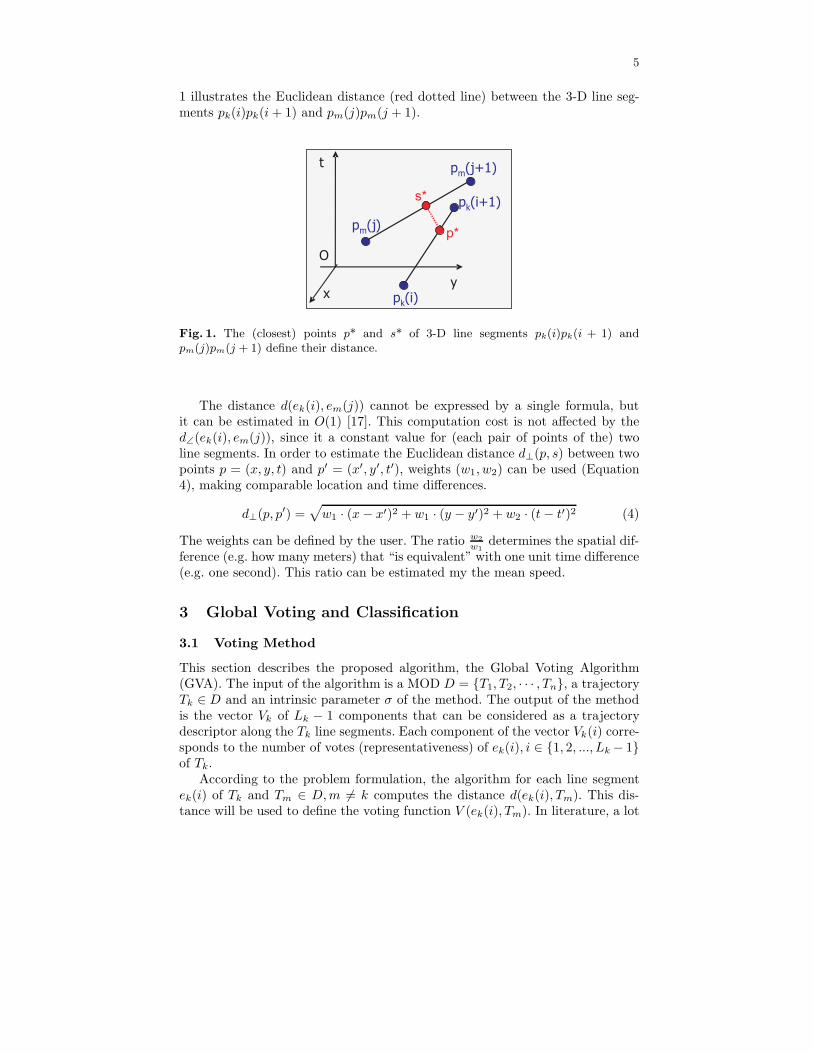
1 illustrates the Euclidean distance (red dotted line) between the 3-D line seg-ments pk(i)pk(i + 1) and pm(j)pm(j + 1).
y
t
O
pk(i)x
p*
s*
pm(j+1)
pm(j)
pk(i+1)
Fig. 1. The (closest) points p* and s* of 3-D line segments pk(i)pk(i + 1) andpm(j)pm(j + 1) define their distance.
The distance d(ek(i), em(j)) cannot be expressed by a single formula, butit can be estimated in O(1) [17]. This computation cost is not affected by thed∠(ek(i), em(j)), since it a constant value for (each pair of points of the) twoline segments. In order to estimate the Euclidean distance d⊥(p, s) between twopoints p = (x, y, t) and p′ = (x′, y′, t′), weights (w1, w2) can be used (Equation4), making comparable location and time differences.
d⊥(p, p′) =√
w1 · (x − x′)2 + w1 · (y − y′)2 + w2 · (t − t′)2 (4)
The weights can be defined by the user. The ratio w2w1
determines the spatial dif-ference (e.g. how many meters) that “is equivalent” with one unit time difference(e.g. one second). This ratio can be estimated my the mean speed.
3 Global Voting and Classification
3.1 Voting Method
This section describes the proposed algorithm, the Global Voting Algorithm(GVA). The input of the algorithm is a MOD D = {T1, T2, · · · , Tn}, a trajectoryTk ∈ D and an intrinsic parameter σ of the method. The output of the methodis the vector Vk of Lk − 1 components that can be considered as a trajectorydescriptor along the Tk line segments. Each component of the vector Vk(i) corre-sponds to the number of votes (representativeness) of ek(i), i ∈ {1, 2, ..., Lk − 1}of Tk.
According to the problem formulation, the algorithm for each line segmentek(i) of Tk and Tm ∈ D, m �= k computes the distance d(ek(i), Tm). This dis-tance will be used to define the voting function V (ek(i), Tm). In literature, a lot

6
of voting functions have been proposed, like the step functions or continuousfunctions [18]. In this work, we have selected to use the continuous function ofgaussian kernel getting,
V (ek(i), Tm) = e−d2(ek(i),Tm)
2·σ2 (5)
The gaussian kernel is widely used in a variety of applications of pattern recog-nition [19]. The control parameter σ shows how fast the function (“voting in-fluence”) decreases with distance. According to Equation 5, it holds that 0 ≤V (ek(i), Tm) ≤ 1. If d(ek(i), Tm) is close to zero, the voting function gets itsmaximum value, giving 1.0. This means, that there exists a line segment of Tm
that is being very close (in time and space) to ek(i). Otherwise, if d(ek(i), Tm)is high, e.g. greater than 5 · σ, the voting function gets almost 0, meaning thatTm is very far away (in time or space) from ek(i).
The use of a continuous voting function, like the gaussian kernel, gives smoothresults for small changes on parameters (σ), and the possibility to get deci-mal values as results of voting process increasing the robustness of the method.Finally, Vk(i) is estimated by getting the sum of votes for all of trajectoriesTm ∈ D, m �= k. Given the above discussion, a nice property that holds is thatthe proposed local trajectory descriptor Vk changes continuously over the tra-jectory segments. The pseudo-code of the above procedure is depicted at theend of the section (see Algorithm 1). The next subsection discusses the using oflocal trajectory descriptor Vk to classify trajectories and to detect representativepaths.
input : The moving objects database D = {T1, T2, · · · , Tn} and atrajectory Tk ∈ D, parameter σ for voting.
output: The voting vector of Tk, Vk.
for i = 1 to Lk − 1 doVk(i) = 0for m = 1 to n do
if m �= k then
Vk(i) = Vk(i) + e−d2(ek(i),Tm)
2·σ2
end
end
end
Algorithm 1: Global Voting Algorithm (GVA).
3.2 Trajectory Classification
In this section, we describe the analysis of local trajectory descriptor Vk in orderto detect the representative paths of the trajectory and to classify the trajec-tories. Representative paths or representative trajectories are followed by many

7
objects at almost the same time and space. In order to identify the representa-tive trajectories, we will introduce Ek that is defined by the mean value of Vk
over the line segments of Tk.
Ek =1
Lk − 1
Lk−1∑
i=1
Vk(i) (6)
This value is a measurement of trajectory representativeness. Therefore, a clas-sification of the trajectories can be done using this value. Another trajectoryfeature is the maximum value of Vk, Mk = maxiVk(i). By the analysis of Mk,the representative line segments can be detected.
The trajectory classification results can be used for an efficient visualizationand sampling of large datasets. The visualization of a large MOD suffers fromthe problem that the space-time density of the trajectories is extremely high(see Fig. 2(b)). A solution on this problem is given by an efficient sampling ofthe MOD, that can be provided by the classification results, using the detectedrepresentative trajectories (see Fig. 2(c)). In Section 4, we present experimentalresults concerning trajectory classification and visualization. The next subsectiondiscusses the computational complexity issues of the proposed algorithm.
3.3 Computational Complexity Issues
Concerning the Global Voting Algorithm (GVA) complexity, the computationalcost for each line segment ek(i), of Tk is O(n). The computation cost of GVA(estimation of Vk) is O(Lk · n). If we perform GVA for each trajectory of thedatabase, then the total computation cost is O(L · n2), where L denotes themean number trajectory points (samples). Therefore the polynomial cost of thealgorithm makes the algorithm efficient for large databases (i.e. more than 1000trajectories needed few seconds).
However, it is possible to reduce this computation cost, in order to be able toexecute the algorithm in even larger databases. MBRs can be used as initializa-tion step, and the indexing of the line segments to MBRs should be stored. Wehave proposed the using MBRs because of their tight integration with multidi-mensional indexes (R-trees). Then, the cost of searching step of voting algorithmwill be reduced in an MBR (or some MBRs). Thus, the use of R-trees will reducethe cost of GVA execution to O(log(L ·n)), and the total cost to O(n · log(L ·n)).
4 Experimental Results
The method has been implemented using Matlab without any code optimizationor using of R-trees structures. For our experiments, we used a Core 2 duo CPUat 1.5 GHz. A typical processing time of GVA execution, when n = 1000 andL = 100, is about 3 seconds.
We have tested the proposed algorithm on the ’Athens trucks’ MOD contain-ing 1100 trajectories. The dataset is available online on [20]. In most of the figures

8
(a) (b)
4.75 4.8 4.85 4.9 4.95 5
x 105
4.18
4.19
4.2
4.21
4.22
4.23x 10
6
x (m)
y (m
)
4.754.8
4.854.9
4.955
x 105
4.18
4.19
4.2
4.21
4.22
4.23
x 106
8.35
8.4
8.45
x 107
x (m)y (m)
t (se
c)
(c)
4.75 4.8 4.85 4.9 4.95 5
x 105
4.18
4.19
4.2
4.21
4.22
4.23x 10
6
x (m)
y (m
)
4.7
4.8
4.9
5
x 105
4.18
4.2
4.22
4.24
x 106
8.35
8.4
8.45
x 107
x (m)y (m)
t (se
c)
(d)
Fig. 2. The trajectories of our dataset (1100 traj.) projected in (a) 2-D spatial spaceignoring time dimension and (b) spatiotemporal 3-D space. (c), (d) The 20 and 50most representative trajectories of the dataset projected in 2-D spatial space (up) andin 3-D spatiotemporal space (down), respectively.

9
we have depicted a subset (10% or 20%) of the trajectories of our dataset, due tovisualization issues. Fig. 2 illustrates the trajectories of our dataset projected in2-D spatial space ignoring time dimension (Fig. 2(a)) and in spatiotemporal 3-Dspace (Fig. 2(b)). The provided information of Figs. 2(a) and 2(b) can not bevisualized efficiently, due to the large number of projected trajectories in almostthe same time and space. In order to solve this problem, we have used the resultsof classification to sample the dataset. Figs. 2(c) and 2(d) illustrate an efficientsampling/visualazation of the dataset using the 20 and 50 most representativetrajectories according to Ek criterion, respectively. According to the proposedmethod, the estimated representative trajectories have the property to be closeto many other trajectories of the dataset and can be used efficiently to visualizethem. In our framework we have used the weights w1 = 1/1000, w2 = 1/30 (seeEquation 4) and σ = 2.5 (see Equation 5).
4.7 4.75 4.8 4.85 4.9 4.95 5 5.05
x 105
4.185
4.19
4.195
4.2
4.205
4.21
4.215
4.22
4.225
4.23
4.235x 10
6
B
x (m)
A
y (m
)
(a)
0 50 100 150 200 250 3000
1
2
3
4
5
6Voting
i (line segments)
V21
9(i)
(b)
4.824.84
4.864.88
4.9
x 105
4.2
4.21
4.22
4.23
x 106
8.4265
8.427
8.4275
8.428
8.4285
x 107
B
x (m)
A
y (m)
time
(sec
)
0
1
2
3
4
5
6
(c)
Fig. 3. Results of GVA for 219th trajectory of the dataset. (a) The 219th trajectory(bold black color) and some trajectories of our dataset projected in 2-D spatial space.(b) The voting descriptor V219. (c) The 219th trajectory in 3-D space. The used colorscorrespond to the values of V219, (red color for high values, blue color for low values).
Figs. 3 and 4 show the results of GVA for the trajectories 219 and 253 ofthe dataset, respectively. Figs. 3(a) and 4(a) show with bold black color thetrajectories 219 and 253 and some of the trajectories of the dataset projected in 2-D spatial space. The estimated voting descriptors V219 and V253 are illustrated inFigs. 3(b) and 4(b). As it was mentioned before, the estimated voting descriptorschange continuously over the trajectory segments. Figs. 3(c) and 4(c) illustratethe trajectories 219 and 253 in 3-D using a blue-to-red color map according tothe corresponding to segments voting values (red color for high values, blue colorfor low values). By the analysis of these figures, it can be observed that the mostrepresentative paths of the trajectory 219 are found at the middle and at theend of the trajectory, while the most representative path of the trajectory 253 isfound at the start of the trajectory. Moreover, the maximum values of V219 andV253 descriptors shows how many trajectories are close to the most representativepaths of 219 and 253 trajectories, respectively.
Fig. 5(a) illustrates the classification results for 220 trajectories of our datasetprojected in 2-D spatial space using Ek descriptor. The used colors correspond

10
4.7 4.75 4.8 4.85 4.9 4.95 5 5.05
x 105
4.185
4.19
4.195
4.2
4.205
4.21
4.215
4.22
4.225
4.23
4.235x 10
6
AB
x (m)
y (m
)
(a)
0 20 40 60 80 100 120 140 160 1800
1
2
3
4
5
6
7
8Voting
i (line segments)
V25
3(i)
(b)
4.844.86
4.884.9
4.924.94
x 105
4.24.202
4.2044.206
4.2084.21
x 106
8.4118
8.412
8.4122
8.4124
8.4126
8.4128
8.413
x 107
x (m)
A
B
y (m)
time
(sec
)
0
1
2
3
4
5
6
7
(c)
Fig. 4. Results of GVA for 253th trajectory of the dataset. (a) The 253th trajectory(bold black color) and some trajectories of our dataset projected in 2-D spatial space.(b) The voting descriptor V253. (c) The 253th trajectory in 3-D space. The used colorscorrespond to the values of V253, (red color for high values, blue color for low values).
to the class of the trajectory (red color for representative trajectories). The mostrepresentative trajectory of the dataset is illustrated with red bold line. Similarresults are obtained using Mk descriptor (see Fig. 5(b)). The most representativetrajectories of the dataset are detected close to the center of the dataset, wheremost of the trajectories are crossed. Fig. 5(c) illustrates the classification resultsfor trajectories line segments of 110 trajectories of the dataset projected in 2-Dspatial space. The line segments with Vk(i) greater than 10 are illustrated withred colors. The voting descriptor of the most representative line segment of thedataset has the value of 67.4. These figures are very useful for traffic monitoring,since they efficiently the trajectories and the segments, where the traffic is high.
5 Conclusions
In this paper, we have discussed the trajectory voting and classification prob-lems in real spatiotemporal MOD. We have proposed an algorithm for trajectoryvoting and classification based on local trajectory similarity. Finally, a local tra-jectory descriptor per trajectory segment is estimated, that changes continuouslyover the trajectory segments. By the analysis of this descriptor the representa-tive paths of the trajectory can be detected, that followed by many objects atalmost the same time and at the same place. These results have been used tovisualize a MOD. We have tested the proposed method under real databases andthe experimental results shows that the method provides an efficient local (persegment) and global (per trajectory) classification of the dataset.
As future work, we plan to apply the voting results for trajectory segmenta-tion, sampling, searching and retrieval. Segmentation and clustering algorithmscan be applied on trajectory descriptor Vk providing a trajectory segmentationand a clustering of the dataset. Moreover, we plan to associate the voting resultswith an error function in order to measure the performance of the proposedsampling and to make comparisons with other works.

11
4.7 4.75 4.8 4.85 4.9 4.95 5 5.05
x 105
4.185
4.19
4.195
4.2
4.205
4.21
4.215
4.22
4.225
4.23
4.235x 10
6
x (m)
y (m
)
0
1
2
3
4
5
6
7
(a)
4.7 4.75 4.8 4.85 4.9 4.95 5 5.05
x 105
4.185
4.19
4.195
4.2
4.205
4.21
4.215
4.22
4.225
4.23
4.235x 10
6
x (m)
y (m
)
0
5
10
15
20
25
30
(b)
4.7 4.75 4.8 4.85 4.9 4.95 5 5.05
x 105
4.185
4.19
4.195
4.2
4.205
4.21
4.215
4.22
4.225
4.23
4.235x 10
6
x (m)
y (m
)
0
1
2
3
4
5
6
7
8
9
10
(c)
Fig. 5. Classification results for 220 trajectories of our dataset projected in 2-D spatialspace using (a) Ek descriptor (b) using Mk descriptor, respectively. The used colorscorrespond to the class of the trajectory (red color for representative trajectories). (c)Classification results for trajectories line segments.
References
1. Giannotti, F., Nanni, M., Pinelli, F., Pedreschi, D.: Trajectory pattern mining.In: KDD ’07: Proceedings of the 13th ACM SIGKDD international conference onKnowledge discovery and data mining. (2007) 330–339
2. Wang, L., Hu, W., Tan, T.: Recent developments in human motion analysis.Pattern Recognition 36(3) (2003) 585–601
3. Giannotti, F., Pedreschi, D.: Geography, mobility, and privacy: a knowledge dis-covery vision. Springer (2007)
4. Vlachos, M., Gunopulos, D., Das, G.: Rotation invariant distance measures fortrajectories. In: KDD ’04: Proceedings of the tenth ACM SIGKDD internationalconference on Knowledge discovery and data mining. (2004) 707–712
5. Chen, L., Ozsu, M.T., Oria, V.: Robust and fast similarity search for movingobject trajectories. In: SIGMOD ’05: Proc. of the 2005 ACM SIGMOD int. conf.on Management of data. (2005) 491–502
6. Lee, J.G., Han, J., Whang, K.Y.: Trajectory clustering: a partition-and-groupframework. In: SIGMOD ’07: Proceedings of the 2007 ACM SIGMOD internationalconference on Management of data. (2007) 593–604
7. Lee, J.G., Han, J., Li, X., Gonzalez, H.: Traclass: trajectory classification usinghierarchical region-based and trajectory-based clustering. PVLDB
8. Panagiotakis, C., Ramasso, E., Tziritas, G., Rombaut, M., Pellerin, D.: Shape-based individual/group detection for sport videos categorization. IJPRAI 22(6)(2008) 1187–1213

12
9. Panagiotakis, C., Ramasso, E., Tziritas, G., Rombaut, M., Pellerin, D.: Shape-motion based athlete tracking for multilevel action recognition. In: Proc. of AMDO2006. (2006) 385–394
10. Giannotti, F., Nanni, M., Pedreschi, D.: Efficient mining of sequences with tem-poral annotations. In: n Proc. SIAM Conference on Data Mining. (2006) 346–357
11. Anagnostopoulos, A., Vlachos, M., Hadjieleftheriou, M., Keogh, E., Yu, P.S.:Global distance-based segmentation of trajectories. In: KDD ’06: Proc. of the12th ACM SIGKDD int. conf. on Knowledge discovery and data mining. (2006)34–43
12. Pelekis, N., Kopanakis, I., Marketos, G., Ntoutsi, I., Andrienko, G., Theodoridis,Y.: Similarity search in trajectory databases. In: TIME ’07: Proc. of the 14th Int.Symposium on Temporal Representation and Reasoning. (2007) 129–140
13. Sacharidis, D., Patroumpas, K., Terrovitis, M., Kantere, V., Potamias, M., Moura-tidis, K., Sellis, T.: On-line discovery of hot motion paths. In: EDBT ’08: Proc. ofthe 11th int. conf. on Extending database technology. (2008) 392–403
14. Andrienko, G., Andrienko, N., Wrobel, S.: Visual analytics tools for analysis ofmovement data. SIGKDD Explor. Newsl. 9(2) (2007) 38–46
15. Rubner, Y., Tomasi, C., Guibas, L.J.: A metric for distributions with applica-tions to image databases. In: ICCV ’98: Proceedings of the Sixth InternationalConference on Computer Vision. (1998)
16. Shishibori, M., Tsuge, S., Le, Z., Sasaki, M., Uemura, Y., Kita, K.: A fast retrievalalgorithm for the earth mover’s distance using emd lower bounds. In: IRI. (2008)445–450
17. Lumelsky, V.J.: On fast computation of distance between line segments. 21 (1985)55–61
18. Patterson, D.: Artificial Neural Networks. Prentice Hall (1996)19. Yuan, J., Bo, L., Wang, K., Yu, T.: Adaptive spherical gaussian kernel in sparse
bayesian learning framework for nonlinear regression. Expert Syst. Appl. 36(2)(2009) 3982–3989
20. : URL: http://infolab.cs.unipi.gr/pubs/tkde2009/.