training needs assessment of the copper … · training needs assessment of the copper engineering...
TRANSCRIPT

TRAINING NEEDS ASSESSMENTOF THE COPPER ENGINEERING GROUP AT ADC
byJeffrey Wachter
A Research Paper
Submitted in Partial Fulfillment of theRequirements for the
Master of Science Degree inTraining and Development
Approved for Completion of 4 Semester CreditsTRHRD-735 Field Problem in Training and Development
____________________________________Dr. Joseph Benkowski, Research Advisor
The Graduate CollegeUniversity of Wisconsin-Stout
August 2001
i
The Graduate CollegeUniversity of Wisconsin-Stout
Menomonie, WI 54751
ABSTRACT
Wachter, Jeffrey R.
(Writer) (Last Name) (First) (Initial)
Training Needs Assessment of the Copper Engineering Group at ADC
(Title)
Training and Development Dr. Joseph Benkowski August 2001 79
(Graduate Major) (Advisor) (Month/Year) (Pages)
APA Fourth Edition
(Name of Style Manual Used in this Study)
While the telecommunications industry rapidly expands, so too have the Engineering
Divisions of ADC. As the Engineering Divisions maintain pace with the demands of the
telecommunications industry, ADC needs to look at developing training methods to
deliver effective training and learner solutions. The scope and purpose of this study is to
determine the overall technical knowledge of the Copper Engineering group in the core
areas of organizational quality practices (ISO/TL 9000), engineering documentation,
product development practices, and product testing practices. The analysis was used to
measure strengths and weaknesses of the current training program, measure employee

ii
training satisfaction, identify training gaps, and assist management in making decisions
about training direction of its people.
The importance of this research project is to provide the Copper Engineering
mangement a baseline to make decisions about training direction of its people and
prioritize the curriculum development efforts. The data was presented to Copper
Engineering management along with recommendations for the future training initiatives.
Of the core areas studied, the data presented in this paper identifies the weaknesses
where training should be improved or implemented within the Copper Engineering Group
at ADC. The current program places significant emphasis on processes and tools in
various technical areas that are critical to the performance of the Copper engineering
division. Therefore, it is necessary to identify subject matter experts in the core areas to
continually identify training needs as they arise and provide them the support to develop
and deliver learning experiences to the engineering community on a continuous basis.
The researcher suggests to consider the findings presented in this research and conduct
separate assessments of the weakest topics to determine what part of the population is
affected, and form curriculum teams to focus on their respective training issues. Not only
would these teams identify formal training opportunities but also identify the informal
training opportunities like OJT. By reading the written comments, it is apparent that OJT
is a prevalent learning tool within the engineering community. It is important that a
strategy is identified, and a consistent format be developed and implemented for this
learning method to be effective.

iii
To support transfer of learning, a repository of released training materials needs to be
developed and centralized so that people can reference the materials on-line when a
review is necessary. The training materials database would require a check-in and check-
out functionality to ensure the most current materials are available.
iv
ACKNOWLEDGEMENTS
I would like to take this opportunity and thank the Copper Engineering Management
Team at ADC and my supervisor, Paul Anderson, for giving me the opportunity to make
this study a success. I would also like to thank Dr. Joseph Benkowski for his efforts over
the years in helping me complete my degree as a working adult who commuted to classes
from the Twin Cities area. Finally, I would like to recognize my parents and family for
their support who helped me stay focused on completing my degree.
v
TABLE OF CONTENTS
Abstract ................................................................................................................................ i
Acknowledgements ............................................................................................................ iv
Table of Contents ................................................................................................................ v
Chapter 1 ............................................................................................................................. 1
Statement of the Problem ................................................................................................ 1
Introduction ................................................................................................................. 1
Problem Background................................................................................................... 3
Problem Statement ...................................................................................................... 5
Research Objectives ................................................................................................ 5
Significance of the Research ................................................................................... 6
Limitations .............................................................................................................. 7
Definitions................................................................................................................... 7
Chapter 2 ............................................................................................................................. 9
Review of Literature........................................................................................................ 9
Introduction ................................................................................................................. 9
Characteristics of Learning Organizations.................................................................. 9
Needs Assessment ..................................................................................................... 12

vi
Benefits of a Needs Assessment............................................................................ 13
Conducting a Needs Assessment........................................................................... 13
Summary ................................................................................................................... 15
Chapter 3 ........................................................................................................................... 17
Research Methods ......................................................................................................... 17
Introduction ............................................................................................................... 17
Research Design........................................................................................................ 17
Population ................................................................................................................. 18
Instrumentation.......................................................................................................... 19
Data Collection Technique.................................................................................... 19
Pilot Testing the Instrument .................................................................................. 20
Data Analysis ............................................................................................................ 20
Summary ................................................................................................................... 21
Chapter 4 ........................................................................................................................... 23
Research Analysis ......................................................................................................... 23
Introduction ............................................................................................................... 23
Survey Scales & Data Charting................................................................................. 24
Survey Demographics ............................................................................................... 26
Years of Service .................................................................................................... 26
Results of the Survey by Core Area .......................................................................... 28
General Survey Items ................................................................................................ 39
vii
Summary ................................................................................................................... 42
Chapter 5 ........................................................................................................................... 43
Research Summary and Recommendations .................................................................. 43
Summary ................................................................................................................... 43
Conclusions ............................................................................................................... 44
Recommendations ..................................................................................................... 49
Closing Comments ................................................................................................ 50
References ......................................................................................................................... 51
Appendix A ....................................................................................................................... 53
Engineering Curriculum Plan........................................................................................ 54
Appendix B ....................................................................................................................... 59
Engineering Training Needs Assessment Survey ......................................................... 60
Appendix C ....................................................................................................................... 68
Written Comments and Experiences Relating to Training............................................ 69

CHAPTER 1
Statement of the Problem
Introduction
Knowledge is a global asset and access to information is the key to staying
competitive. Now more than ever, organizations rely on people to continually learn new
skills, craft innovative solutions to changing circumstances, stay informed and remain
responsive to changes in technology that affect the way people perform their jobs. The
Copper Engineering Group at ADC, recognizes this as an opportunity to stay competitive
in today’s telecommunications industry by continually improving and educating its
people about engineering processes, procedures, systems and tools. Learning is an
integral part of meeting the goals and objectives of the organization and it is the “ADC
Way.”
ADC is “The Broadband Company ” (ADC, 2000). ADC’s fiber optics, network
equipment, software and integration services make broadband communications a reality
worldwide by enabling communications service providers to deliver high-speed Internet,
data, video, and voice services to consumers and businesses. ADC customers include
local and long distance telephone companies, cable television operators, Internet/data
communications providers, wireless service providers, private network operators and
broadcast television operators.

2
Today, there are hundreds of thousands of independent networks throughout the
world. Each of these networks interacts or "internetworks" with others for people to
communicate and conduct commerce. Connecting this world of networks is the mission
of ADC's Broadband Infrastructure and Access group (ADC Telecommunications, 2000).
Delivering Internet/data, video and voice services to homes and businesses involves
extensive highways of fiber, copper, and coax cables. Like any highway system, there are
junctions and connection points linking one network to another. Establishing and
managing these connections points and cables, while ensuring their level of performance,
can be time consuming and costly for a communications provider (ADC
Telecommunications, 2000).
From the end of 1997 through 1999, new service providers in the U.S. increased
access lines to residences and businesses by 250%. The success of new service providers
is resulting in competitive responses from incumbent providers of Internet/data, video
and voice services to retain and win customers. ADC benefits from deregulation as a
result of our strategic focus on supplying broadband, multiservice network solutions to all
types of service providers – incumbents and new entrants – around the globe (ADC
Telecommunications, 2000).
With an Internet host created every four seconds and e-commerce sales expected to
grow 75% annually over the next five years, the world is in the early stages of a new
frontier of tremendous opportunities. In a globally connected, broadband world,
everything is accessible in the blink of an eye. As broader bandwidths become available,
3
communications become digital, increasingly visual and more effective. Consumers and
businesses can locate quickly and obtain products and information from almost anywhere
in the world (2000, ADC Telecommunications).
Problem Background
ADC's Engineering Divisions are divided into three operating entities – Copper
Engineering, Fiber Optics Engineering, and Wireless Engineering. Manufacturing and
Quality supports each division as products are designed, prototyped, tested, and
manufactured. The engineering groups recognize that they all have similar training needs
when it comes to educating its staff on product development, engineering documentation,
manufacturing, and product testing processes. Each division guides itself by a common
set of operating procedures set up as requirements of ISO 9001 and TL 9000 quality
standards.
As new people were employed into the organization, the engineering management
needed to rethink the educational process and develop curriculum that would enable
people to get the training they needed to perform their jobs. In 1998, an effort by the vice
presidents and managing directors of the Copper and Fiber Engineering Groups formed a
team to determine the training requirements around the processes and practices of their
organizations. Since Wireless Engineering was still in its infancy as an operating entity
they would determine their needs at a later date and leverage the curriculum once set up.
4
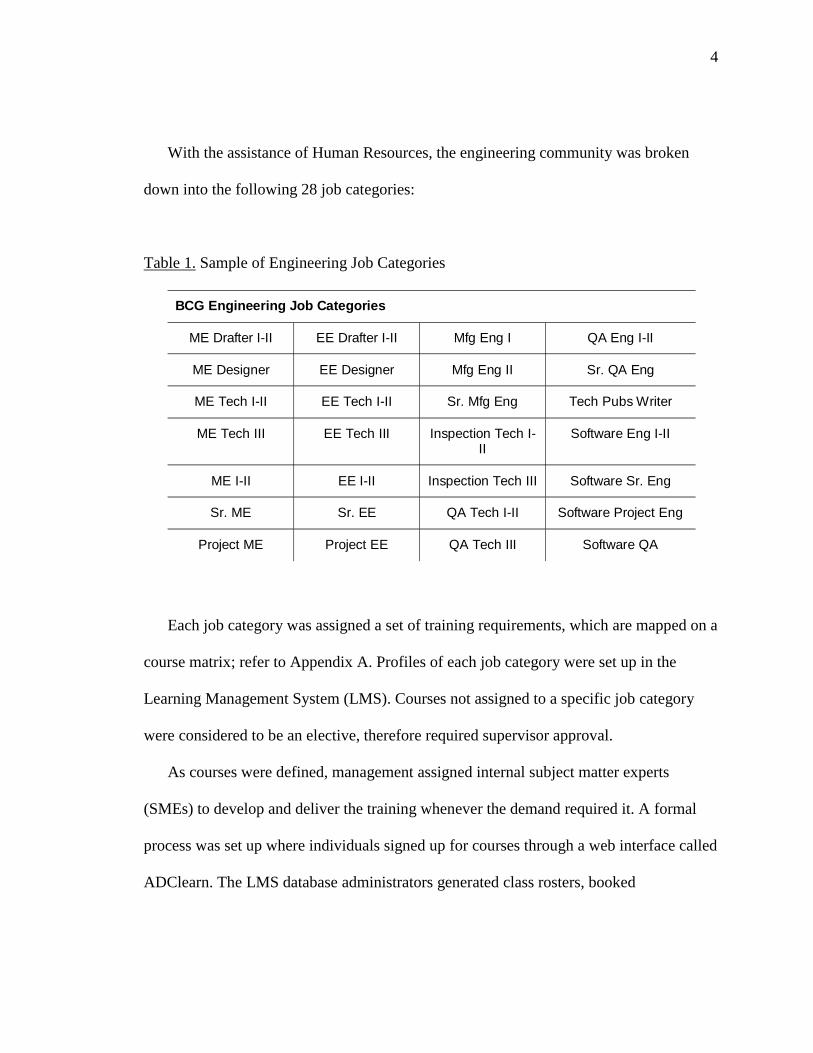
With the assistance of Human Resources, the engineering community was broken
down into the following 28 job categories:
Table 1. Sample of Engineering Job Categories
BCG Engineering Job Categories
ME Drafter I-II EE Drafter I-II Mfg Eng I QA Eng I-II
ME Designer EE Designer Mfg Eng II Sr. QA Eng
ME Tech I-II EE Tech I-II Sr. Mfg Eng Tech Pubs Writer
ME Tech III EE Tech III Inspection Tech I-II
Software Eng I-II
ME I-II EE I-II Inspection Tech III Software Sr. Eng
Sr. ME Sr. EE QA Tech I-II Software Project Eng
Project ME Project EE QA Tech III Software QA
Each job category was assigned a set of training requirements, which are mapped on a
course matrix; refer to Appendix A. Profiles of each job category were set up in the
Learning Management System (LMS). Courses not assigned to a specific job category
were considered to be an elective, therefore required supervisor approval.
As courses were defined, management assigned internal subject matter experts
(SMEs) to develop and deliver the training whenever the demand required it. A formal
process was set up where individuals signed up for courses through a web interface called
ADClearn. The LMS database administrators generated class rosters, booked
5
conference/training rooms, and notified instructors. When employees completed a course,
the attending individual signed the class roster and the instructor mailed the signed roster
back to the training and development group where the data was recorded.
Despite the effort to track employee progress, the data in LMS is not completely
accurate because training requirements were also completed informally either through on-
the-job training or departmental meetings. Therefore, individuals were not receiving
credit for the requirements they completed and management cannot rely on the accuracy
of the reports generated from the tracking system. Moreover, management could not
clearly identify the training gaps that exist amongst their staff.
Problem Statement
The purpose and scope of this study is to determine the overall technical knowledge
of the Copper Engineering group in the core areas of organizational quality, engineering
documentation, product development, and product testing practices. The analysis will be
used to identify strengths and weaknesses of the group, and assist management in making
decisions about training direction of its people.
Research Objectives
The objectives of the research project are:
1. Identify overall technical knowledge of engineering personnel in the core areas of
organizational quality practices, engineering documentation, product development
practices, and product testing practices.
6
2. Provide Copper Engineering management with data to make decisions and prioritize
activities within the group.
3. Validate the Engineering Development Plan.
Significance of the Research
As ADC's Engineering Divisions maintain pace with the demands of the
telecommunications industry, the training solutions delivered to the groups must ensure:
• Individuals learn new skills or acquire knowledge about processes and procedural
enhancements in a timely manner
• New employees are effectively assimilated into the culture of the organization
• Just-in-time solutions to immediate problems
• Proper and timely feedback from others on how they are using new skills or
knowledge
• Standardized training across geographical locations
The importance of this research project is to provide the Copper Engineering
managers a baseline to make decisions about training direction of its people and prioritize
the training development efforts. ADC's Engineering Divisions are analyzing the training
needs that encompass the product development process. Data from the research can help
identify the training gaps in this area and help facilitate the development of a web-based
performance support tool that will assist engineers through the phases of product
development. One requirement of this type of job-aid is to access training material online,
as individuals step through the process.
7
Limitations
Due to the enormity of the proposed research project and the researcher's obligations
in fulfilling the requirements of this research paper on time, the scope of the study is
limited to the assessment of the Copper Engineering group. The results of the study will
provide the researcher a template to conduct future research with the Fiber Optics and
Wireless engineering divisions at ADC including locations in other areas worldwide.
Definitions
ADC - In the early days of the company's history, the company was making
audiometers and other devices used to test hearing, and that is where the name "ADC"
originated. However, the three initials have stood the test of time and now have become
an integral part the name: ADC - The Broadband Company. ADC is now a key supplier
of telecommunications equipment and software world-wide.
Learning Management System (LMS) - Software that automates the administration
of training events. The LMS registers users, tracks courses in a catalog, and records data
from learners; it also provides reports to management.
ISO – A generic, baseline family of quality standards written to be broadly applicable
to a wide range of varying nonspecific industries and products. These standards establish
the basic requirements necessary to document and maintain an effective quality system
(Randall, 1995).

8
TL 9000 Quality Standard - TL 9000 is a common set of quality system
requirements and metrics designed specifically for the Telecommunications Industry,
encompassing ISO and 83 additional requirements.
TNA - Training Needs Assessment
CHAPTER 2
Review of Literature
Introduction
Learning is an integral part of meeting the goals and objectives of organizations to
stay competitive in global markets. At ADC, learning and training has been part of its
culture for many years and continues to be an important organizational strategy.
As part of this research project, the researcher briefly investigated characteristics of
learning organizations and why needs assessments are conducted as a way to understand
situations before training is implemented.
Characteristics of Learning Organizations
For some, Learning Organization is a philosophical system. At ADC it is viewed as a
way of life and business. Devito (1996) adds that a learning organization spans an
enormous field: it can aid large corporations to be competitive globally while it offers
each individual the opportunity to achieve his or her potential with support from a
community of colleagues.
Devito (1996) describes the learning organization as an "hourglass:"
Think of one end as 'building capacity' and the other end as'harnessing experience.' Building capacity emphasizes becomingall that is possible like a division, a department, or a team shares acommon vision and acts to accomplish that vision. As the groupgrows, their understanding and action increases, and they achievemore than they originally intended. Applications of the buildingcapacity approach concentrate on developing individual and team
10
potential. Harnessing experience stresses the retrieval of learningthat can be shared with the rest of the organization such as coreprocesses, technologies, and culture.
The Learning, Training and Development group formed as a strategic initiative to
surround ADC with avenues of employee development that encompass learning
experiences in Leadership and Management, Sales, Engineering, Products and
Technology, Manufacturing, Continuous Improvement, etc. This strategy challenges
ADC to use its knowledge as a basis for its ability to be a global organization.
The Copper Engineering Division leverages the experiences of internal subject matter
experts to teach others about organizational processes, procedures, and tools. According
to Devito (1996), an organization's capabilities, its technologies and work processes are
targets for learning. Maximizing the potential of individuals and the company to obtain
changing objectives is essential to the success of a learning organization. Transferring
learning from one environment to another is the organization's most critical and
promising initiative.
Devito (1996) references the work of David Garvin, in which the learning
organization revolves around five main activities: Systematic Problem Solving,
Experimentation, Learning from the Past, Learning from Others, and Transferring
Knowledge. These building blocks are understood by the organization that they are never
mastered and will forever need refinement.

11
• Systematic Problem Solving - Using scientific methods like data collecting, and using
simple statistical tools such as histograms, and Pareto charts to eliminate guesswork
and assumptions when trying to determine root causes of problems.
• Experimentation - Using experimentation motivated by opportunity as a way to
expand horizons. Analyzing existing programs where incremental gains are realized
from improvement strategies and capitalizing on demonstration projects where
ambitious undertakings are designed from scratch to develop new organizational
capabilities.
• Learning from the Past - Reviewing successes and failures systematically, and
recording the lessons in a form that employees find open and accessible. The
challenge for most companies is installing a database system that catalogs learning
and lessons that are easily accessed.
• Learning from Others - This refers to using benchmarking as a way to learn from
others. According to Devito (1996), Garvin states that "the greatest benefit comes
from studying practices, ways that work gets done (rather than results), and from
involving line managers in the process."
• Transferring Knowledge - Learning needs to be considered more than a local affair;
knowledge must be spread quickly and efficiently through the organization.
According to Devito (1996), Garvin suggests a variety of mechanisms to spur this
process like written, oral, and visual reports, site visits and tours, personnel rotation
programs, education and training programs, and standardization programs.
12
Needs Assessment
The term, needs assessment, can mean many things to different people and
organizations. According to Rosset and Zemke (1985), most experts recognize many
characteristics:
• It comes at the beginning of an systematic approach to training.
• It is done to understand more about performance problems and determine gaps
between what is happening and what ought to be happening.
• It is often not done when training is required yesterday.
• It is done through a variety of data collection methods like interviewing, surveys and
questionnaires, observation, work samples, records and reports, or any combination
thereof.
• It mostly focuses of people's feelings rather than focusing on what sources feel is
causing the performance problem.
• It is also used to expand the understanding of new systems and technologies before
training.
Rosset and Zemke (1985) adds that training professionals use needs assessments, in
detail, to understand the nature of the mission (optimal minus actual); the attitudes or the
feelings; and the causes of problems. The search for information varies, depending on
what got you started like a performance problem or a task, system or technology.
Johnson (1999) cites the work of Allen and Rosset that a needs assessment and
analysis is crucial to any training program and human resource department. Needs
13
assessment is a process and not a one-time event. Johnson also cites the work of
Rothwell that analyzing present conditions is an essential starting point for any
improvement strategy, just as it is for strategic planning. Few improvement efforts can be
initiated if the information about the organizational environment, work environment,
work, and the employee is not first known.
Benefits of a Needs Assessment
The benefits of a needs assessment are critical to both the analyst and the stakeholders
in the process. Johnson (1999) cites the work of Kaufmann that a needs assessment
provides management direction for useful problem resolution through identifying,
documenting, and selecting appropriate problems. Clearly, identifying the problem, and
selecting the right solution can maximize the effectiveness of efficiency of any
organization and its individuals. Bowman (1988) adds that a properly conducted
assessment not only identifies training needs, but also builds participant commitment,
generates management support, increases HRD department's credibility and provides data
for the sacred process of evaluation.
Conducting a Needs Assessment
Rossett and Zemke (1985) state that there is no robust set of procedures to carry out a
needs assessment and that there are various assessment methods and standards for what
constitutes a good needs assessment strategy. Sweeney (1999) cites an article found in
Public Personnel Management that a needs assessment must be developed unique to the
intent of the study.

14
Below, Rossett and Zemke (1985) identifies a series of prescribe basic steps for a
needs analysis:
• Define Objectives - Define the purpose and objectives for the analysis as basis for
manager's planning and development decisions. Some objectives may include
distinguishing the employees who need training; identifying performance problems,
deficiencies, and root causes; secure the support and commitment of management in
the process of building and evaluating effective training; generate data that will be
useful in measuring the impact of training; prioritize training for the upcoming year
and long-range strategic planning.
• Identify the necessary data - Needs assessments require information to identify the
need, the solution, the population requiring training and strategies for delivering
training. Information may include data collected from surveys, financial statements,
job descriptions, performance appraisals, and work samples.
• Choose or design a method for gathering - use various combinations of methods like
surveys, interviews, observations, work samples, etc.
• Collect the data - Administer the surveys, conduct interviews, and observe
performance on your intended study group or population sample.
• Analyze and confirm the data - If possible compare the data with data collected in
past assessments to uncover problems and related trends or patterns. Confirm the
results with the people who supplied the information.
15
• Prepare a final report - In your final report identify problems, strengths and weak
areas and recommend strategies for improvement. Using tables, graphs and other
support data for findings, design a clear and interesting presentation with well-written
materials and attractive visuals.
Summary
ADC recognizes that learning and training is part of its culture and has been for many
years in its quest for continuous improvement and employee development. It also is an
essential organizational strategy and commitment to ISO and TL 9000 quality standards
to provide for the training of all personnel activities affecting quality.
Devito (1996) references the work of David Garvin, who identifies an important trait
of a learning organization as one who utilizes scientific methods like data collecting and
statistical analysis to eliminate guesswork and assumptions when identifying problems
and recommend solutions. A way to uncover training needs and solve problems is to
utilize data collected through a TNA. An inventory of skills and knowledge can lead to
detailed training where the greatest need exists. McClelland (1992) adds that a TNA
provides a means of identifying areas where the organization can obtain maximum value
for the training and development dollar. A systems approach can emphasize consistent
and flexible ways to achieve ongoing analysis of the organization's human resources and
the skills that will be required as a result of changes to a long-range plan.
Although there is no exact science to conducting a TNA, organizations recognize the
value of its information in that it produces a snapshot of their human resource skills and

16
knowledge. Moreover, a TNA provides management direction for useful problem
resolution by identifying the problem, and selecting the right solution to maximize the
effectiveness of efficiency of its individuals. Bowman (1988) adds, a TNA identifies
training needs, builds participant commitment, generates management support, increases
HRD department's credibility and provides data for the sacred process of evaluation.

CHAPTER 3
Research Methods
Introduction
The problem of this study was to determine the overall technical knowledge of the
Copper Engineering group. The methods and procedures used in this study helped to
identify strengths and weaknesses of the Copper Engineering Group, prioritize training
development projects, and assist management in making decisions about the direction of
the training program.
Research Design
A descriptive research design was used and a survey conducted to collect data from
participants in the study population. The goal of this survey was to collect and analyze
data from survey participants to determine training needs in the core areas of
organizational quality, engineering documentation, product development, manufacturing,
and product testing practices. Data from the analysis was used to prioritize training
development projects within the engineering curriculum.
A survey was designed by the researcher to assess the technical knowledge of
individuals relative to primary job functions; refer to Appendix B. Participants were
asked to respond to the statements/questions indicating their level of agreement. They
were also asked to assign a level of importance that they felt the statement is to their job
18
function. If they felt a specific statement is not relevant to their job, they checked the
statement as "N/A" (not applicable). Demographic data was also collected.
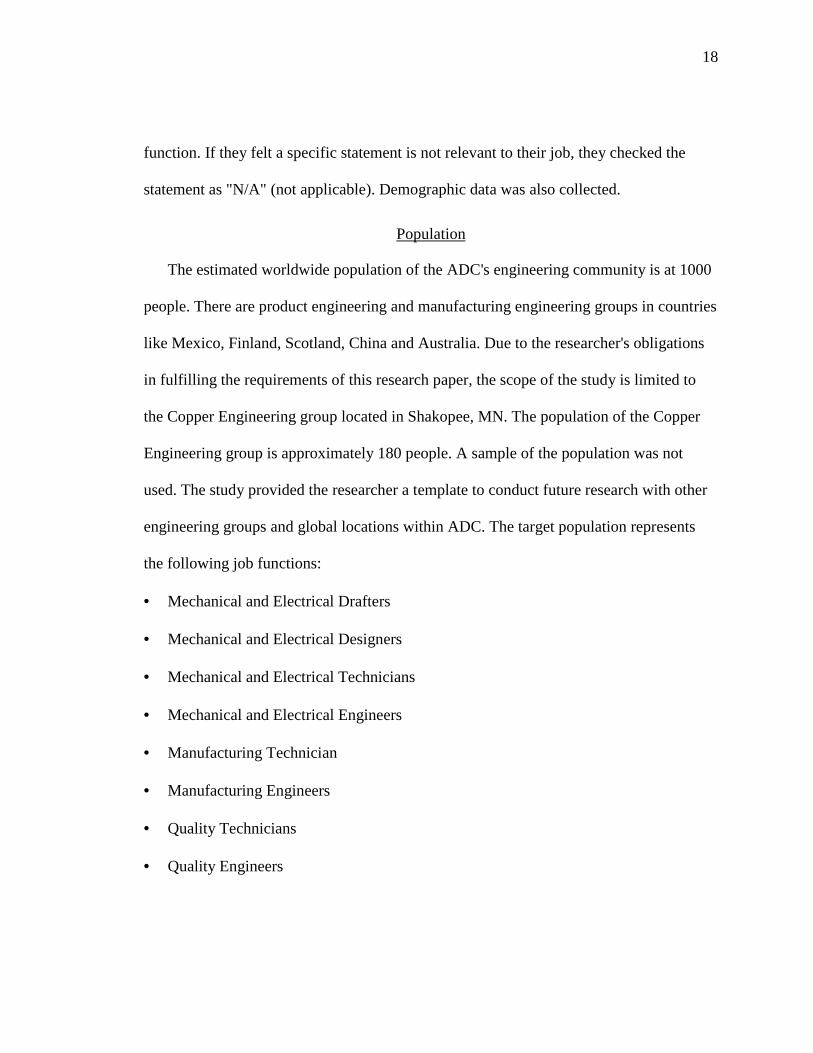
Population
The estimated worldwide population of the ADC's engineering community is at 1000
people. There are product engineering and manufacturing engineering groups in countries
like Mexico, Finland, Scotland, China and Australia. Due to the researcher's obligations
in fulfilling the requirements of this research paper, the scope of the study is limited to
the Copper Engineering group located in Shakopee, MN. The population of the Copper
Engineering group is approximately 180 people. A sample of the population was not
used. The study provided the researcher a template to conduct future research with other
engineering groups and global locations within ADC. The target population represents
the following job functions:
• Mechanical and Electrical Drafters
• Mechanical and Electrical Designers
• Mechanical and Electrical Technicians
• Mechanical and Electrical Engineers
• Manufacturing Technician
• Manufacturing Engineers
• Quality Technicians
• Quality Engineers
19
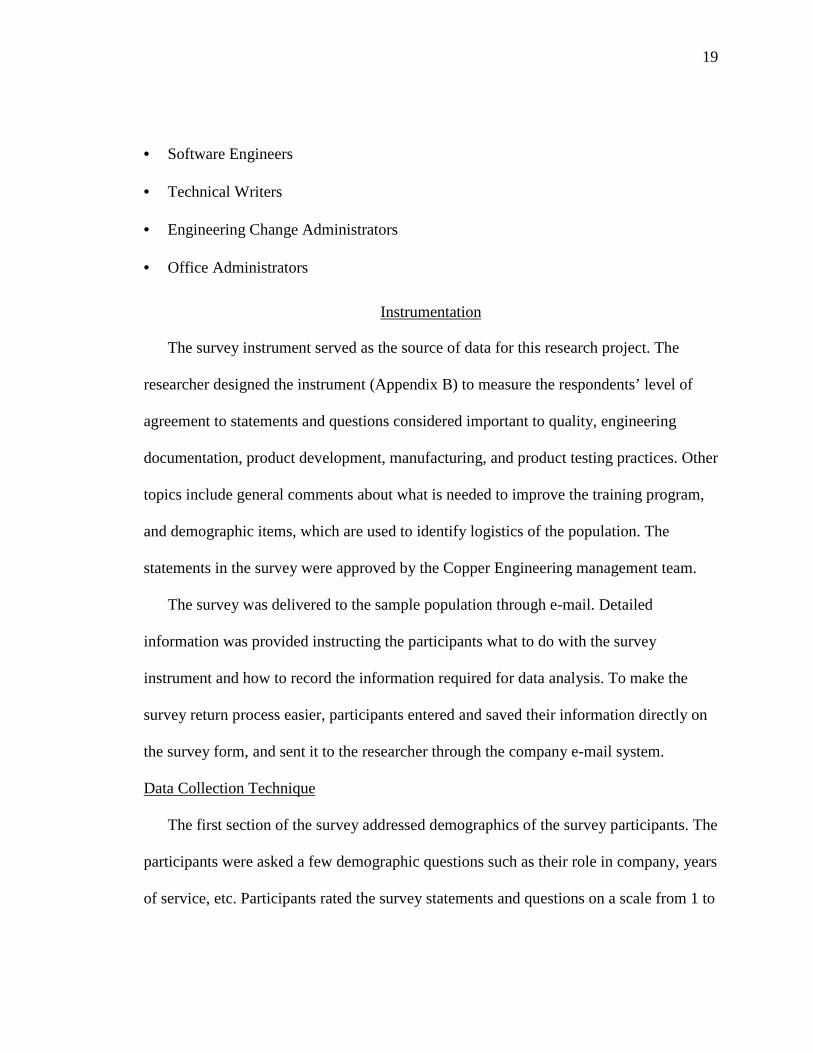
• Software Engineers
• Technical Writers
• Engineering Change Administrators
• Office Administrators
Instrumentation
The survey instrument served as the source of data for this research project. The
researcher designed the instrument (Appendix B) to measure the respondents’ level of
agreement to statements and questions considered important to quality, engineering
documentation, product development, manufacturing, and product testing practices. Other
topics include general comments about what is needed to improve the training program,
and demographic items, which are used to identify logistics of the population. The
statements in the survey were approved by the Copper Engineering management team.
The survey was delivered to the sample population through e-mail. Detailed
information was provided instructing the participants what to do with the survey
instrument and how to record the information required for data analysis. To make the
survey return process easier, participants entered and saved their information directly on
the survey form, and sent it to the researcher through the company e-mail system.
Data Collection Technique
The first section of the survey addressed demographics of the survey participants. The
participants were asked a few demographic questions such as their role in company, years
of service, etc. Participants rated the survey statements and questions on a scale from 1 to

20
5. A 1 rating for a particular item corresponds to a strongly disagree response, a 3 rating
represents a neutral response, and a 5 rating was equivalent to a strongly agree response.
The survey participants also rated the importance of each statement to their specific job
function. A 1 rating identified the statement as low importance, a 2 corresponded to
somewhat important, and a 3 indicated the statement is highly important to job
responsibilities.
The general survey section of the instrument is designed to collect information from
individuals about how training can be improved. They responded to statements on a scale
of 1 to 5 and a few open-ended questions. The open-ended questions are not weighted
and were used to supplement the data as personal thoughts on what might be considered
to improve the training.
Pilot Testing the Instrument
Prior to sending the survey to the population, a pilot test was conducted to test the
validity and reliability of the instrument. The pilot test group consisted of a cross-section
of coworkers – drafters, designers, technicians, and engineers. Pilot testing the survey
helped iron out confusion and eliminated ambiguity by fixing problem areas before the
survey was sent to the study population.
Data Analysis
The participants in the research project recorded their responses on the survey
instrument and returned it to the researcher through the company's e-mail system. As the
surveys were returned, the data was recorded in a database by the researcher using
21
Microsoft Access. Each survey item corresponded to a column in the database. Statistical
information was calculated by importing the database into NWA Quality Analysts
version 5.1 software program used by the Continuous Improvement training team. The
NWA Quality Analyst software program is typically used to analyze variation in
manufacturing processes. For the items that are not weighted, they were recorded in the
appropriate columns of the database as text entries.
The type of data that the researcher measured is the individuals’ perceptions and
attitudes of the statements in the survey. Other data collected also include general
comments about what is needed to improve the training program, and demographic
information about the survey participant. The data was analyzed to acquire sample sizes,
means, and standard deviations of each measurable component on the survey instrument.
After the statistical analysis was complete, the information was presented to the Copper
Engineering management.
Summary
The problem of this study was to determine the overall technical knowledge of
Copper Engineering group relative to core business areas like quality, engineering
documentation, product development, manufacturing, and product testing practices. The
purpose of this research project was to collect and analyze data from survey participants
to identify training needs relative to job importance. The survey participants (180 Copper
Engineering employees) were asked to respond to statements on the survey instrument,

22
and return the survey to the researcher. The statistical analysis of the research is
presented in Chapter 4.

CHAPTER 4
Research Analysis
Introduction
The goals of the research was to:
• Identify strengths and weaknesses in core areas of quality, engineering
documentation, product development, manufacturing, and product testing;
• Provide Copper Engineering management with data to make decisions and prioritize
training activities within the group; and
• Validate the Engineering Development Plan.
Participants were asked to respond to statements/questions on the survey form
indicating their level of agreement (Appendix B). They also identified the level of
importance they felt a statement is to their job function. If they thought a specific
statement was not relevant to their job, they checked the statement as "N/A" (not
applicable). Statements receiving the N/A rating were eliminated from the sample data.
The data was tabulated in a Microsoft Access Database and imported into NWA
Quality Analyst version 5.1 software. Statistical data was calculated where sample
populations, mean scores, and standard deviations were recorded. Perceived knowledge
charts (scatter diagrams) were created comparing the mean scores of Job Importance to
Level of Agreement. The data is depicted on the following pages and was presented to
the Copper Engineering managers.

24
Survey Scales & Data Charting
Survey participants rated the survey statements and questions on a scale from 1 to 5,
according to their level of agreement (perceived knowledge) (Figure 1). Statements
receiving a N/A (Not Applicable) rating got a score of zero and were eliminated from the
sample data.
Figure 1. Level of Agreement Rating Scale
� � � � �
��������
����
����
� �����
���
��������
���
They also rated the importance of each statement to their specific job function as
depicted in Figure 2.
Figure 2. Job importance Rating Scale
� � �
���
������� � ����
�������
����
�������
The general survey section of the instrument was designed to collect information
from individuals about how training can be improved. They responded to statements on a

25
scale of 1 to 5 and answered a few open-ended questions. The open-ended questions were
not weighted and used to supplement the data as personal thoughts on what might be
considered to improve the training program.
The researcher used scatter diagrams to visually show perceived knowledge of the
survey population. Using the mean scores from the data (Level of Agreement and Job
Importance) the following perceived knowledge chart was developed:
Figure 3. Example of Perceived Knowledge Chart
����� �� ������
����������
� �
�
�
�
���� ����
���� ������ � � ��
26
Survey Demographics
The survey population was defined as the Copper Engineering group located in
Shakopee, Minnesota. Of the 180 surveys sent to the group, 84 (47%) were returned.
Years of Service
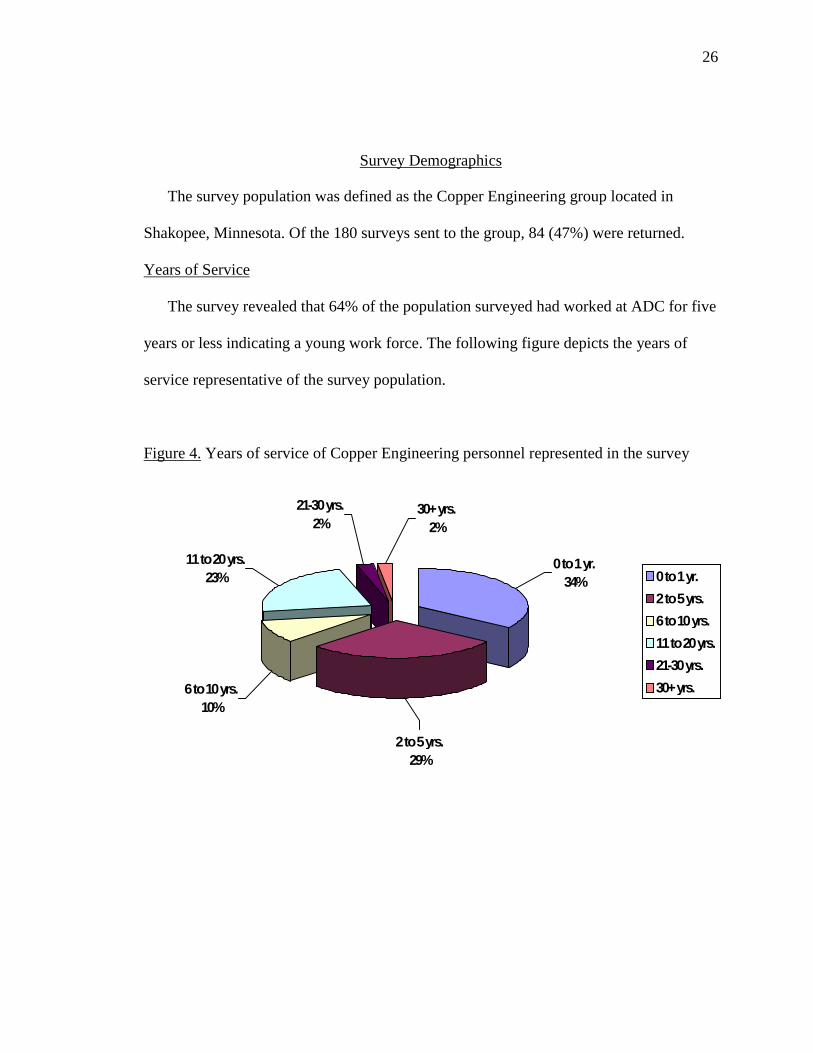
The survey revealed that 64% of the population surveyed had worked at ADC for five
years or less indicating a young work force. The following figure depicts the years of
service representative of the survey population.
Figure 4. Years of service of Copper Engineering personnel represented in the survey
0 to 1 yr.34%
2 to 5 yrs.29%
6 to 10 yrs.10%
11 to 20 yrs.23%
30+ yrs.2%
21-30 yrs.2%
0 to 1 yr.
2 to 5 yrs.
6 to 10 yrs.
11 to 20 yrs.
21-30 yrs.
30+ yrs.

27
Table 2. Job functions represented in survey results.
Job Function Participants
Mech. Eng. Designer 10
Mech. Eng. I-II 9
Supervisor/Mgr. 9
Mech. Eng. Drafters I-II 6
Elect. Eng. Drafter I-II 6
Elect. Eng. Designers 5
SR. Mech. Eng. 5
EE Technicians 4
EE I-II 4
QA Tech III 4
CAE 4
QA Eng. I-II 2
ME Tech I-II 2
Project EE 2
Sr. Mfg. Eng. 2
Project ME 1
Project EE 1
Senior EE 1
Mfg. Eng. II 1
QA Tech I-II 1
SW Eng. I-II 1
SW Sr. Eng. 1
ECA 1
APE 1
CTO 1
ECAD Administrator 1
The table shows the survey population in descending order.

28
Results of the Survey by Core Area
The following pages and figures are the data collected from the core training areas of
engineering. General survey items and overall comments are also included in this data
set:
• Organizational Quality Practices
• Engineering Documentation Practices
• Product Development Practices
• Manufacturing Practices
• Product Testing Practices
• General Survey Items
• Overall Comments (Appendix C)
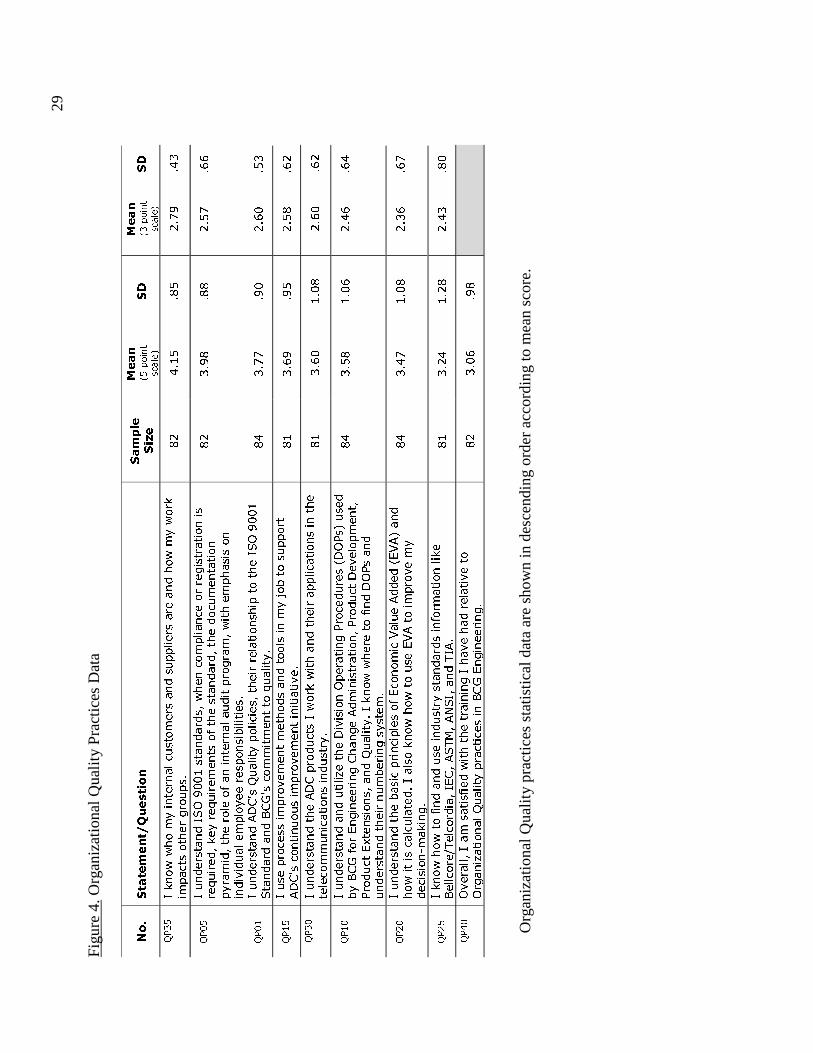
29
Figu
re 4
. Org
aniz
atio
nal Q
uali
ty P
ract
ices
Dat
a
���
����������� ���
������
����
���
�������
�� �
��
���
�������
�� �
��
����
������������ ���������� ���������� �� ���������� �
���������� � �����
��
����
���
����
���
����
����� ������� �!!������� ��"�������������� ���� �����
�#� ��"�� �#� �������$��������� �"���������������
� ���"��� ����$����� �������� �� ��"������������
��%����������� ������&�����
��
����
���
����
�''
����
����� �����()*+�,����������"��� ���������������� �!!�
������ ����-*.+������������#�����
��
����
��!
��'!
���
����
����� ������� �%����������������������/�&������� �
()*+������������ �%���������%��
��
��'�
���
����
�'�
����
����� ��������()*� ��������� ���������� ��������������
��������������������� �
��
��'!
��!�
��'!
�'�
����
����� �����������0����)%��� �� ����1 ����� ��2) 1�3����
&-*.$� 4����� ��*�����(����� ����"1 �����)�%��������"
1 �����45�������"���,������������� ���$��) 1����
���� �������� ���&� ��������
��
����
��!'
���'
�'�
����
����� ��������&���� �������$4������6����(����246(3���
���������������������������������46(���� �%��
������7������
��
����
��!�
���'
�'�
����
����������$������������� ������ ���$� ��������
-����� �89���� ��"�4*"(�9:"(;��"���9�(�
��
����
����
����
��!
����
%� ���"�������$��������� �������%���� ����%���
���0������,����� �������-*.4����� ���
��
��!'
���
Org
aniz
atio
nal Q
uali
ty p
ract
ices
sta
tist
ical
dat
a ar
e sh
own
in d
esce
ndin
g or
der
acco
rdin
g to
mea
n sc
ore.
30
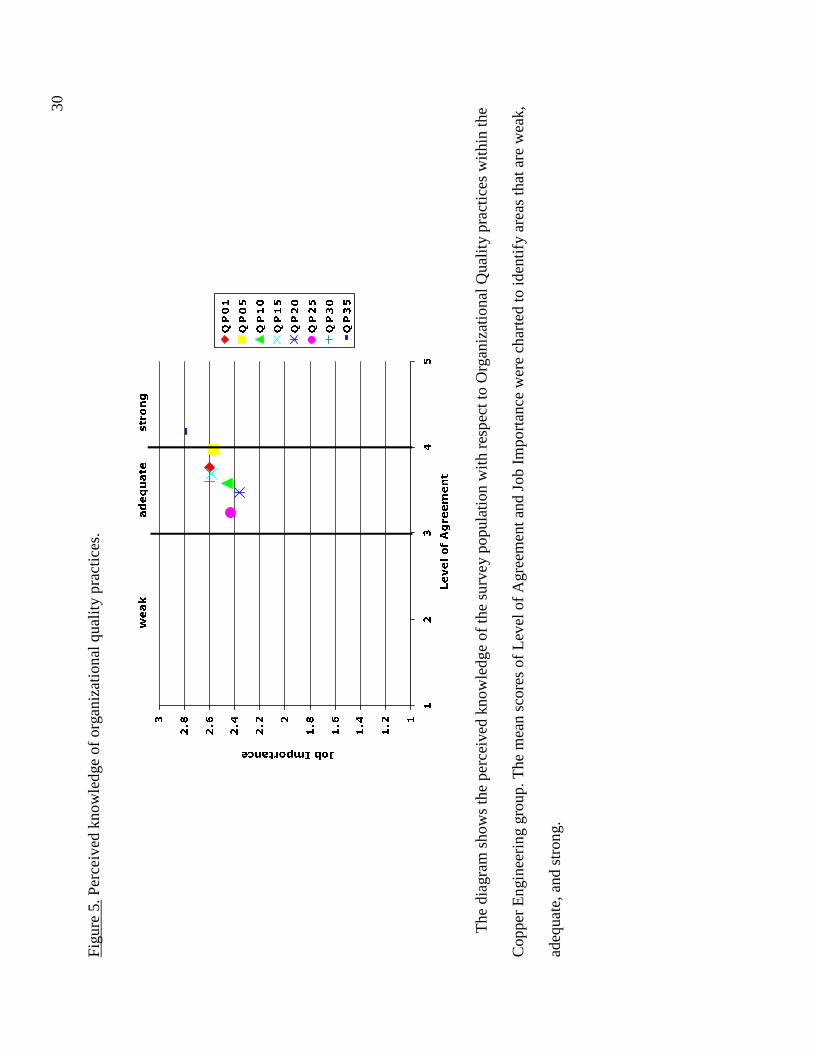
Figu
re 5
. Per
ceiv
ed k
now
ledg
e of
org
aniz
atio
nal q
ualit
y pr
actic
es.
�������������
�
���
���
���
����
���
���
���
����
��
��
�
��
��
��
��
��
��
��
��
����
������ �
� ��
����������
The
dia
gram
sho
ws
the
perc
eive
d kn
owle
dge
of th
e su
rvey
pop
ulat
ion
with
res
pect
to O
rgan
izat
iona
l Qua
lity
prac
tices
with
in th
e
Cop
per
Eng
inee
ring
gro
up. T
he m
ean
scor
es o
f L
evel
of
Agr
eem
ent a
nd J
ob I
mpo
rtan
ce w
ere
char
ted
to id
entif
y ar
eas
that
are
wea
k,
adeq
uate
, and
str
ong.

31
Figu
re 6
. Eng
inee
ring
Doc
umen
tatio
n Pr
actic
es D
ata
En
gin
eeri
ng
Do
cum
enta
tion
Pra
ctic
esL
evel
of A
gree
men
tJo
b Im
po
rtan
ce
� �
��������������� �
����������
����
�������
�� �
��
����
�������
�� �
��
����
����������
� �� ��������� ������� �
���� ������ ������!
"�
#!�
!$%
%!&�
!&�
����
����������
� �� ��'���
�����( ��� ������ �
��(����
'�� )���������
�� � �� � ���� �������* �!
+&
#!�"
�!��
%!#"
!+%
����
����������
� �� �,-. *��� �'� ��
������/ )����/�� �����0����'
1�� �����021��� � ��� � ����� ����3���� 2� ���32����* �!
"�
�!"�
�!%�
%!#�
!+#
����
������� �'' � � * �� ��� �32/3����� ��4����'������( 5� �
�34(�/�� 1���'�������� �������,������6������1
�,�'���
�� ������ �
��
� '��!�������������
����� ������ �
�� '���
* '��
�*���������
���� ���� ��� �������!
+�
�!&"
�!��
%!#&
!+%
����
�������������
� �(7�� ��
�*���� � ��������
�� �������� ����
���*� !
&+
�!&#
�!#�
%!%�
!"+
����
��� ���� ��������� �������� �� �� ����� �� ���������
� �
�� ��� ���� ���� ������ '�������8 �!
&$
�!��
�!%&
%!�#
!+$
����
��� ���� �� ��� �� �� ��� �� � ��
'�� -��9����� �����/
� �*�� /�� ������!����������
� �� ��� ��
-��9����� ����
��'���������'�� /������ �/ ������'���
��/�� ��������� ���������
��
� ��
� ��
�-��9����� ���� ������'�� !��2-:����
�&
�!�%
�!��
%!%&
!""
��%�
��� ���� �� �
�'-��9���������� ���
������� -��9����� � ���!�
���������
� ���9� ����'�� /������ 9 ���
'�� / ���'��'�� /
���'�� / �������*� /���'�� /� ��� '�� /�� � ���'�
���������!
�+
�!%&
�!��
%!%#
!"�
��#�
��� ���� �� ��� �'��� ����� ��� ��� � � ����6 ��
� ��
�� �� �������6��� �'' �
* �� ��� ����������'�������
��� !��������������*� ��
��� ��� �������� ����*�
����� !
&+
%!$+
�!�"
%!��
!"�
��%�
��� ���� 03;<��� �� '��� ������� �������������
'����* ���
���� �!
&&
%!"+
�!%+
%!�#
!$�
��#�
��� ���� �� �� ��
�'��� ���� ���������� ���������
� ��� �
����������'���
������� � �� ��
� ��
�� ����� '�������8 �!�
������ �'' � � * �� ���������� ��� �� ���� ��
��� /�� ����
�������� ��� ������� !
&�
%!"
�!�&
%!�#
!&+
����
����������
���� �
�� �*����� �� 5� ������ ' � � ���� �� �6
= ����1 ��� ��=1�/�� ������� ��
� ������ � �
�,>��/
0 ���� 9= ��� ��/ �!�/�� ����� � �'����������/'�)��� �� ����
��� �'���
���*� �!
&+
%!+#
�!%$
�!$#
!+$
��&�
2� ����/���
���'� ������ ������������ �� � ����� ��
����� ����
���� ������������ ��
03;����� ����!
+"
�!�$
�!�%
Eng
inee
ring
Doc
umen
tati
on p
ract
ices
sta
tist
ical
dat
a ar
e sh
own
in d
esce
ndin
g or
der
acco
rdin
g to
mea
n sc
ore.

32
Figu
re 7
. Per
ceiv
ed k
now
ledg
e of
eng
inee
ring
doc
umen
tatio
n.
�
���
���
���
����
���
���
���
����
��
��
�
����
����
����
����
����
����
����
����
����
����
����
����
�������������
����������
����
������ �
� ��
The
dia
gram
sho
ws
the
perc
eive
d kn
owle
dge
of th
e su
rvey
pop
ulat
ion
with
res
pect
to E
ngin
eeri
ng D
ocum
enta
tion
prac
tices
with
in
the
Cop
per
Eng
inee
ring
gro
up. T
he m
ean
scor
es o
f L
evel
of
Agr
eem
ent a
nd J
ob I
mpo
rtan
ce w
ere
char
ted
to id
entif
y ar
eas
that
are
wea
k, a
dequ
ate,
and
str
ong.
33
Figu
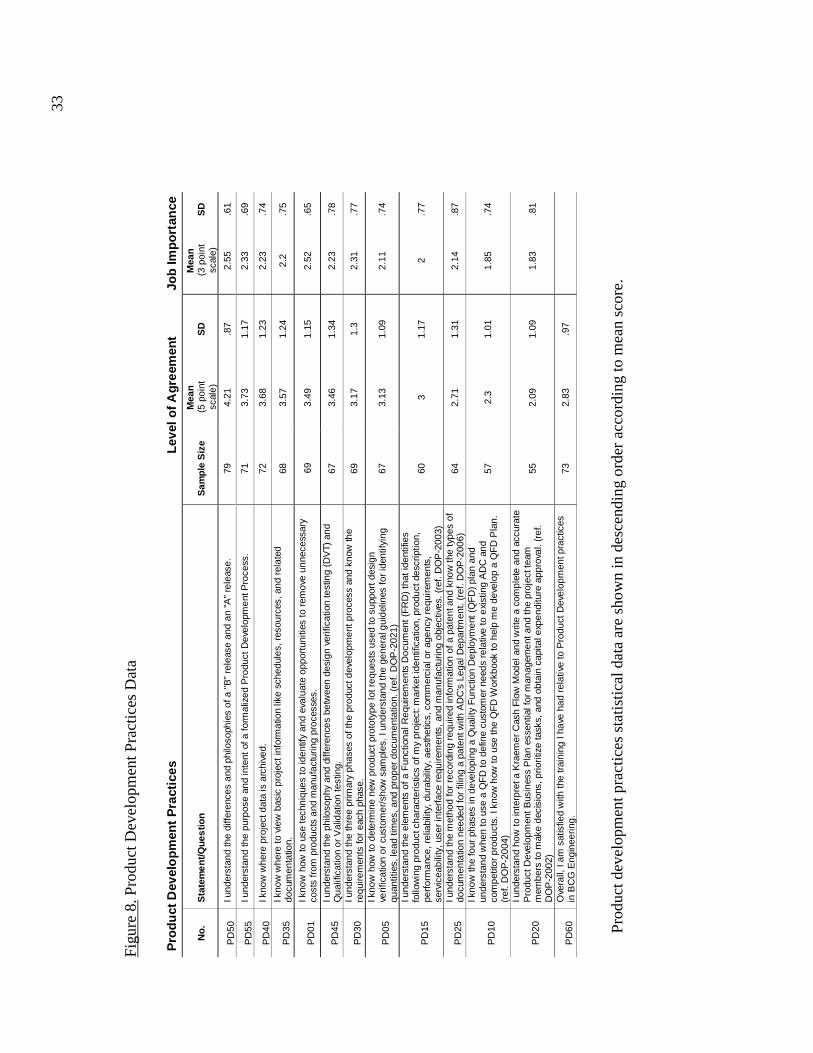
re 8
. Pro
duct
Dev
elop
men
t Pra
ctic
es D
ata
Pro
du
ct D
evel
op
men
t P
ract
ices
Lev
el o
f Agr
eem
ent
Job
Imp
ort
ance
No
.S
tate
me
nt/Q
ues
tion
Sam
ple
Siz
eM
ean
(5 p
oint
scal
e)S
DM
ean
(3 p
oint
scal
e)S
D
PD
50I u
nder
stan
d th
e di
ffere
nces
and
phi
loso
phie
s of
a "
B"
rele
ase
and
an "
A"
rele
ase.
794.
21.8
72.
55.6
1
PD
55I u
nder
stan
d th
e pu
rpos
e an
d in
tent
of a
form
aliz
ed P
rodu
ct D
evel
opm
ent P
roce
ss.
713.
731.
172.
33.6
9
PD
40I k
now
whe
re p
roje
ct d
ata
is a
rchi
ved.
723.
681.
232.
23.7
4
PD
35I k
now
whe
re to
vie
w b
asic
pro
ject
info
rmat
ion
like
sche
dule
s, r
esou
rces
, and
rel
ated
docu
men
tatio
n.68
3.57
1.24
2.2
.75
PD
01I k
now
how
to u
se te
chni
ques
to id
entif
y an
d ev
alua
te o
ppor
tuni
ties
to r
emov
e un
nece
ssar
yco
sts
from
pro
duct
s an
d m
anuf
actu
ring
proc
esse
s.69
3.49
1.15
2.52
.65
PD
45I u
nder
stan
d th
e ph
iloso
phy
and
diffe
renc
es b
etw
een
desi
gn v
erifi
catio
n te
stin
g (D
VT)
and
Qua
lific
atio
n or
Val
idat
ion
test
ing.
673.
461.
342.
23.7
8
PD
30I u
nder
stan
d th
e th
ree
prim
ary
phas
es o
f the
pro
duct
dev
elop
men
t pro
cess
and
kno
w th
ere
quire
men
ts fo
r ea
ch p
hase
.69
3.17
1.3
2.31
.77
PD
05
I kno
w h
ow to
det
erm
ine
new
pro
duct
pro
toty
pe lo
t req
uest
s us
ed to
sup
port
des
ign
verif
icat
ion
or c
usto
mer
/sho
w s
ampl
es. I
und
erst
and
the
gene
ral g
uide
lines
for
iden
tifyi
ngqu
antit
ies,
lead
tim
es, a
nd p
rope
r do
cum
enta
tion.
(re
f. D
OP
-202
1)67
3.13
1.09
2.11
.74
PD
15
I und
erst
and
the
elem
ents
of a
Fun
ctio
nal R
equi
rem
ents
Doc
umen
t (F
RD
) th
at id
entif
ies
follo
win
g pr
oduc
t cha
ract
eris
tics
of m
y pr
ojec
t: m
arke
t ide
ntifi
catio
n, p
rodu
ct d
escr
iptio
n,pe
rfor
man
ce, r
elia
bilit
y, d
urab
ility
, aes
thet
ics,
com
mer
cial
or
agen
cy r
equi
rem
ents
,se
rvic
eabi
lity,
use
r in
terf
ace
requ
irem
ents
, and
man
ufac
turin
g ob
ject
ives
. (re
f. D
OP
-200
3)
603
1.17
2.7
7
PD
25I u
nder
stan
d th
e m
etho
d fo
r re
cord
ing
requ
ired
info
rmat
ion
of a
pat
ent a
nd k
now
the
type
s of
docu
men
tatio
n ne
eded
for
filin
g a
pate
nt w
ith A
DC
's L
egal
Dep
artm
ent.
(ref
. DO
P-2
006)
642.
711.
312.
14.8
7
PD
10
I kno
w th
e fo
ur p
hase
s in
dev
elop
ing
a Q
ualit
y F
unct
ion
Dep
loym
ent (
QF
D)
plan
and
unde
rsta
nd w
hen
to u
se a
QF
D to
def
ine
cust
omer
nee
ds r
elat
ive
to e
xist
ing
AD
C a
ndco
mpe
titor
pro
duct
s. I
know
how
to u
se th
e Q
FD
Wor
kboo
k to
hel
p m
e de
velo
p a
QF
D P
lan.
(ref
. DO
P-2
004)
572.
31.
011.
85.7
4
PD
20
I und
erst
and
how
to in
terp
ret a
Kra
emer
Cas
h F
low
Mod
el a
nd w
rite
a co
mpl
ete
and
accu
rate
Pro
duct
Dev
elop
men
t Bus
ines
s P
lan
esse
ntia
l for
man
agem
ent a
nd th
e pr
ojec
t tea
mm
embe
rs to
mak
e de
cisi
ons,
prio
ritiz
e ta
sks,
and
obt
ain
capi
tal e
xpen
ditu
re a
ppro
val.
(ref
.D
OP
-200
2)
552.
091.
091.
83.8
1
PD
60O
vera
ll, I
am s
atis
fied
with
the
trai
ning
I ha
ve h
ad r
elat
ive
to P
rodu
ct D
evel
opm
ent p
ract
ices
in B
CG
Eng
inee
ring.
732.
83.9
7
Pro
duct
dev
elop
men
t pra
ctic
es s
tatis
tical
dat
a ar
e sh
own
in d
esce
ndin
g or
der
acco
rdin
g to
mea
n sc
ore.
34
Figu
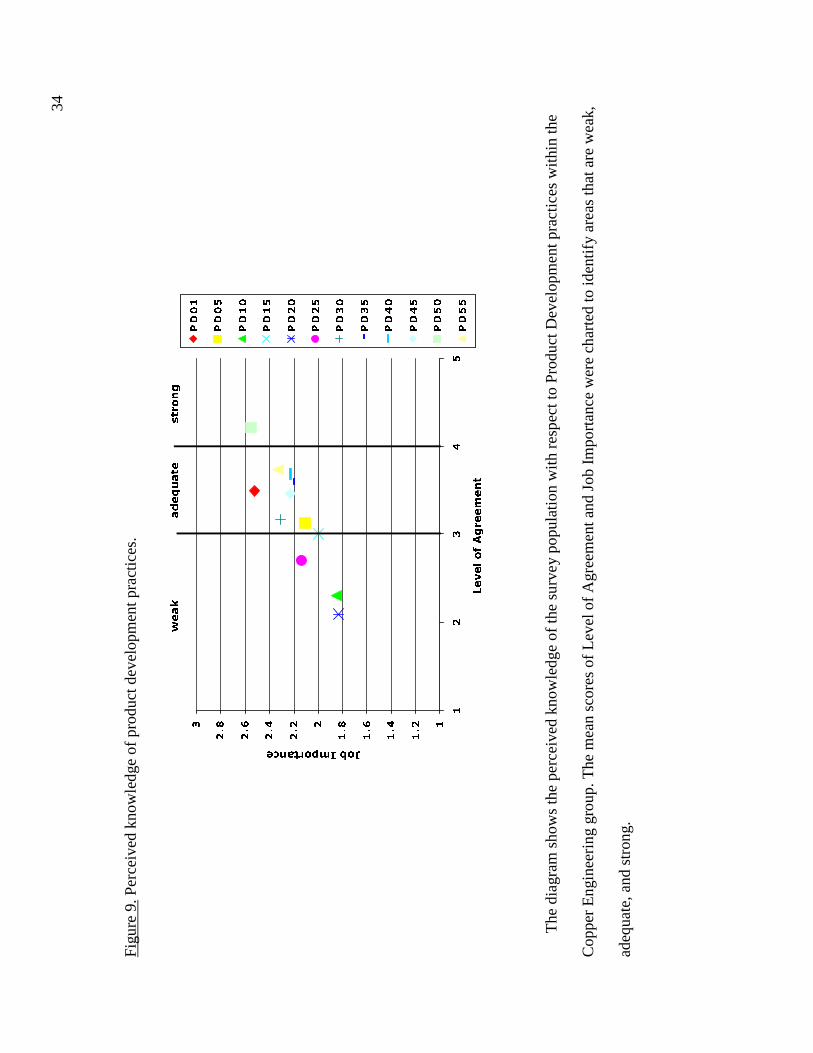
re 9
. Per
ceiv
ed k
now
ledg
e of
pro
duct
dev
elop
men
t pra
ctic
es.�
�
���
���
���
����
���
���
���
����
��
��
�
���
���
���
���
���
���
���
���
���
���
���
���
�������������
����������
����
������ �
� ��
The
dia
gram
sho
ws
the
perc
eive
d kn
owle
dge
of th
e su
rvey
pop
ulat
ion
with
res
pect
to P
rodu
ct D
evel
opm
ent p
ract
ices
with
in th
e
Cop
per
Eng
inee
ring
gro
up. T
he m
ean
scor
es o
f L
evel
of
Agr
eem
ent a
nd J
ob I
mpo
rtan
ce w
ere
char
ted
to id
entif
y ar
eas
that
are
wea
k,
adeq
uate
, and
str
ong.
35
Figu
re 1
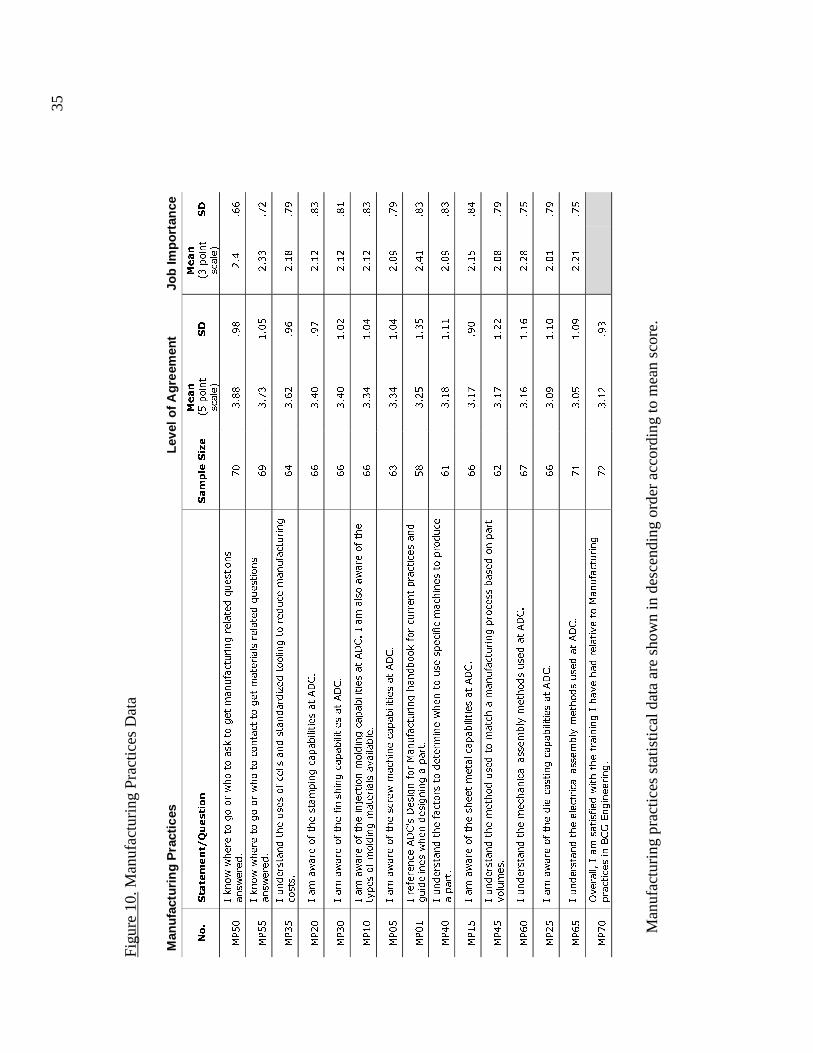
0. M
anuf
actu
ring
Pra
ctic
es D
ata
Man
ufac
turi
ng
Pra
ctic
esL
evel
of A
gree
men
tJo
b Im
por
tan
ce
� �
��������������� �
����������
����
�������
�� �
��
����
�������
�� �
��
1-��
������� �
�����������
����
� �����'�������� ��� 5� ����
��� � !
+�
�!""
!$"
%!#
!&&
1-��
������� �
�����������
�������
� ���� ����� ��� 5� ����
��� � !
&$
�!+�
�!��
%!��
!+%
1-��
��� ���� �� � �' ��
�� ��� �� �6 ���������
� � ����'�������
��!
&#
�!&%
!$&
%!�"
!+$
1-%�
���
����
�'�� ����������*����� ��,�3!
&&
�!#�
!$+
%!�%
!"�
1-��
���
����
�'�� '����������*����� ��,�3!
&&
�!#�
�!�%
%!�%
!"�
1-��
���
����
�'�� ��8 ������� ������*����� ��,�3!���
�������
�'��
��� �'��� ������ ����������*� !
&&
�!�#
�!�#
%!�%
!"�
1-��
���
����
�'�� � ������ ���*����� ��,�3!
&�
�!�#
�!�#
%!�$
!+$
1-��
�� ' � � ,�3<� ���'��1���'���������� *���'����� ������� ��
��� ��� �� � �����������!
�"
�!%�
�!��
%!#�
!"�
1-#�
��� ���� �� '����
�� � ��
�� �� ���
� � �'������ ��
��� �
�����!
&�
�!�"
�!��
%!�$
!"�
1-��
���
����
�'�� � �� ������*����� ��,�3!
&&
�!�+
!$�
%!��
!"#
1-#�
��� ���� �� � ��� � ��
���������'���������� *� ������
����� !
&%
�!�+
�!%%
%!�"
!+$
1-&�
��� ���� �� � ������� �*��� ��� � ��,�3!
&+
�!�&
�!�&
%!%"
!+�
1-%�
���
����
�'�� � :��������*����� ��,�3!
&&
�!�$
�!��
%!��
!+$
1-&�
��� ���� �� � ������ �*��� ��� � ��,�3!
+�
�!��
�!�$
%!%�
!+�
1-+�
2� ����/���
���'� ������ ������������ �� � ����� ��
1���'�������
����� ��
03;����� ����!
+%
�!�%
!$�
Man
ufac
turi
ng p
ract
ices
sta
tist
ical
dat
a ar
e sh
own
in d
esce
ndin
g or
der
acco
rdin
g to
mea
n sc
ore.
36
Figu
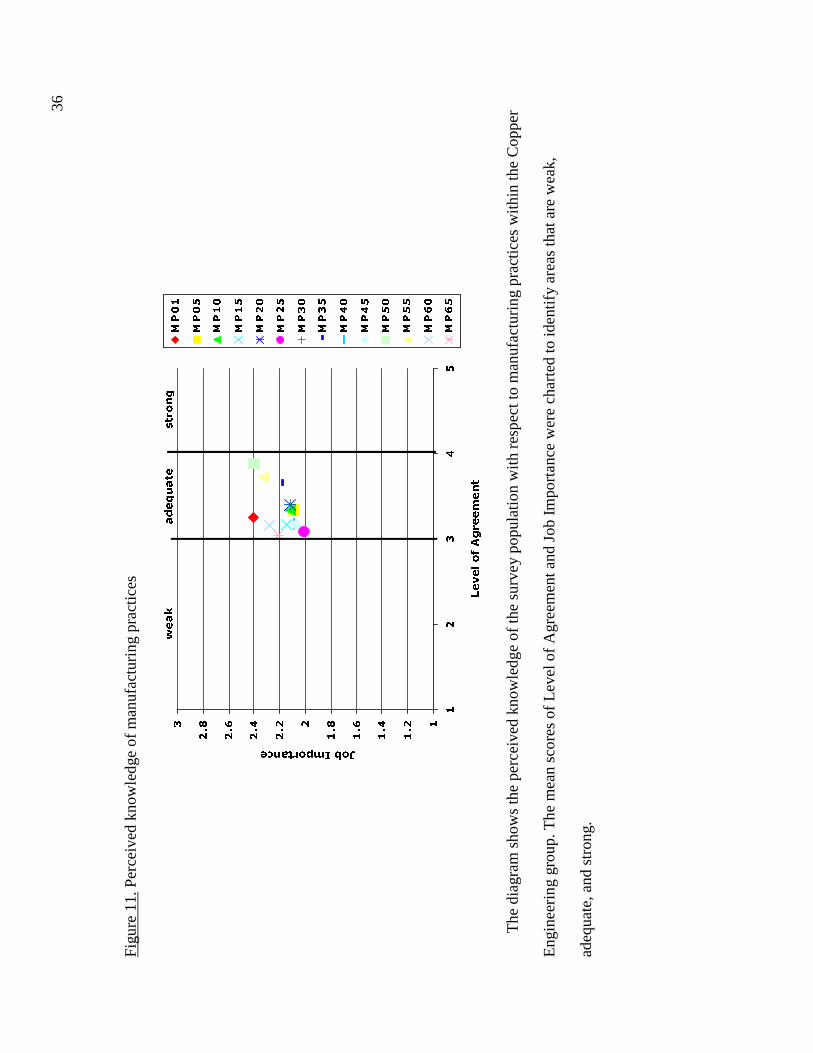
re 1
1. P
erce
ived
kno
wle
dge
of m
anuf
actu
ring
pra
ctic
es
�
���
���
���
����
���
���
���
����
��
��
�
��
��
��
��
��
��
��
��
��
��
��
��
��
��
�������������
����������
����
������ �
� ��
The
dia
gram
sho
ws
the
perc
eive
d kn
owle
dge
of th
e su
rvey
pop
ulat
ion
with
res
pect
to m
anuf
actu
ring
pra
ctic
es w
ithin
the
Cop
per
Eng
inee
ring
gro
up. T
he m
ean
scor
es o
f L
evel
of
Agr
eem
ent a
nd J
ob I
mpo
rtan
ce w
ere
char
ted
to id
entif
y ar
eas
that
are
wea
k,
adeq
uate
, and
str
ong.
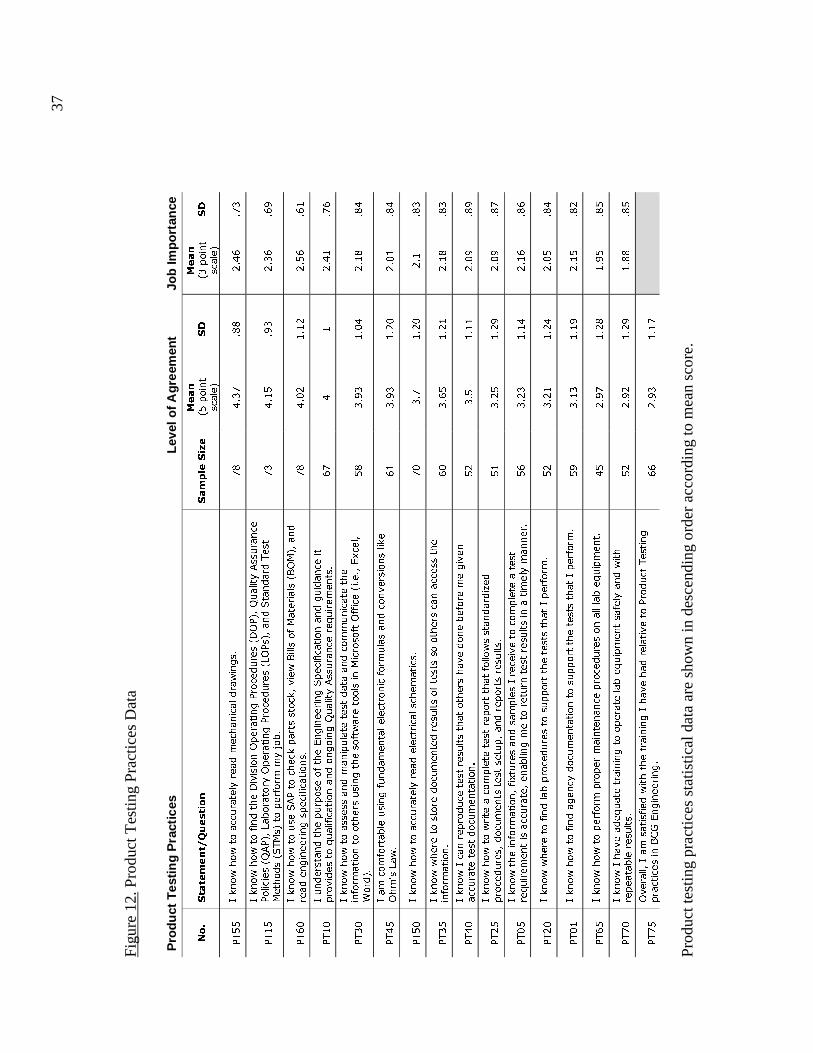
37
Figu
re 1
2. P
rodu
ct T
estin
g Pr
actic
es D
ata
Pro
du
ct T
esti
ng
Pra
ctic
esL
evel
of A
gree
men
tJo
b Im
po
rtan
ce
� �
��������������� �
����������
����
�������
�� �
��
����
�������
�� �
��
-=��
����������
����� ��� � � ������ ������!
+"
#!�+
!""
%!#&
!+�
-=��
����������
'�� �� �������2� ������-�� �� ��2-�/4������,����
-���� �4
,-�/7�*�������
2� ������-�� �� �72-�/�� ���� ��
= �
1 ��� ��=1���
� �'���
��8�*!
+�
#!��
!$�
%!�&
!&$
-=&�
����������
� �,-��
� ��������/�� �0����'1�� �����021�/��
� � ���� ����� �'������!
+"
#!�%
�!�%
%!�&
!&�
-=��
��� ���� �� ����� �'�� ����� ������ �'�������� ��� �� ��
����� ��
5����'�������� �������4������,���� � 5��� � ��!
&+
#�
%!#�
!+&
-=��
����������
� �� ���������
� � ���
�� ��������
��
��'���
�������
��� �
������ �'����
������1����'�2''� ��! !/�) �/
.�� �!
�"
�!$�
�!�#
%!�"
!"#
-=#�
���
��'����*� ����'�� �� ���� � �����'���
����� ��� �������
2��<7��!
&�
�!$�
�!%�
%!��
!"#
-=��
����������
����� ��� � � ������ ����!
+�
�!+
�!%�
%!�
!"�
-=��
������� �
�����
��� �� � ����'� �
���� �
��� ��
��'���
�����!
&�
�!&�
�!%�
%!�"
!"�
-=#�
��������� ��� � � �� ���������� �
��� �� * '��
� ��� �
�����
� � ��� �������!
�%
�!�
�!��
%!�$
!"$
-=%�
����������
����
����� �
� �� ��������'�������� �� �6
��� �� / ��� ��
� � ���/�� � ����� ���!
��
�!%�
�!%$
%!�$
!"+
-=��
������� ��'���
�����/'�)��� �� ���� �� �� ��
���� �
�� �
� 5��� � �������� / ��*����� ��
� ����
� �� �����
���� ������ �!
�&
�!%�
�!�#
%!�&
!"&
-=%�
������� �
��'�� ��*��� �� ��
�������� � �
������ �'���
!�%
�!%�
�!%#
%!��
!"#
-=��
����������
'�� �� �� ��� ���������
�������� � �
������ �'���
!�$
�!��
�!�$
%!��
!"%
-=&�
����������
� �'���
���� ������ ��� ��� �� �������* 5���� ��!
#�
%!$+
�!%"
�!$�
!"�
-=+�
��������� � 5���
����������
�� ���
��* 5���� ���' ���� ����
� � ���*� � ���!
�%
%!$%
�!%$
�!""
!"�
-=+�
2� ����/���
���'� ������ ������������ �� � ����� ��
-�� ��= ����
����� ��
03;����� ����!
&&
%!$�
�!�+
Prod
uct t
estin
g pr
actic
es s
tatis
tical
dat
a ar
e sh
own
in d
esce
ndin
g or
der
acco
rdin
g to
mea
n sc
ore.

38
Figu
re 1
3. P
erce
ived
kno
wle
dge
of p
rodu
ct te
stin
g pr
actic
es.
�������������
����������
����
������ �
� ��
�
���
���
���
����
���
���
���
����
��
��
�
���
���
���
���
���
���
���
���
���
���
���
���
���
���
� �
The
dia
gram
sho
ws
the
perc
eive
d kn
owle
dge
of th
e su
rvey
pop
ulat
ion
with
res
pect
to p
rodu
ct te
stin
g pr
actic
es w
ithin
the
Cop
per
Eng
inee
ring
gro
up. T
he m
ean
scor
es o
f L
evel
of
Agr
eem
ent a
nd J
ob I
mpo
rtan
ce w
ere
char
ted
to id
entif
y ar
eas
that
are
wea
k,
adeq
uate
, and
str
ong.

39
General Survey Items
The general survey items section was designed to collect data about other aspects of
training pertaining to overall satisfaction of the training experience, training availability,
manager/supervisor roles, quality of training methods, and preferences of delivery
methods. Participants could also enter their own comments about their training
experiences at ADC.
Figure 14. Overall Training Satisfaction
��� ����� ����� ������������ �� ��� ���� ��
���� ����� � �������� ���� ��� ������� ��� ��
������ �� ����������� �������� �� ��� �����������
�! " #" $"
�%&� ����� � �������� ���� ��� ������� ��� �������� �� ����������� %����������� �������� �� ���
�����������
�' " �& # �(
)�*� ����� � �������� ���� ��� ������� ��� ��
������ �� �����+���� )���, �������� �� ���
�����������
'! ! $' # �
�-�( ����� � �������� ���� ��� ������� ��� ��
������ �� ������� -������ �������� �� ��� �����������
&& ! $" # #�
�%&� ����� � �������� ���� ��� ������� ��� ��
������ �� ������� %��������� �������� �� ��������������
�" ! '" $�
There were five statements in the survey that were designed to measure level of
satisfaction of training in a given core area. The figure shows the results of training
satisfaction data shown in descending order according to mean score
40
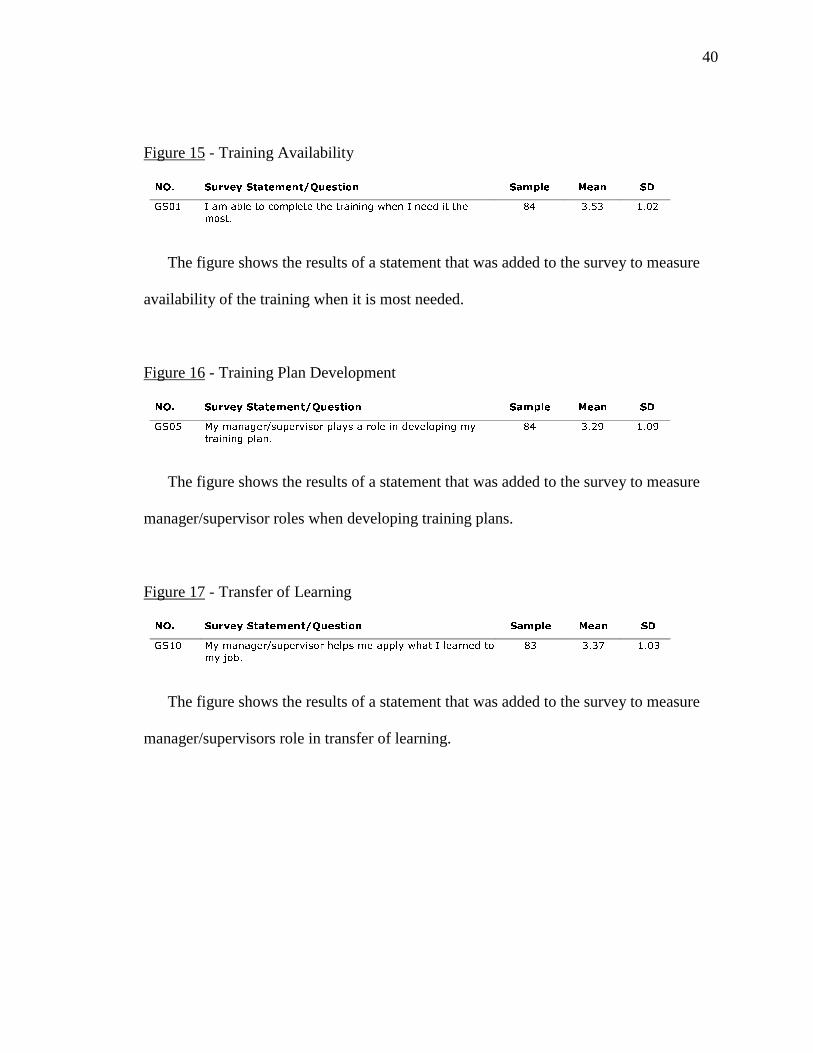
Figure 15 - Training Availability
��� ����� ����� ������������ �� ��� ���� ��
���� � �� �� � � ����� ��� �������� ���� � ���� �� ���
� ���
�� ���� ����
The figure shows the results of a statement that was added to the survey to measure
availability of the training when it is most needed.
Figure 16 - Training Plan Development
��� ����� ����� ������������ �� ��� ���� ��
�.�( �, �����/���������� �,� ��� �� ��������� �,
������� ��
'* " !$ # �$
The figure shows the results of a statement that was added to the survey to measure
manager/supervisor roles when developing training plans.
Figure 17 - Transfer of Learning
��� ����� ����� ������������ �� ��� ���� ��
�.#� �, �����/���������� ���� �� ��, ��� ����� ��
�, 0�1
'" " "� # �"
The figure shows the results of a statement that was added to the survey to measure
manager/supervisors role in transfer of learning.

41
Figure 18 - Quality of Training Methods
��� �������� ������ �� ��� ���� ��
�.#( �������/2������ '* " *' $!
�3-/������ �( " "& # �$
��������41��� -������ 5��-6 &( ! $' # ##
�������41��� -������ &� ! $# # ��
The figure shows the results of survey participants when asked to rate (Poor = 1,
Somewhat Satisfied = 2, Neutral = 3, Satisfied = 4, Excellent = 5) the overall quality of
the following training methods used throughout the organization.
Figure 19 - Preference of Delivery Method
��� ������ �� ��� ����
���� ������� ����� ��
�������� ��
������������ ������ !���" ��
#������������ ������ !#��" $
The figure shows the results of survey participants when asked to provide their
preference of delivery method. Participants could choose more than one selection on this
survey question.

42
Summary
Although the lower scoring statements on the survey may have a higher level of
importance to a select group of individuals, the majority of the topics represented fell in
the "adequate" range. Ideally, these scores should be between four and five on the
perceived knowledge charts. If one were to consider this information to measure the
satisfaction level of the overall training product, one would conclude that an adequate
rating is not satisfactory and that there is room for improvement in the overall
engineering curriculum. Chapter 5 will provide insight on the data presented.

CHAPTER 5
Research Summary and Recommendations
Summary
The focus of this research was to determine the overall technical knowledge of
Copper Engineering individuals in the core areas of organizational quality, engineering
documentation, product development, manufacturing, and product testing practices. The
analysis was used to identify strengths and weaknesses of the current engineering training
program, measure employee satisfaction of their training experiences, and assist
management in making decisions in prioritizing training activities.
A survey method was used in the study to collect data from the Copper Engineer
group at ADC. This approach was used to obtain unbiased feedback from those who have
experienced various training sessions in the past and have valuable input into changes
that can be made to improve the curriculum. Participants received the survey through the
company's e-mail systems and were asked to respond to the statements based on their
level of knowledge and experience. They were also asked to check a level of job
importance the statement is to their job function. Upon receiving the returned surveys
from the participants, statistical data was calculated (sample size, mean score, and
standard deviation), graphs were charted to identify to the perceived knowledge of the
44
group, and written comments were recorded. A total of 84 (47%) employees of ADC's
Copper Engineering group participated in the survey.
Conclusions
If one were to consider the data presented to measure the satisfaction level of the
overall training product, one would conclude that an adequate rating is not satisfactory
and that there is room for improvement in the overall engineering curriculum. The
following identifies the major findings of this research project. Although the data
collected identified areas of weakness, the comments submitted by survey participants
offer valuable insight.
1. As expected, the highest rated area of the study is the overall knowledge of the
Quality practices at ADC. Training programs that support this important
organizational initiative are readily available to all employees. The Quality program
is presented at employee orientation and is presented in formal training sessions
throughout the organization. Although this area rated higher than the other areas,
comments submitted suggest that the message about quality be presented in a
consistent format and at appropriate times. They also suggest that it would help to
know how the quality programs impact individual job functions.
ADC recognizes the fact that to compete in a global market, manufacturing and
service organizations are continually improving their processes to meet certification
standards. These international standards (ISO and TL9000) place great demands on
managers and workers. Consequently, technical training programs need to be

45
available for people to learn about the standards and the methods for their
accomplishment.
2. Four weaknesses emerged in the area of engineering documentation. These practices
include:
• Submitting test requests that reference the proper testing method documentation,
industry standard testing parameters and specific instructions to perform to
achieve consistent test results (ED55).
• Knowing where, or who, to contact when generating product cost estimates for
projects (ED45).
• Creating and designing artwork for equipment labels and silkscreens and the
proper use of ADC logos according to the corporate branding requirements
(ED20).
• The ability to estimate product lot sizes and the variation of lot sizing depending
on the type of manufacturing process used (ED40).
• Other items that should also be addressed, based on the variation in the data (high
standard deviation), include the use of standards and procedures used to define
Pro/Engineer parts, assemblies, and drawings (ED30), and the use of
Pro/Intralink, which is used to manage Pro/Engineer data (ED35).
General comments (Appendix C) submitted about engineering documentation
suggest that most of the practices identified are self-taught through trial-and-error
or are learned by asking questions of co-workers. This type of informal training

46
produces inaccurate information being shared and should be presented and
communicated more formally to produce consistent results. Furthermore, when
training is presented in a formal setting the message should be communicated why
a certain process is followed and who it affects if it is not performed properly.
3. Of the areas surveyed, product development practices is the weakest area. Three
weaknesses emerged in the area of product development. These practices include:
• How to interpret the Kraemer Cash Flow Model and use the information to write a
complete and accurate business plan so management and project team members
can make decisions and prioritize project tasks (PD20).
• How to develop a QFD (Qualified Functional Deployment) plan when defining
customer needs relative to existing ADC and competitor products. Participant
comments suggested that this practice is not consistently followed (PD10).
• How to use ADC's method of filing and recording patent information with the
legal department (PD25).
• Other items that should be considered, based on high variation in the data sample
(standard deviation), are knowing elements of a Functional Requirements
Document (FRD), which identifies product characteristics (PD15); and knowing
the phases of product development and their requirements (PD30). Another area
that also falls into this group is knowing the philosophy and practice of design
verification testing and validation (PD45).
47
Comments submitted suggest that the product development processes and
practices are self-taught or are learned from others. Moreover, this process is difficult
to provide formalized training because of how much external influences affect the
process and that it varies from one project to the next. It is also suggested that any
training developed be targeted towards other job functions (drafters, technicians, etc.)
and not only those who are engineers and project managers.
4. Although the data produced no weaknesses in the area of manufacturing practices,
knowledge and awareness of manufacturing capabilities at ADC is important to the
engineering community. Knowing how to design products according to specific
manufacturing equipment capabilities and tolerances can help engineers and
designers early on in their projects.
Comments submitted relative to manufacturing practices suggest that the
documentation generated by manufacturing personnel and presented to the
engineering community be updated and accessible on the company's intranet web site.
Other suggestions include learning more about other ADC's manufacturing facilities
located in Mexico.
5. Two weaknesses emerged in the area of product testing. These practices include:
• Knowing how to operate test equipment safely and with repeatable results (PT70).
• Knowing how to perform maintenance procedures on lab equipment (PT65).
• Other items that should be considered, based on variation in the data sample
(standard deviation), are knowing where to find lab procedures to perform tests

48
(PT20); knowing how to write a complete test report (PT25); and knowing where
to store completed test reports so others have access to them (PT35).
Again, comments submitted relative to product testing suggest that most of the
training is either self-taught or learned by trial-and-error. Although, equipment safety
and maintenance seems to be main concerns, product-testing standards differ
depending on the engineering department requesting the test. Since multiple product
groups use the testing labs, numerous reporting formats and procedures are used
making it difficult for lab technicians to adhere to consistent test practices.
6. Data collected from the general survey section produced information to try to identify
areas where training can be better supported by either improving manager/supervisor
roles in planning, training frequency, or training methods. Data collected relative to
frequency and timeliness of training (GS01) is comparable to written comments
suggesting that learning experiences need to be offered on a more regular basis to
accommodate those with scheduling conflicts or when changes are made to processes
and tools.
The data suggests that managers and supervisors are actively involved in the
development plans of their employees (GS05 and GS10). Moreover, an updated
learning management system was recently implemented at ADC that can help
managers/supervisors plan, track, and identify the training needs of their employees
as long as the functionality within the system is used effectively.
49
A finding that the researcher thought needed to be identified is that the survey
participants rated their overall satisfaction level of delivery methods (GS15) was
relatively low meaning that none of the methods surveyed failed to reach a satisfied
rating (4.00). Classroom instruction rated the highest (m=3.48) followed by OJT
(m=3.36), computer-based (m=2.98), and internet-based (m=2.91). The latter two
were expected, as ADC does not have a lot of training products developed using these
media.
When asked to identify preference of delivery method (GS20), survey participants
identified classroom instruction as their number one choice, followed by OJT, CBT,
and then Internet-based training. This information is interesting because Internet
(intranet) -based training is being supported at the corporate level as a cost-effective
way to deliver training on an organization-wide basis.
Recommendations
It is important that the engineering curriculum allow employees to achieve the goals
of the program. The current program places significant emphasis on processes and tools
in various technical areas that are critical to the performance of the engineering division.
Therefore, it is necessary to identify subject matter experts in the core areas to
continually identify training needs as they arise and provide them the support to develop
and deliver learning experiences to the engineering community on a continuous basis.
The researcher suggests to consider the findings previously presented and conduct
separate assessments of the weakest topics to determine what part of the population is
50
affected. When completing an in-depth analysis, the data collected from this research can
be queried to identify the specific job functions that are affected and form curriculum
teams to focus on their respective training issues. Not only would these teams identify
formal training opportunities but also identify the informal training opportunities like
OJT. By reading the written comments, it is apparent that OJT is a prevalent learning tool
within the engineering community. It is important that a strategy is identified and a
consistent format be developed and implemented for this learning method to be effective.
To support transfer of learning, a repository of released training materials needs to be
developed and centralized so that people can reference the materials on-line when a
review is necessary. The training materials database would require a check-in and check-
out functionality to ensure the most current materials are available.
Closing Comments
At the time this research took place, the telecommunications industry experienced a
tremendous slow-down. To react with the industry slow-down, ADC compensated by
restructuring and reorganizing its business units. A more focused ADC emerged.
Despite the competitive nature of the telecommunications industry, management's
perception of training is supportive and is recognized as a value-added resource in the
education of its employees. However, a more selective and creative approach to develop
and deliver the training outside the classroom needs to be addressed so that global
engineering groups can receive cost effective training.
51
REFERENCES
ADC Telecommunications. (2000). Corporate Profile [on-line]. Internet:
http://www.adc.com
ADC Telecommunications. (2000). Annual Report [on-line]. Internet:
http://www.adc.com
Rosset, A., and Zemke, R. (1985). Be a Better Needs Analyst. Alexandria, VA.:
American Society for Training and Development.
Bowman, B. (1988). Assessing your needs assessment. In Jack Gordon, Ron Zemke,
Philip Jones (Ed.), The best of Training Magazine: Designing and delivering cost
effective training (2nd Ed.) Minneapolis: Lakewood Books
Devito, J. D. (1996). The Learning Organization. In R.L. Craige (Ed.), The ASTD
training and development handbook: a guide to human resources development (4 th Ed.)
New York: McGraw-Hill.
Johnson, E. J., Jr. (1999). Exploration of training needs assessment methodologies
employed by ISO 9000 registered organizations. Unpublished master's thesis, University
of Wisconsin-Stout, Menomonie, Wisconsin.
McClelland, S. (1992, August). A systems approach to needs assessment. Training &
Development. 51-53.
Randall, R. C. (1995). Randall’s Practical Guide to ISO 9000 Implementation,
Registration, and Beyond. Reading, MA: Addison-Wesley Publishing Company.

52
Rothwell, W.J., and Kazanas, H. C. (1992). Mastering the Instructional Design
Process. San Francisco, CA: Jossey-Bass Inc.
Sweeney, P.. (1999). Training needs assessment for Kell Container Corporation.
Unpublished master's thesis, University of Wisconsin-Stout, Menomonie, Wisconsin.

APPENDIX A
Engineering Curriculum Plan

54
Eng
inee
ring
Cur
ricu
lum
Pla
n

55

56

57

58
APPENDIX B
Engineering Training Needs Assessment Survey

60
Eng
inee
ring
Tra
inin
g N
eeds
Ass
essm
ent
Surv
ey
Scop
e of
Sur
vey:
Thi
s su
rvey
is d
esig
ned
to a
sses
s th
e te
chni
cal k
now
ledg
e of
indi
vidu
als
wit
hin
the
Eng
inee
ring
Div
isio
ns r
elat
ive
to p
rim
ary
job
func
tion
s. T
he g
oal o
f th
is s
urve
y is
to c
olle
ct a
ndan
alyz
e da
ta f
rom
sur
vey
part
icip
ants
to d
eter
min
e tr
aini
ng n
eeds
in th
e co
re a
reas
of
qual
ity, e
ngin
eeri
ng d
ocum
enta
tion,
pro
duct
dev
elop
men
t, pr
oduc
t tes
ting,
and
man
ufac
turi
ngpr
acti
ces.
Inst
ruct
ions
:1.
R
espo
nd to
the
stat
emen
ts/q
uest
ions
in th
is s
urve
y ba
sed
on y
our
curr
ent l
evel
of
know
ledg
e an
d ex
pert
ise.
2.
As
you
read
eac
h st
atem
ent,
clic
k a
box
that
cor
resp
onds
to y
our
leve
l of
agre
emen
t (r
efer
to K
ey b
elow
). W
here
app
ropr
iate
, che
ck a
leve
l of
impo
rtan
ce th
at y
ou f
eel t
hest
atem
ent i
s to
you
r jo
b fu
ncti
on. I
f yo
u fe
el a
spe
cifi
c st
atem
ent i
s no
t rel
evan
t to
your
job
func
tion
, che
ck th
e " N
/A"
box.
3.
Ple
ase
be h
ones
t w
hen
resp
ondi
ng to
sta
tem
ents
in th
is s
urve
y. T
he s
urve
y is
for
inte
rnal
use
onl
y.4.
W
hen
you
com
plet
e th
e su
rvey
, sav
e an
d cl
ose
the
MS
Wor
d do
cum
ent t
o sa
ve y
our
answ
ers.
Sen
d yo
ur c
ompl
eted
sur
vey
to:
Jeff
Wac
hter
Lea
rnin
g S
peci
alis
t, B
CG
Eng
inee
ring
BC
G L
earn
ing,
Tra
inin
g an
d D
evel
opm
ent
MS
654
Tel
: 952
.233
.648
0Fa
x: 9
52.2
33.6
652
Jeff
_wac
hter
@ad
c.co
m
Key
:L
evel
of
Agr
eem
ent
Job
Impo
rtan
ce0.
N/A
Not
App
licab
leL
Low
Im
port
ance
1.SD
Stro
ngly
Dis
agre
eM
Med
ium
Im
port
ance
2.D
Dis
agre
eH
Hig
h Im
port
ance
3.N
Neu
tral
(A
gree
nor
dis
agre
e)4.
AA
gree
5.S
ASt
rong
ly A
gree
Surv
ey I
tem
Exa
mpl
e:L
evel
of
Agr
eem
ent
Job
Impo
rtan
ceSt
atem
ent/
Que
stio
n0
N/A
1 SD2 D
3 N4 A
5 SA1 L
2 M3 H
I un
ders
tand
AD
C's
Qua
lity
pol
icie
s, th
eir
rela
tions
hip
to th
eIS
O 9
001
Stan
dard
and
BC
G's
com
mit
men
t to
qual
ity.
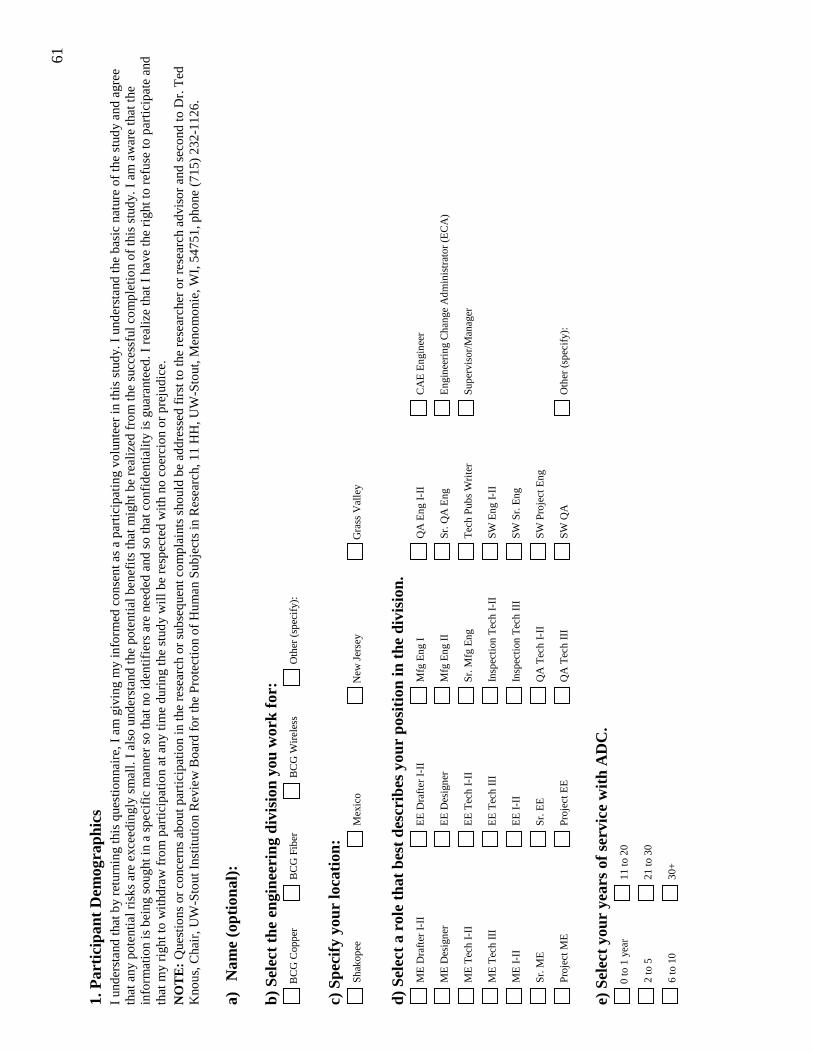
61
1. P
arti
cipa
nt D
emog
raph
ics
I un
ders
tand
that
by
retu
rnin
g th
is q
uest
ionn
aire
, I a
m g
ivin
g m
y in
form
ed c
onse
nt a
s a
part
icip
atin
g vo
lunt
eer
in th
is s
tudy
. I u
nder
stan
d th
e ba
sic
natu
re o
f th
e st
udy
and
agre
eth
at a
ny p
oten
tial
ris
ks a
re e
xcee
ding
ly s
mal
l. I
also
und
erst
and
the
pote
ntia
l ben
efit
s th
at m
ight
be
real
ized
fro
m th
e su
cces
sful
com
plet
ion
of th
is s
tudy
. I a
m a
war
e th
at th
ein
form
atio
n is
bei
ng s
ough
t in
a sp
ecif
ic m
anne
r so
that
no
iden
tifie
rs a
re n
eede
d an
d so
that
con
fide
ntia
lity
is g
uara
ntee
d. I
rea
lize
that
I h
ave
the
righ
t to
refu
se to
par
ticip
ate
and
that
my
righ
t to
wit
hdra
w f
rom
par
ticip
atio
n at
any
tim
e du
ring
the
stud
y w
ill b
e re
spec
ted
wit
h no
coe
rcio
n or
pre
judi
ce.
NO
TE
: Q
uest
ions
or
conc
erns
abo
ut p
arti
cipa
tion
in th
e re
sear
ch o
r su
bseq
uent
com
plai
nts
shou
ld b
e ad
dres
sed
firs
t to
the
rese
arch
er o
r re
sear
ch a
dvis
or a
nd s
econ
d to
Dr.
Ted
Kno
us, C
hair
, UW
-Sto
ut I
nstit
utio
n R
evie
w B
oard
for
the
Pro
tect
ion
of H
uman
Sub
ject
s in
Res
earc
h, 1
1 H
H, U
W-S
tout
, Men
omon
ie, W
I, 5
4751
, pho
ne (
715)
232
-112
6.
a)
Nam
e (o
ptio
nal)
:
b) S
elec
t th
e en
gine
erin
g di
visi
on y
ou w
ork
for:
BC
G C
oppe
r B
CG
Fib
er B
CG
Wir
eles
s O
ther
(sp
ecif
y):
c) S
peci
fy y
our
loca
tion
: S
hako
pee
Mex
ico
New
Jer
sey
Gra
ss V
alle
y
d) S
elec
t a
role
tha
t be
st d
escr
ibes
you
r po
siti
on in
the
div
isio
n. M
E D
raft
er I
-II
EE
Dra
fter
I-I
I M
fg E
ng I
QA
Eng
I-I
I C
AE
Eng
inee
r
ME
Des
igne
r E
E D
esig
ner
Mfg
Eng
II
Sr.
QA
Eng
Eng
inee
ring
Cha
nge
Adm
inis
trat
or (
EC
A)
ME
Tec
h I-
II E
E T
ech
I-II
Sr.
Mfg
Eng
Tec
h Pu
bs W
rite
r S
uper
viso
r/M
anag
er
ME
Tec
h II
I E
E T
ech
III
Insp
ecti
on T
ech
I-II
SW
Eng
I-I
I
ME
I-II
EE
I-I
I In
spec
tion
Tec
h II
I S
W S
r. E
ng
Sr.
ME
Sr.
EE
QA
Tec
h I-
II S
W P
roje
ct E
ng
Pro
ject
ME
Pro
ject
EE
QA
Tec
h II
I S
W Q
A O
ther
(sp
ecif
y):
e) S
elec
t yo
ur y
ears
of
serv
ice
wit
h A
DC
. 0
to 1
yea
r 1
1 to
20
2 to
5 2
1 to
30
6 to
10
30+
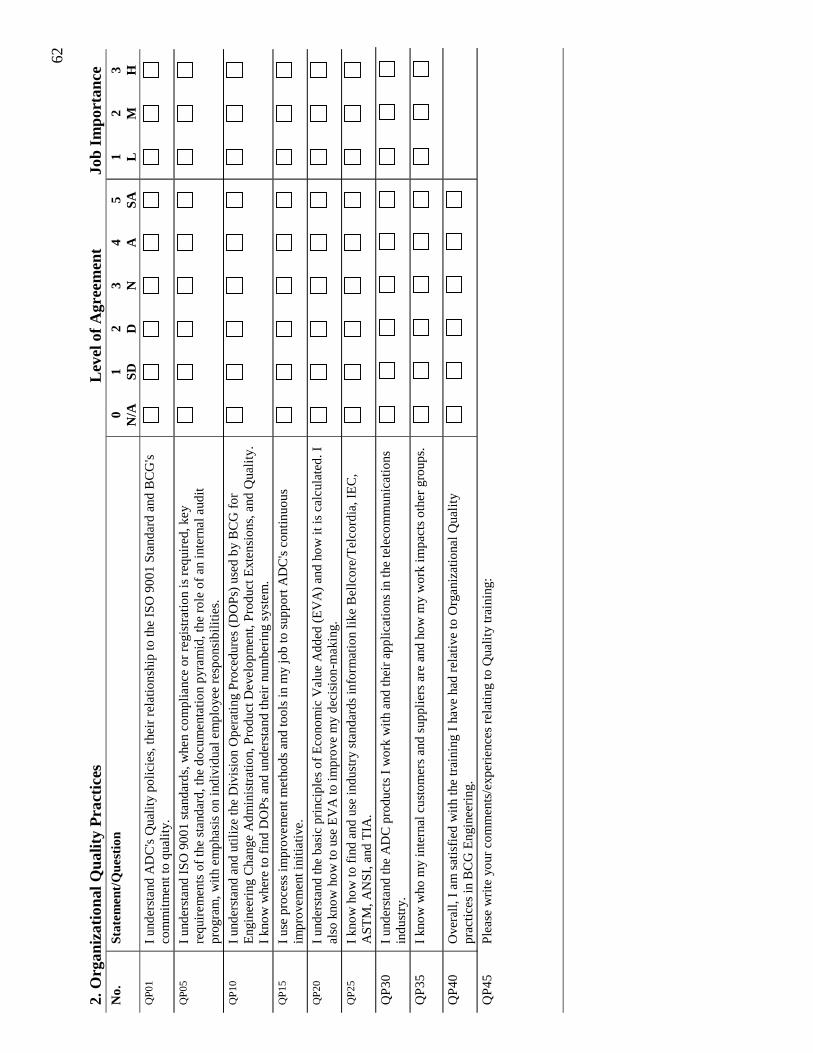
62
2. O
rgan
izat
iona
l Qua
lity
Pra
ctic
esL
evel
of
Agr
eem
ent
J
ob I
mpo
rtan
ceN
o.St
atem
ent/
Que
stio
n0
N/A
1 SD2 D
3 N4 A
5 SA1 L
2 M3 H
QP0
1I
unde
rsta
nd A
DC
's Q
uali
ty p
olic
ies,
thei
r re
latio
nshi
p to
the
ISO
900
1 St
anda
rd a
nd B
CG
'sco
mm
itm
ent t
o qu
alit
y.Q
P05
I un
ders
tand
ISO
900
1 st
anda
rds,
whe
n co
mpl
ianc
e or
reg
istr
atio
n is
req
uire
d, k
eyre
quir
emen
ts o
f th
e st
anda
rd, t
he d
ocum
enta
tion
pyra
mid
, the
rol
e of
an
inte
rnal
aud
itpr
ogra
m, w
ith
emph
asis
on
indi
vidu
al e
mpl
oyee
res
pons
ibili
ties.
QP1
0I
unde
rsta
nd a
nd u
tili
ze th
e D
ivis
ion
Ope
rati
ng P
roce
dure
s (D
OP
s) u
sed
by B
CG
for
Eng
inee
ring
Cha
nge
Adm
inis
trat
ion,
Pro
duct
Dev
elop
men
t, P
rodu
ct E
xten
sion
s, a
nd Q
uali
ty.
I kn
ow w
here
to f
ind
DO
Ps
and
unde
rsta
nd th
eir
num
beri
ng s
yste
m.
QP1
5I
use
proc
ess
impr
ovem
ent m
etho
ds a
nd to
ols
in m
y jo
b to
sup
port
AD
C's
cont
inuo
usim
prov
emen
t ini
tiativ
e.Q
P20
I un
ders
tand
the
basi
c pr
inci
ples
of
Eco
nom
ic V
alue
Add
ed (
EV
A)
and
how
it is
cal
cula
ted.
Ial
so k
now
how
to u
se E
VA
to im
prov
e m
y de
cisi
on-m
akin
g.Q
P25
I kn
ow h
ow to
fin
d an
d us
e in
dust
ry s
tand
ards
info
rmat
ion
like
Bel
lcor
e/T
elco
rdia
, IE
C,
AS
TM
, AN
SI,
and
TIA
.
QP
30I
unde
rsta
nd th
e A
DC
pro
duct
s I
wor
k w
ith
and
thei
r ap
plic
atio
ns in
the
tele
com
mun
icat
ions
indu
stry
.
QP
35I
know
who
my
inte
rnal
cus
tom
ers
and
supp
liers
are
and
how
my
wor
k im
pact
s ot
her
grou
ps.
QP
40O
vera
ll, I
am
sat
isfi
ed w
ith
the
trai
ning
I h
ave
had
rela
tive
to O
rgan
izat
iona
l Qua
lity
prac
tice
s in
BC
G E
ngin
eeri
ng.
QP
45P
leas
e w
rite
you
r co
mm
ents
/exp
erie
nces
rel
atin
g to
Qua
lity
trai
ning
:

63
3. E
ngin
eeri
ng D
ocum
enta
tion
Pra
ctic
esL
evel
of
Agr
eem
ent
J
ob I
mpo
rtan
ceN
o.St
atem
ent/
Que
stio
n0
N/A
1 SD2 D
3 N4 A
5 SA1 L
2 M3 H
ED
01I
know
how
to u
se th
e In
form
atio
n R
etri
eval
Sys
tem
(IR
S) to
fin
d ex
isti
ng p
arts
and
res
erve
new
mat
eria
l num
bers
.E
D05
I kn
ow h
ow to
use
the
SA
P W
eb I
nter
face
to im
port
, exp
ort,
and
disp
lay
Bil
l of
Mat
eria
ls(B
OM
) an
d re
trie
ve E
ngin
eeri
ng C
hang
e O
rder
(E
CO
) nu
mbe
rs.
ED
10I
know
how
to u
se th
e D
raw
ing
Vie
win
g S
yste
m to
vie
w o
nlin
e dr
awin
gs.
ED
15I
also
kno
w h
ow to
use
ER
Lite
to s
ubm
it n
ew d
raw
ings
to th
e dr
awin
g vi
ewin
g da
taba
se.
ED
20I
unde
rsta
nd B
CG
's s
tand
ards
for
cre
atin
g an
d de
sign
ing
artw
ork
for
labe
ls a
nd s
ilk s
cree
ns.
ED
25I
unde
rsta
nd a
spec
ts o
f P
ro/I
ntra
link
nece
ssar
y to
man
age
Pro
/Eng
inee
r da
ta. I
kno
w h
ow to
chec
k in
/che
ck o
ut f
iles,
pro
mot
e/de
mot
e fi
les,
sea
rch
for
file
s, lo
ck f
iles,
dis
play
tabl
es, c
opy
file
s, r
enam
e fi
les,
and
iden
tify
var
ious
icon
s.E
D30
I un
ders
tand
the
stan
dard
s an
d pr
oced
ures
use
d to
def
ine
Pro
/Eng
inee
r pa
rts,
ass
embl
ies,
and
draw
ings
. I k
now
how
to u
se th
e st
anda
rd P
ro/E
ngin
eeri
ng c
onfi
gura
tion
file
s, s
tart
mod
els,
draw
ing
form
ats,
and
nam
ing
conv
entio
ns th
at a
re u
sed
to c
reat
e a
Pro
/Eng
inee
ring
dra
win
gfi
le. (
DO
P-0
03)
ED
35I
unde
rsta
nd v
ario
us p
rodu
ct s
truc
ture
s an
d hi
erar
chie
s an
d kn
ow h
ow to
sel
ect t
he c
orre
ctpr
oduc
t hie
rarc
hy c
ode
for
my
proj
ect.
ED
40I
unde
rsta
nd th
e pr
oces
s of
how
est
imat
ed p
rodu
ct r
elea
se lo
t siz
es a
re d
eter
min
ed a
nd h
owlo
t siz
ing
diff
ers
betw
een
the
vari
ous
man
ufac
turi
ng p
roce
sses
. I k
now
wha
t var
iabl
es to
cons
ider
whe
n m
akin
g re
ason
able
est
imat
es.
ED
45I
unde
rsta
nd th
e co
ncep
ts o
f pr
oduc
t cos
t est
imat
ing
and
know
how
to r
etri
eve
purc
hasi
ngin
form
atio
n an
d re
cord
s to
cre
ate
cost
est
imat
es f
or m
y pr
ojec
ts. I
kno
w th
e di
ffer
ence
betw
een
a m
ovin
g av
erag
e an
d a
stan
dard
pri
ce, a
nd h
ow a
mov
ing
aver
age
is c
alcu
late
d.E
D50
I kn
ow th
e di
ffer
ence
s be
twee
n th
e E
CO
, Com
pone
nt Q
uali
fica
tion
Req
uest
(C
QR
), a
ndM
anuf
actu
ring
Dev
iati
on A
utho
riza
tion
(M
DA
) fo
rms
and
wha
t the
y ar
e us
ed f
or. I
als
okn
ow h
ow to
acc
urat
ely
com
plet
e th
e fo
rms
befo
re s
ubm
ittin
g to
eng
inee
ring
doc
umen
tatio
n.E
D55
I kn
ow h
ow to
com
plet
e an
d su
bmit
a te
st r
eque
st th
at r
efer
ence
s St
anda
rdiz
ed T
estin
gM
etho
ds (
STM
s), i
ndus
try
stan
dard
test
par
amet
ers
(AN
SI, B
ellc
ore/
Tel
cord
ia, e
tc.)
, and
prov
ide
spec
ific
inst
ruct
ions
, fix
ture
s an
d sa
mpl
es to
per
form
a la
b te
st.
ED
60O
vera
ll, I
am
sat
isfi
ed w
ith
the
trai
ning
I h
ave
had
rela
tive
to E
ngin
eeri
ng D
ocum
enta
tion
prac
tice
s in
BC
G E
ngin
eeri
ng.
ED
65P
leas
e w
rite
you
r co
mm
ents
/exp
erie
nces
rel
atin
g to
Eng
inee
ring
Doc
umen
tatio
n tr
aini
ng:
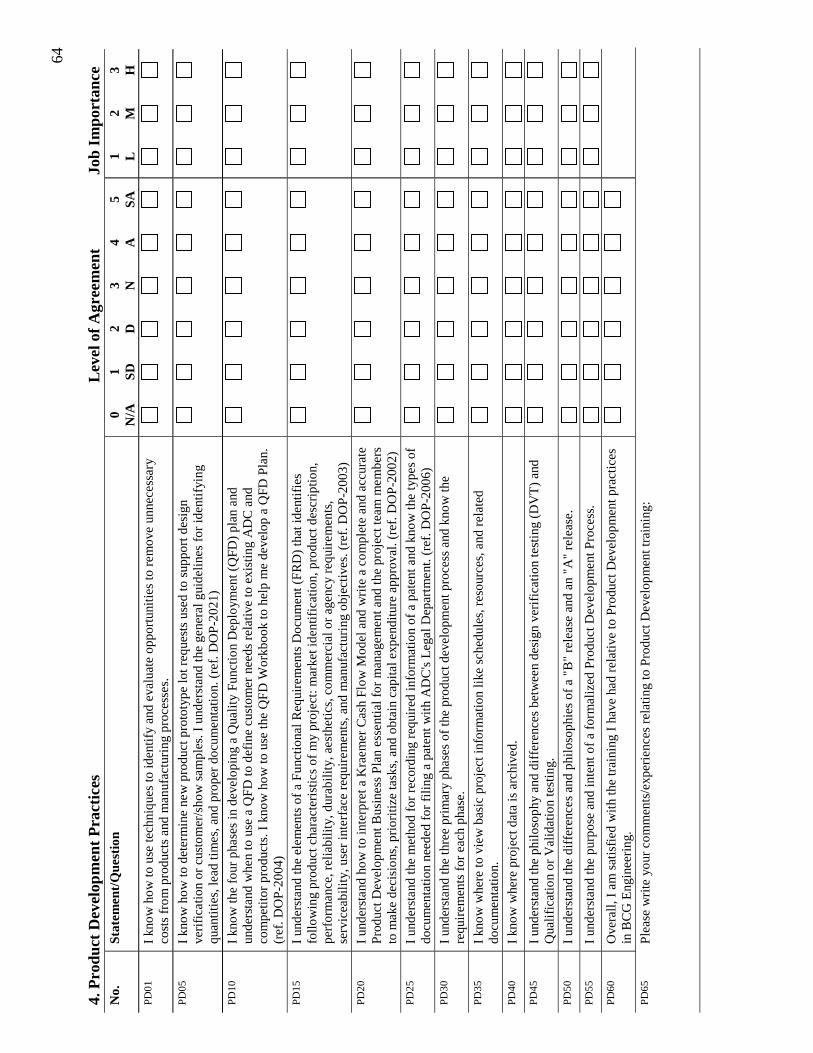
64
4. P
rodu
ct D
evel
opm
ent
Pra
ctic
esL
evel
of
Agr
eem
ent
J
ob I
mpo
rtan
ceN
o.St
atem
ent/
Que
stio
n0
N/A
1 SD2 D
3 N4 A
5 SA1 L
2 M3 H
PD01
I kn
ow h
ow to
use
tech
niqu
es to
iden
tify
and
eva
luat
e op
port
unit
ies
to r
emov
e un
nece
ssar
yco
sts
from
pro
duct
s an
d m
anuf
actu
ring
pro
cess
es.
PD05
I kn
ow h
ow to
det
erm
ine
new
pro
duct
pro
toty
pe lo
t req
uest
s us
ed to
sup
port
des
ign
veri
fica
tion
or c
usto
mer
/sho
w s
ampl
es. I
und
erst
and
the
gene
ral g
uide
line
s fo
r id
enti
fyin
gqu
antit
ies,
lead
tim
es, a
nd p
rope
r do
cum
enta
tion.
(re
f. D
OP
-202
1)PD
10I
know
the
four
pha
ses
in d
evel
opin
g a
Qua
lity
Func
tion
Dep
loym
ent (
QFD
) pl
an a
ndun
ders
tand
whe
n to
use
a Q
FD
to d
efin
e cu
stom
er n
eeds
rel
ativ
e to
exi
stin
g A
DC
and
com
peti
tor
prod
ucts
. I k
now
how
to u
se th
e Q
FD W
orkb
ook
to h
elp
me
deve
lop
a Q
FD P
lan.
(ref
. DO
P-2
004)
PD15
I un
ders
tand
the
elem
ents
of
a F
unct
iona
l Req
uire
men
ts D
ocum
ent (
FR
D)
that
iden
tifi
esfo
llow
ing
prod
uct c
hara
cter
istic
s of
my
proj
ect:
mar
ket i
dent
ific
atio
n, p
rodu
ct d
escr
iptio
n,pe
rfor
man
ce, r
elia
bilit
y, d
urab
ility
, aes
thet
ics,
com
mer
cial
or
agen
cy r
equi
rem
ents
,se
rvic
eabi
lity
, use
r in
terf
ace
requ
irem
ents
, and
man
ufac
turi
ng o
bjec
tive
s. (
ref.
DO
P-2
003)
PD20
I un
ders
tand
how
to in
terp
ret a
Kra
emer
Cas
h F
low
Mod
el a
nd w
rite
a c
ompl
ete
and
accu
rate
Pro
duct
Dev
elop
men
t Bus
ines
s P
lan
esse
ntia
l for
man
agem
ent a
nd th
e pr
ojec
t tea
m m
embe
rsto
mak
e de
cisi
ons,
pri
oriti
ze ta
sks,
and
obt
ain
capi
tal e
xpen
ditu
re a
ppro
val.
(ref
. DO
P-2
002)
PD25
I un
ders
tand
the
met
hod
for
reco
rdin
g re
quir
ed in
form
atio
n of
a p
aten
t and
kno
w th
e ty
pes
ofdo
cum
enta
tion
nee
ded
for
fili
ng a
pat
ent w
ith
AD
C's
Leg
al D
epar
tmen
t. (r
ef. D
OP
-200
6)PD
30I
unde
rsta
nd th
e th
ree
prim
ary
phas
es o
f th
e pr
oduc
t dev
elop
men
t pro
cess
and
kno
w th
ere
quir
emen
ts f
or e
ach
phas
e.PD
35I
know
whe
re to
vie
w b
asic
pro
ject
info
rmat
ion
like
sch
edul
es, r
esou
rces
, and
rel
ated
docu
men
tatio
n.PD
40I
know
whe
re p
roje
ct d
ata
is a
rchi
ved.
PD45
I un
ders
tand
the
phil
osop
hy a
nd d
iffe
renc
es b
etw
een
desi
gn v
erif
icat
ion
test
ing
(DV
T)
and
Qua
lifi
catio
n or
Val
idat
ion
test
ing.
PD50
I un
ders
tand
the
diff
eren
ces
and
phil
osop
hies
of
a "B
" re
leas
e an
d an
"A
" re
leas
e.
PD55
I un
ders
tand
the
purp
ose
and
inte
nt o
f a
form
aliz
ed P
rodu
ct D
evel
opm
ent P
roce
ss.
PD60
Ove
rall,
I a
m s
atis
fied
wit
h th
e tr
aini
ng I
hav
e ha
d re
lati
ve to
Pro
duct
Dev
elop
men
t pra
ctic
esin
BC
G E
ngin
eeri
ng.
PD65
Ple
ase
wri
te y
our
com
men
ts/e
xper
ienc
es r
elat
ing
to P
rodu
ct D
evel
opm
ent t
rain
ing:

65
5. M
anuf
actu
ring
Pra
ctic
esL
evel
of
Agr
eem
ent
J
ob I
mpo
rtan
ceN
o.St
atem
ent/
Que
stio
n0
N/A
1 SD2 D
3 N4 A
5 SA1 L
2 M3 H
MP0
1I
refe
renc
e A
DC
's D
esig
n fo
r M
anuf
actu
ring
han
dboo
k fo
r cu
rren
t pra
ctic
es a
nd g
uide
lines
whe
n de
sign
ing
a pa
rt.
MP0
5I
am a
war
e of
the
scre
w m
achi
ne c
apab
ilitie
s at
AD
C.
MP1
0I
am a
war
e of
the
inje
ctio
n m
oldi
ng c
apab
ilitie
s at
AD
C. I
am
als
o aw
are
of th
e ty
pes
ofm
oldi
ng m
ater
ials
ava
ilabl
e.M
P15
I am
aw
are
of th
e sh
eet m
etal
cap
abili
ties
at A
DC
.
MP2
0I
am a
war
e of
the
stam
ping
cap
abili
ties
at A
DC
.
MP2
5I
am a
war
e of
the
die-
cast
ing
capa
bilit
ies
at A
DC
.
MP3
0I
am a
war
e of
the
fini
shin
g ca
pabi
litie
s at
AD
C.
MP3
5I
unde
rsta
nd th
e us
es o
f ce
lls
and
stan
dard
ized
tool
ing
to r
educ
e m
anuf
actu
ring
cos
ts.
MP4
0I
unde
rsta
nd th
e fa
ctor
s to
det
erm
ine
whe
n to
use
spe
cifi
c m
achi
nes
to p
rodu
ce a
par
t.
MP4
5I
unde
rsta
nd th
e m
etho
d us
ed to
mat
ch a
man
ufac
turi
ng p
roce
ss b
ased
on
part
vol
umes
.
MP5
0I
know
whe
re to
go
or w
ho to
ask
to g
et m
anuf
actu
ring
rel
ated
que
stio
ns a
nsw
ered
.
MP5
5I
know
whe
re to
go
or w
ho to
con
tact
to g
et m
ater
ials
rel
ated
que
stio
ns a
nsw
ered
.
MP6
0I
unde
rsta
nd th
e m
echa
nica
l ass
embl
y m
etho
ds u
sed
at A
DC
.
MP6
5I
unde
rsta
nd th
e el
ectr
ical
ass
embl
y m
etho
ds u
sed
at A
DC
.
MP7
0O
vera
ll, I
am
sat
isfi
ed w
ith
the
trai
ning
I h
ave
had
rela
tive
to M
anuf
actu
ring
pra
ctic
es in
BC
G E
ngin
eeri
ng.
MP7
5P
leas
e w
rite
you
r co
mm
ents
/exp
erie
nces
rel
atin
g to
Man
ufac
turi
ng tr
aini
ng:

66
6. P
rodu
ct T
esti
ng P
ract
ices
Lev
el o
f A
gree
men
t
Job
Im
port
ance
No.
Stat
emen
t/Q
uest
ion
0N
/A1 SD
2 D3 N
4 A5 SA
1 L2 M
3 HPT
01I
know
how
to f
ind
agen
cy d
ocum
enta
tion
to s
uppo
rt th
e te
sts
that
I p
erfo
rm.
PT05
I kn
ow th
e in
form
atio
n, f
ixtu
res
and
sam
ples
I r
ecei
ve to
com
plet
e a
test
req
uire
men
t is
accu
rate
, ena
blin
g m
e to
ret
urn
test
res
ults
in a
tim
ely
man
ner.
PT10
I un
ders
tand
the
purp
ose
of th
e E
ngin
eeri
ng S
peci
fica
tion
and
gui
danc
e it
pro
vide
s to
qual
ific
atio
n an
d on
goin
g Q
ualit
y A
ssur
ance
req
uire
men
ts.
PT15
I kn
ow h
ow to
fin
d th
e D
ivis
ion
Ope
rati
ng P
roce
dure
s (D
OP
), Q
uali
ty A
ssur
ance
Pol
icie
s(Q
AP
), L
abor
ator
y O
pera
ting
Pro
cedu
res
(LO
Ps)
, and
Sta
ndar
d T
est M
etho
ds (
STM
s) to
perf
orm
my
job.
PT20
I kn
ow w
here
to f
ind
lab
proc
edur
es to
sup
port
the
test
s th
at I
per
form
.
PT25
I kn
ow h
ow to
wri
te a
com
plet
e te
st r
epor
t tha
t fol
low
s st
anda
rdiz
ed p
roce
dure
s, d
ocum
ents
test
set
up, a
nd r
epor
ts r
esul
ts.
PT30
I kn
ow h
ow to
ass
ess
and
man
ipul
ate
test
dat
a an
d co
mm
unic
ate
the
info
rmat
ion
to o
ther
sus
ing
the
soft
war
e to
ols
in M
icro
soft
Off
ice
(i.e
., E
xcel
, Wor
d).
PT35
I kn
ow w
here
to s
tore
doc
umen
ted
resu
lts
of te
sts
so o
ther
s ca
n ac
cess
the
info
rmat
ion.
PT40
I kn
ow I
can
rep
rodu
ce te
st r
esul
ts th
at o
ther
s ha
ve d
one
befo
re m
e gi
ven
accu
rate
test
docu
men
tatio
n.PT
45I
am c
omfo
rtab
le u
sing
fun
dam
enta
l ele
ctro
nic
form
ulas
and
con
vers
ions
like
Ohm
's L
aw.
PT50
I kn
ow h
ow to
acc
urat
ely
read
ele
ctri
cal s
chem
atic
s.
PT55
I kn
ow h
ow to
acc
urat
ely
read
mec
hani
cal d
raw
ings
.
PT60
I kn
ow h
ow to
use
SA
P to
che
ck p
arts
sto
ck, v
iew
Bil
ls o
f M
ater
ials
(B
OM
), a
nd r
ead
engi
neer
ing
spec
ific
atio
ns.
PT65
I kn
ow h
ow to
per
form
pro
per
mai
nten
ance
pro
cedu
res
on a
ll la
b eq
uipm
ent.
PT70
I kn
ow I
hav
e ad
equa
te tr
aini
ng to
ope
rate
lab
equi
pmen
t saf
ely
and
wit
h re
peat
able
res
ults
.
PT75
Ove
rall,
I a
m s
atis
fied
wit
h th
e tr
aini
ng I
hav
e ha
d re
lati
ve to
Pro
duct
Tes
ting
prac
tices
inB
CG
Eng
inee
ring
.PT
80P
leas
e w
rite
you
r co
mm
ents
/exp
erie
nces
rel
atin
g to
Pro
duct
Tes
ting
trai
ning
:
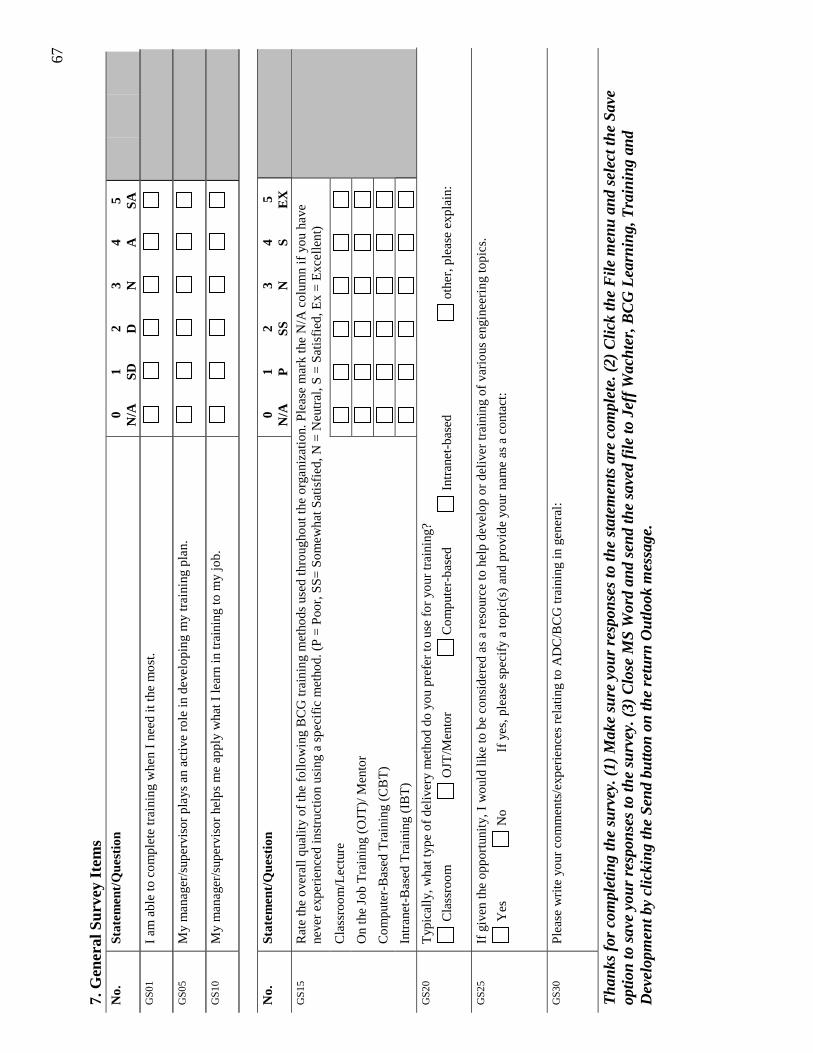
67
7. G
ener
al S
urve
y It
ems
No.
Stat
emen
t/Q
uest
ion
0N
/A1 SD
2 D3 N
4 A5 SA
GS0
1I
am a
ble
to c
ompl
ete
trai
ning
whe
n I
need
it th
e m
ost.
GS0
5M
y m
anag
er/s
uper
viso
r pl
ays
an a
ctiv
e ro
le in
dev
elop
ing
my
trai
ning
pla
n.
GS1
0M
y m
anag
er/s
uper
viso
r he
lps
me
appl
y w
hat I
lear
n in
trai
ning
to m
y jo
b.
No.
Stat
emen
t/Q
uest
ion
0N
/A1 P
2 SS3 N
4 S5 EX
Rat
e th
e ov
eral
l qua
lity
of th
e fo
llow
ing
BC
G tr
aini
ng m
etho
ds u
sed
thro
ugho
ut th
e or
gani
zati
on. P
leas
e m
ark
the
N/A
col
umn
if y
ou h
ave
neve
r ex
peri
ence
d in
stru
ctio
n us
ing
a sp
ecif
ic m
etho
d. (
P =
Poo
r, S
S= S
omew
hat S
atis
fied
, N =
Neu
tral
, S =
Sat
isfi
ed, E
x =
Exc
elle
nt)
Cla
ssro
om/L
ectu
re
On
the
Job
Tra
inin
g (O
JT)/
Men
tor
Com
pute
r-B
ased
Tra
inin
g (C
BT
)
GS1
5
Intr
anet
-Bas
ed T
rain
ing
(IB
T)
GS2
0T
ypic
ally
, wha
t typ
e of
del
iver
y m
etho
d do
you
pre
fer
to u
se f
or y
our
trai
ning
?
Cla
ssro
om O
JT/M
ento
r C
ompu
ter-
base
d In
tran
et-b
ased
oth
er, p
leas
e ex
plai
n:
GS2
5If
giv
en th
e op
port
unit
y, I
wou
ld li
ke to
be
cons
ider
ed a
s a
reso
urce
to h
elp
deve
lop
or d
eliv
er tr
aini
ng o
f va
riou
s en
gine
erin
g to
pics
.
Yes
No
If y
es, p
leas
e sp
ecif
y a
topi
c(s)
and
pro
vide
you
r na
me
as a
con
tact
:
GS3
0P
leas
e w
rite
you
r co
mm
ents
/exp
erie
nces
rel
atin
g to
AD
C/B
CG
trai
ning
in g
ener
al:
Tha
nks
for
com
plet
ing
the
surv
ey. (
1) M
ake
sure
you
r re
spon
ses
to th
e st
atem
ents
are
com
plet
e. (
2) C
lick
the
File
men
u an
d se
lect
the
Save
optio
n to
sav
e yo
ur r
espo
nses
to th
e su
rvey
. (3)
Clo
se M
S W
ord
and
send
the
save
d fi
le to
Jef
f W
acht
er, B
CG
Lea
rnin
g, T
rain
ing
and
Dev
elop
men
t by
clic
king
the
Send
but
ton
on th
e re
turn
Out
look
mes
sage
.
APPENDIX C
Written Comments and Experiences Relating to Training

69
Written Comments and Experiences Relating to Training
Survey participants were given an opportunity to provide written comments that they
felt were relevant to their experiences with the engineering training program at ADC. The
following is a summary of the comments that were written and used to supplement the
data presented to Copper Engineering management.
• The courses I have attended provide general information often times did not provide
the right information for me to apply to my job.
• The training I have had has been minimal at best, and it rarely pertinent to my job or
specific needs.
• Most of my training in the development engineering area has been self-taught by trial
and error or by asking questions of others. Often times the information I gathered
from others was misinformation and resulted in a lot of rework time.
• Working for a division with a strong mechanical background, we often lack some of
the basic requirements of an electronics lab. This applies to intangible as well as
tangible items.
• My supervisor has ensured that I receive all the training my mind can hold and our
budget can afford. He has encouraged our group to be well rounded and informed.
Unfortunately, it seems that we are not receiving some of the basic quality/continuous
improvement training we need. We are not receiving adequate training on ADC
policies and standards and there does not seem to be much in place to make it easier
for the new employee to know what he needs to learn.
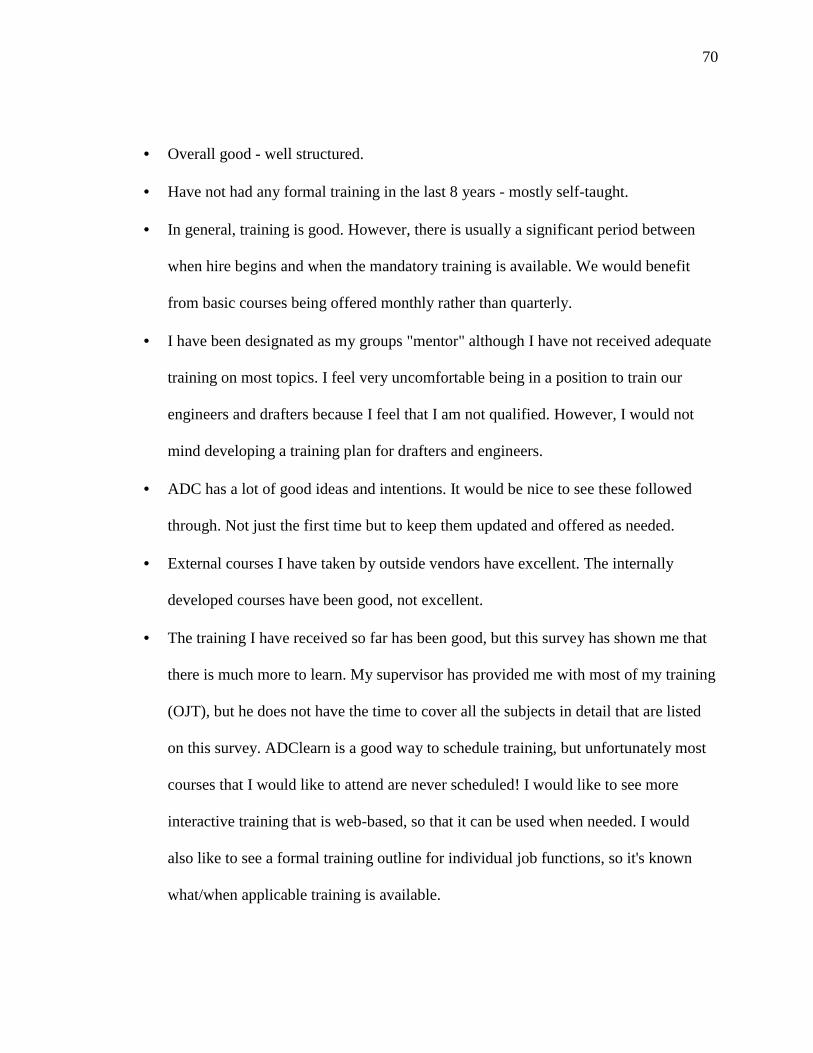
70
• Overall good - well structured.
• Have not had any formal training in the last 8 years - mostly self-taught.
• In general, training is good. However, there is usually a significant period between
when hire begins and when the mandatory training is available. We would benefit
from basic courses being offered monthly rather than quarterly.
• I have been designated as my groups "mentor" although I have not received adequate
training on most topics. I feel very uncomfortable being in a position to train our
engineers and drafters because I feel that I am not qualified. However, I would not
mind developing a training plan for drafters and engineers.
• ADC has a lot of good ideas and intentions. It would be nice to see these followed
through. Not just the first time but to keep them updated and offered as needed.
• External courses I have taken by outside vendors have excellent. The internally
developed courses have been good, not excellent.
• The training I have received so far has been good, but this survey has shown me that
there is much more to learn. My supervisor has provided me with most of my training
(OJT), but he does not have the time to cover all the subjects in detail that are listed
on this survey. ADClearn is a good way to schedule training, but unfortunately most
courses that I would like to attend are never scheduled! I would like to see more
interactive training that is web-based, so that it can be used when needed. I would
also like to see a formal training outline for individual job functions, so it's known
what/when applicable training is available.

71
• I feel that the training supplied to me has been adequate in most areas. Poor in
few. I guess I believe that most of the training a person gets in any job comes
from OJT. It is very hard to train people in specific areas. I think the best way to
train people is to make sure they have a resource person who can point them in
the right direction to get the information that they need. ADC needs to do a better
job of identifying resource people who are knowledgeable in a variety of areas.
• I think the first priority is to develop a process to save and access archived
'master' training material. I think this is the biggest trick to improving training.
• Personally, I do not do well at any kind of class or training. When the training is
for product or procedure. Training should make me familiar with the program. I
learn how to use it when I have a real problem to run it on. The best training for
me is overview of what it is, why it's important, who needs the information, a
print out of examples and choices available, or on line help. Then real life
applications.
• Some training provided is good while others lack. I think the question about
method for training is tough to answer because for some applications, a mentor
works just fine, other times a mentor combined with classroom works. It depends
on the difficulty of the material covered and how often it is used. When classes
are offered once a year, the material is clear, but I do not use it for another couple
of months and it is like starting over.