training course on ‘marine gisapplications for coastal ... · field survey random transect grid...
TRANSCRIPT

Training Course on
‘Marine GIS Applications for Coastal Zone Management’
28 August – September 01, 2017
International Training Centre for operational Oceanography(ITCO),
INCOIS, Hyderabad, India
R S Mahendra

� Mangroves are a crossroad where oceans, freshwater, and land realms
meet. They are among the most productive and complex ecosystems on
the planet, growing under environmental conditions that would kill
ordinary plants very quickly.
� They are the buffer zone between the land and the sea.
� Mangroves protect the soil from erosion.
Importance of mangrove
� They play an invaluable role as a nature’s shield against cyclones,
ecological disasters and as protector of shorelines.
� They are a breeding and nursery grounds for a variety of marine animals.

Distribution of Mangrove
Mangrove distribution in India
Sources: National Geographic Magazine
Environmental Set up � intertidal zones of estuaries, coastlines, and
islands.
� Form a forest in the tidal zone between land and
sea.
� Found in tropical and subtropical areas
� Thrive in areas of high salinity Mangrove trees
have aerial roots that filter salt out of saltwater
� Rich in biodiversity
� home to countless species of animals, including
fish, shrimp, crabs, mollusc, manatees, sea
turtles, fishing cats, monitor lizards and mud-
skipper fish.

Application of RS in mangrove mapping
• Traditional and historical methods proved to be costly and time
consuming.
• Visual interpretation was the only method used earlier.
• Difficulty to discriminate the different species.
• New emerging data, software and techniques evolved. • New emerging data, software and techniques evolved.
• Satellite imagery up-to-date and available.
• Able to reach remote and inaccessible areas.
• Multispectral and hyper-spectral imagery allows for species
discrimination at different levels and fine detailed mapping.
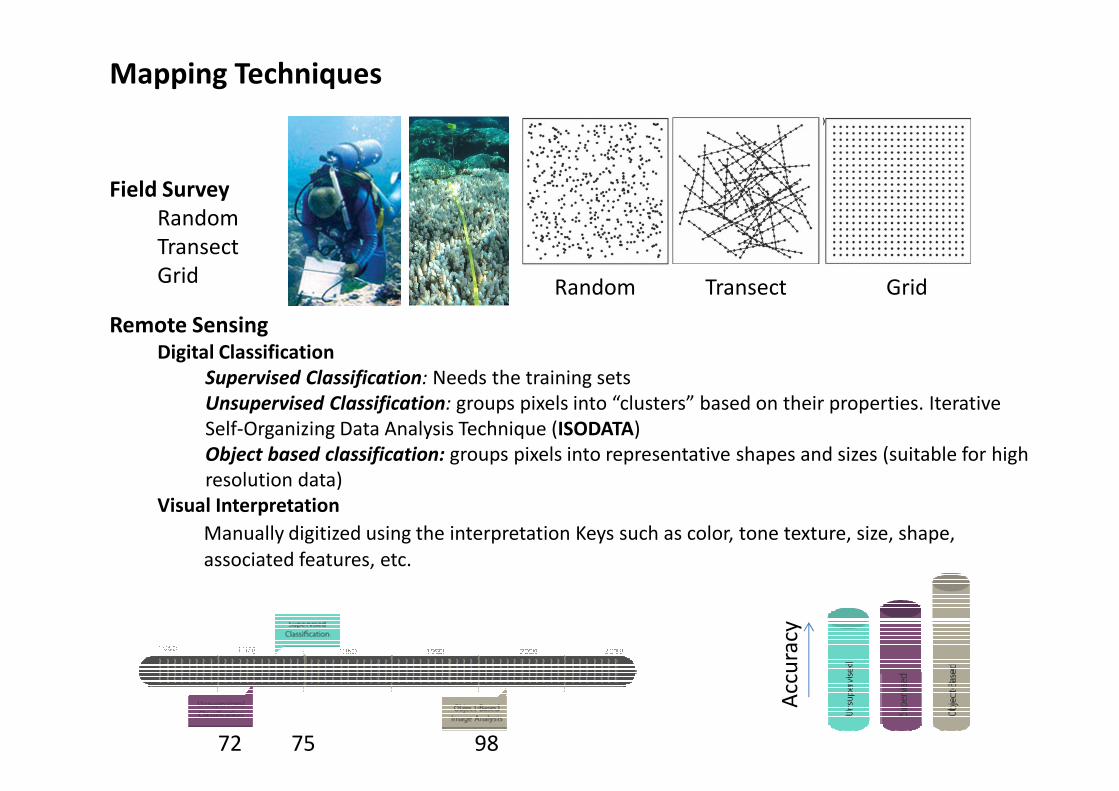
Mapping Techniques
Field Survey
Random
Transect
Grid
Remote SensingDigital Classification
Supervised Classification: Needs the training sets
Unsupervised Classification: groups pixels into “clusters” based on their properties. Iterative
Random Transect Grid
Unsupervised Classification: groups pixels into “clusters” based on their properties. Iterative
Self-Organizing Data Analysis Technique (ISODATA)
Object based classification: groups pixels into representative shapes and sizes (suitable for high
resolution data)
Visual Interpretation
Manually digitized using the interpretation Keys such as color, tone texture, size, shape,
associated features, etc.
Acc
ura
cy
72 75 98

Advantage and disadvantages of supervised and unsupervised classifications

Image analysis assumptions
• Similar features will have similar spectral responses.
• The spectral response of a feature is unique with respect
to all other features of interest.
• If we quantify the spectral response of a known feature,
we can use this information to find all occurrences of that
feature.

complexityDifferent stage o f mangroves
Different species composition
Leaf types
Association of other vegetation and
water body
Remote Sensing of Mangrove
Plate depicting the ETM spectral window and its
transmission percentage (above). The individual bands
(below).

Table 2 Data set used for the study
Satellite Sensor
Spatial
Resoluti
on
Wavelength
(µm)
Date of
Acquisition
0.52-0.60
0.76-0.90
Identification of hot spots and well managed areas of Pichavaram Mangrove
Landsat TM 30 m
0.76-0.90
1.55-1.75 29/01/1991
Landsat TM 30 m
0.52-0.60
0.76-0.90
1.55-1.75 28/10/2000
Resurcesat-
1
LISS-
IV5.8 m
0.52-0.59
0.62-0.68
0.77-0.86 22/07/2006
Study area
Satellite Data used

Methodology
Radiance conversion: The digital numbers (DN) of each band of all
images are transformed in to real numbers using the spectral
calibration data with the help of graphical programming interface
‘Model Maker’ in ERDAS imagine software. The calibration is given
by the following equation (1) for satellite spectral radiance.
Lrad = {[DN/max grey]*[Lmax - Lmin]} +Lmin ......... (1)
Where
DN = Digital number of a pixel
Max Grey = Maximum DN possible for a given data
Lmax= Minimum radiance value for a given bandLmax= Minimum radiance value for a given band
Lmin=Minimum radiance value for a given band.

Mangrove Mapping– Pichavaram Southeast coast IndiaCase Study: Pichavaram Mangroves
Srinivasa Kumar, T., Mahendra, R. S., Nayak, S., Radhakrishnan, K. R. and Sahu, K. C. (2011) Identification of hot spots and well managed areas of Pichavaram mangrove using Landsat TM and Resourcesat – 1 LISS IV: An example of coastal resource conservation along Tamil Nadu Coast, India. Journal of Costal Conservation, DOI: 10.1007/s11852-011-0162-3, available online.

Mangrove Class
Area in km2
1991 2000 2006
Dense Mangrove 2.76 3.17 5.00
Spatio-temporal variation of Pichavaram Mangroves
Dense Mangrove 2.76 3.17 5.00
Open Mangrove 1.80 3.38 2.06
Total area 4.56 6.55 7.06

Inter Change of Mangrove class

Coral Reef Mapping

Ecological
� The coral reefs are counterpart to the tropical rain forest in terms of speciesrichness and biological productivity in the Ocean. The vast diversity of animaland plant species that contributes to its system and genetic heritage that it
Introduction
What is Coral?
• It’s a living invertebrate organism under class Cnidarians
• 2 different types: Reef Building: Hermatypic and Solitary: Ahermatypic
• Symbiotic relationship with algae Zooxanthella lives in the skin of coral, coral provide
protection to and Zooxanthalle provide food and color.
and plant species that contributes to its system and genetic heritage that itrepresents is increasingly at risk
� Coral reef enables the formation of associated eco-systems which allow theformation of essential habitats, fisheries and livelihoods.
Climatological
� Corals are providing an accurate long-term record of climate change andextending our knowledge of even seasonal climate variability in many remotetropical oceans.habitats, fisheries and livelihoods.
Major threats for the corals
Natural: Environmental-Temperature, Sediment Deposition, Salinity, pH, etc
Anthropogenic: Mining, Bottom Fishing, Tourism, pollution, etc.

Reef Building types
• Corals can build three types of
reefs:
– Fringing: grows close to shore
– Barrier: also grows close to shore – Barrier: also grows close to shore
but has a lagoon separating it
from the shore
– Atoll: a ring of coral that
surrounds a lagoon, often grows
on a submerged mountain or
volcanohttp://www.nos.noaa.gov/education/kits/
corals/media/coral04a_240.jpg
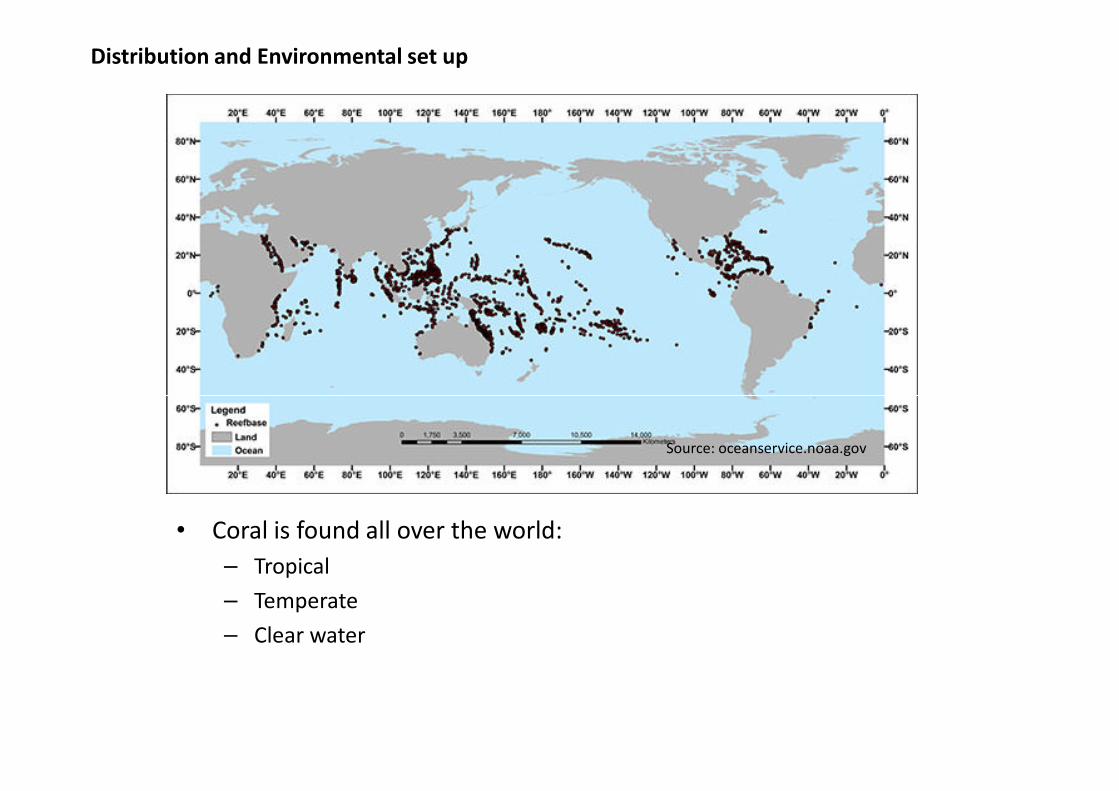
Distribution and Environmental set up
Source: oceanservice.noaa.gov
• Coral is found all over the world:
– Tropical
– Temperate
– Clear water

Coral Reef Remote Sensing
Source: Contreras-Silva et al. 2012
Source: www.seos-project.eu

Eco-morphological Zonation of Coral Reef and Health Modeling
Malvan
Study Areas
Gulf of Kuchchh
Malvan
Gulf of Mannar
A & N Islands
Objectives
�Generation of the eco-morphological maps and Atlas on 1:25000 scales.
Methods
Paper presented at ISRS Symposium, Ahemedabad, India, 2008
Classified maps Changes 2000-2006
The coral reef got exposed
due to 26 December 2004
Sumatra earthquake.
Total area of 7.9 sq. km
area exposed and degraded
Kalubar Island FCC and Classified map
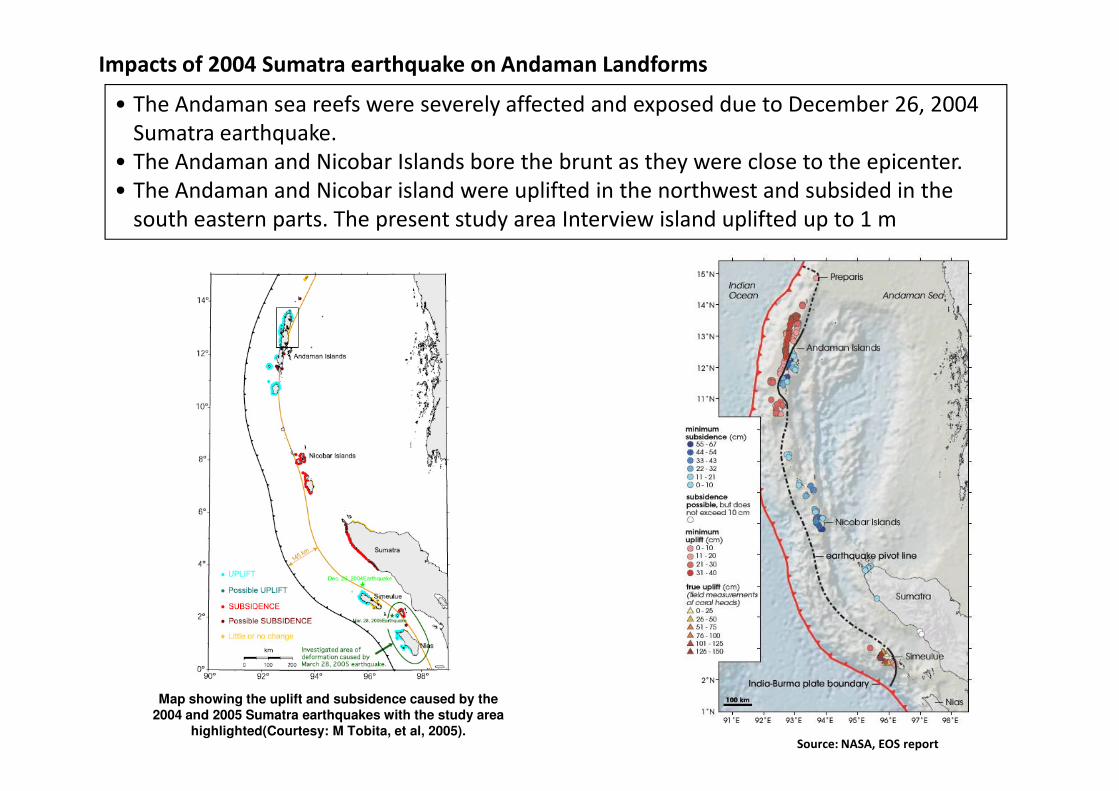
Impacts of 2004 Sumatra earthquake on Andaman Landforms
• The Andaman sea reefs were severely affected and exposed due to December 26, 2004
Sumatra earthquake.
• The Andaman and Nicobar Islands bore the brunt as they were close to the epicenter.
• The Andaman and Nicobar island were uplifted in the northwest and subsided in the
south eastern parts. The present study area Interview island uplifted up to 1 m
Source: NASA, EOS report
Map showing the uplift and subsidence caused by the
2004 and 2005 Sumatra earthquakes with the study area
highlighted(Courtesy: M Tobita, et al, 2005).

Current Sea level
Sea Level before 2004
Current HTL
HTL before 2004
Mangroves
Coral reefs
Sea
Land
Up
lift
Schematic diagram showing the land uplift and subsidence
Mangrove
degradation
Coral Exposure
HTL before 2004
Sea
Land
Su
bsi
de
nce

SpatioSpatio--temporaltemporal changeschanges inin thethe coralcoral environsenvirons duedue toto 20042004 SumatraSumatra EqEq..
Tectonic disturbances Total Coral Area Exposed Reefs
AndamanAlgae and Seagrass
Algal Ridge
Beach/ Sand Pat ch
Channel
Coral Heads
Coralline Shelf
Deeper Inner Reef Flat
Deeper Reef Flat
Exposed Reef Flat
Exposed Reef Flat (Algae)
Exposed Reef Flat (Sand)
Inner Reef Flat
Live Corals
Mud Flat
Muddy Reef Flat
Out er Reef Flat
Reef Crest
Reef Flat
Reef Slope
Rock
Sand Cay s
Sanded Reef Flat
Sandy Muddy Reef Flat
Shallow Pools
Sparse Algae
Sparse Algae on Boulder Zone
Sparse Algae on Muddy Reef Flat
Sparse Algae on Reef Flat
Submerged Reef
Submerged Rock s
Windward Reef Front
Sparse Algae on Sandy Muddy Reef Flat
Total area of exposed category recorded ~113 km2 from Andaman Islands

Field Photos
Sea
Debris of coral
Corals thrown out and overturnedPools
Pools
Mangroves
Exposed corals
Exposure 0.9 m observed above water level
Exposed coralsAndaman and Nicobar

Remotely Operated Vehicle (ROVe) for coral samplingApril 2016 North bay Andaman

SpatioSpatio--temporaltemporal changeschanges inin thethe MangroveMangrove environsenvirons duedue toto 20042004 SumatraSumatra EqEq..
Total ~49.24 km2 areas of mangroves were degraded during 2000-2006 in the Andaman coast.
Spatio temporal changes in the mangroves cover in the northern parts of interview island

Accuracy Assessment Sampling
• Random sampling
• Systematic sampling
• Stratified random sampling
• Stratified systematic unaligned sampling
• Cluster sampling
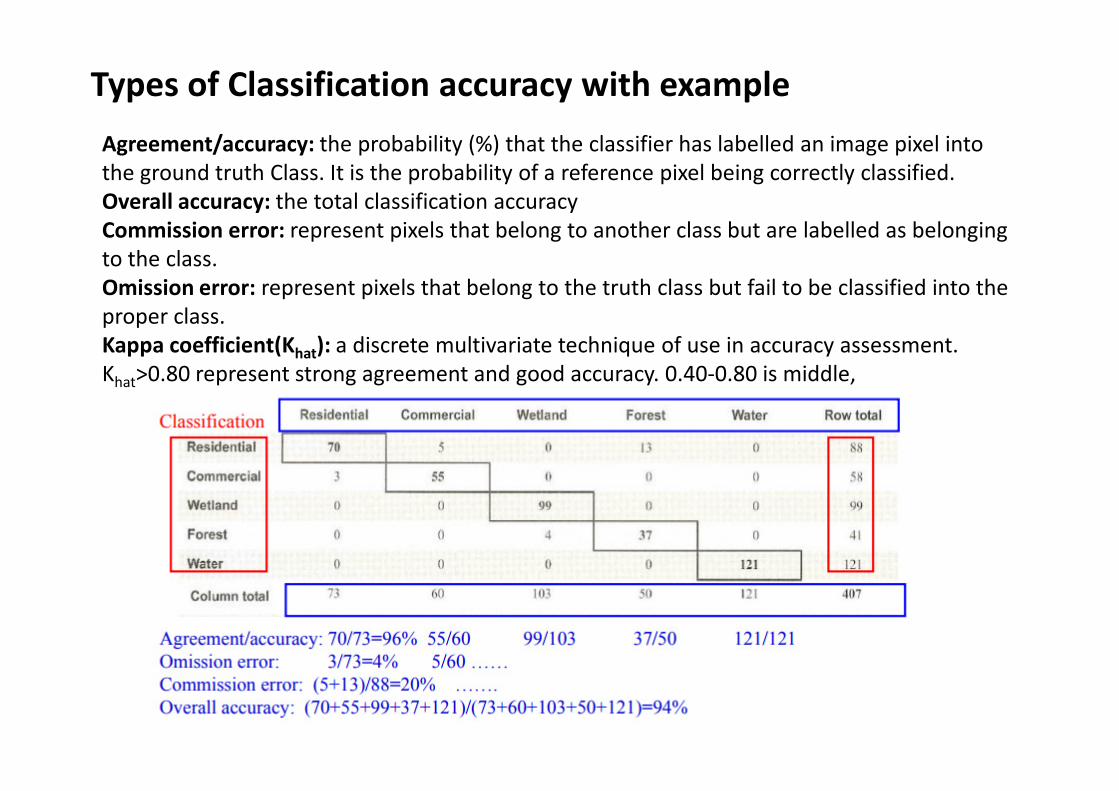
Agreement/accuracy: the probability (%) that the classifier has labelled an image pixel into
the ground truth Class. It is the probability of a reference pixel being correctly classified.
Overall accuracy: the total classification accuracy
Commission error: represent pixels that belong to another class but are labelled as belonging
to the class.
Omission error: represent pixels that belong to the truth class but fail to be classified into the
proper class.
Kappa coefficient(Khat): a discrete multivariate technique of use in accuracy assessment.
Khat>0.80 represent strong agreement and good accuracy. 0.40-0.80 is middle,
Types of Classification accuracy with example

Cntd.......

The Remote Sensing and GIS techniques used in
concurrence with the satellite data gives fairly better results
in understanding the spatio-temporal changes in mangroves
Remarks
and coral reefs along the coastal zones. In light of all these
facts and analyses, it can be concluded that there is a
strong need to make necessary coastal management
programs and implement them in potential risk zones.

Thank YouThank You