train energy, power and traffic control - university of …jrose/railwayintro/modules...rees module...
TRANSCRIPT

REES Module #3 - Train Energy, Power and Traffic Control 1 © 2010 J. Riley Edwards and Chris Barkan. All Rights Reserved.
Train Energy, Power and Traffic Control
J. Riley Edwards
University of Illinois at Urbana-Champaign
© 2010 University of Illinois Board of
Trustees. All Rights Reserved.

REES Module #3 - Train Energy, Power and Traffic Control 2 © 2010 J. Riley Edwards and Chris Barkan. All Rights Reserved.
Train energy, power
and traffic control
Q1: What is objective of a rail
transportation system?
A1: To provide
TRANSPORTATION!
(freight and/or
passenger)
Q2: What are the principal
factors affecting the
capacity of a rail system
to provide transportation?

REES Module #3 - Train Energy, Power and Traffic Control 3 © 2010 J. Riley Edwards and Chris Barkan. All Rights Reserved.
Railway Elements Affecting
Transportation Capacity
ALMOST EVERYTHING!

REES Module #3 - Train Energy, Power and Traffic Control 4 © 2010 J. Riley Edwards and Chris Barkan. All Rights Reserved.
Comparison of truck vs. rail energy efficiency
(AAR & FRA data)
What distance can each mode transport a given amount of freight for
a given amount of energy?
i.e. how far can we transport one ton
of freight with one gallon of diesel fuel?
Rail is over 3 times
more efficient than truck

REES Module #3 - Train Energy, Power and Traffic Control 5 © 2010 J. Riley Edwards and Chris Barkan. All Rights Reserved.
Why?
• What are the two primary aspects of transportation energy
efficiency?
– Resistance
How much work is required to move something.
– Energy efficiency
How efficiently energy is converted into useful work.

REES Module #3 - Train Energy, Power and Traffic Control 6 © 2010 J. Riley Edwards and Chris Barkan. All Rights Reserved.
What is resistance and how is it measured?
Early measurement of railcar resistance simply involved piling weight on at
w and determining how much was needed to make the car move.
Same basic concept applies to measuring resistance in any other
transport mode, although the effect of speed is not accounted for by
this method
Resistance is typically measured in “pounds per ton” (in U.S.)

REES Module #3 - Train Energy, Power and Traffic Control 7 © 2010 J. Riley Edwards and Chris Barkan. All Rights Reserved.
SPEED (mph)
RE
SIS
TA
NC
E (
lbs
./to
n)
Speed and Resistance by Transport Mode
Rail uniquely combines
High Speed and Low Resistance
Airplanes
Trucks
Boat

REES Module #3 - Train Energy, Power and Traffic Control 8 © 2010 J. Riley Edwards and Chris Barkan. All Rights Reserved.
Trains require less force to move than trucks
• What are the principal reasons?
1) Steel wheel on steel rail has
much lower rolling resistance
than rubber tire on pavement.
2) Stronger vehicles and
infrastructure allow heavier loads,
thereby allowing economies of
scale (ca. 3 x truck).
3) “Trains” - multiple, closely-
coupled vehicles are more
aerodynamic, and experience
less air resistance per railcar than
trucks.

REES Module #3 - Train Energy, Power and Traffic Control 9 © 2010 J. Riley Edwards and Chris Barkan. All Rights Reserved.
Sources of rail vehicle resistance
A varies with weight ("journal" or "bearing" resistance)
B varies directly with velocity ("flange" resistance)
C varies with the square of velocity (air resistance)
The general expression for train resistance is thus:
R = AW + BV + CV2
where: R equals total resistance
W = weight
V = velocity
A = resistances that vary with axle
load (includes bearing friction,
rolling resistance and track
resistance)
B = resistances that vary directly
with speed (primarily flange friction
and effects of sway and oscillation)
C = resistances
that vary as the
square of speed
(affected by
aerodynamics of
the train)
Cross-section of the
vehicle, streamlining
of the front & rear,
and surface
smoothness all affect
air resistance

REES Module #3 - Train Energy, Power and Traffic Control 10 © 2010 J. Riley Edwards and Chris Barkan. All Rights Reserved.
Measurement of train resistance
• Substantial research early in the 20th century led to the development of a general formula for train resistance.
• Developed by W.J. Davis, it is still sometimes referred to as the “Davis” equation.
• Ro = 1.3 + 29/w + bV + CAV2/wn
where:
Ro = resistance in lbs. per ton
w = weight per axle (= W/n)
W = weight of car
b = an experimental friction coefficient for flanges, shock, etc.
A = cross-sectional area of vehicle
C = drag coefficient based on the shape of the front of the train and other features affecting air turbulence etc.
• The Davis Equation has been substantially updated to reflect modern developments, but its basic form is the same.

REES Module #3 - Train Energy, Power and Traffic Control 11 © 2010 J. Riley Edwards and Chris Barkan. All Rights Reserved.
Speed and resistance for conventional freight train
At low speeds, journal resistance dominates, but as speed increases air
resistance is increasingly the most important term
C
B
A

REES Module #3 - Train Energy, Power and Traffic Control 12 © 2010 J. Riley Edwards and Chris Barkan. All Rights Reserved.
Resistance versus speed for a 10,000 ton train
• Train resistance is calculated by multiplying the resistance per ton at each speed, by the total tonnage of the train.

REES Module #3 - Train Energy, Power and Traffic Control 13 © 2010 J. Riley Edwards and Chris Barkan. All Rights Reserved.
POWER!
Q: How do railroads overcome such large resistances?

REES Module #3 - Train Energy, Power and Traffic Control 14 © 2010 J. Riley Edwards and Chris Barkan. All Rights Reserved.
Physics of power, force and speed
• Work = force x distance W = F x D
• Power is the rate at which work is done
Power = work/time P = W/T = FD/T
• The relationship between
Force and Distance/Time
(i.e. speed) is thus inverse
Fo
rce
Speed
• The higher the speed,
the less force available
• Curves like this are used
to describe the performance
capabilities of locomotives

REES Module #3 - Train Energy, Power and Traffic Control 15 © 2010 J. Riley Edwards and Chris Barkan. All Rights Reserved.
Typical modern freight locomotive
Typical modern freight train
6,000 horsepower,
212 tons
100 cars x 143 tons each = 14,300 tons

REES Module #3 - Train Energy, Power and Traffic Control 16 © 2010 J. Riley Edwards and Chris Barkan. All Rights Reserved.
Speed/tractive effort curve for a
modern locomotive
Tractive effort is measured in pounds of force available as a function of speed
At low speed, tractive
effort is limited by
adhesion, not power

REES Module #3 - Train Energy, Power and Traffic Control 17 © 2010 J. Riley Edwards and Chris Barkan. All Rights Reserved.
Train resistance and tractive effort are both measurements of force (typically in pounds in North America) so we can simply overlay the curves
How do we relate tractive effort curves
to train resistance? Tractive effort & train resistance curves
Q: What is the maximum speed
possible for this train with this
locomotive?
A: About 58 mph. This is referred
to as the “balancing speed”.
Tractive force = resistance
ca. 35,000 lbs.

REES Module #3 - Train Energy, Power and Traffic Control 18 © 2010 J. Riley Edwards and Chris Barkan. All Rights Reserved.
Force available for acceleration declines with speed until the balancing speed is
reached, where it is zero. Consequently, the rate of acceleration declines with speed.
What is the relationship between power curves,
resistance and acceleration?
The difference between tractive effort and resistance
is the force available for acceleration
Q: How much force is available for
acceleration at 15 mph?
A: 135,000 - 15,000 = 120,000 lbs.
Q: How much force is available for
acceleration at 35 mph?
A: 59,000 - 21,000 = 38,000 lbs.

REES Module #3 - Train Energy, Power and Traffic Control 19 © 2010 J. Riley Edwards and Chris Barkan. All Rights Reserved.
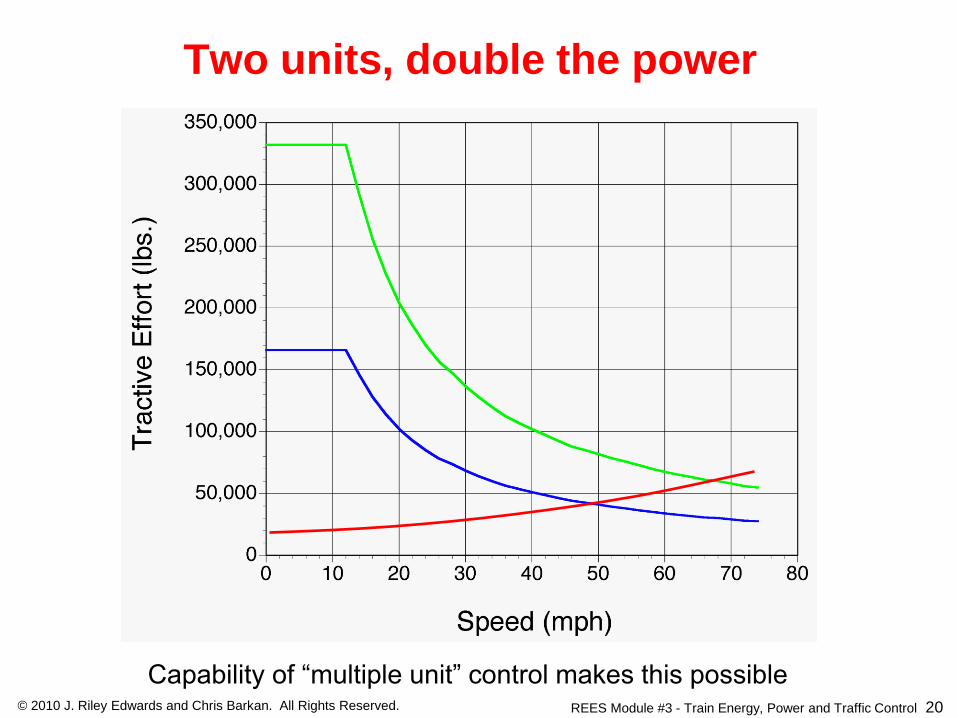
Multiple unit control
• Nearly all modern locomotives (electric and diesel electric powered)
are capable of “multiple unit” control
• This allows power to be matched to the requirements of any size train
to maximize either efficiency or speed
• This concept has been extended through the use of radio-controlled
“slave” units distributed through the train.
• “Distributed power” is particularly useful for heavy freight trains
because it enables longer trains and better control, particularly on
grades.
• The control circuits can be electrically connected so that a single
operator can control multiple locomotives
REES Module #3 - Train Energy, Power and Traffic Control 20 © 2010 J. Riley Edwards and Chris Barkan. All Rights Reserved.
What if we need more power?
Capability of “multiple unit” control makes this possible
Two units, double the power

REES Module #3 - Train Energy, Power and Traffic Control 21 © 2010 J. Riley Edwards and Chris Barkan. All Rights Reserved.
Freight Train Time/Speed Graph
This curve depicts a single locomotive, how will the curve change if a second locomotive is added?
How long will it take for
this train to reach 40 mph?
About 900 seconds
= 15 minutes

REES Module #3 - Train Energy, Power and Traffic Control 22 © 2010 J. Riley Edwards and Chris Barkan. All Rights Reserved.
Freight Train Time/Speed Graph - 2 Units
Now how long will it take to
reach 40 mph?
About 300 seconds
≈ 6 minutes

REES Module #3 - Train Energy, Power and Traffic Control 23 © 2010 J. Riley Edwards and Chris Barkan. All Rights Reserved.
Freight Train Distance/Speed Graph
How many miles until this
train reaches 40 mph?
About 75,000 feet
= 14 miles

REES Module #3 - Train Energy, Power and Traffic Control 24 © 2010 J. Riley Edwards and Chris Barkan. All Rights Reserved.
Freight Train Distance/Speed Graph
With 2 locomotives, only
about 25,000 feet ≈ 5 miles

REES Module #3 - Train Energy, Power and Traffic Control 25 © 2010 J. Riley Edwards and Chris Barkan. All Rights Reserved.
Horsepower to trailing tonnage ratio for
different types of trains
• General merchandise or “manifest”
freight train
• Low horsepower:trailing ton ratio
12,000 hp: 14,300 tons = 0.83
hp:ton
• High-speed train, especially if there are frequent stops and starts.
• High horsepower:trailing ton ratio may be 2 to 4 hp:ton
• Typical of “hot” intermodal trains and is even higher for passenger trains

REES Module #3 - Train Energy, Power and Traffic Control 26 © 2010 J. Riley Edwards and Chris Barkan. All Rights Reserved.
Highest horsepower to trailing ton ratio
Conventional passenger train
= 4 to 8 hp:trailing ton
BNSF Fast UPS test train
= 6 hp:trailing ton
Rapid transit
= 10 hp:ton

REES Module #3 - Train Energy, Power and Traffic Control 27 © 2010 J. Riley Edwards and Chris Barkan. All Rights Reserved.
Time/distance graph
freight train with one locomotive

REES Module #3 - Train Energy, Power and Traffic Control 28 © 2010 J. Riley Edwards and Chris Barkan. All Rights Reserved.
Stopping the train
• From a safety standpoint, stopping the train
is even more important than accelerating it.
• The same low coefficient of friction between
steel wheel and steel rail that allows low
rolling resistance, also limits braking ability.
• Although trains can be decelerated in less
distance than they can be accelerated,
stopping a train requires considerably more
distance and time than a motor vehicle.

REES Module #3 - Train Energy, Power and Traffic Control 29 © 2010 J. Riley Edwards and Chris Barkan. All Rights Reserved.
Distance/Speed Graph - Stopping
Stopping a train can often
take a mile or more

REES Module #3 - Train Energy, Power and Traffic Control 30 © 2010 J. Riley Edwards and Chris Barkan. All Rights Reserved.
Railroad grade crossings
• Laws of physics dictate that a train
cannot stop if a motor vehicle is on
the tracks at a highway rail grade
crossing.
• Therefore, protection of grade
crossings is critically important.
• Motorists must observe and
respect warning systems
Photos Copyright Ernest H. Robl; all rights reserved. Used with permission
REES Module #3 - Train Energy, Power and Traffic Control 31 © 2010 J. Riley Edwards and Chris Barkan. All Rights Reserved.
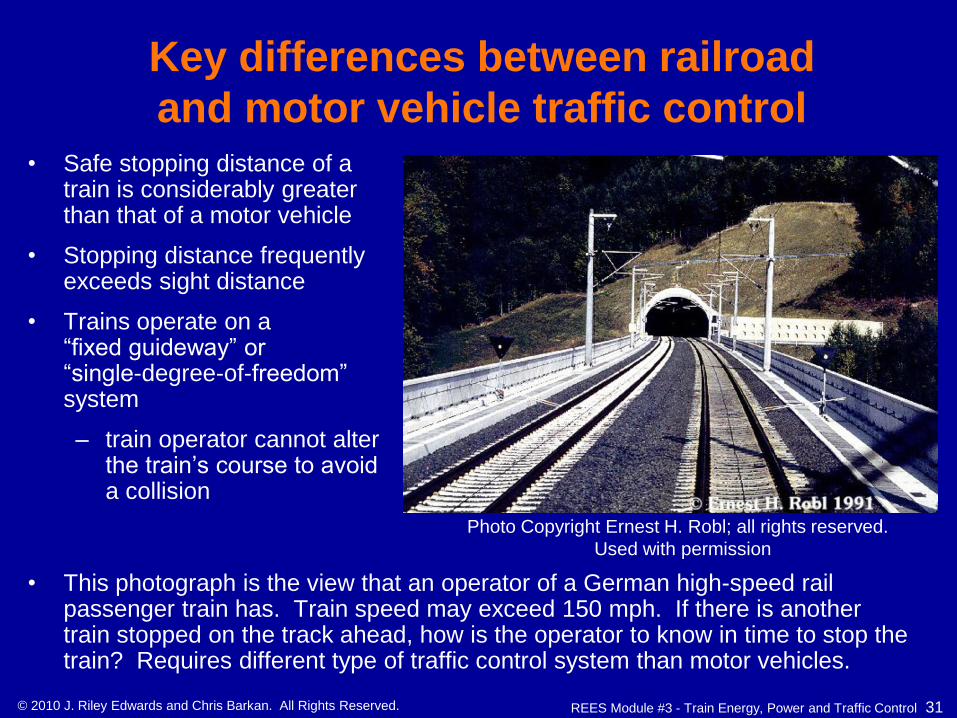
Key differences between railroad
and motor vehicle traffic control • Safe stopping distance of a
train is considerably greater than that of a motor vehicle
• Stopping distance frequently exceeds sight distance
• Trains operate on a “fixed guideway” or “single-degree-of-freedom” system
– train operator cannot alter the train’s course to avoid a collision
• This photograph is the view that an operator of a German high-speed rail passenger train has. Train speed may exceed 150 mph. If there is another train stopped on the track ahead, how is the operator to know in time to stop the train? Requires different type of traffic control system than motor vehicles.
Photo Copyright Ernest H. Robl; all rights reserved.
Used with permission

REES Module #3 - Train Energy, Power and Traffic Control 32 © 2010 J. Riley Edwards and Chris Barkan. All Rights Reserved.
Simple possible solution
• Allow only one train on a track at a time
• By controlling access, i.e. by “granting authority” to a train to use a section of track, a dispatcher can ensure that there are no collisions
• Will this work?
– Yes
• What are the drawbacks?
– Inefficient use of infrastructure
• When might a system like this be suitable?
– Low density line

REES Module #3 - Train Energy, Power and Traffic Control 33 © 2010 J. Riley Edwards and Chris Barkan. All Rights Reserved.
What if there is more traffic, and line
capacity needs to be increased?
• How can the capacity of a line with a traffic control system such as this be increased?
– divide it up into “blocks”
• Train dispatcher can ensure that there are no collisions by controlling access to each block.
A
B
• These systems employed people as “block operators” who worked in “block stations” located every few miles along the rail line
• Allows more trains to operate on the line simultaneously
REES Module #3 - Train Energy, Power and Traffic Control 34 © 2010 J. Riley Edwards and Chris Barkan. All Rights Reserved.
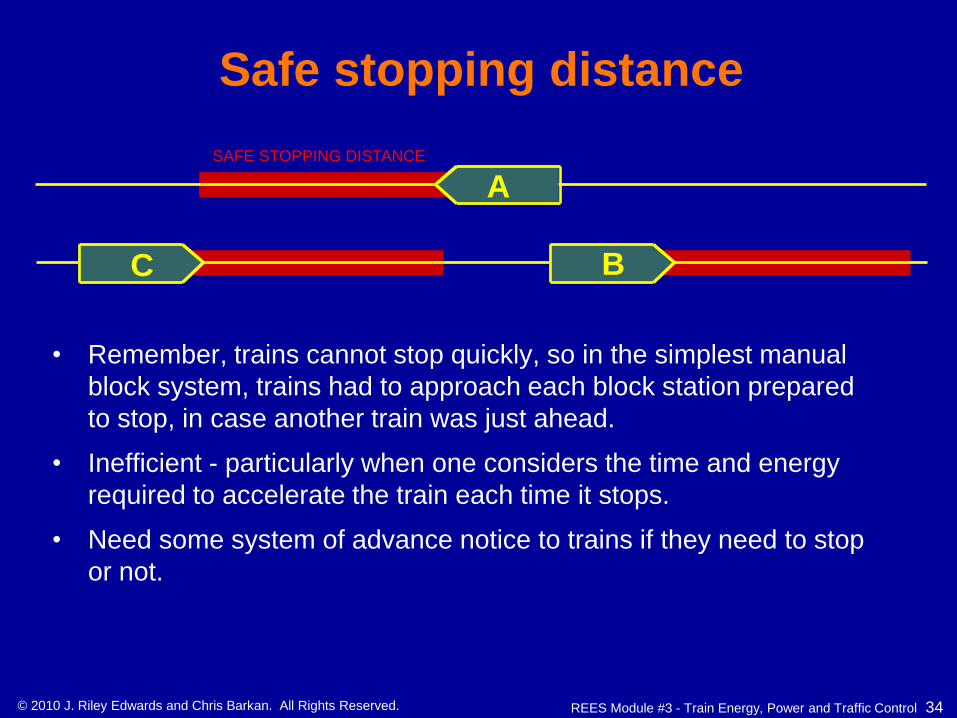
Safe stopping distance
• Remember, trains cannot stop quickly, so in the simplest manual
block system, trains had to approach each block station prepared
to stop, in case another train was just ahead.
• Inefficient - particularly when one considers the time and energy
required to accelerate the train each time it stops.
• Need some system of advance notice to trains if they need to stop
or not.
A
C B
Safe stopping distanceSAFE STOPPING DISTANCE

REES Module #3 - Train Energy, Power and Traffic Control 35 © 2010 J. Riley Edwards and Chris Barkan. All Rights Reserved.
“Home” and “Distant” signals
• Good Solution:
“Home Signal” that train crew
can see before they arrive
• These were mounted along
side the track at each block
station
• Better solution: Add a “Distant Signal” that tells crew whether they need to stop or not at the next “Home Signal”.
• These were located some distance ahead of the block station and the Home Signal and provided advance notice of its status.
DISTANT SIGNAL

REES Module #3 - Train Energy, Power and Traffic Control 36 © 2010 J. Riley Edwards and Chris Barkan. All Rights Reserved.
Manual Block Signal Control
Note: Block signals shown in
one direction only for clarity

REES Module #3 - Train Energy, Power and Traffic Control 37 © 2010 J. Riley Edwards and Chris Barkan. All Rights Reserved.
Direct Traffic Control
Dispatcher at
remote location
Similar to Manual Block, except block stations and
operators replaced by a single dispatcher using radio
instead of wayside signals to monitor train position and
communicate block occupancy status

REES Module #3 - Train Energy, Power and Traffic Control 38 © 2010 J. Riley Edwards and Chris Barkan. All Rights Reserved.
Q: What are the drawbacks of the
manual block system?
A: It is labor intensive
Ideally we would have an automatic system for railway traffic control. How could one do that?

REES Module #3 - Train Energy, Power and Traffic Control 39 © 2010 J. Riley Edwards and Chris Barkan. All Rights Reserved.
Basic railway track circuits
Track is unoccupied, track relay is
energized, circuit is shunted to illuminate
Green indicating “clear”
Track is occupied, wheel & axle shunts track
circuit, de-energizing track relay, circuit is
shunted to illuminate Red indicating “stop”
The rails conduct low voltage electric current and the track is divided into
electrically isolated “blocks”. As train moves from block to block its
presence is detected. The system is “Fail Safe”, that is, if it fails it is in the
most restrictive condition. This includes failed track battery, broken wires
or a broken rail in the block.

REES Module #3 - Train Energy, Power and Traffic Control 40 © 2010 J. Riley Edwards and Chris Barkan. All Rights Reserved.
Automatic
block signals

REES Module #3 - Train Energy, Power and Traffic Control 41 © 2010 J. Riley Edwards and Chris Barkan. All Rights Reserved.
Centralized Traffic Control • A system by which the movement of trains over routes and through
blocks is directed by signals controlled from a designated point without requiring the use of train orders and without the establishment of the superiority of trains
• A term describing the system that provides an economical means for directing the movement of train by signal indications without the use of train orders
• A combination of automatic block systems and interlockings which can be adapted to any existing signal indication and applied to single track or to two or more tracks

REES Module #3 - Train Energy, Power and Traffic Control 42 © 2010 J. Riley Edwards and Chris Barkan. All Rights Reserved.
Example CTC Display

REES Module #3 - Train Energy, Power and Traffic Control 43 © 2010 J. Riley Edwards and Chris Barkan. All Rights Reserved.
Positive Train
Control (PTC)
Coming soon to
a railroad near
you!

REES Module #3 - Train Energy, Power and Traffic Control 44 © 2010 J. Riley Edwards and Chris Barkan. All Rights Reserved.
PTC Background
• Rail Safety Improvement Act of 2008 mandates
installation of positive train control (PTC) on:
– All mainlines over which operate regularly-scheduled
commuter or intercity passenger trains
– Mainlines of Class I freight carriers over which Toxic
Inhalation Hazardous (TIH) materials are handled
– Such other lines as designated by the Secretary
of Transportation

REES Module #3 - Train Energy, Power and Traffic Control 45 © 2010 J. Riley Edwards and Chris Barkan. All Rights Reserved.
PTC and CBTC
• Positive Train Control (PTC) is a system designed to prevent:
1. Train-to-train collisions
2. Over-speed derailments
3. Incursions into established work zone limits
4. Movement of a train through a switch left in the wrong position
• Communications Based Train Control (CBTC) is a control system in which train monitoring and train control are integrated into a single system via data links between vehicle, central office and wayside computers

REES Module #3 - Train Energy, Power and Traffic Control 46 © 2010 J. Riley Edwards and Chris Barkan. All Rights Reserved.
PTC vs. CBTC
• PTC is a performance standard based on
legislation and regulation
• CBTC is a train control technology
– CBTC may not meet PTC requirements
– PTC requirements can be met without CBTC
• Current proposals are for PTC qualified
CBTC systems

REES Module #3 - Train Energy, Power and Traffic Control 47 © 2010 J. Riley Edwards and Chris Barkan. All Rights Reserved.
A Review of Current
Traffic Control Systems
• Authority transmitted via:
– Written or verbal messages
– Wayside signals
• Wayside signals manage speed and headway
• Trains are separated by a distance several times their
stopping distance
Clear Approach Restricting

REES Module #3 - Train Energy, Power and Traffic Control 48 © 2010 J. Riley Edwards and Chris Barkan. All Rights Reserved.
Real Time Train Speed and Location Data
• Information for dispatcher:
– Allows train dispatchers to respond more quickly to changing conditions and service disruptions
– Can improve meet/pass planning
• Information for train crew:
– Provides real-time data on authorities, train spacing and route
– Engineer is able to receive and react to changing signals and authorities immediately

REES Module #3 - Train Energy, Power and Traffic Control 49 © 2010 J. Riley Edwards and Chris Barkan. All Rights Reserved.
Moving Blocks
• Enables train separation to based on the
stopping distance and speed of the
individual train
Start of Braking
Minimum
Headway at
Normal Speed
3-Aspect Conventional Signal System
Standalone CBTC with Moving Blocks Start of Braking/
Minimum Headway

REES Module #3 - Train Energy, Power and Traffic Control 50 © 2010 J. Riley Edwards and Chris Barkan. All Rights Reserved.
Benefits of Moving Blocks
• Reduce time lost during passes on single track
– Shorter headways and eliminates time waiting for first
block to clear
• Heterogeneous traffic
– Train separation based on individual
train characteristics
• Temporary track outages
– Fleeting possible with closer headways
• However implementation requires a suitable means of
broken rail detection

REES Module #3 - Train Energy, Power and Traffic Control 51 © 2010 J. Riley Edwards and Chris Barkan. All Rights Reserved.
Copyright Restrictions and Disclaimer
Presentation Author J. Riley Edwards
Railroad Engineering Program
Civil & Environmental Engineering Department
University of Illinois at Urbana-Champaign
1201 Newmark Civil Engineering Lab, MC-250
Urbana, IL 61801
(217) 244-7417
It is the author’s intention that the information contained in this file be used for non-commercial, educational
purposes with as few restrictions as possible. However, there are some necessary constraints on its use as
described below.
Copyright Restrictions and Disclaimer:
The materials used in this file have come from a variety of sources and have been assembled here for
personal use by the author for educational purposes. The copyright for some of the images and graphics
used in this presentation may be held by others. Users may not change or delete any author attribution,
copyright notice, trademark or other legend. Users of this material may not further reproduce this material
without permission from the copyright owner. It is the responsibility of the user to obtain such permissions
as necessary. You may not, without prior consent from the copyright owner, modify, copy, publish, display,
transmit, adapt or in any way exploit the content of this file. Additional restrictions may apply to specific
images or graphics as indicated herein.
The contents of this file are provided on an "as is" basis and without warranties of any kind, either express
or implied. The author makes no warranties or representations, including any warranties of title,
noninfringement of copyright or other rights, nor does the author make any warranties or representation
regarding the correctness, accuracy or reliability of the content or other material in the file.