trafficassessment montaño rail runnor fation · trafficassessment montaño rail runnor fation...
TRANSCRIPT

Traffic Assessment
Montaño Rail Runnor fation
Prepared For:
Mid-Region Council of Governments
Study Prepared By:
Harwck Transportation Group, Inc.1440 Camino Cerrito SEAlbuquerque, NM 87123
January 13, 2010
Monfaflo Rail Runner !21alionTraffic Assessment
TABLE OF CONTENTS
Description Page
1.0 Introduction 11.1 Roadway Network 1
2.0 Traffic Analysis Methodology 2
3.0 Traffic Volumes 4
4.0 Trip Generation, Distribution and Assignment 64.1 Trip Generation 64.2 Trip Distribution 64.3 Trip Assignment 7
5.0 Traffic Analysis 85.1 Signalized Intersection Analysis 85.2 Unsignalized Intersection Analysis 9
6.0 Findings and Recommendations 136.1 Findings and Considerations 136.2 Recommendations 14
Tables
Table 1 Signalized Intersection Levels of Service 2Table 2 Unsignalized Intersection Levels of Service 3Table 3 Existing AM and PM Peak Hour Baseline Turning Movement Volumes 4Table 4 100 Space Build AM and PM Peak Hour Turning Movement Volumes 4Table 5 200 Space Build AM and PM Peak Hour Turning Movement Volumes 5Table 6 250 Space Build AM and PM Peak Hour Turning Movement Volumes 5Table 7 Trip Generation 6Table 8 Trip Distribution Subarea Percentages 7Table 9 Trip Assignments — 3 Alternatives 7Table 10 Montafio Rd Signalized Intersection Measures of Effectiveness 8Table 11 Progression Analyses Results 9Table 12 Site Access Unsignalized Intersection Levels of Service 10Table 13 Montaflo Rd Site Access Gap Study Summary 11
13-Jan-i 0
Monlano Rail Runnor 21alionTraffic Assessment
Appendices
Appendix A Vicinity and Site MapsAppendix B Traffic Volume SummaryAppendix C Trip Generation, Distribution and AssignmentsAppendix D Existing Level of Service AnalysesAppendix E Alternative 1 Level of Service AnalysesAppendix F Alternative 2 Level of Service AnalysesAppendix G Alternative 3 Level of Service AnalysesAppendix H Gap Study Summary
Acronyms
AASHTO American Association of State Highway and Transportation Officials
AADT Annual Average Daily Traffic
AAWDT Annual Average Weekday Traffic
AAWET Annual Average Weekend Traffic
g/C Green time per signal Cycle length
HCM Highway Capacity Manual
HCS Highway Capacity Software
HTG Harwick Transportation Group
ITE Institute of Transportation Engineers
LOS Level of Service
MRCOG Mid-Region Council of Governments
mph Miles per Hour
MTP Metropolitan Transportation Plan (current document for year 2025)
MUTCD Manual on Uniform Traffic Control Devices
NMDOT New Mexico Department of Transportation
pcphpl Passenger cars per hour per lane
PHF Peak Hour Factor
STIP Statewide Transportation Improvement Plan
v/c Volume to Capacity ratio
vpd Vehicles per Day
vph Vehicles per Hour
ii 13-Jan-10
Monlaflo Rail Rannor fafionTraffic Assessment
1.0 INTRODUCTION
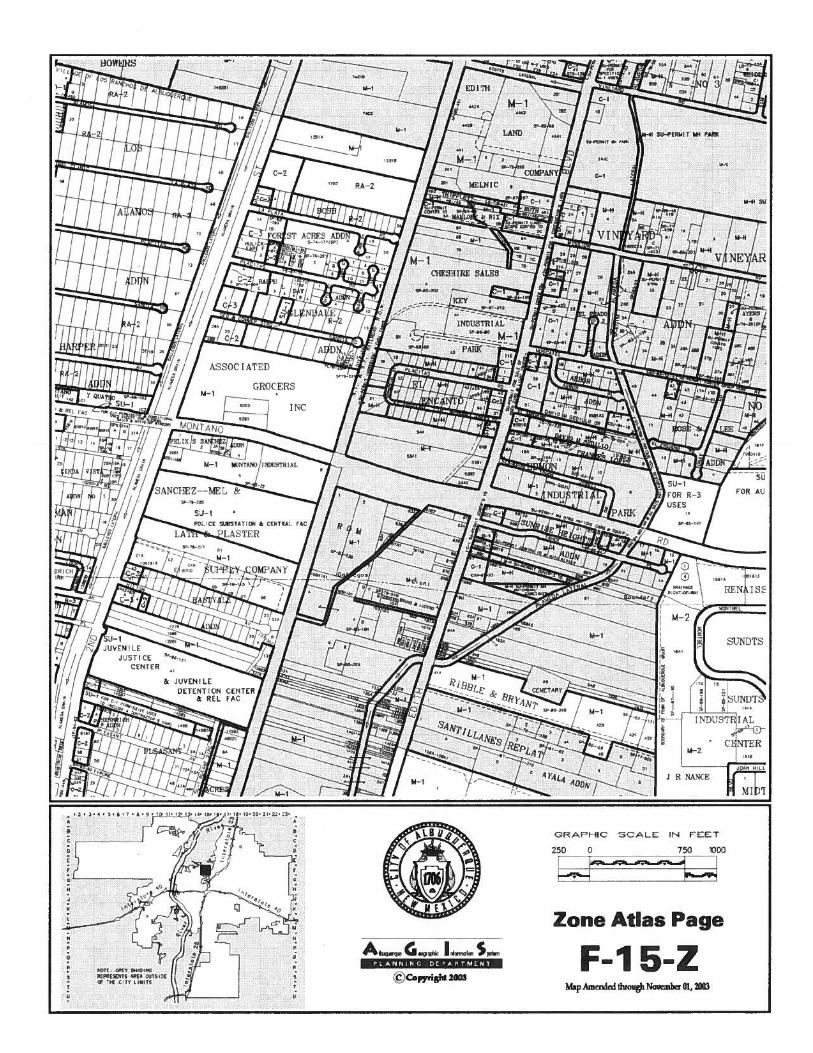
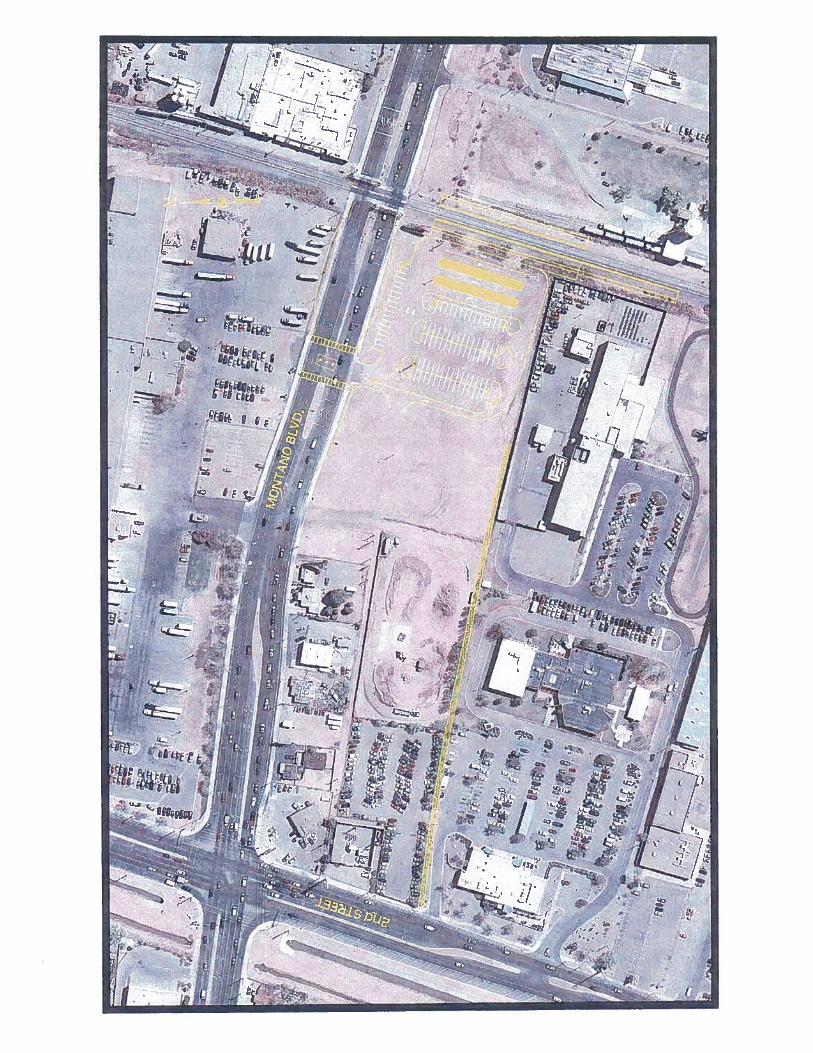
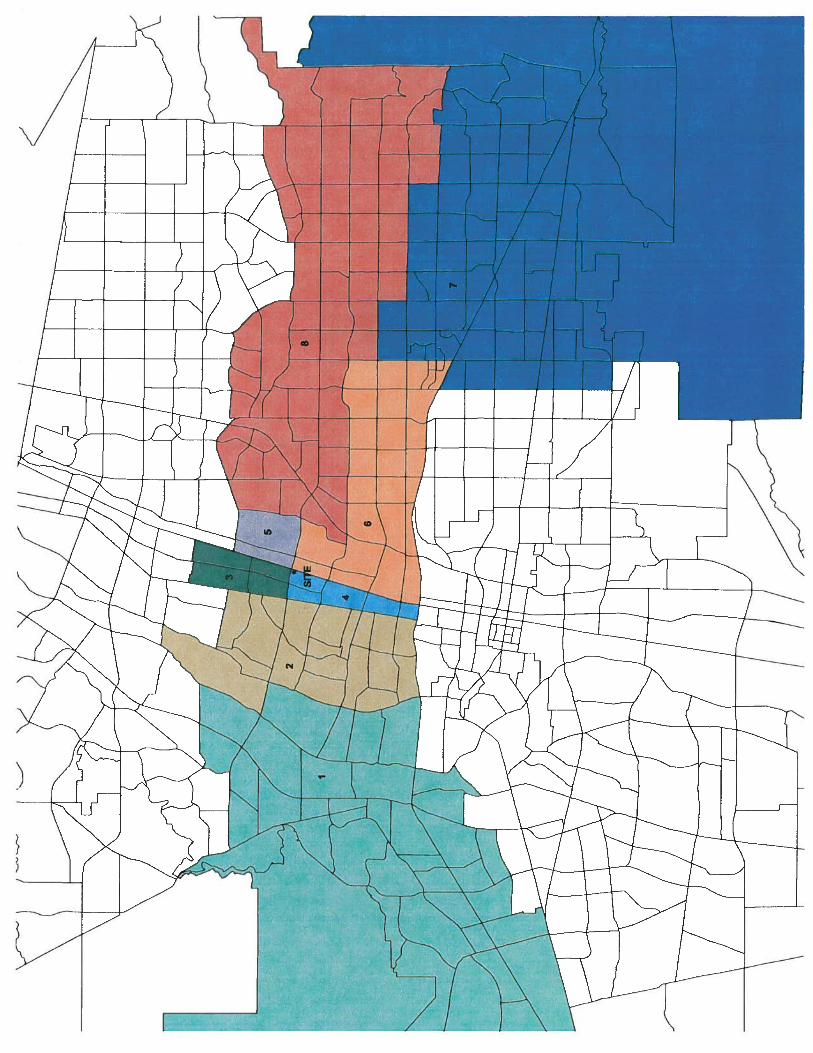
This traffic assessment has been prepared for the proposed Montaño Rd Rail Runner station inAlbuquerque, NM. The conm-iuter rail station will be located to serve both the northeastheights and the Taylor Ranch area in northwest Albuquerque. It is anticipated that access to thesite will be via bus transit, passenger vehicle, and bicycle. All three modes are currently servedon Montaño Rd. The proposed rail station is to be located along the south side of Montaflo Rdbetween 2’ St and Edith Blvd. The site has an existing median opening and driveway whichare proposed for use by the site. A vicinity map and aerial based site plans are included inAppendix A.
The report details the existing operations on Montaflo Rd in the vicinity of the proposed site,and describes three alternative design scenarios. Operations were verified at each of theadjacent signalized intersections, 2’ St and Edith Blvd, and a gap study was conducted at thesite access to determine if adequate gaps should be available for unsignalized operations. Tripgeneration, distribution and assignment were prepared for new site trips, and traffic operationswere evaluated for the existing condition and each alternative scenario. The results, findings,and recommendations are detailed herein.
1.1 ROADWAY NETWORK
Montaño Rd is a 4/5 and 6/7 lane principal arterial that includes a Rio Grande crossing west ofthe site. This roadway has 3-through lanes in each travel direction at the site access and isreduced to 2 through lanes at the 2uid St intersection (approximately 1000’ west of the siteaccess). Montaño Rd has a posted speed limit of 45 mph with bicycle lanes and sidewalks oneach side of the road. A raised median manages access along this road.
1 13-Jan-10
Moniaño Rail Runnor !2tafionTraffic Assessment
2.0 TRAFFIC ANALYSIS METHODOLOGY
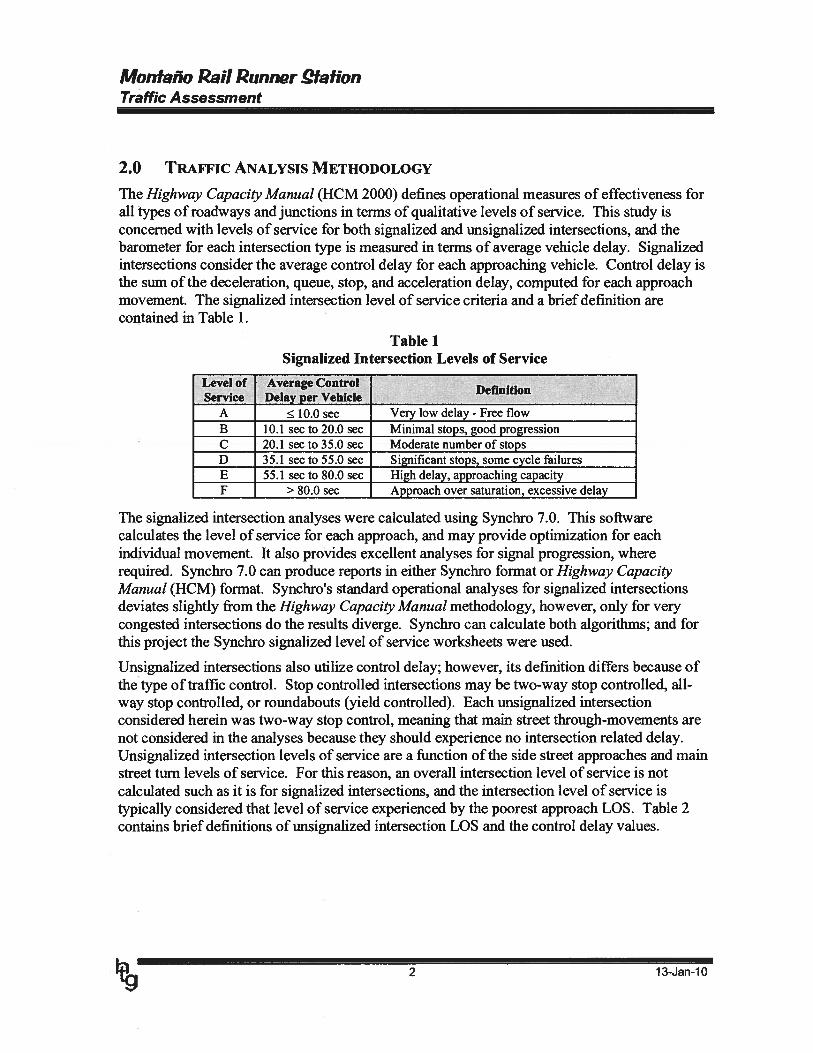
The Highway Capacity Manual (HCM 2000) defines operational measures of effectiveness forall types of roadways and junctions in terms of qualitative levels of service. This study isconcerned with levels of service for both signalized and unsignalized intersections, and thebarometer for each intersection type is measured in terms of average vehicle delay. Signalizedintersections consider the average control delay for each approaching vehicle. Control delay isthe sum of the deceleration, queue, stop, and acceleration delay, computed for each approachmovement. The signalized intersection level of service criteria and a brief definition arecontained in Table 1.
Table 1Signalized Intersection Levels of Service
Level of Average ControlService Delay per Vehftd
Definition
A 10.0 sec Very low delay - Free flow —
B 10.1 sec to 20.0 sec Minimal stops, good progressionC 20.1 sec to 35.0 sec Moderate number of stopsD 35.1 sec to 55.0 sec Significant stops, some cycle failuresE 55.1 sec to 80.0 sec High delay, approaching capacityF > 80.0 sec Approach over saturation, excessive delay
The signalized intersection analyses were calculated using Synchro 7.0. This softwarecalculates the level of service for each approach, and may provide optimization for eachindividual movement. It also provides excellent analyses for signal progression, whererequired. Synchro 7.0 can produce reports in either Synchro format or Highway CapacityManual (HCM) format. Synchro’s standard operational analyses for signalized intersectionsdeviates slightly from the Highway Capacity Manual methodology, however, only for verycongested intersections do the results diverge. Synchro can calculate both algorithms; and forthis project the Synchro signalized level of service worksheets were used.
Unsignalized intersections also utilize control delay; however, its definition differs because ofthe type of traffic control. Stop controlled intersections may be two-way stop controlled, all-way stop controlled, or roundabouts (yield controlled). Each unsignalized intersectionconsidered herein was two-way stop control, meaning that main street through-movements arenot considered in the analyses because they should experience no intersection related delay.Unsignalized intersection levels of service are a function of the side street approaches and mainstreet turn levels of service. For this reason, an overall intersection level of service is notcalculated such as it is for signalized intersections, and the intersection level of service istypically considered that level of service experienced by the poorest approach LOS. Table 2contains brief definitions of unsignalized intersection LOS and the control delay values.
2 13-Jan-10

Montaño Rail Runnor fationTraffic Assessment
Table 2Unsignalized Intersection Levels of Service
Level of Average Control• . Definition
Service Delay per VehicleA 10.0 sec Little or no delayB 10.1 sec to 15.0 sec Short traffic delaysC 15.1 sec to 25.0 sec Average traffic delaysD 25.1 sec to 35.0 sec Long traffic delaysE 35.1 sec to 50.0 sec Very long traffic delays, approaching capacity
F > 50.0 sec Over capacity, excessive delay
The unsignalized intersection analyses were evaluated using Synchro 7.0. While this programis primarily a signalized intersection tool, it also performs unsignalized intersection analysesthat are consistent with the Highway Capacity Manual methodology and the output results areidentical to those produced by the McTrans Highway Capacity Software.
Urban areas typically assign an overall level of service (LOS) D as the desirable base conditionfor signalized intersections. LOS E may be acceptable for certain low volume approaches ormovements, especially where a higher level of service may significantly degrade a majormovement or where the default is LOS E based upon the intersection cycle length or lowapproach volumes. LOS D is also the desired approach level of service for urban unsignalizedintersections; however, lower service levels may be acceptable for very low volumeapproaches.
A series of assumptions must be made for all level of service analyses. For this study, thefollowing analysis assumptions were made, and they apply to existing and forecast analyses:
• Lane Width - Nominally 12 feet• Truck Percentage - Assumed 2% (actual percentages mostly lower)• Existing Peak Hour Factors - Measured in field, applied by approach average• Forecast Peak Hour Factors — Based upon existing PHFs and a 0.25 PHF for site
movements• Saturation Flow Rate - 1900 pcphpl• Roadway Grades - All analyses assume flat grades• Change Intervals - 4 seconds amber, 1.5 second all red• Cycle Lengths - Existing cycles, maximum 120 seconds AM and PM.• Signalized Operations - Actuated-Coordinated is assumed• Arrival Type - Random on each roadway• Right-turn-on-Red - Estimated• Conflicting Pedestrians - Minimal• Area Type - Non CBD
3 13-Jan-10
Moniaflo Rail Runnor .QtationTraffic Assessment
3.0 TRAFFIC VOLUMES
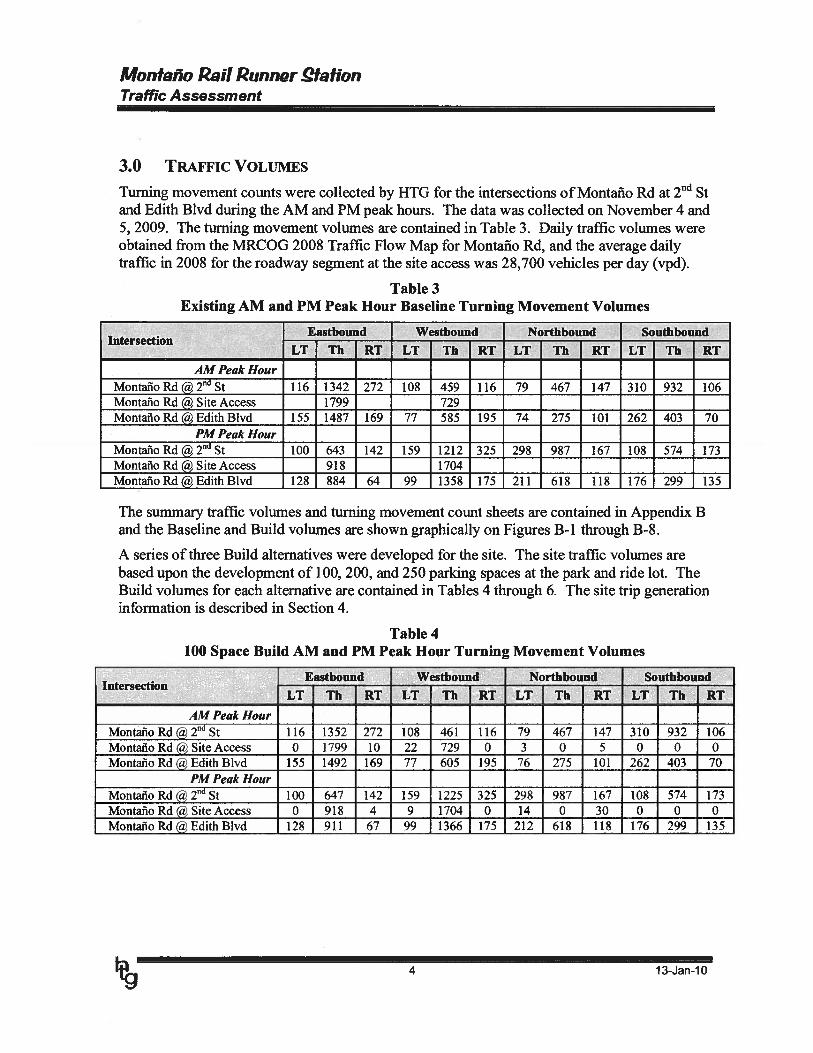
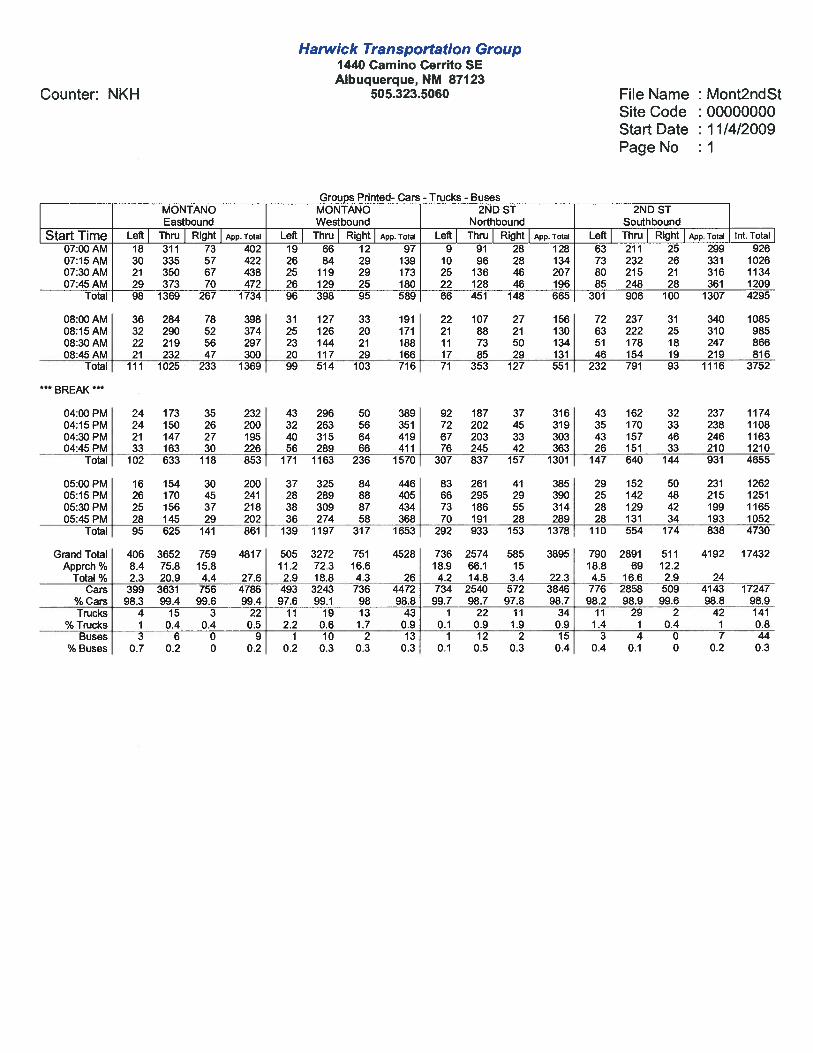
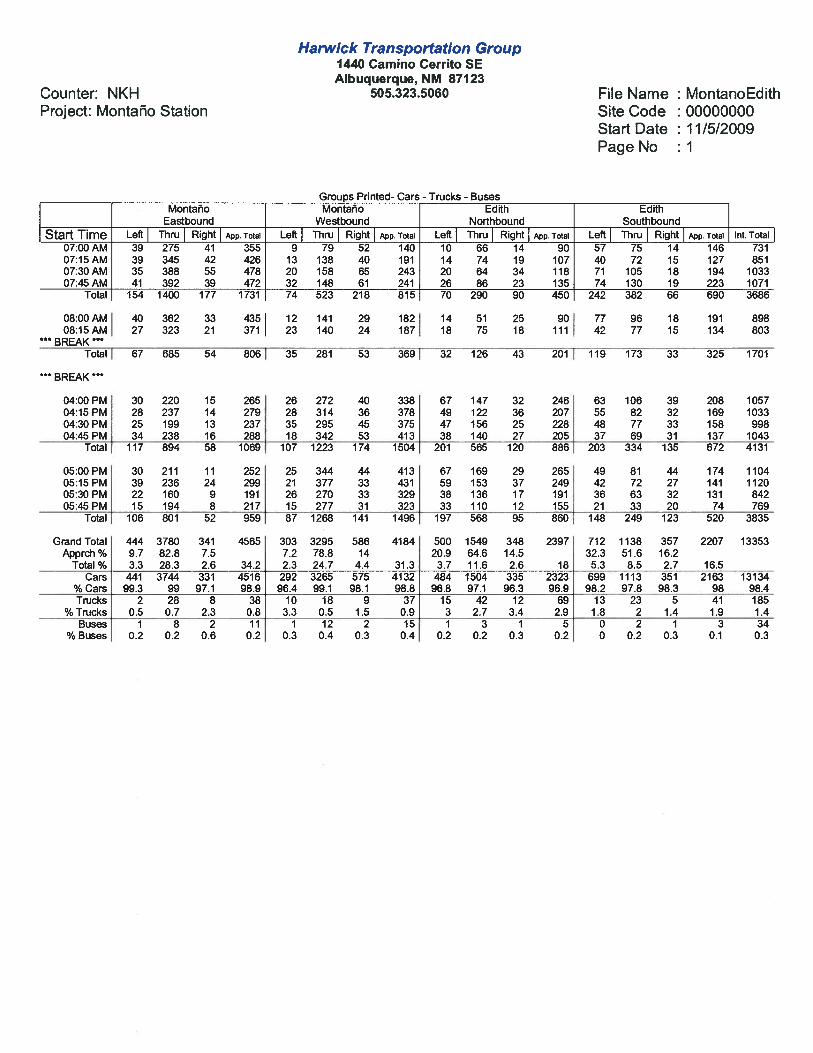
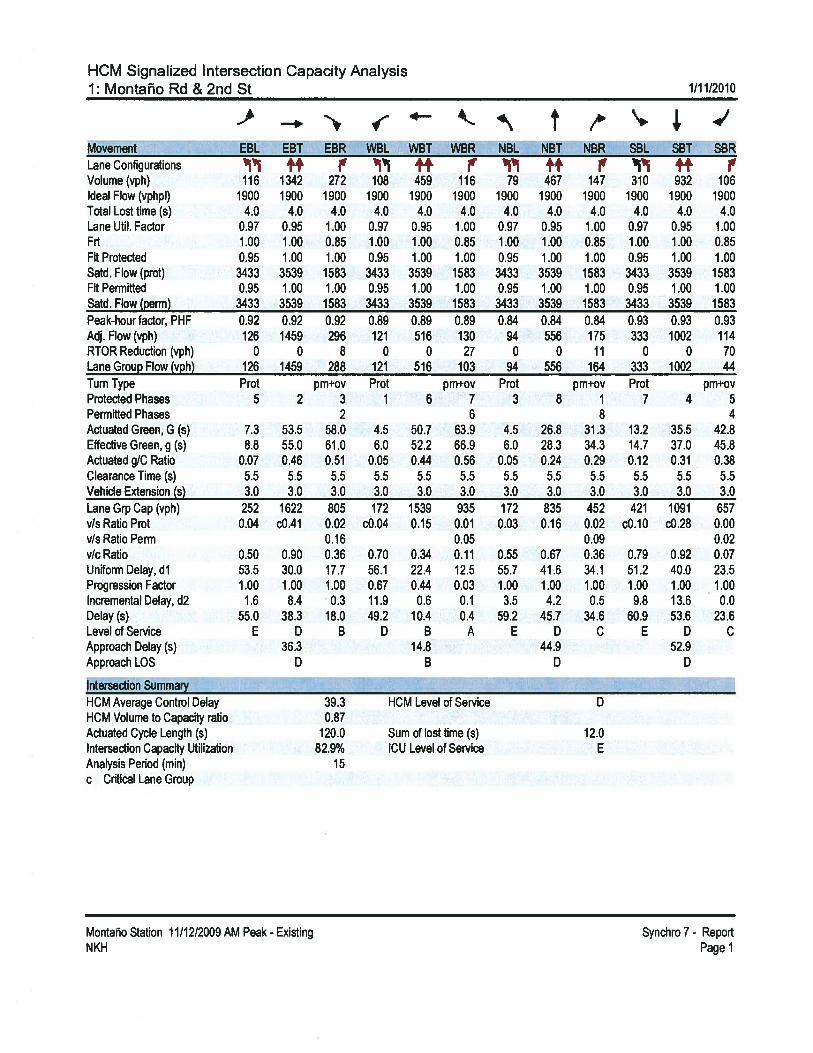
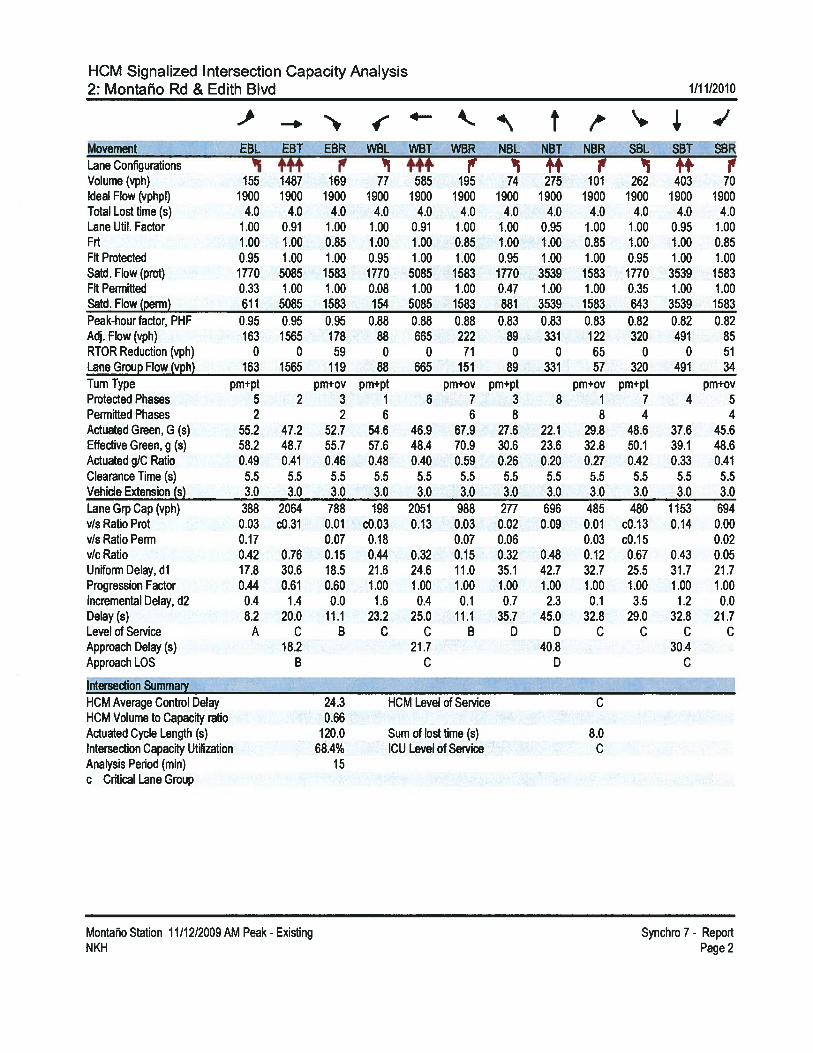
Turning movement counts were collected by HTG for the intersections of Montafio Rd at 21 Stand Edith Blvd during the AM and PM peak hours. The data was collected on November 4 and5, 2009. The turning movement volumes are contained in Table 3. Daily traffic volumes wereobtained from the MRCOG 2008 Traffic Flow Map for Montaño Rd, and the average dailytraffic in 2008 for the roadway segment at the site access was 28,700 vehicles per day (vpd).
Table 3Existing AM and PM Peak Hour Baseline Turning Movement Volumes
Eastbound Westbound Northbound SouthboundIntersection — — — — —
LT Th RT LT Th RT LT Th RT LT Th RT
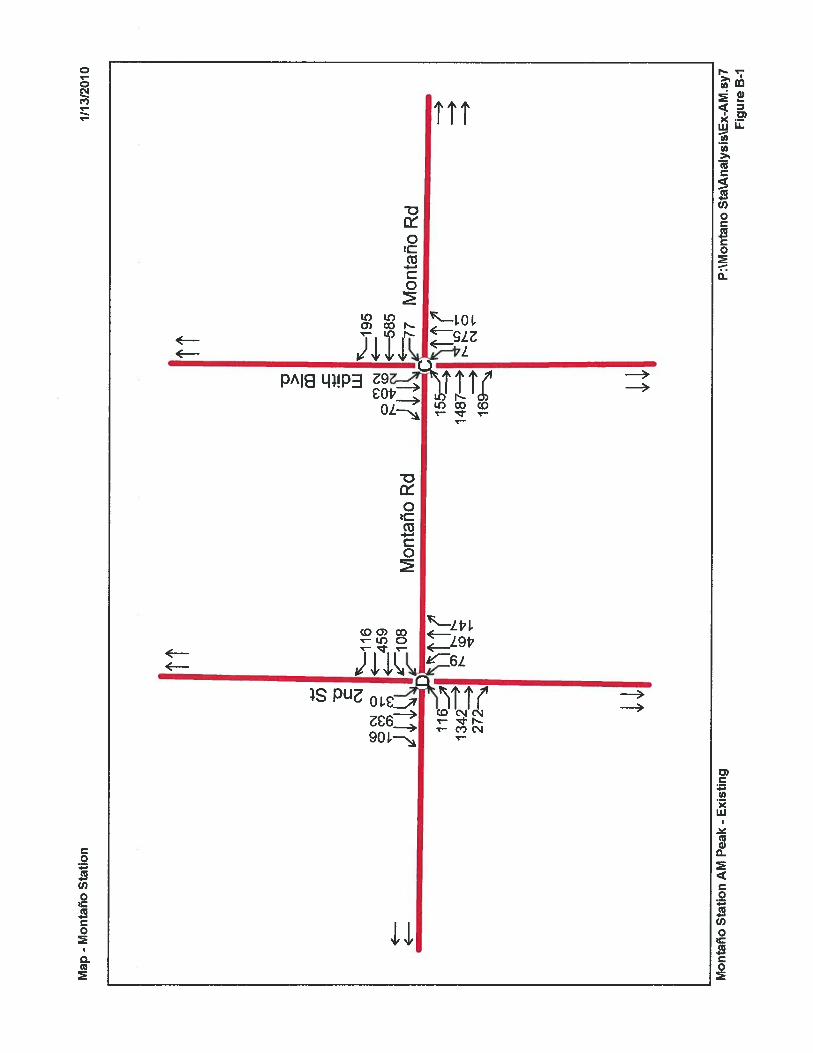
AM Peak HourMontafio Rd d s 116 1342 272 108 459 116 79 467 147 310 932 106Montaño Rd @ Site Access 1799 729MontañoRd@EdithBlvd 155 1487 169 77 585 195 74 275 101 262 403 70
PM Peak HourMontañoRd@2St 100 643 142 159 1212 325 298 987 167 108 574 173Montaño Rd @ Site Access 918 1704Montaño Rd@Edith Blvd 128 884 64 99 1358 175 211 618 118 176 299 135
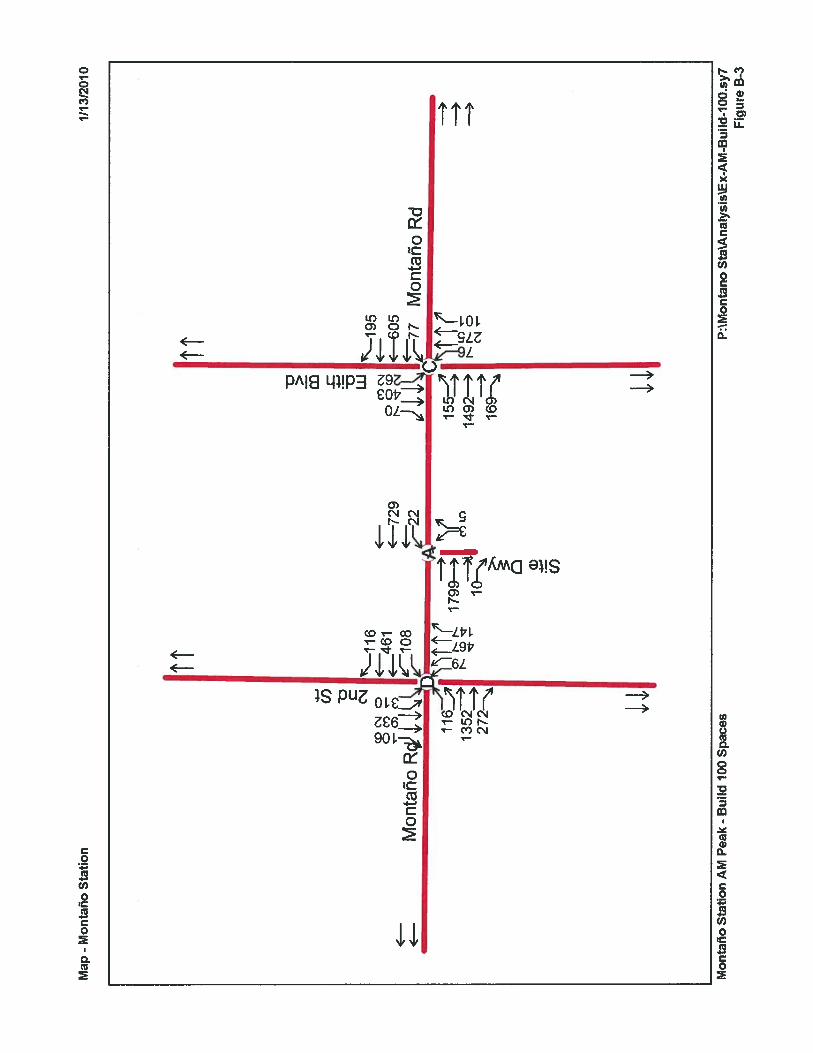
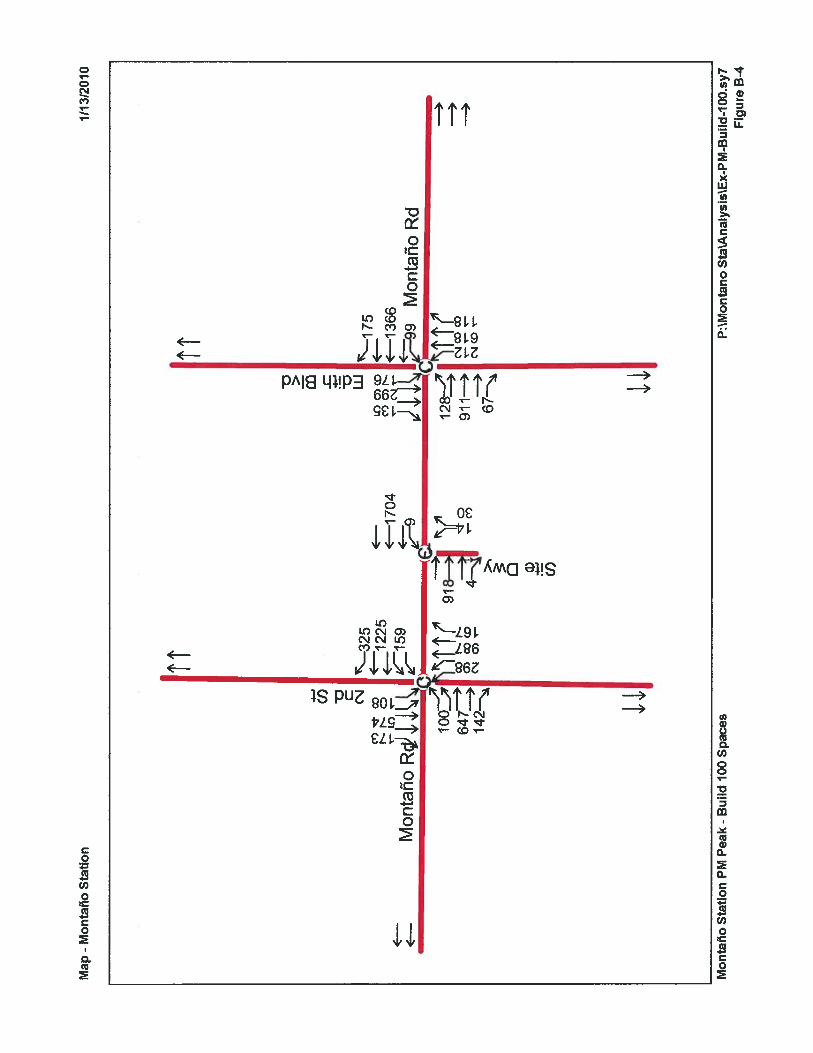
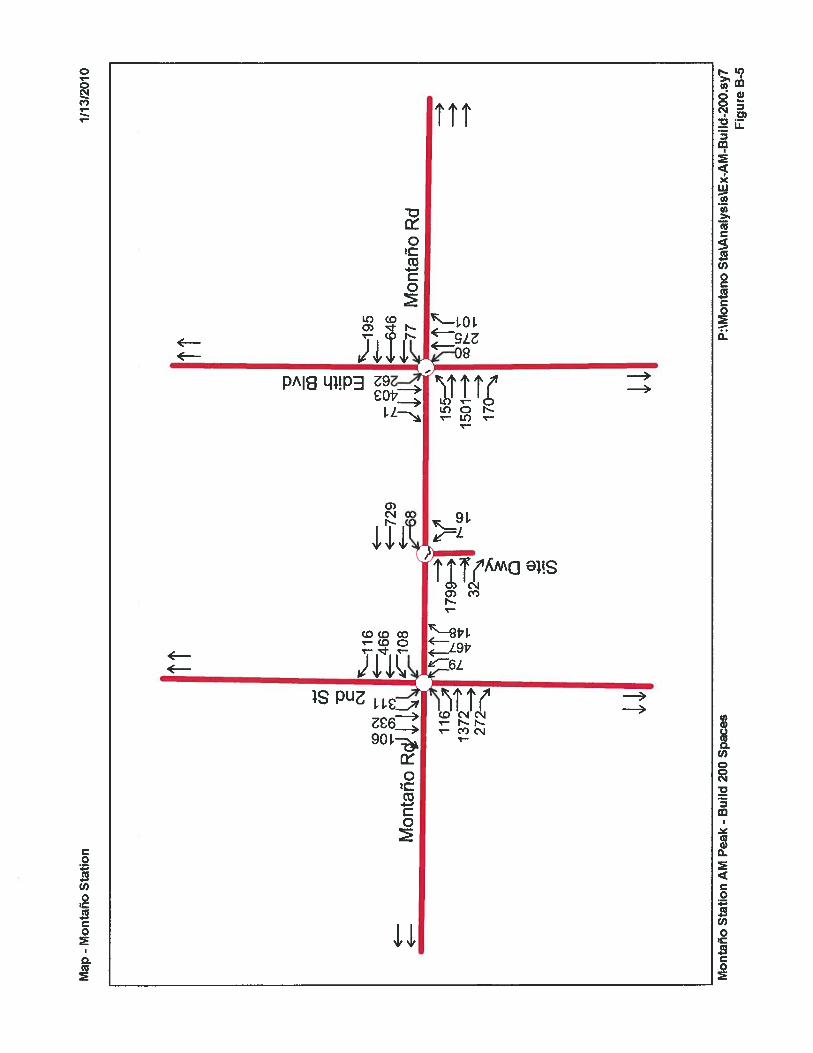
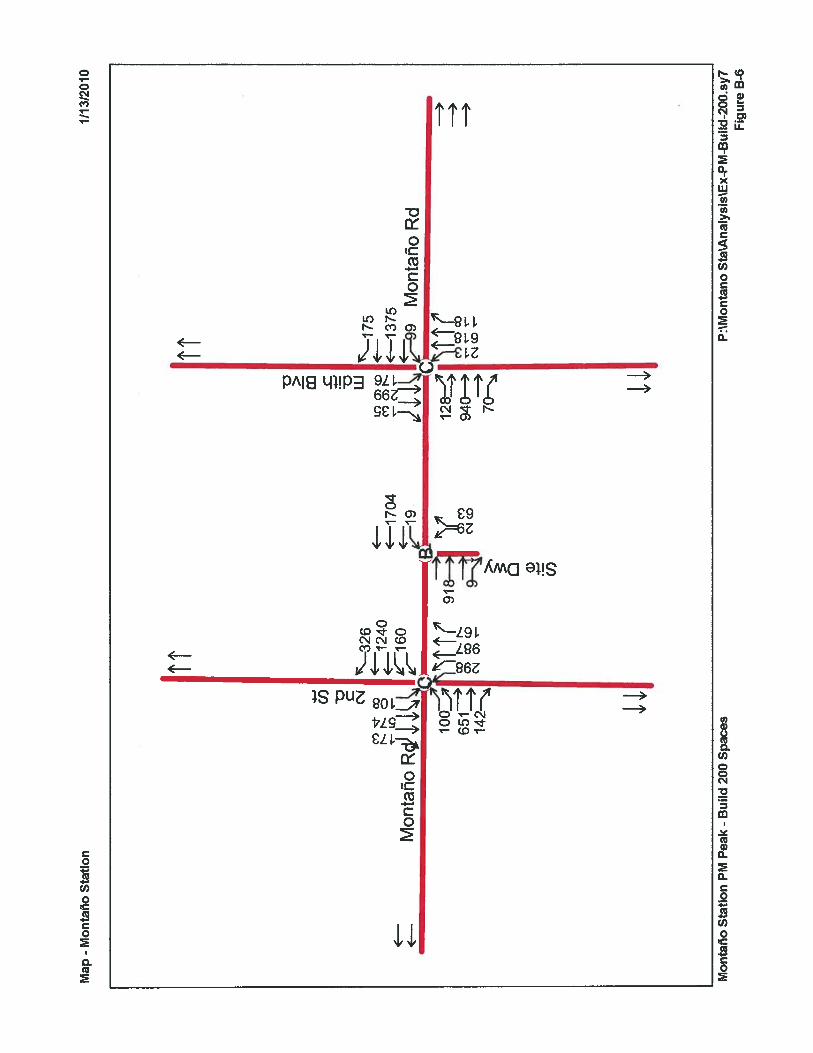
The summary traffic volumes and turning movement count sheets are contained in Appendix Band the Baseline and Build volumes are shown graphically on Figures B-i through B-8.
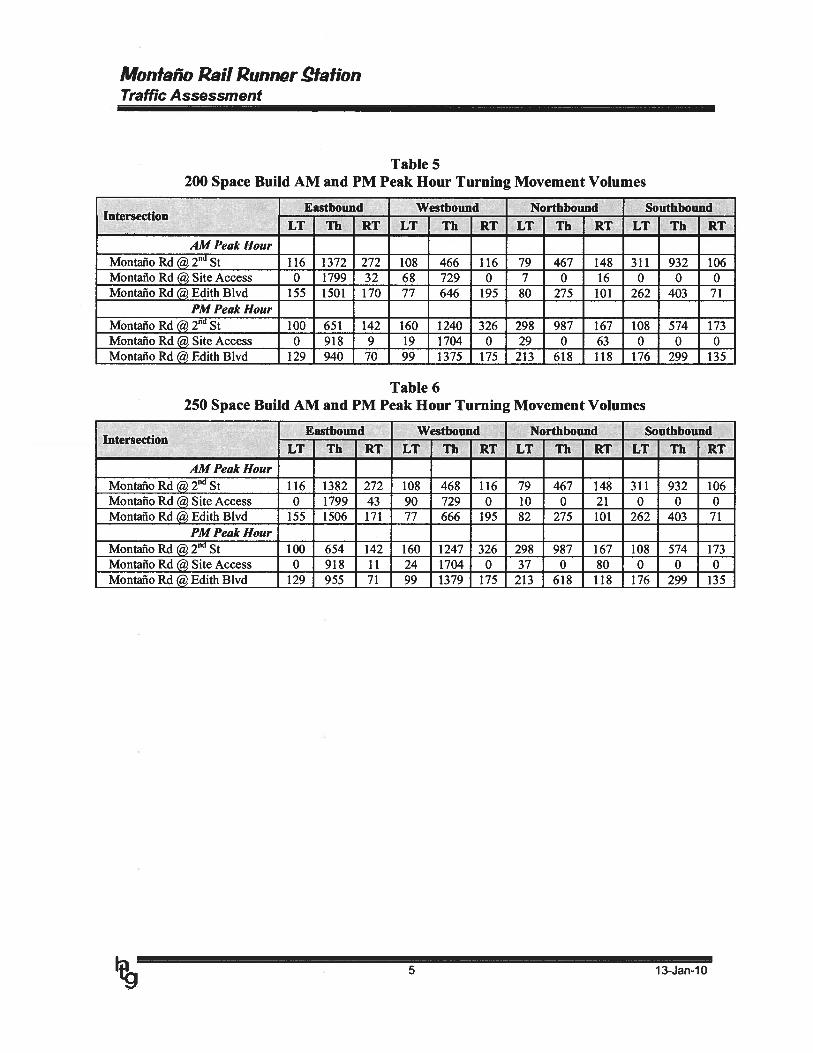
A series of three Build alternatives were developed for the site. The site traffic volumes arebased upon the development of 100, 200, and 250 parking spaces at the park and ride lot. TheBuild volumes for each alternative are contained in Tables 4 through 6. The site trip generationinformation is described in Section 4.
Table 4100 Space Build AM and PM Peak Hour Turning Movement Volumes
.Eastbound Westbound Northbound Southbound
Intersection —
LT Th RT LT Th RT LT Th RT LT Th RT
AM Peak Hour
MontafloRd@2St 116 1352 272 108 461 116 79 467 147 310 932 106Montafio Rd @ Site Access 0 1799 10 22 729 0 3 0 5 0 0 0Montailo Rd @ Edith Blvd 155 1492 169 77 605 195 76 275 101 262 403 70
PM Peak HourMontaflo Rd 2nd St 100 647 142 159 1225 325 298 987 167 108 574 173Montaflo Rd @ Site Access 0 918 4 9 1704 0 14 0 30 0 0 0Montaño Rd @ Edith Blvd 128 911 67 99 1366 175 212 618 118 176 299 135
4 13-Jan-10
Monfaflo Rail Runnor .QfationTraffic Assessment
Table 5200 Space Build AM and PM Peak Hour Turning Movement Volumes
Eastbound Westbound Northbound SouthboundIntersection — — — —
LT Th RT LT Th RT LT Th RT LT Th RT
AM Peak Hour
Montaflo Rd @ 2nd St 116 1372 272 108 466 116 79 467 148 311 932Montaflo Rd @ Site Access 0 1799 32 68 729 0 7 0 16 0 0 0Montaflo Rd@Edith Blvd 155 1501 170 77 646 195 80 275 101 262 403 71
PM Peak HourMontaio Rd @ 2nd St 100 651 142 160 1240 326 298 987 167 108 574 173Montafio Rd @ Site Access 0 918 9 19 1704 0 29 0 63 0 0 0MontafioRd@EdithBlvd 129 940 70 99 1375 175 213 618 118 176 299 135
Table 6250 Space Build AM and PM Peak Hour Turning Movement Volumes
Eastbound Westbound Northbound SouthboundIntersection — — — — —
LT Th RT LT Th RT LT Th RT LT Th RT
AM Peak Hour
MontafloRd@2’St 116 1382 272 108 468 116 79 467 148 311 932 106Montaño Rd @ Site Access 0 1799 43 90 729 0 10 0 21 0 0 0Montaflo Rd @ Edith Blvd 155 1506 171 77 666 195 82 275 101 262 403 71
PM Peak Hour
MontanoRd@2St 100 654 142 160 1247 326 298 987 167 108 574 173Montaflo Rd @ Site Access 0 918 11 24 1704 0 37 0 80 0 0 0Montaño Rd@Edith Blvd 129 955 71 99 1379 175 213 618 118 176 299 135
5 13-Jan-10

Monfaño Rail RunnQr .QIalionTraffic Assessment
4.0 Tiu GENERATION, DISTRIBUTION AND ASSIGNMENT
4.1 TRIP GENERATION
Project trips were generated using the Institute of Transportation Engineers (ITE) TripGeneration, 8th Edition. The land use selected was #90, Park and Ride Lot with Bus Service.The ITE publication includes two park and ride facilities, for buses and for light rail. Neitherof these land uses exactly match the land use for this site because commuter rail service differsslightly; however, the bus service land use was selected because of a larger data sample sizeand because the peak period at the station will likely occur outside of the peak hour for theadjacent street traffic. The resultant values from the trip generation should be representative ofthe peak hour site trips. Table 7 contains a summary of the site trip generation for eachscenario. The trip generation data sheets are contained in Appendix C.
Table 7Trip Generation
Parking AM AM PM PMDailyAlternative Development
Spaces Enter Exit Enter Exit
1 Commuter Rail Station 100 521 32 8 13 44
2 Commuter Rail Station 200 925 100 23 28 92
3 Commuter Rail Station 250 1127 133 31 35 117
No pass-by trips are assumed for the analyses. There will likely be pass-by or diverted linktrips associated with “Kiss and Ride” trips to the station. The zero pass-by assumption wasused to keep the results conservative.
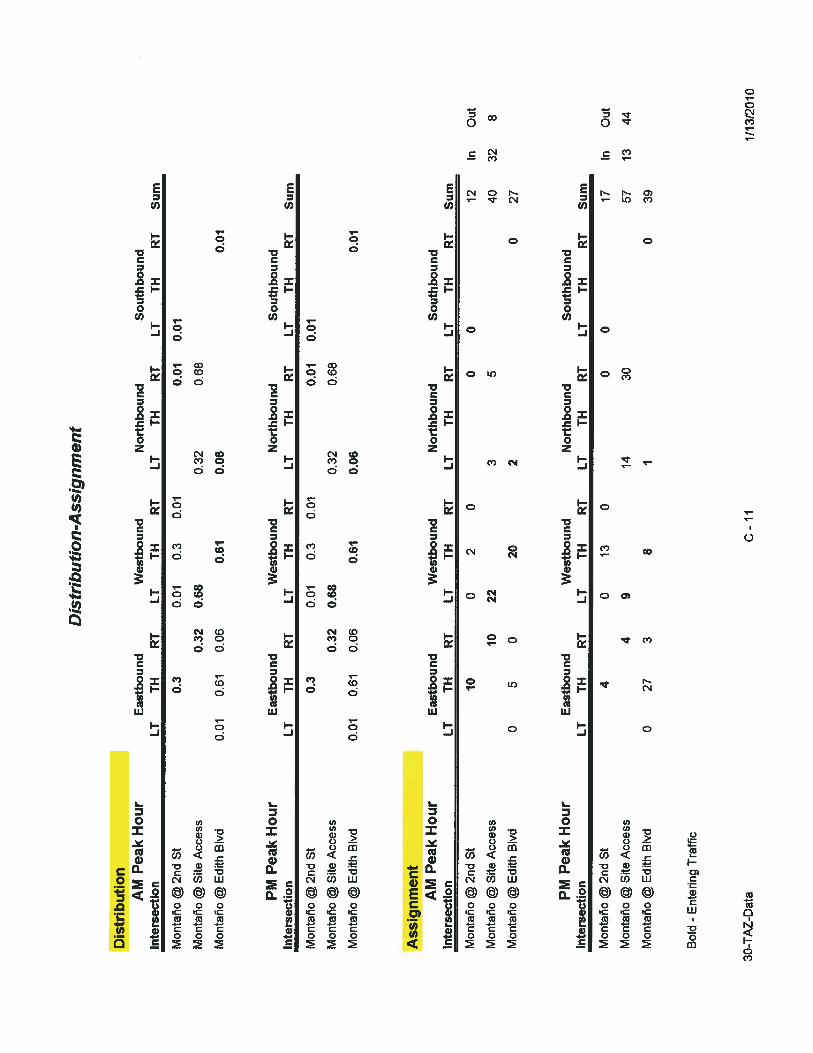
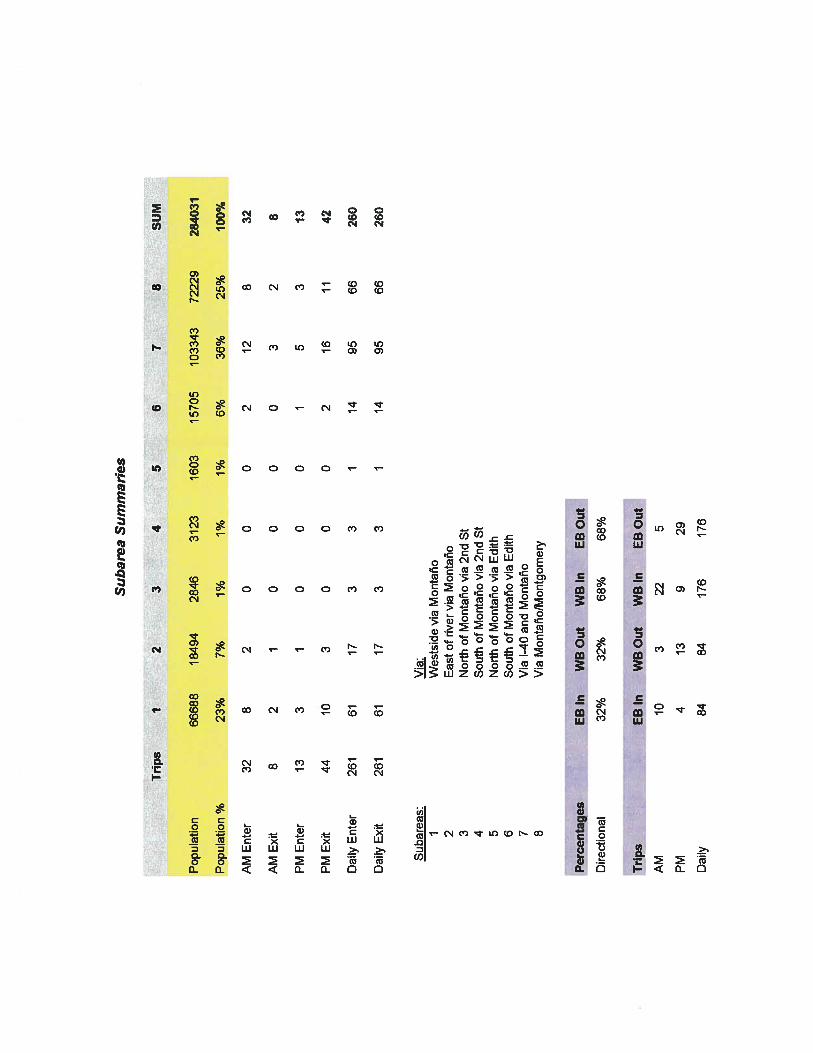
4.2 TRIP DISTRIBUTION
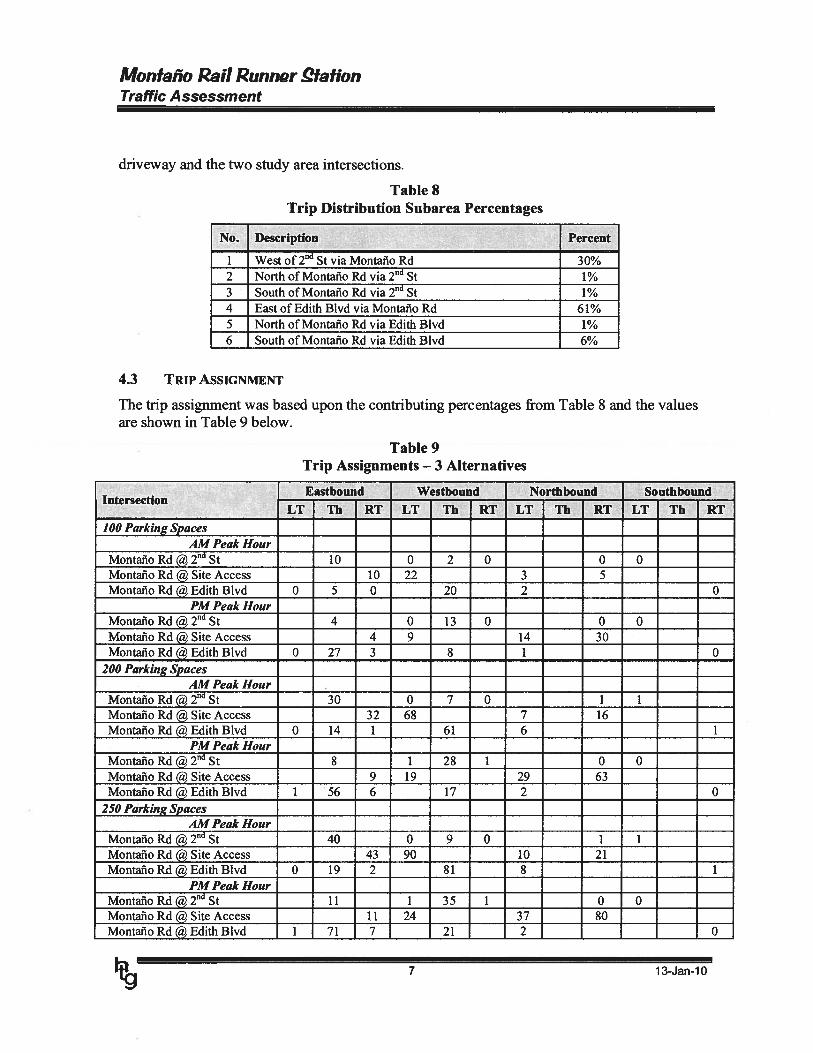
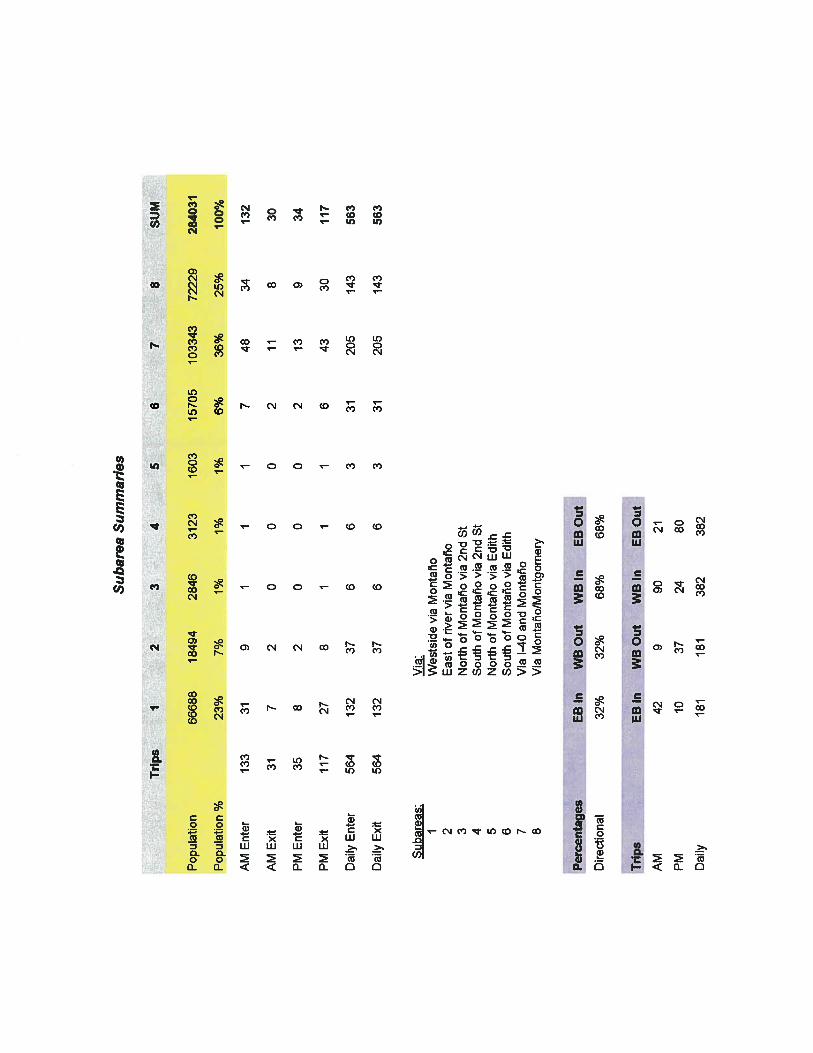
The trip distribution for the site was generated usingthe Mid-Region Council of Governments (MRCOG)approved 2030 model year databank and based uponmarket station areas identified by MRCOG. Themarket service area is between the Downtown andJournal Center station service areas, and is shown atthe right. An origin-destination trip assignment wasprepared between the site data analysis subzones(DASZ) and eight subareas evaluated within theMontaflo service area (see Appendix C). Thesesubarea percentages were aggregated to the logicalroutes serving the site, and based upon the roadwaynetwork, six (6) contributing subareas/routes weredeveloped. Table 8 contains the descriptions andcontributing percentages from these subareas foreach analysis year. These percentages were appliedto develop the turning movements for the site
6 13-Jan-i 0
Monlaño Rail Runnor .QfalionTraffic Assessment
driveway and the two study area intersections.
No.
Table 8Trip Distribution Subarea Percentages
Description
West of2 St via Montailo Rd2 North of Montaño Rd via 2 St 1%3 South of Montaño Rd via 2nd St 1%4 East of Edith Blvd via Montaño Rd 61%5 North of Montaflo Rd via Edith Blvd 1%6 South of Montaño Rd via Edith Blvd 6%
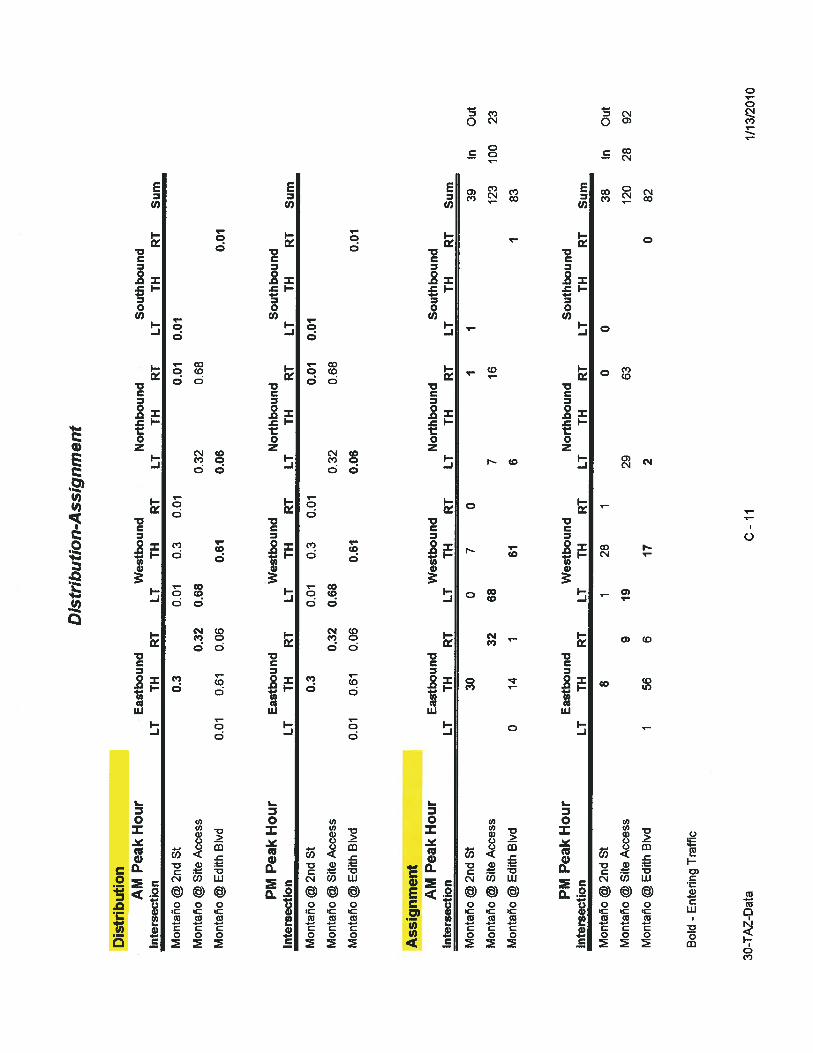
4.3 TRIP ASSIGNMENT
The trip assignment was based upon the contributing percentages from Table 8 and the valuesare shown in Table 9 below.
Table 9Trip Assignments — 3 Alternatives
Eastbound WestboundIntersection — —
Th RT LT Th
100 Parking SpacesAM Peak Hour
Montaño Rd @ 2 St 10 0 2 0 0 0Montafio Rd @ Site Access 10 22 3 5Montaño Rd @ Edith Blvd 0 5 0 20 2 0
PM Peak HourMontaflo Rd fld s 4 0 13 0 0 0Montaño Rd @ Site Access 4 9 14 30Montailo Rd @ Edith Blvd 0 27 3 8 — 0
200 Parking Spaces —
AM Peak HourMontaño Rd d St 30 0 7 0 1 1Montaflo Rd @ Site Access 32 68 7 16Montaño Rd @ Edith Blvd 0 14 1 61 6
PM Peak HourMontaño Rd @ 2 St 8 1 28 1 0 0Montaflo Rd @ Site Access 9 19 29 63Montaflo Rd @ Edith Blvd 1 56 6 17 2 0
250 Parking Spaces — —
AM Peak HourMontaflo Rd @ 2nd St 40 0 9 0 1 1Montaño Rd @ Site Access 43 90 10 21Montafio Rd ( Edith Blvd 0 19 2 81 8
PM Peak HourMontaño Rd @ 2nd St 11 1 35 1 0 0Montaño Rd @ Site Access 11 24 37 80Montaflo Rd @ Edith Blvd 1 71 7 — 21 — 2 — — — 0
30%
‘pg 7 13-Jan-10

Monfaño Rail Runnor fationTraffic Assessment
5.0 TRAFFIC ANALYSES
Traffic analyses were performed for the existing Baseline and each of the three Build scenarios.The analyses for the site intersection were initially conducted assuming that a traffic signalwould be installed. Because traffic signal warrants will not be satisfied based upon theMUTCD warrants, a series of analyses were also conducted for an unsignalized site access.The Baseline traffic analysis worksheets may be found in Appendix D, Alternative 1 inAppendix E, Alternative 2 in Appendix F, and the Alternative 3 worksheets in Appendix G.The unsignalized analysis worksheets follow the signalized analysis worksheets for eachalternative.
5.1 SIGNALIZED INTERSECTION ANALYSIS
The signalized intersection traffic operations analysis results were summarized and combinedto show the results comparatively. Each signalized intersection was evaluated using a 120second cycle, representative of the existing conditions. Each intersection had the splitsoptimized, and that optimization included east-west coordination along Montano Rd. As statedin Section 2, all analyses were conducted using Synchro 7.0 and the results produced using theHighway capacity Manual methodology. Table 10 contains the signalized intersectionmeasures of effectiveness (MOEs) including the intersection level of service [LOS], averagecontrol delay [Delay], and the average intersection volume to capacity (v/c) ratio [Ave v/c].Note that all site turning movements were assigned a peak hour factor of 0.25, the lowest valueallowable by Synchro, because only one northbound and one southbound train arrives duringeach peak hour, limiting the time period that vehicles should enter and exit the site.
Table 10Montaño Rd Signalized Intersection Measures of Effectiveness
. AM Peak Hour PM Peak HourIntersection/Approach
LOS Delay Ave v/c LOS Delay Ave v/c
2m1 StExisting Condition D 39 S 0.87 C 34 s 0.84
Alternative 1 D 39 S 0.89 C 34 s 0.82Alternative 2 D 40 s 0.89 C 33 s 0.82Alternative 3 D 40 s 0.90 C 35 s 0.82
Site AccessExisting Condition - - - - - -
Alternative 1 A 8 s 0.47 A 9 s 0.41Alternative 2 A lOs 0.62 B 11 s 0.45Alternative 3 B 12s 0.71 B us 0.50
Edith BlvdExisting Condition C 24 s 0.66 C 31 s 0.71
Alternative 1 C 26 s 0.66 C 33 s 0.71Alternative 2 C 24 s 0.67 C 32 s 0.69Alternative 3 C 23 s 0.67 C 33 s 0.69
8 13-Jan-10

Monfaño Rail RunnQr falionTraffic Assessment
Table 10 indicates that acceptable operations should occur for each study area intersection, withor without the Rail Runner station. The presence of the station should not significantly impactoperations within the Montaño Rd corridor, though it must be noted that intersection offsetsmust be established that provide optimal progression between St and Edith Blvd. Thestation driveway will have green time on the Montaño Rd approaches of up to 58% during theAM peak hour and 71% during the PM peak hour. A signalized Rail Runner station accessshould not impede traffic flow along Montafio Rd
The signal progression band widths were examined in Synchro to determine the optimal twoway progression that may be achieved between 2’’ St and Edith Blvd, including the RailRunner station access. The results were manually adjusted to provide a greater peak hourdirectional progression because the Montai3o Rd traffic volumes at 2nd St are approximately 2:1higher in the peak direction. It would be possible to develop intersection offsets (or yieldpoints) that would provide equal progression in each travel direction. The results of theprogression analysis including a signalized site access are in Table 11.
Table 11Progression Analyses Results
Eastbound:.:J WestbounAlternative Cycle 2nd St Edith
Length Green% Green% Green Gre Green GreenBand Band band Band %
AM Peak HourExisting 120 S 46% 41% 50 S 42% 37 s 31%Alternative 1 120 s 46% 40% 52 s 43% 39 s 33%Alternative 2 120 s 46% 40% 52 s 43% 39 s 33%Alternative 3 120 S 46% 40% 52 s 43% 39s 33%
PM Peak HourExisting 120 S 41% 39% 34 S 28% 44 S 37%Alternative 1 120 s 41% 39% 34 s 28% 44 s 37%Alternative 2 120 S 42% 39% 35 s 29% 44 s 37%Alternative 3 120 s 42% 39% 35 s 29% 44 s 37%
I
The progression analysis yields very good results for this limited corridor. Traffic should becoordinated through the adjoining signals in the peak direction near the maximum effectivegreen times for those signals. The table also indicates that when comparing the existingprogression with each of the alternatives, no degradation is anticipated by adding the RailRunner station signal. Signalization of the site access will not affect operations within theMontaflo Rd corridor so long as progression optimization is applied.
5.2 UNSIGNALIZED INTERSECTION ANALYSIS
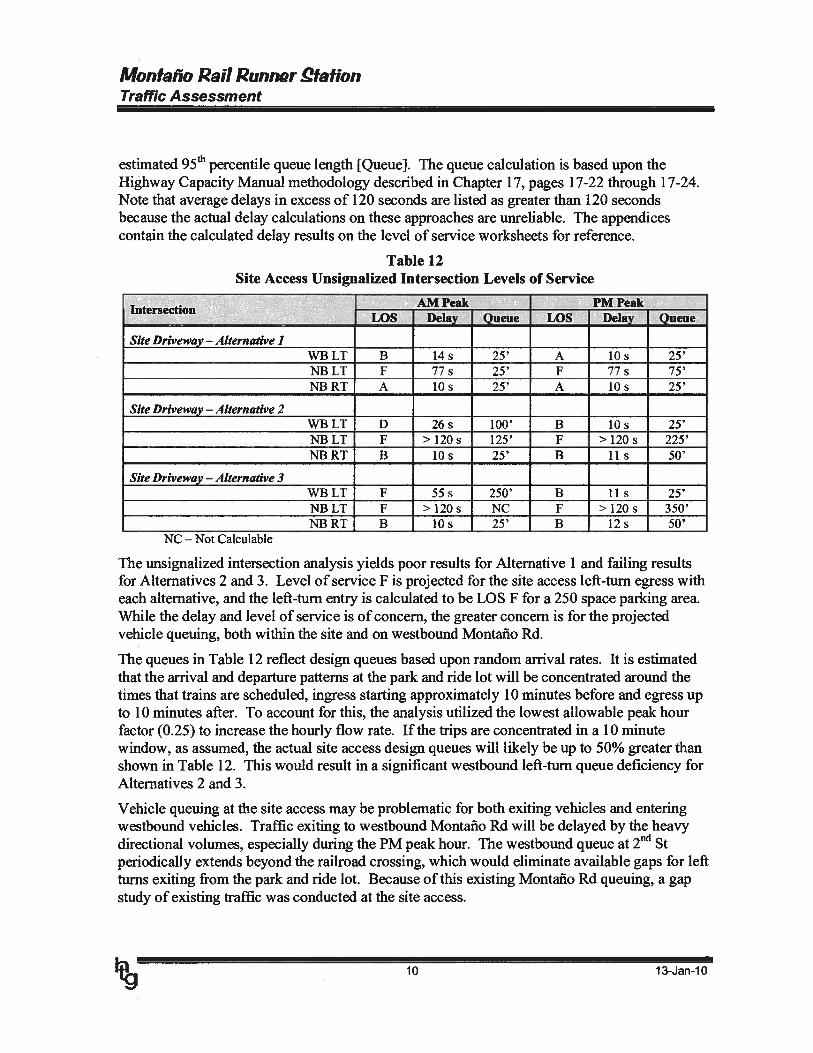
Signalization of the site access is not guaranteed because, based upon the site access volumes,no Manual on Uniform Traffic Control Devices (MUTCD) traffic signal volume warrants willbe satisfied. For this reason, unsignalized intersection analyses were performed, and a gapstudy was conducted at the site access during the AM and PM peak hours. Table 12 containsthe unsignalized intersection analyses for each alternative. The unsignalized site access had thecritical approaches assessed for level of service [LOS], average control delay [Delay], and the
9 13-Jan-i 0
Monfaflo Rail Runnor QiafionTraffic Assessment
estimated 95th percentile queue length [Queue]. The queue calculation is based upon theHighway Capacity Manual methodology described in Chapter 17, pages 17-22 through 17-24.Note that average delays in excess of 120 seconds are listed as greater than 120 secondsbecause the actual delay calculations on these approaches are unreliable. The appendicescontain the calculated delay results on the level of service worksheets for reference.
Table 12Site Access Unsignalized Intersection Levels of Service
. AM Peak PM PeakIntersectionLOS Delay Qucd Delay 0
Site Driveway — Alternative IWBLT B 14s 25’ A lOs 25’NBLT F 77s 25’ F 77s 75’NBRT A lOs 25’ A lOs 25’
Site Driveway Alternative 2WBLT D 26s 100’ B lOs 25’NBLT F >120s 125’ F >120s 225’NBRT B lOs 25’ B 11 S 50’
Site Driveway — Alternative 3WBLT F 55s 250’ B us 25’NBLT F >120s NC F >120s 350’NBRT B lOs 25’ B 12s 50’
NC — Not Calculable
The unsignalized intersection analysis yields poor results for Alternative 1 and failing resultsfor Alternatives 2 and 3. Level of service F is projected for the site access left-turn egress witheach alternative, and the left-turn entry is calculated to be LOS F for a 250 space parking area.While the delay and level of service is of concern, the greater concern is for the projectedvehicle queuing, both within the site and on westbound Montafio Rd.
The queues in Table 12 reflect design queues based upon random arrival rates. It is estimatedthat the arrival and departure patterns at the park and ride lot will be concentrated around thetimes that trains are scheduled, ingress starting approximately 10 minutes before and egress upto 10 minutes after. To account for this, the analysis utilized the lowest allowable peak hourfactor (0.25) to increase the hourly flow rate. If the trips are concentrated in a 10 minutewindow, as assumed, the actual site access design queues will likely be up to 50% greater thanshown in Table 12. This would result in a significant westbound left-turn queue deficiency forAlternatives 2 and 3.
Vehicle queuing at the site access may be problematic for both exiting vehicles and enteringwestbound vehicles. Traffic exiting to westbound Montaño Rd will be delayed by the heavydirectional volumes, especially during the PM peak hour. The westbound queue at 2nd Stperiodically extends beyond the railroad crossing, which would eliminate available gaps for leftturns exiting from the park and ride lot. Because of this existing Montaflo Rd queuing, a gapstudy of existing traffic was conducted at the site access.
10 13-Jan-10
Montaño Rail Runnor QialionTraffic Assessment
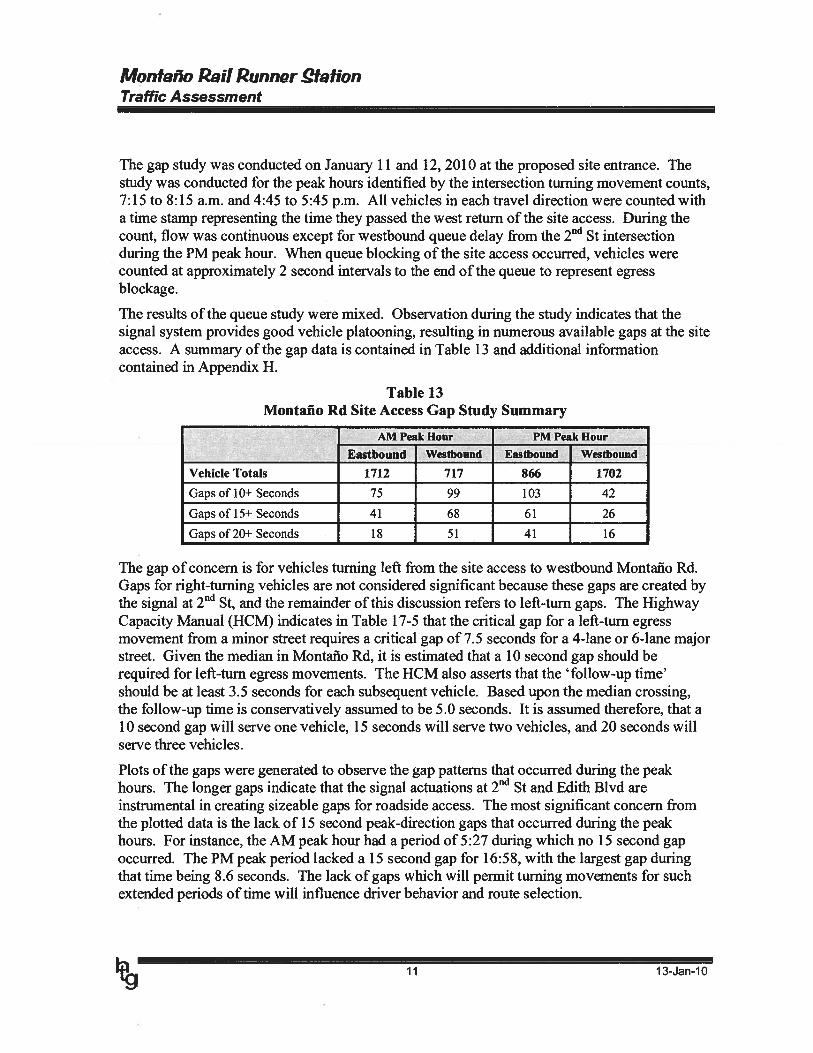
The gap study was conducted on January 11 and 12, 2010 at the proposed site entrance. Thestudy was conducted for the peak hours identified by the intersection turning movement counts,7:15 to 8:15 a.m. and 4:45 to 5:45 p.m. All vehicles in each travel direction were counted witha time stamp representing the time they passed the west return of the site access. During thecount, flow was continuous except for westbound queue delay from the 2’ St intersectionduring the PM peak hour. When queue blocking of the site access occurred, vehicles werecounted at approximately 2 second intervals to the end of the queue to represent egressblockage.
The results of the queue study were mixed. Observation during the study indicates that thesignal system provides good vehicle platooning, resulting in numerous available gaps at the siteaccess. A summary of the gap data is contained in Table 13 and additional informationcontained in Appendix H.
Table 13Montaulo Rd Site Access Gap Study Summary
AM Peak Hour PM Peak Hour
Eastbound Westbound Eastbound Westbound
Vehicle Totals 1712 717 866 1702
Gaps of 10+ Seconds 75 99 103 42
Gapsof 15+ Seconds 41 68 61 26
Gaps of 20+ Seconds 18 51 41 16
The gap of concern is for vehicles turning left from the site access to westbound Montafio Rd.Gaps for right-turning vehicles are not considered significant because these gaps are created bythe signal at 2’ St. and the remainder of this discussion refers to left-turn gaps. The HighwayCapacity Manual (HCM) indicates in Table 17-5 that the critical gap for a left-turn egressmovement from a minor street requires a critical gap of 7.5 seconds for a 4-lane or 6-lane majorstreet. Given the median in Montafio Rd, it is estimated that a 10 second gap should berequired for left-turn egress movements. The HCM also asserts that the ‘follow-up time’should be at least 3.5 seconds for each subsequent vehicle. Based upon the median crossing,the follow-up time is conservatively assumed to be 5.0 seconds. It is assumed therefore, that a10 second gap will serve one vehicle, 15 seconds will serve two vehicles, and 20 seconds willserve three vehicles.
Plots of the gaps were generated to observe the gap patterns that occurred during the peakhours. The longer gaps indicate that the signal actuations at 2’’ St and Edith Blvd areinstrumental in creating sizeable gaps for roadside access. The most significant concern fromthe plotted data is the lack of 15 second peak-direction gaps that occurred during the peakhours. For instance, the AM peak hour had a period of 5:27 during which no 15 second gapoccurred. The PM peak period lacked a 15 second gap for 16:58, with the largest gap duringthat time being 8.6 seconds. The lack of gaps which will permit turning movements for suchextended periods of time will influence driver behavior and route selection.
11 13-Jan-10

Moniaño Rail Runnor QfalionTraffic Assessment
Long periods of gap restriction will lead to erratic behavior at an unsignalized site access.Lower gap acceptance would be anticipated during the AM peak hour when the eastboundtraffic is heavy. This could lead to an increase in right-angle crashes at the site driveway.During the PM peak hour, the concern is for multiple left-turns queuing within the median tomake two-stage left turns. One vehicle at a time making this movement would not be aconcern, except that gaps to enter the westbound travel stream may not be available for minutesat a time. Should multiple vehicles try to queue within the opening, and this has been observedelsewhere in the corridor, a more unsafe condition will be created depending upon driveraggressiveness. Given that the left-turn egress demand will be concentrated based around thetrain schedule, the PM peak period gaps are considered inadequate to serve an unsignalizedintersection.
In conjunction with potential erratic movements at the site access, the lack of available gapswill likely induce drivers to turn right and make a U-turn east of the site. There are two medianopenings between the site access and Edith Blvd, and it would be anticipated that the first ofthese openings would be utilized for site egress to westbound Montafio Rd. Montaño Rd hasthree travel lanes in each direction, and the 40’ of pavement width would accommodate mostpassenger vehicle U-turns. The concern occurs during the PM peak hour when the backupfrom 2nd St extends east of the railroad tracks. This could block the U-turn location as well,though likely not for an extended time. Another concern for U-turns is storage availability aftera train has arrived. If the 200 or 250 space lot is constructed, there could be demand for 29 to37 left-turns. If 80% decide to make U-turns, there may be storage demand for 6 to 8 vehicleswaiting for the U-turn. If the site access is to be unsignalized, a formal U-turn location shouldbe established along Montaño Rd to ensure that U-turn vehicles do not queue within the leftthrough lane.
12 13-Jan-i 0

Montaño Rail Runnor .QfafionTraffic Assessment
6.0 FINDINGS AND RECOMMENDATIONS
6.1 FINDINGS AND CONSIDERATIONS
The findings of the traffic assessment indicate that the proposed Rail Runner station will notimpact traffic operations within the Montaflo Rd corridor if the site access is signalized. Thesite intersection will operate poor to failing as an unsignalized intersection, depending upon thesize of park and ride lot developed. Montafio Rd has excellent progression with good vehicleplatooning, and a moderate number of gaps are provided to serve left-turn egress movements,however, the gaps would be insufficient to serve the site traffic with unsignalized trafficcontrol.
The projected traffic volumes were checked against the MUTCD signalization volumewarrants, and under each of the three scenarios, the volumes will be significantly below therequired threshold. Non-volume MIJTCD warrants are not applicable at this intersection. Theprojected operations required that additional investigations be performed to ensure acceptableoperations, and a gap study was performed to determine if the access would have adequatevehicle gaps to serve the site traffic. The study revealed that inadequate gaps occurredcontinuously for approximately 5 Y2 minutes during the AM peak hour and 17 minutes duringthe PM peak. Should these durations occur once the station is constructed, an unsignalizedintersection will fail.
If an unsignalized intersection is constructed, it is likely that drivers will occasionally exhibiterratic behavior when attempting to make a left-turn egress movement. These erraticmovements may result in right-angle collisions or multiple vehicles queued in the median tomake two-stage left turns. It is also anticipated that many drivers will abandon the site accessleft-turn movement and proceed east of the railroad tracks to make a U-turn from eastbound towestbound Montafio Rd. While there is adequate roadway width to negotiate the U-turnmovement, it is likely that a number of vehicles will either queue within the eastbound lanesawaiting an opportunity to make the U-turn, or stack within the existing continuous two-wayleft-turn lane, possibly making multiple U-turns simultaneously. If an unsignalized intersectionis provided at the site access, formal channelization for the storage of U-turning vehicles shouldbe required.
Another consideration for an unsignalized intersection is the accommodation of pedestrians.Currently, there is transit service eastbound and westbound on Montaño Rd, and it will servethe Rail Runner station. If the intersection is unsignalized, westbound bus transit serving thesite should be required to pull into the site for patrons to safely board or alight the buses. If thewestbound bus stops along Montaño Rd (the existing condition), a pedestrian would berequired to cross three travel lanes and a bicycle lane in each direction (40’), as well as traversethe 14’ median area. The eastbound direction will likely require a right-turn deceleration taper,adding at least 12’ of addition crossing width on the west side of the intersection. The resultantcrossing times for each half of the road are at least 11.4 seconds and 26.8 seconds for the entireroad (94’), resulting in extensive pedestrian exposure. Given that the gap study demonstratedthat no gap greater than 8.6 seconds occurred during a 17 minute period in the PM peak hour,an unsignalized crossing would not permit safe crossing of the westbound lanes. This could be
13 13-Jan-10
Monfaño Rail Runnor .QfationTraffic Assessment
mitigated by requiring westbound transit buses to enter the site for pickup and drop-off. Thedifficulty will then be for the buses to safely exit the site.
6.2 RECOMMENDATIONS
The recommendations for the site access are as follows:
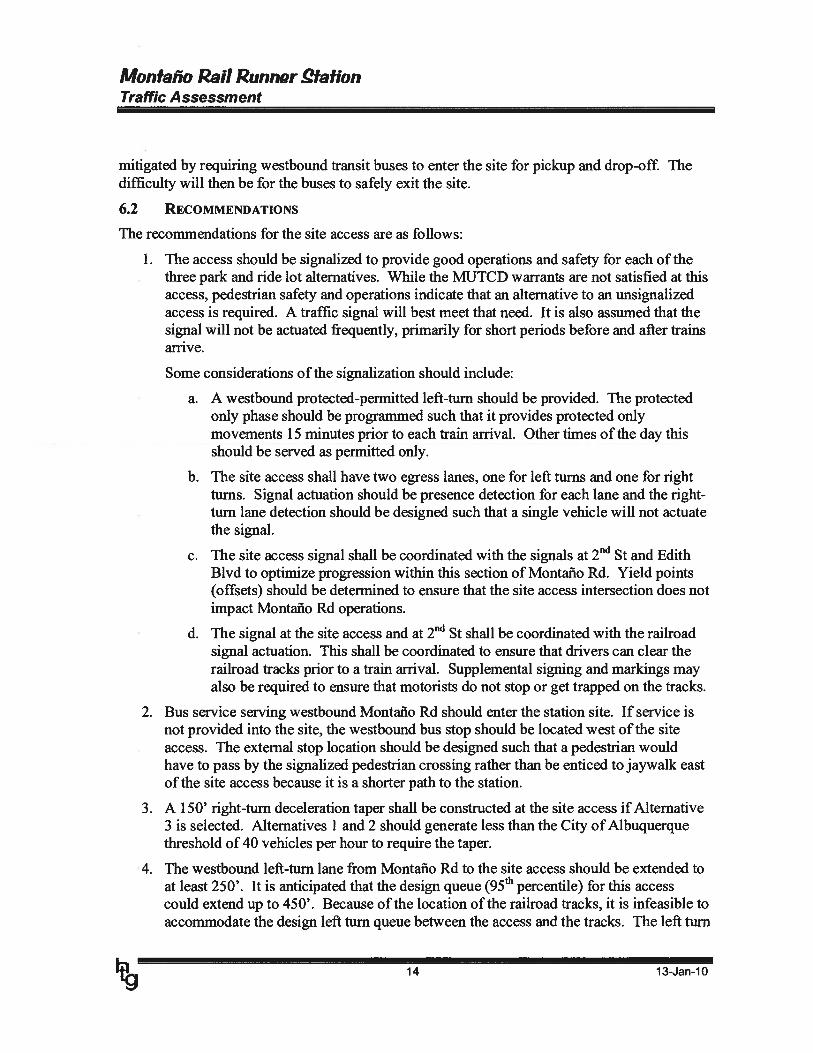
1. The access should be signalized to provide good operations and safety for each of thethree park and ride lot alternatives. While the MUTCD warrants are not satisfied at thisaccess, pedestrian safety and operations indicate that an alternative to an unsignalizedaccess is required. A traffic signal will best meet that need. It is also assumed that thesignal will not be actuated frequently, primarily for short periods before and after trainsarrive.
Some considerations of the signalization should include:
a. A westbound protected-permitted left-turn should be provided. The protectedonly phase should be programmed such that it provides protected onlymovements 15 minutes prior to each train arrival. Other times of the day thisshould be served as permitted only.
b. The site access shall have two egress lanes, one for left turns and one for rightturns. Signal actuation should be presence detection for each lane and the right-turn lane detection should be designed such that a single vehicle will not actuatethe signal.
c. The site access signal shall be coordinated with the signals at 2’ St and EdithBlvd to optimize progression within this section of Montaflo Rd. Yield points(offsets) should be determined to ensure that the site access intersection does notimpact Montaflo Rd operations.
d. The signal at the site access and at 2nd St shall be coordinated with the railroadsignal actuation. This shall be coordinated to ensure that drivers can clear therailroad tracks prior to a train arrival. Supplemental signing and markings mayalso be required to ensure that motorists do not stop or get trapped on the tracks.
2. Bus service serving westbound Montafio Rd should enter the station site. If service isnot provided into the site, the westbound bus stop should be located west of the siteaccess. The external stop location should be designed such that a pedestrian wouldhave to pass by the signalized pedestrian crossing rather than be enticed to jaywalk eastof the site access because it is a shorter path to the station.
3. A 150’ right-turn deceleration taper shall be constructed at the site access if Alternative3 is selected. Alternatives 1 and 2 should generate less than the City of Albuquerquethreshold of 40 vehicles per hour to require the taper.
4. The westbound left-turn lane from Montafio Rd to the site access should be extended toat least 250’. It is anticipated that the design queue(95t1 percentile) for this accesscould extend up to 450’. Because of the location of the railroad tracks, it is infeasible toaccommodate the design left turn queue between the access and the tracks. The left turn
14 13-Jan-10
Monfaflo Rail Runnor falionTraffic Assessment
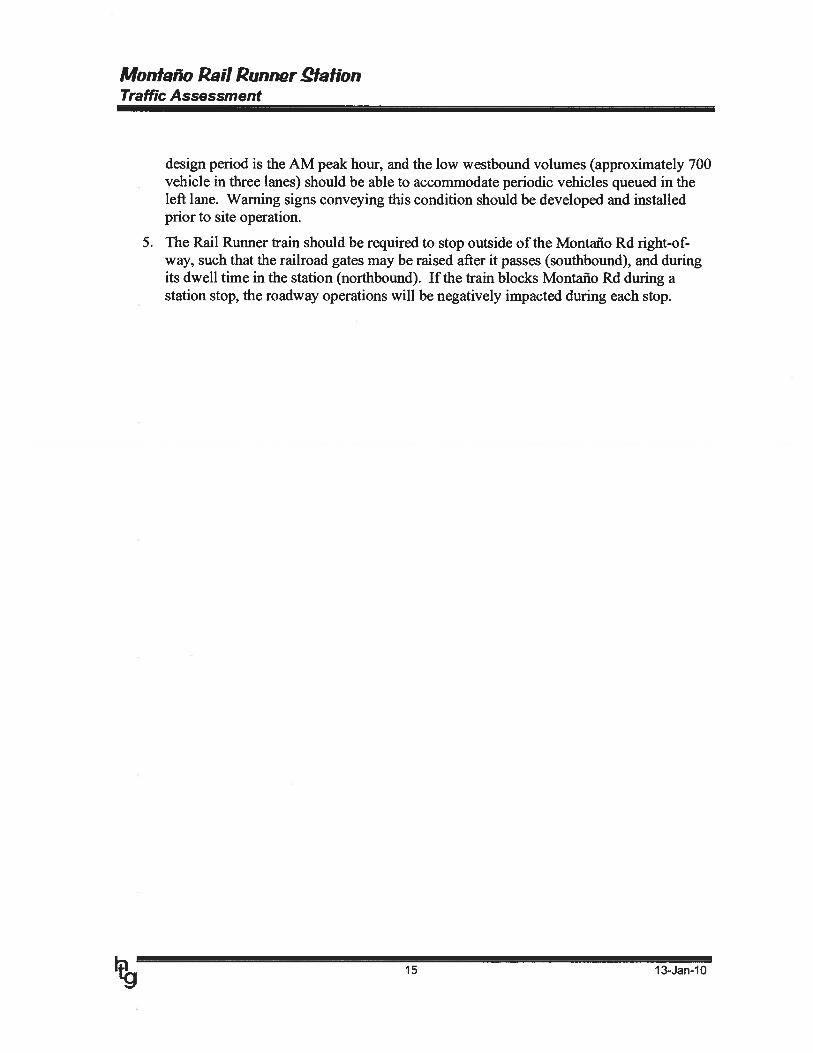
design period is the AM peak hour, and the low westbound volumes (approximately 700vehicle in three lanes) should be able to accommodate periodic vehicles queued in theleft lane. Warning signs conveying this condition should be developed and installedprior to site operation.
5. The Rail Runner train should be required to stop outside of the Montaio Rd right-of-way, such that the railroad gates may be raised after it passes (southbound), and duringits dwell time in the station (northbound). If the train blocks Montaflo Rd during astation stop, the roadway operations will be negatively impacted during each stop.
15 13-Jan-10

Appendices
Appendix A Vicinity and Site MapsAppendix B Traffic Volume SummaryAppendix C Trip Generation, Distribution and AssignmentAppendix D Existing Level of Service AnalysesAppendix E Alternative 1 Level of Service AnalysesAppendix F Alternative 2 Level of Service AnalysesAppendix G Alternative 3 Level of Service AnalysesAppendix H Gap Study Summary

Appendix A
Vicinity and Site Maps
0)
D.
IL
Oj
4F. I
!
jJ:
-
/ 4
4 jI, ‘1

LI 1.
I’
4 4——
/ - -
l-c
/ I / ‘ a
L “ILI
P
4
&4I
/1
c-i
—,“. IL
Appendix B
Traffic Volume Summary
Counter: NKH
Harwick Transportation Group1440 Camino Cerrito SEAlbuquerque, NM 87123
505.323.5060 File Name : Mont2ndStSite Code : 00000000Start Date :11/4/2009
Groups Printed- Cars - Trucks - Buses
PageNo :1
MONTANOEastbound
MUIN I M1’4U
Westbound
9 1 10 20.2 0.2 0.3 0.3
2ND STNorthbound
13 1 12 20.3 0.1 0.5 0.3
2ND STSouthbound
Lrt Time Left ThRghjp. Total Left Thru Right App. Total Left Thru Right App. Total Left Thru Right App. Total nt. Total07:00 AM 18 311 73 402 19 66 12 97 9 91 28 128 63 211 25 299 92607:15 AM 30 335 57 422 26 84 29 139 10 96 28 134 73 232 26 331 102607:30 AM 21 350 67 438 25 119 29 173 25 136 46 207 80 215 21 316 113407:45 AM 29 373 70 472 26 129 25 180 22 128 46 196 85 248 28 361 1209
Total 98 1369 267 1734 96 398 95 589 66 451 148 665 301 906 100 1307 4295
08:00 AM 36 284 78 398 31 127 33 191 22 107 27 156 72 237 31 340 108508:15 AM 32 290 52 374 25 126 20 171 21 88 21 130 63 222 25 310 98508:30 AM 22 219 56 297 23 144 21 188 11 73 50 134 51 178 18 247 86608:45AM 21 232 47 300 20 117 29 166 17 85 29 131 46 154 19 219 816
Total 111 1025 233 1369 99 514 103 716 71 353 127 551 232 791 93 1116 3752
“‘ BREAK
04:00 PM 24 173 35 232 43 296 50 389 92 187 37 316 43 162 32 237 117404:15 PM 24 150 26 200 32 263 56 351 72 202 45 319 35 170 33 238 110804:30 PM 21 147 27 195 40 315 64 419 67 203 33 303 43 157 46 246 116304:45 PM 33 163 30 226 56 289 66 411 76 245 42 363 26 151 33 210 1210
Total 102 633 118 853 171 1163 236 1570 307 837 157 1301 147 640 144 931 4655
05:00 PM 16 154 30 200 37 325 84 446 83 261 41 385 29 152 50 231 126205:15 PM 26 170 45 241 28 289 88 405 66 295 29 390 25 142 48 215 125105:30 PM 25 156 37 218 38 309 87 434 73 186 55 314 28 129 42 199 116505:45 PM 28 145 29 202 36 274 58 368 70 191 28 289 28 131 34 193 1052
Total 95 625 141 861 139 1197 317 1653 292 933 153 1378 110 554 174 838 4730
Grand Total 406 3652 759 4817 505 3272 751 4528 736 2574 585 3895 790 2891 511 4192 17432Apprch % 8.4 75.8 15.8 11.2 72.3 16.6 18.9 66.1 15 18.8 69 12.2
Total % 2.3 20.9 4.4 27.6 2.9 18.8 4.3 26 4.2 14.8 3.4 22.3 4.5 16.6 2.9 24Cars 399 3631 756 4786 493 3243 736 4472 734 2540 572 3846 776 2858 509 4143 17247
% Cars 98.3 99.4 99.6 99.4 97.6 99.1 98 98.8 99.7 98.7 97.8 98.7 98.2 98.9 99.6 98.8 98.9Trucks 4 15 3 22 11 19 13 43 1 22 11 34 11 29 2 42 141
%Trucks 1 0.4 0.4 0.5 2.2 0.6 1.7 0.9 0.1 0.9 1.9 0.9 1.4 1 0.4 1 0.800
150.4
Buses 3 6% Buses 0.7 0.2
3 4 0 7 440.4 0.1 0 0.2 0.3

Counter: NKH
Ha,wick Transportation Group1440 Camino Cerrito SEAlbuquerque, NM 87123
505.323.5060 Fi’e Name : Mont2ndStSite Code : 00000000Start Date :11/4/2009PageNo :2
MONTANOEastbound
100 639 142 881100 99.4 100 99.5
O 3 0 30 0.5 0 0.30 1 0 10 0.2 0 0.1
MONTANOWestbound
158 1209 325 169299.4 99.8 100 99.8
1 1 0 20.6 0.1 0 0.1
0 2 0 20 0.2 0 0.1
2ND STNorthbound
298 981 166 1445100 99.4 99.4 99.5
0 5 1 60 0.5 0.6 0.40 1 0 10 0.1 0 0.1
2ND STSouthbound
106 569 173 848 486698.1 99.1 100 99.2 99.5
2 5 0 7 181.9 0.9 0 0.8 0.4
0 0 0 0 40 0 0 0 0.1
StartTime Left I Thru I Right App.Total Left I Thru I Right I App.Total Left I Thru Right App.Total Left Thru I Right I App.Total Int.Total
Peak Hour Analysis From 07:00 AM to 11:45 AM - Peak 1 of IPeak Hour for Entire Intersection Begins at 07:15 AM
07:15 AM 30 335 57 422 26 84 29 139 10 96 28 134 73 232 26 331 102607:30 AM 21 350 67 438 25 119 29 173 25 136 46 207 80 215 21 316 113407:45 AM 29 373 70 472 26 129 25 180 22 128 46 196 85 248 28 361 120908:00 AM 36 284 78 398 31 127 33 191 22 107 27 156 72 237 31 340 1085
TotalVolume 116 1342 272 1730 108 459 116 683 79 467 147 693 310 932 106 1348 4454%App. Total 6.7 77.6 15.7 15.8 67.2 17 11.4 67.4 21.2 23 69.1 7.9
PHF .806 .899 .872 .916 .871 .890 .879 .894 .790 .858 .799 .837 .912 .940 .855 .934 .921Cars 115 1334 270 1719 105 450 108 663 79 452 140 671 308 927 105 1340 4393
%Cars 99.1 99.4 99.3 99.4 97.2 98.0 93.1 97.1 100 96.8 95.2 96.8 99.4 99.5 99.1 99.4 98.6Trucks 0 6 2 8 2 7 7 16 0 8 6 14 2 4 1 7 45
%Trucks 0 0.4 0.7 0.5 1.9 1.5 6.0 2.3 0 1.7 4.1 2.0 0.6 0.4 0.9 0.5 1.0Buses 1 2 0 3 1 2 1 4 0 7 1 8 0 1 0 1 16
%Buses 0.9 0.1 0 0.2 0.9 0.4 0.9 0.6 0 1.5 0.7 1.2 0 0.1 0 0.1 0.4
Peak Hour Analysis From 12:00 PM to 05:45 PM - Peak 1 of IPeak Hour for Entire Intersection Begins at 04:45 PM
04:45 PM 33 163 30 226 56 289 66 411 76 245 42 363 26 151 33 210 121005:00 PM 16 154 30 200 37 325 84 446 83 261 41 385 29 152 50 231 126205:15 PM 26 170 45 241 28 289 88 405 66 295 29 390 25 142 48 215 125105:30 PM 25 156 37 218 38 309 87 434 73 186 55 314 28 129 42 199 1165
Total Volume 100 643 142 885 159 1212 325 1696 298 987 167 1452 108 574 173 855 4888%App. Total 11.3 72.7 16 9.4 71.5 19.2 20.5 68 11.5 12.6 67.1 20.2
PHF .758 .946 .789 .918 .710 .932 .923 - 51 98 .836 .759 .931 .931 .944 .865 .925 .968Cars
%CarsTrucks
% TrucksBuses
% Buses
Counter: NKHProject: Montaño Station
Harwick Transportation Group1440 Camino Cerrito SEAlbuquerque, NM 87123
505.323.5060 File Name : MontanoEdithSite Code : 00000000Start Date : 11/5/2009
Groups Printed- Cars - Trucks - Buses
PageNo :1
MontañoEastbound
MontañoWestbound
EdithNorthbound
EdithSouthbound
0 2 10 0.2 0.3
Start Time Left Thru Right App. Total Left Thru Right App. Total Left Thru Right App. Total Left Thru Right App. Total mt. Total07:00 AM 39 275 41 355 9 79 52 140 10 66 14 90 57 75 14 146 73107:15 AM 39 345 42 426 13 138 40 191 14 74 19 107 40 72 15 127 85107:30 AM 35 388 55 478 20 158 65 243 20 64 34 118 71 105 18 194 103307:45 AM 41 392 39 472 32 148 61 241 26 86 23 135 74 130 19 223 1071
Total 154 1400 177 1731 74 523 218 815 70 290 90 450 242 382 66 690 3686
08:00 AM 40 362 33 435 12 141 29 182 14 51 25 90 77 96 18 191 89808:15 AM 27 323 21 371 23 140 24 187 18 75 18 111 42 77 15 134 803
‘‘ BREAKTotal 67 685 54 8061 35 281 53 369 32 126 43 201 119 173 33 325 1701
BREAK
04:00 PM 30 220 15 265 26 272 40 338 67 147 32 246 63 106 39 208 105704:15 PM 28 237 14 279 28 314 36 378 49 122 36 207 55 82 32 169 103304:30 PM 25 199 13 237 35 295 45 375 47 156 25 228 48 77 33 158 99804:45 PM 34 238 16 288 18 342 53 413 38 140 27 205 37 69 31 137 1043
Total 117 894 58 1069 107 1223 174 1504 201 565 120 886 203 334 135 672 4131
05:00 PM 30 211 11 252 25 344 44 413 67 169 29 265 49 81 44 174 110405:15 PM 39 236 24 299 21 377 33 431 59 153 37 249 42 72 27 141 112005:30 PM 22 160 9 191 26 270 33 329 38 136 17 191 36 63 32 131 84205:45 PM 15 194 8 217 15 277 31 323 33 110 12 155 21 33 20 74 769
Total 106 801 52 959 87 1268 141 1496 197 568 95 860 148 249 123 520 3835
Grand Total 444 3780 341 4565 303 3295 586 4184 500 1549 348 2397 712 1138 357 2207 13353Apprch% 9.7 82.8 7.5 7.2 78.8 14 20.9 64.6 14.5 32.3 51.6 16.2
Total % 3.3 28.3 2.6 34.2 2.3 24.7 4.4 31.3 3.7 11.6 2.6 18 5.3 8.5 2.7 16.5Cars 441 3744 331 4516 292 3265 575 4132 484 1504 335 2323 699 1113 351 2163 13134
% Cars 99.3 99 97.1 98.9 96.4 99.1 98.1 98.8 96.8 97.1 96.3 96.9 98.2 97.8 98.3 98 98.4Trucks 2 28 8 38 10 18 9 37 15 42 12 69 13 23 5 41 185
%Trucks 0.5 0.7 2.3 0.8 3.3 0.5 1.5 0.9 3 2.7 3.4 2.9 1.8 2 1.4 1.9 1.4Buses 1 8 2
% Buses 0.2 0.2 0.611 1 12 2 15 1 3 1
0.2 0.3 0.4 0.3 0.4 0.2 0.2 0.35
0.23 34
0.1 0.3

Ha,wick Transportation Group1440 Camino Cerrito SEAlbuquerque, NM 87123
505.323.5060 File Name : MontanoEdithSite Code : 00000000Start Date : 11/5/2009PageNo :2
Montano Montaño Edith EdithEastbound Westbound Northbound Southbound
Start Time Left I Thru Right App. Total Left Thru I Right App. Total Left I Thru Right App. Total I Left Thru I Right App. Total nt. TotailPeak Hour Analysis From 07:00 AM to 11:45 AM - Peak 1 of 1Peak Hour for Entire Intersection Begins at 07:15 AM
07:15 AM 39 345 42 426 13 138 40 191 14 74 19 107 40 72 15 127 85107:30 AM 35 388 55 478 20 158 65 243 20 64 34 118 71 105 18 194 103307:45 AM 41 392 39 472 32 148 61 241 26 86 23 135 74 130 19 223 107108:00 AM 40 362 33 435 12 141 29 182 14 51 25 90 77 96 18 191 898
Total Volume 155 1487 169 1811 77 585 195 857 74 275 101 450 262 403 70 735 3853%App. Total 8.6 82.1 9.3 9 68.3 22.8 16.4 61.1 22.4 35.6 54.8 9.5
PHF .945 .948 .768 .947 .602 .926 .750 .882 .712 .799 .743 .833 .851 .775 .921 .824 .899Cars 153 1476 167 1796 72 574 193 839 66 263 93 422 257 393 66 716 3773
% Cars 98.7 99.3 98.8 99.2 93.5 98.1 99.0 97.9 89.2 95.6 92.1 93.8 98.1 97.5 94.3 97.4 97.9Trucks 1 8 1 10 4 7 2 13 7 11 7 25 5 9 3 17 65
%Trucks 0.6 0.5 0.6 0.6 5.2 1.2 1.0 1.5 9.5 4.0 6.9 5.6 1.9 2.2 4.3 2.3 1.7Buses 1 3 1 5 1 4 0 5 1 1 1 3 0 1 1 2 15
% Buses 0.6 0.2 0.6 0.3 1.3 0.7 0 0.6 1.4 0.4 1.0 0.7 0 0.2 1.4 0.3 0.4
Peak Hour Analysis From 12:00 PM to 05:45 PM - Peak I of 1Peak Hour for Entire Intersection Begins at 04:30 PM
04:30 PM 25 199 13 237 35 295 45 375 47 156 25 228 48 77 33 158 99804:45 PM 34 238 16 288 18 342 53 413 38 140 27 205 37 69 31 137 104305:00 PM 30 211 11 252 25 344 44 413 67 169 29 265 49 81 44 174 110405:15 PM 39 236 24 299 21 377 33 431 59 153 37 249 42 72 27 141 1120
TotalVolume 128 884 64 1076 99 1358 175 1632 211 618 118 947 176 299 135 610 4265%App.Total 11.9 82.2 5.9 6.1 83.2 10.7 22.3 65.3 12.5 28.9 49 22.1
PHF .821 .929 .667 .900 .707 .901 .825 .947 .787 .914 .797 .893 .898 .923 .767 .876952Cars 127 876 61 1064 96 1352 171 1619 207 605 116 928 1(2 292 135 599 4210
%Cars 99.2 99.1 95.3 98.9 97.0 99.6 97.7 99.2 98.1 97.9 98.3 98.0 97.7 97.7 100 98.2 98.7Trucks 1 6 3 10 3 2 3 8 4 13 2 19 4 7 0 11 48
%Trucks 0.8 0.7 4.7 0.9 3.0 0.1 1.7 0.5 1.9 2.1 1.7 2.0 2.3 2.3 0 1.8 1.1Buses 0 2 0 2 0 4 1 5 0 0 0 0 0 0 0 0 7
% Buses 0 0.2 0 0.2 0 0.3 0.6 0.3 0 0 0 0 0 0 0 0 0.2
Map
-M
onta
ño
Sta
tio
n111
312
010
‘rt
-t:3 > £0
(0 -o
CD
CN
O—
—585
‘-0)
()4
— hfl
O8
__
__
__
__
__
__
__
__
__
__
__
__
_
Mon
taño
Rd
.j77
Mon
taño
Rd
i55
:;C
l%tr
lI 3
42
r—co
j-
1487
—>
272>
169— ‘I,”,
Monta
na
Sta
tio
nA
MP
eak
-E
xis
ting
P:M
on
tan
oS
ta\A
naIy
sis
Ex
-A
M.s
y7
Fig
ure
B-I

Map
-M
onta
ñoS
tati
on11
1312
010
tt•11
t3 >
(I) C
w‘
Th212
‘c-L
f)--
——
c’-
41358
Lt)1
159
Mon
taño
Rd
Mon
taño
Rd
643>
o884*
...
142
°‘
64—
a
.14
Mon
taño
Sta
tion
PMP
eak
-E
xist
ing
P:M
on
tan
oS
ta\A
naIy
sisE
x-P
M.s
y7F
igur
e8-
2
Map
-M
onta
ñoS
tati
on11
1312
010
tt11
-
>
U)
-cV C
‘‘—
116
w(0
0<
—1
9546
1o
c,4—
72
9°
4-6
05
Mon
taño
RqI
1çi
108
22
.iXM
onta
ñoR
d
1l6tf799
155ztt(’
—>
1 35
2—
4U
’1492—
0
272—
169
0 ci) ä5
‘I,”,
Mon
taño
Sta
tion
AM
Pea
k-
Bui
ld10
0S
pac
esP
:\M
onta
noS
ta\A
naly
sis\
Ex-
AM
-Bui
Id-1
00sy
7Fi
gure
8-3
Map
-M
onta
ñoS
tati
on11
1312
010
tIl’
V >
(I)
V—
325
WCe
’)‘c
i-CO
44—
iC)
c<
—F—
F--
0I
4—I 7
04--
4-—
1366
Mon
taño
159
.j,9
9M
onta
ñoR
d.0
10
O9
18
128
ttf”
—
647
oco
ca911+
—*
c’.c
c-
0)—
67—
.
U ci) (I)
U,
Mon
taño
Sta
tion
PMP
eak
-B
uild
100
Spac
esP
:\M
onta
noS
ta\A
naIy
sisE
x-P
M-B
uild
-100
sy7
Fig
ure
B-4
Map
-M
onta
ñoS
tati
on11
1312
010
tt
-o >
(I)
- 0 uJ
E466
oc,
t)<
729
°6
46
Mon
taño
R)J
JJJç
L4
b08
JJJJ
j77
Mon
taño
Rd
116itj
179
155
jti’1
11372
—‘
1501
—>
cor-
c32
—.
—e’
272
17
0—
‘3 G) I)
‘1”!’
Mon
taño
Sta
tion
AM
Pea
k-
Bui
ld20
0S
pac
esP
:\M
onta
noS
ta\A
naIy
sisE
x-A
M-B
uiId
-200
.sy7
Fig
ure
B-5
Map
-M
onta
ñoS
tati
on11
13/2
010
ill’‘Ii
-o >.4
J
C/) C
-D
‘—32
6W
—175
E1
240
tOas
co4
—-
1(5-
#—17
04--
—1
375
Mon
taño
R),
16O
JM
onta
ñoR
dio
o3
G1
28
z1
if
—
65
f91
‘--
‘-
—
142
>.,
70—
ED C’)
U,U,
Mon
taño
Sta
tion
PMP
eak
-B
uild
200
Spac
esP
:Monta
no
Sta
Anal
ysi
sEx-P
M-B
uil
d-2
00.s
y7
Fig
ure
B-6

Map
-M
onta
ñoS
tati
on11
1312
010
‘Ii‘Ti
>
CI)
-c-o C
‘—11
6w
E468
0(e)-
<—
729
‘°°
<—66
6M
onta
ñoR
Ul
flO8
Z9
77
Mon
taño
Rd
116
i‘“
155
->
1799
—>
13
82
>272
—
1506
—>
cor-
C)
—(N
’
>171—
0 0 )
L,.,Lf
I,tf
Mon
taño
Sta
tion
AM
Pea
k-
Bui
ld25
0S
pac
esP
:Mo
nta
no
Sta
Ana
lysi
sEx-
AM
-Bui
Id-2
50.s
y7F
igur
eB
-7

Map
-M
onta
ñoS
tati
on11
1312
010
tt11
>
(I)
- -oc”
“—32
6W
r-.
r—0
—I f
Ic,
or—
‘-,
-—
4—I 7
04-
-4—
I 379
Mon
taño
24
JJJJ
J1s99
Mon
taño
Rd
4AIO
Ott
i’9i8
I2
9’),t
i1”
—*
654
‘.
0)
955>
—
I42
>.
71
—
U ci Cl)
•1”!’‘N,
Mon
taño
Sta
tion
PMP
eak
-B
uild
250
Spac
esP
:Mo
nta
no
Sta
Ana
lysi
sEx-
PM
-Bui
ld-2
5O.s
y7F
igur
eB
-8

Appendix C
Trip Generation, Distribution and Assignment

Trip Generation Worksheet
Park and Ride Lot withLand Use: Bus Service 90
Trip Generation Units: I Space
Project Units: 100
Trip Generation Equations:
Average Vehicle Trip End on a WeekdayT = 4.04(X) + 117.33Enter 50%Exit 50%
Peak Hour of Adjacent St, Traffic 7 to 9 AM
T = 0.83(X) - 43.40Enter 81%Exit 19%
Peak Hour of Adjacent St Traffic, 4 to 6 PM
T = 0.63(X) - 5.94Enter 23%Exit 77%
Daily Trips 521Enter 261Exit 260
AM Peak Trips 40Enter 32Exit 8
PM Peak Trips 57Enter 13Exit 44
Trip Generation based upon ITE Trip Generation, 8th Edition.
30-TAZ-Data Appendix D-1 1/13/2010
Dis
trib
uti
on-A
ssig
nm
ent
Dis
trib
utio
n
LTT
ilR
TLT
THR
TLT
THR
TLT
THR
TS
um
= 10
1022
3
05
020
20
27
Eas
tbound
Wes
tbound
Nort
hbound
So
uth
bo
un
dLT
THR
TLT
THR
TLT
THR
TLT
THR
TS
um
40
130
00
17In
Out
49
1430
5713
44
027
38
10
39
Bol
d-
Ent
erin
gT
raff
ic
AM
Pea
kH
our
Eas
tbo
un
dW
estb
ound
Nort
hbound
South
bound
Inte
rsec
tion
LTTH
RT
LTTH
RT
LTTH
RT
LTTH
RT
Sum
Mon
taño
2nd
St
0.3
0.01
0.3
0.01
0.01
0.01
Mon
taño
@S
ite
Acc
ess
0.32
0.68
0.32
0.68
Mon
taño
Edi
thB
lvd
0.01
0.61
0.06
0.61
0.06
0.01
PMP
eak
Hou
rE
astb
ound
Wes
tbound
Nort
hbound
Sou
thb
ou
nd
Inte
rsec
tion
LTTH
RT
LTTH
RT
LTTH
RT
LTTH
RT
Sum
Mon
taño
@2n
dS
t0.
30.
010.
30.
010
01
0.01
Mon
taño
Sit
eA
cces
s0.
320.
680.
320.
68
Mon
taño
cE
dith
Blv
d0.
010.
610.
060.
610.
060.
01
Ass
ignm
ent
AM
Peak
Hour
Eas
tbound
Wes
tbound
Nort
hbound
Sou
thb
ou
nd
Inte
rsec
tion
Mon
taño
@2n
dS
t
Mon
taño
@S
ite
Acc
ess
Mon
tano
@E
dith
Blv
d
PMP
eak
Hou
rIn
ters
ecti
on
Mon
taño
@2n
dS
t
Mon
taño
@Si
teA
cces
s
Mon
taño
@E
dith
Blv
d
02
00
0
5
12In
Out
4032
8
30-T
AZ
-Dat
aC
-li
1/13
/201
0
Subar
eaS
um
mar
ies
Tri
ps1
23
45
67
8SU
M
Pop
ulat
ion
6668
818
494
2846
3123
1603
1570
510
3343
7222
928
4031
Pop
ulat
ion
%23
%7%
1%1%
1%6%
36%
25%
100%
AM
Ent
er32
82
00
02
128
32
AM
Exi
t8
21
00
00
32
8
PME
nter
133
10
00
15
313
PMEx
it44
103
00
02
1611
42
Dai
lyE
nter
261
6117
33
114
9566
260
Dai
lyEx
it26
161
173
31
1495
6626
0
Sub
area
s:I
Wes
tsid
evi
aM
onta
ño2
Eas
tof
rive
rvi
aM
onta
ño3
Nor
thof
Mon
taño
via
2nd
St
4S
outh
ofM
onta
ñovi
a2n
dS
t5
Nor
thof
Mon
taño
via
Edi
th6
Sou
thof
Mon
taño
via
Edi
th7
Via
1-40
and
Mon
taño
8V
iaM
onta
ño/M
ontg
omer
y
Per
centa
ges
EB
InW
BO
utW
BIn
EB
Out
Dir
ectio
nal
32%
32%
68%
68%
Tri
psE
BIn
WB
Out
WB
InE
BO
ut
AM
103
225
PM4
139
29
Dai
ly84
8417
617
6

Trip Generation Worksheet
Park and Ride Lot withLand Use: Bus Service 90
Trip Generation Units: I Space
Project Units: 200
Trip Generation Equations:
Average Vehicle Trip End on a WeekdayT = 4.04(X) + 117.33Enter 50%Exit 50%
Peak Hour of Adjacent St, Traffic 7 to 9 AM
T=0.83(X)-43.40Enter 81%Exit 19%
Peak Hour of Adjacent St Traffic, 4 to 6 PM
T = 0.63(X) - 5.94Enter 23%Exit 77%
Daily Trips 925Enter 463Exit 462
AM Peak Trips 123Enter 100Exit 23
PM Peak Trips 120Enter 28Exit 92
Trip Generation based upon ITE Trip Generation, 8th Edition.
30-TAZ-Data Appendix D-1 1/13/2010
Dis
trib
uti
on-A
ssig
nm
ent
Dis
trib
utio
n
LTTH
RT
LTTS
RT
LTTH
RT
LTTH
RT
Sum
= 300
70
PMP
eak
Hou
rE
astb
ou
nd
Wes
tbound
Nort
hbound
So
uth
bou
nd
Inte
rsec
tion
LTTH
RT
LTTH
RT
LTTH
RT
LTTH
RT
Sum
Mon
taño
@2n
dS
t8
128
I0
038
InO
ut
Mon
taño
@Si
teA
cces
s9
1929
6312
028
92
Mon
taño
@E
dith
Blv
d1
566
172
082
Bol
d-
Ent
erin
gT
raff
ic
AM
Pea
kH
our
Eas
tbo
un
dW
estb
ound
Nort
hbound
South
bound
Inte
rsec
tion
LTTH
RT
LTTH
RT
LTTH
RT
LTTH
RT
Sum
Mon
taño
@2n
dS
t0.
30.
010.
30.
010.
010.
01
Mon
taño
Site
Acc
ess
0.32
0.68
0.32
0.68
Mon
taño
@E
dith
Blv
d0.
010.
610.
060.
610.
060
01
PMP
eak
Hou
rE
astb
ou
nd
Wes
tbound
Nort
hbound
South
bound
Inte
rsec
tion
LTTH
RT
LTTH
RT
LTTH
RT
LTTH
RT
Sum
Mon
taño
@2n
dS
t0.
30.
010.
30.
010.
010.
01
Mon
taño
@Si
teA
cces
s0.
320.
680.
320.
68
Mon
taño
@E
dith
Blv
d0.
010.
610.
060.
610.
060.
01
Ass
ignm
ent
AM
Peak
Hour
Eas
tbo
un
dW
estb
ound
Nort
hbound
South
bound
Inte
rsec
tion
Mon
taño
@2n
dS
t
Mon
taño
Sit
eA
cces
s
Mon
taño
@E
dith
Blv
d
3268
014
161
7 6
16
39In
Out
123
100
23
183
30-T
AZ
-Dat
aC
-Il
1/13
/201
0

Subar
eaS
um
mar
ies
Tri
psI
34
56
78
SUM
Pop
ulat
ion
Pop
ulat
ion
%
AM
Ent
er
AM
Exit
PME
nter
6668
818
494
2846
3123
23%
7%1%
1%
237
11
51
00
5
1603
1570
510
3343
7222
928
4031
1%6%
36%
25%
100%
16
3625
100
01
86
21
00
210
728
533
23
2616
811
8
92 464
464
Sub
area
s:
2 3 4 5 6 7 8
Via
:W
ests
ide
via
Mon
taño
Eas
tof
rive
rvi
aM
onta
ñoN
orth
ofM
onta
ñovi
a2n
dS
tS
outh
ofM
onta
ñovi
a2n
dS
tN
orth
ofM
onta
ñovi
aE
dith
Sou
thof
Mon
taño
via
Edi
thV
ia-4
0an
dM
onta
ñoV
iaM
onta
no/M
ontg
omer
y
Per
centa
ges
Dir
ectio
nal
EB
InW
BO
ut
WB
InE
BO
ut
32%
32%
68%
68%
EB
InW
BO
utW
BIn
EB
Out
326
6815
930
1962
149
149
315
315
2
100
23 287
20
PMEx
it92
226
Dai
lyE
nter
463
109
30
Dai
lyEx
it46
310
930
11
1
55
3
53
2616
811
8
Tri
ps
AM PM Dai
ly

Trip Generation Worksheet
Park and Ride Lot withLand Use: Bus Service 90
Trip Generation Units: I Space
Project Units: 250
Trip Generation Equations:
Average Vehicle Trip End on a WeekdayT = 4.04(X) + 117.33Enter 50%Exit 50%
Peak Hour of Adjacent St, Traffic 7 to 9 AM
T = 0.83(X) - 43.40Enter 81%Exit 19%
Peak Hour of Adjacent St Traffic, 4 to 6 PM
T=0.63(X)-5.94Enter 23%Exit 77%
Daily Trips 1127Enter 564Exit 563
AM Peak Trips 164Enter 133Exit 31
PMPeakTrips 152Enter 35Exit 117
Trip Generation based upon ITE Trip Generation, 8th Edition.
30-TAZ-Data Appendix D-1 1/13/2010

Dis
trib
uti
on-A
ssig
nm
ent
Dis
trib
utio
nA
MP
eak
Hour
Eas
tbo
un
dW
estb
ound
Nort
hbound
South
bound
Inte
rsec
tion
LTTH
RT
LTTH
RT
LTTH
RT
LTTH
RT
Sum
Mon
taño
@2n
dS
t0.
30.
010.
30.
010.
010.
01
Mon
taño
@Si
teA
cces
s0.
320.
680.
320.
68
Mon
taño
@E
dith
Blv
d0.
010.
610.
060.
610.
060.
01
PMP
eak
Hou
rE
astb
ou
nd
Wes
tbound
Nort
hbound
Sou
thb
ou
nd
Inte
rsec
tion
LTTH
RT
LTTH
RT
LTTH
RT
LTTH
RT
Sum
Mon
taño
@2n
dS
t0.
30.
010.
30.
010.
010.
01
Mon
taño
@Si
teA
cces
s0.
320.
680.
320.
68
Mon
taño
@E
dith
Blv
d0.
010.
610.
060.
610.
060.
01
Ass
ignm
ent
AM
Peak
Hour
Eas
tbo
un
dW
estb
ound
Nort
hbound
South
bound
Inte
rsec
tion
LTTH
RT
LTTH
RT
LTTH
RT
LTTH
RT
Sum
Mon
taño
c2n
dS
t40
09
01
151
InO
ut
Mo
nta
ño
@S
iteA
cces
s43
9010
2116
413
331
Mon
taño
@E
dith
Blv
d0
192
818
111
1
PMP
eak
Hou
rE
astb
ound
Wes
tbound
Nort
hbound
So
uth
bo
un
dIn
ters
ecti
on
LTTH
RT
LTTH
RT
LTTH
RT
LTTH
RT
Sum
Mon
taño
2nd
St
111
351
00
48In
Out
Monta
no@
Sit
eA
cces
s11
2437
8015
235
117
Mon
taño
@E
dith
Blv
d1
717
212
010
2
Bol
d-
Ent
erin
gT
raff
ic
30-T
AZ
-Dat
aC
-11
1/1
3/20
10
Subar
eaS
um
mar
ies
Pop
ulat
ion
Pop
ulat
ion
%
AM
Ent
er
AM
Exit
PME
nter
PMEx
it
Dai
lyE
nter
Dai
lyE
xit
6668
818
494
2846
3123
23%
7%1%
1%
319
11
72
00
82
00
278
11
132
376
6
132
376
6
1603
1570
510
3343
7222
928
4031
1%6%
36%
25%
100%
17
4834
132
02
118
30
02
139
34
16
4330
117
331
205
143
563
331
205
143
563
Sub
area
s:1 2 3 4 5 6 7 8
Via
:W
ests
ide
via
Mon
taño
Eas
tof
rive
rvi
aM
onta
ñoN
orth
ofM
onta
ñovi
a2n
dS
tS
outh
ofM
onta
ñovi
a2n
dS
tN
orth
ofM
onta
ñovi
aE
dith
Sou
thof
Mon
taño
via
Edi
thV
ia-4
0an
dM
onta
ñoV
iaM
onta
no/M
ontg
omer
y
Per
centa
ges
Dir
ectio
nal
EB
InW
BO
utW
BIn
EB
Out
32%
32%
68%
68%
EB
InW
BO
utW
BIn
EB
Out
429
9021
1037
2480
181
181
382
382
Tri
ps1
23
45
67
8SU
M
133
31 35 117
564
564
Tri
ps
AM PM Dai
ly

Appendix D
Existing Level of Service Analyses
Level of Service Analysis PagesExisting AM - Signalized 2Existing PM - Signalized 2
HCM Signalized Intersection Capacity Analysis1: Montaño Rd & 2ndSt 1/11/2010
Movement EBL EBT EBR WBL WBT WBR NBL NBT NBR SBL SBT SBRLane Configurations ‘I’1 +1’ ?r ++ rVolume (vph) 116 1342 272 108 459 116 79 467 147 310 932 106Ideal Flow (vphpi) 1900 1900 1900 1900 1900 1900 1900 1900 1900 1900 1900 1900Total Lost time (s) 4.0 4.0 4.0 4.0 4.0 4.0 4.0 4.0 4.0 4.0 4.0 4.0Lane Util. Factor 0.97 0.95 1.00 0.97 0.95 1.00 0.97 0.95 1.00 0,97 0.95 1.00Frt 1.00 1.00 0.85 1.00 1.00 0.85 1.00 1.00 0.85 1.00 1.00 0.85Fit Protected 0.95 1.00 1.00 0.95 1.00 1.00 0.95 1.00 1.00 0.95 1.00 1.00Satd. Flow (prot) 3433 3539 1583 3433 3539 1583 3433 3539 1583 3433 3539 1583Fit Permitted 0.95 1.00 1.00 0.95 1.00 1.00 0.95 1.00 1.00 0.95 1.00 1.00Satd. Flow (perm) 3433 3539 1583 3433 3539 1583 3433 3539 1583 3433 3539 1583Peak-hour factor, PHF 0.92 0.92 0.92 0.89 0.89 0.89 0.84 0,84 0.84 0.93 0.93 0.93Adj.Fiow(vph) 126 1459 296 121 516 130 94 556 175 333 1002 114RTOR Reduction (vph) 0 0 8 0 0 27 0 0 11 0 0 70LaneGroupFiow(vph) 126 1459 288 121 516 103 94 556 164 333 1002 44Turn Type Prot pm÷ov Prot pm+ov Prot pm+ov Prot pm+ovProtected Phases 5 2 3 1 6 7 3 8 1 7 4 5Permitted Phases 2 6 8 4Actuated Green, G (s) 7.3 53.5 58.0 4.5 50.7 63.9 4.5 26.8 31.3 13.2 35.5 42.8Effective Green, g (s) 8.8 55.0 61.0 6.0 52.2 66.9 6.0 28.3 34.3 14.7 37.0 45.8Actuated g/C Ratio 0.07 0.46 0.51 0.05 0.44 0.56 0.05 0.24 0.29 0.12 0.31 0.38Clearance Time (s) 5.5 5.5 5.5 5.5 5.5 5.5 5.5 5.5 5.5 5.5 5.5 5.5Vehicle Extension (s) 3.0 3.0 3.0 3.0 3.0 3.0 3.0 3.0 3.0 3.0 3.0 3.0LaneGrpCap(vph) 252 1622 805 172 1539 935 172 835 452 421 1091 657v/s Ratio Prot 0.04 cO,41 0.02 cO.04 0.15 0.01 0.03 0.16 0.02 cO.10 cO.28 0.00v/s Ratio Perm 0.16 0.05 0.09 0.02v/cRatio 0.50 0.90 0.36 0.70 0.34 0.11 0.55 0.67 0.36 0.79 0.92 0.07Uniform Delay, dl 53.5 30.0 17.7 56.1 22.4 12.5 55.7 41.6 34.1 51.2 40.0 23.5Progression Factor 1.00 1.00 1.00 0.67 0.44 0.03 1.00 1.00 1.00 1.00 1.00 1.00incremental Delay, d2 1.6 8.4 0.3 11.9 0.6 0.1 3.5 4.2 0.5 9.8 13.6 0.0Delay(s) 55.0 38.3 18.0 49.2 10.4 0.4 59.2 45.7 34.6 60.9 53.6 23.6LevelofService E D B D B A E D C E D CApproach Delay (5) 36.3 14.8 44.9 52.9Approach LOS D B D D
Intersection SummaryHCM Average Control Delay 39.3 HCM Level of Service DHCM Volume to Capacity ratio 0.87Actuated Cycle Length (s) 120.0 Sum of lost time (s) 12.0Intersection Capacity Utilization 82.9% ICU Level of Service EAnalysis Period (mm) 15c Critical Lane Group
Montaño Station 11/12/2009 AM Peak - Existing Synchro7- ReportNKH Page 1
HCM Signalized Intersection Capacity Analysis2: Montaño Rd & Edith Blvd 1/1112010
çk4\
Movement EBL EBT EBR WBL WBT WBR NBL NBT NBR SBL SBT SBRLane Configurations +14 r ‘ ++4 r ij +t’•Volume (vph) 155 1487 169 77 585 195 74 275 101 262 403 70ideal Flow (vphpl) 1900 1900 1900 1900 1900 1900 1900 1900 1900 1900 1900 1900Total Lost time (s) 4.0 4.0 4.0 4.0 4.0 4.0 4.0 4.0 4.0 4.0 4.0 4.0Lane Util. Factor 1.00 0.91 1.00 1.00 0.91 1.00 1.00 0.95 1.00 1.00 0.95 1.00Frt 1.00 1.00 0.85 1.00 1.00 0.85 1.00 1.00 0.85 1.00 1.00 0.85Fit Protected 0.95 1.00 1.00 0.95 1.00 1.00 0.95 1.00 1.00 0.95 1.00 1.00Satd.Fiow(prot) 1770 5085 1583 1770 5085 1583 1770 3539 1583 1770 3539 1583FIt Permitted 0.33 1.00 1.00 0.08 1.00 1.00 0.47 1.00 1.00 0.35 1.00 1.00Satd.Flow(perm) 611 5085 1583 154 5085 1583 881 3539 1583 643 3539 1583Peak-hour factor, PHF 0.95 0.95 0.95 0.88 0.88 0.88 0.83 0.83 0.83 0.82 0.82 0.82Adj. Flow (vph) 163 1565 178 88 665 222 89 331 122 320 491 85RTOR Reduction (vph) 0 0 59 0 0 71 0 0 65 0 0 51LaneGroupFlow(vph) 163 1565 119 88 665 151 89 331 57 320 491 34Turn Type pm÷pt pm-i-ov pm+pt pm+ov pm÷pt pm÷ov pm+pt pm÷ovProtected Phases 5 2 3 1 6 7 3 8 1 7 4 5Permitted Phases 2 2 6 6 8 8 4 4Actuated Green, G (s) 55.2 47.2 52.7 54.6 46.9 67.9 27,6 22.1 29.8 48.6 37.6 45.6Effective Green, g (s) 58.2 48.7 55.7 57.6 48.4 70.9 30.6 23.6 32.8 50.1 39.1 48.6Actuated g/C Ratio 0.49 0.41 0.46 0.48 0.40 0.59 0.26 0.20 0.27 0.42 0.33 0.41Clearance Time (s) 5.5 5.5 5.5 5.5 5.5 5.5 5.5 5.5 5.5 5.5 5.5 5.5Vehicle Extension (s) 3.0 3.0 3.0 3.0 3.0 3.0 3.0 3.0 3.0 3.0 3.0 3.0LaneGrpCap(vph) 388 2064 788 198 2051 988 277 696 485 480 1153 694v/sRatioProt 0.03 cO.31 0.01 cO.03 0.13 0.03 0.02 0.09 0.01 cO.13 0.14 0.00v/sRatioPerm 0.17 0.07 0.18 0.07 0.06 0.03 cO.15 0.02v/c Ratio 0.42 0.76 0.15 0.44 0.32 0.15 0.32 0.48 0.12 0.67 0.43 0.05UniformDelay,dl 17.8 30.6 18.5 21.6 24.6 11.0 35.1 42.7 32.7 25.5 31.7 21.7Progression Factor 0.44 0.61 0.60 1.00 1.00 1.00 1.00 1.00 1.00 1.00 1.00 1.00Incremental Delay, d2 0.4 1.4 0.0 1.6 0.4 0.1 0.7 2.3 0.1 3.5 1.2 0.0Delay(s) 8.2 20.0 11.1 23.2 25.0 11.1 35.7 45.0 32.8 29.0 32.8 21.7LevelofService A C B C C B D D C C C CApproach Delay (s) 18.2 21.7 40.8 30.4Approach LOS B C D C
Intersection SummaryHCM Average Control Delay 24.3 HCM Level of Service CHCM Volume to Capacity ratio 0.66Actuated Cycle Length (s) 120.0 Sum of lost time (s) 8.0intersection Capacity Utilization 68.4% ICU Level of Service CAnalysis Period (mm) 15c Critical Lane Group
Montaño Station 11/12/2009 AM Peak - Existing Synchro 7- ReportNKH Page2
HCM Signalized Intersection Capacity Analysis1: Montaño Rd &2nd St 1/11/2010
)1--k4\
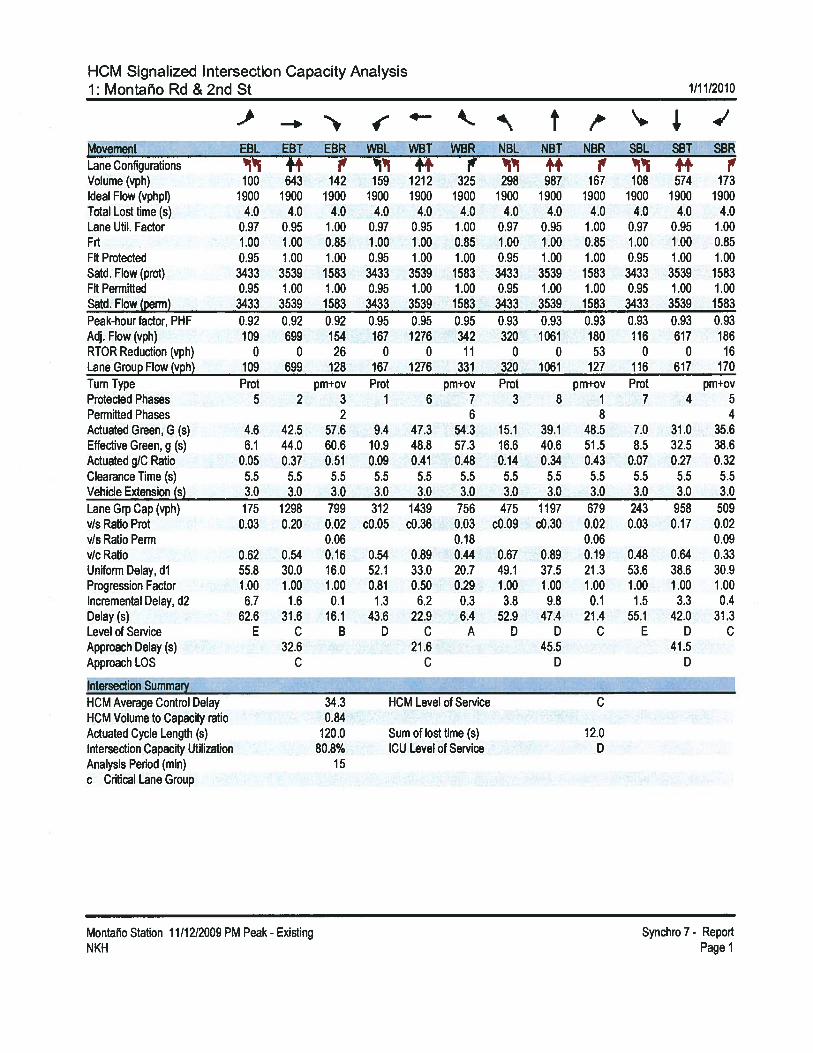
Movement EBL EBT EBR WBL WBT WBR NBL NBT NBR SBL SBT SBRLane Configurations j 11 ++ jr +4th ?vVolume (vph) 100 643 142 159 1212 325 298 987 167 108 574 173ideal Flow (vphpi) 1900 1900 1900 1900 1900 1900 1900 1900 1900 1900 1900 1900TotalLosttime(s) 4.0 4.0 4.0 4.0 4.0 4.0 4.0 4.0 4.0 4.0 4.0 4.0Lane Util. Factor 0.97 0.95 1.00 0.97 0.95 1.00 0.97 0.95 1.00 0.97 0.95 1.00Frt 1.00 1.00 0.85 1.00 1.00 0.85 1.00 1.00 0.85 1.00 1.00 0.85Fit Protected 0.95 1.00 1.00 0.95 1.00 1.00 0.95 1.00 1.00 0.95 1.00 1.00Satd. Flow (prot) 3433 3539 1583 3433 3539 1583 3433 3539 1583 3433 3539 1583Fit Permitted 0.95 1.00 1.00 0.95 1.00 1.00 0.95 1.00 1.00 0.95 1.00 1.00Satd. Flow (perm) 3433 3539 1583 3433 3539 1583 3433 3539 1583 3433 3539 1583Peak-hour factor, PHF 0.92 0.92 0.92 0.95 0.95 0.95 0.93 0.93 0.93 0.93 0.93 0.93Adj. Flow (vph) 109 699 154 167 1276 342 320 1061 180 116 617 186RTOR Reduction (vph) 0 0 26 0 0 11 0 0 53 0 0 16Lane Group Flow (vph) 109 699 128 167 1276 331 320 1061 127 116 617 170Turn Type Prot pm÷ov Prot pm+ov Prot pm+ov Prot pm+ovProtected Phases 5 2 3 1 6 7 3 8 1 7 4 5Permitted Phases 2 6 8 4Actuated Green, G (s) 4.6 42.5 57.6 9.4 47.3 54.3 15.1 39.1 48.5 7.0 31.0 35.6Effective Green,g (s) 6.1 44.0 60.6 10.9 48.8 57.3 16.6 40.6 51.5 8.5 32.5 38.6Actuated g/C Ratio 0.05 0.37 0.51 0.09 0.41 0.48 0.14 0.34 0.43 0.07 0.27 0.32Clearance Time (s) 5.5 5.5 5.5 5.5 5.5 5.5 5.5 5.5 5.5 5.5 5.5 5.5Vehicle Extension (s) 3.0 3.0 3.0 3.0 3.0 3.0 3.0 3.0 3.0 3.0 3.0 3.0Lane Grp Cap (vph) 175 1298 799 312 1439 756 475 1197 679 243 958 509v/sRatioProt 0.03 0.20 0.02 cO.05 cO.36 0.03 cO.09 cO.30 0.02 0.03 0.17 0.02v/s Ratio Perm 0.06 0.18 0.06 0.09v/c Ratio 0.62 0.54 0.16 0.54 0.89 0.44 0.67 0.89 0.19 0.48 0.64 0.33Uniform Delay, dl 55.8 30.0 16.0 52.1 33.0 20.7 49.1 37.5 21.3 53.6 38.6 30.9Progression Factor 1.00 1.00 1.00 0.81 0.50 0.29 1.00 1.00 1.00 1.00 1.00 1.00Incremental Delay, d2 6.7 1.6 0.1 1.3 6.2 0.3 3.8 9.8 0.1 1.5 3.3 0.4Delay(s) 62.6 31.6 16.1 43.6 22.9 6.4 52.9 47.4 21.4 55.1 42.0 31.3Level of Service E C B D C A D D C E D CApproach Delay (s) 32.6 21.6 45.5 41.5Approach LOS C C D D
Intersection SummaryHCM Average Control Delay 34.3 HCM Level of Service CHCM Volume to Capacity ratio 0.84Actuated Cycle Length (s) 120.0 Sum of lost time (s) 12.0Intersection Capacity Utilization 80.8% ICU Level of Service DAnalysis Period (mm) 15c Critical Lane Group
Montano Station 11/12/2009 PM Peak - Existing Synchro 7 - ReportNKH Page 1

HCM Signalized Intersection Capacity Analysis2: Montaño Rd & Edith Blvd 1/11/2010
Movement EBL EBT EBR WBL WBT WBR NBL NBT NBR SBL SBT SBRLane Configurations j +1’ +4’ rVolume (vph) 128 884 64 99 1358 175 211 618 118 176 299 135Ideal Flow (vphpl) 1900 1900 1900 1900 1900 1900 1900 1900 1900 1900 1900 1900Total Lost time (s) 4.0 4.0 4.0 4.0 4.0 4.0 4.0 4.0 4.0 4.0 4.0 4.0Lane Util. Factor 1.00 0.91 1.00 1.00 0.91 1.00 1.00 0.95 1.00 1.00 0.95 1.00Frt 1.00 1.00 0.85 1.00 1.00 0.85 1.00 1.00 0.85 1.00 1.00 0.85Fft Protected 0.95 1.00 1.00 0.95 1.00 1.00 0.95 1.00 1.00 0.95 1.00 1.00Satd. Flow (prot) 1770 5085 1583 1770 5085 1583 1770 3539 1583 1770 3539 1583FltPermitted 0.11 1.00 1.00 0.28 1.00 1.00 0.45 1.00 1.00 0.18 1.00 1.00Satd. Flow (perm) 212 5085 1583 521 5085 1583 847 3539 1583 327 3539 1583Peak-hour factor, PHF 0.90 0.90 0.90 0.95 0.95 0.95 0.89 0.89 0.89 0.88 0.88 0.88Adj. Flow (vph) 142 982 71 104 1429 184 237 694 133 200 340 153RTOR Reduction (vph) 0 0 34 0 0 53 0 0 43 0 0 59LaneGroupFlow(vph) 142 982 37 104 1429 131 237 694 90 200 340 94Turn TypeProtected PhasesPermitted PhasesActuated Green, G (s)Effective Green, g (s)Actuated g/C RatioClearance Time (s)Vehicle Extension (s)
prn+pt pm÷ov pm+pt pm+ov pm+pt pm+ov pm+pt pm+ov5 3 1 7 3 1 7 52 2 6 6 8 8 4 4
45.6 45.6 59.0 42.5 42.5 55.9 45.0 31.6 39.0 45.0 31.6 42.147.1 47.1 62.0 44.0 44.0 58.9 48.0 33.1 42.0 48.0 33.1 45.10.39 0.39 0.52 0.37 0.37 0.49 0.40 0.28 0.35 0.40 0.28 0.38
5.5 5.5 5.5 5.5 5.5 5.5 5.5 5.5 5.5 5.5 5.5 5.53.0 3.0 3.0 3.0 3,0 3.0 3.0 3.0 3.0 3.0 3.0 3.0
239 1996 818 284 1865 830 453 976 554 310 976 648cO.06 0.19 0.01 0.03 cO.28 0.02 0.06 cO.20 0.01 cO.08 0.10 0.01
0.17 0.02 0.11 0.06 0.14 0.04 0.18 0.040.59 0.49 0.04 0.37 0.77 0.16 0.52 0.71 0.16 0.65 0.35 0.1428.4 27.4 14.3 30.1 33.5 16.9 25.1 39.1 26.9 26.2 34.8 24.70.65 0.71 0.57 1.00 1.00 1.00 1.00 1.00 1.00 1.00 1.00 1.00
3.7 0.8 0.0 0.8 3.1 0.1 1.1 4.4 0.1 4.6 1.0 0.122.2 20.2 8.3 30.9 36.5 16.9 26.2 43.5 27.0 30.8 35.8 24.8
C C A C D B C D C C D C19.7 34,1 37.6 31.9
B C D C
2 6 8 4
Intersection SummaryHCM Average Control DelayHCM Volume to Capacity ratioActuated Cycle Length (s)Intersection Capacity UtilizationAnalysis Period (mm)c Critical Lane Group
Sum of lost time (s)ICU Level of Service
Montaño Station 11/12/2009 PM Peak - Existing Synchro7- Report
Lane Grp Cap (vph)v/s Ratio Protv/s Ratio Permv/c RatioUniform Delay, dlProgression FactorIncremental Delay, d2Delay (s)Level of ServiceApproach Delay (s)Approach LOS
HCM Level of Service30.90.71
120.073.5%
15
C
16.0D
NKH Page 2
Appendix E
Alternative 1 Level of Service Analyses
Level of Service Analysis PagesAlternative 1 AM - Signalized 3Alternative 1 PM - Signalized 3Alternative 1 AM - Unsignalized 1Alternative 1 PM - Unsignalized 1
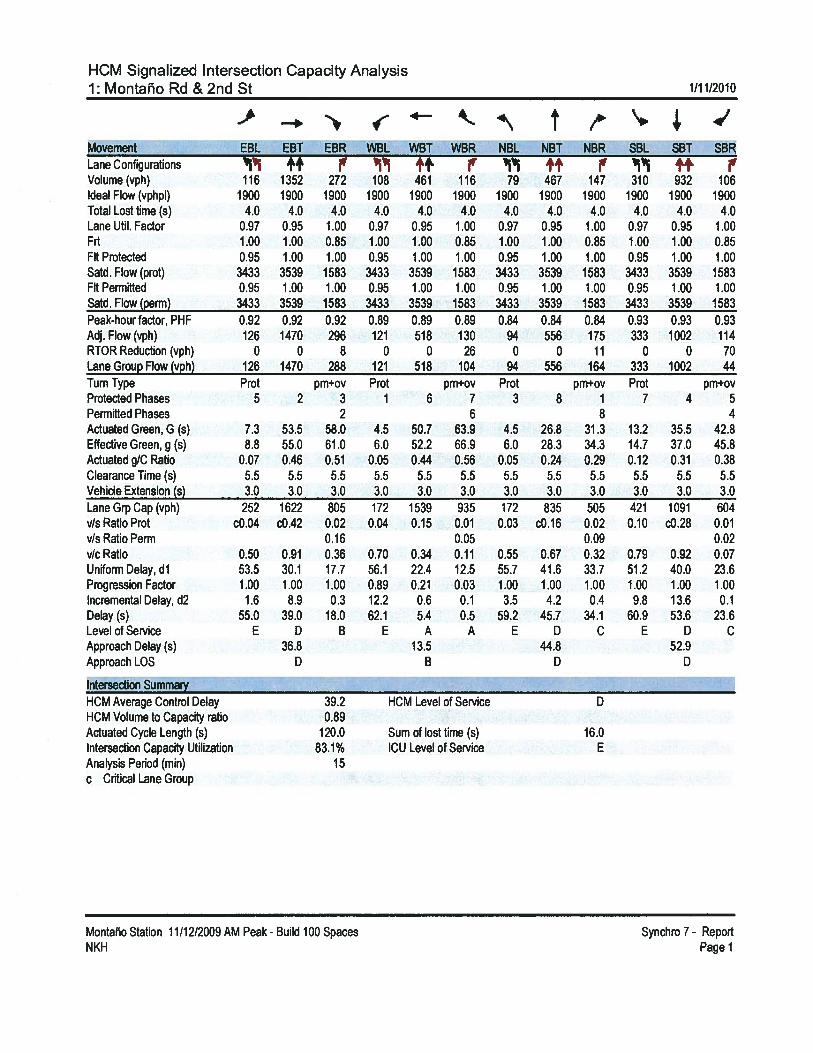
HCM Signalized Intersection Capacity Analysis1: Montaño Rd &2nd St 1/11/2010
Movement EBL EBT EBR WBL WBT WBR NBL NBT NBR SBL SBT SBRLane Configurations j ++ ‘‘1 1t’ i W ++ ‘“I +4’Volume (vph) 116 1352 272 108 461 116 79 467 147 310 932 106ideal Flow (vphpl) 1900 1900 1900 1900 1900 1900 1900 1900 1900 1900 1900 1900Total Lost time (s) 4.0 4.0 4.0 4.0 4.0 4.0 4.0 4.0 4.0 4.0 4.0 4.0Lane Util. Factor 0.97 0.95 1.00 0.97 0.95 1.00 0.97 0.95 1.00 0.97 0.95 1.00Frt 1.00 1.00 0.85 1.00 1.00 0.85 1.00 1.00 0.85 1.00 1.00 0.85Fit Protected 0.95 1.00 1.00 0.95 1.00 1.00 0.95 1.00 1.00 0.95 1.00 1.00Satd. Flow (prot) 3433 3539 1583 3433 3539 1583 3433 3539 1583 3433 3539 1583Fit Permitted 0.95 1.00 1.00 0.95 1.00 1.00 0.95 1.00 1.00 0.95 1.00 1.00Satd. Flow (perm) 3433 3539 1583 3433 3539 1583 3433 3539 1583 3433 3539 1583Peak-hour factor, PHF 0.92 0.92 0.92 0.89 0,89 0.89 0.84 0.84 0.84 0.93 0.93 0.93Adj.Fiow(vph) 126 1470 296 121 518 130 94 556 175 333 1002 114RTOR Reduction (vph) 0 0 8 0 0 26 0 0 11 0 0 70LaneGroupFlow(vph) 126 1470 288 121 518 104 94 556 164 333 1002 44Turn Type Prot pm+ov Prot pm+ov Prot pm÷ov Prot pm+ovProtected Phases 5 2 3 1 6 7 3 8 1 7 4 5Permitted Phases 2 6 8 4Actuated Green,G (s) 7.3 53.5 58.0 4.5 50.7 63.9 4.5 26.8 31.3 13.2 35.5 42.8Effective Green,g (s) 8.8 55.0 61.0 6.0 52.2 66.9 6.0 28.3 34.3 14.7 37.0 45.8Actuated gIC Ratio 0.07 0.46 0.51 0.05 0.44 0.56 0.05 0.24 0.29 0.12 0.31 0.38Clearance Time (s) 5.5 5.5 5.5 5.5 5.5 5.5 5.5 5.5 5.5 5.5 5.5 5.5Vehicle Extension (s) 3.0 3.0 3.0 3.0 3.0 3.0 3.0 3.0 3.0 3.0 3.0 3.0LaneGrpCap(vph) 252 1622 805 172 1539 935 172 835 505 421 1091 604v/sRatioProt cO.04 cO.42 0.02 0.04 0.15 0.01 0.03 cO.16 0.02 0.10 cO.28 0.01v/s Ratio Perm 0.16 0.05 0.09 0.02v/cRatio 0.50 0.91 0.36 0.70 0.34 0.11 0.55 0.67 0.32 0.79 0.92 0.07Uniform Delay, dl 53.5 30.1 17.7 56.1 22.4 12.5 55.7 41.6 33.7 51.2 40.0 23.6Progression Factor 1.00 1.00 1.00 0.89 0.21 0.03 1.00 1.00 1.00 1.00 1.00 1.00Incremental Delay, d2 1.6 8.9 0.3 12.2 0.6 0.1 3.5 4.2 0.4 9.8 13.6 0.1Delay(s) 55.0 39.0 18.0 62.1 5.4 0.5 59.2 45.7 34.1 60.9 53.6 23.6Level of Service E D B E A A E D C E D CApproach Delay (s) 36.8 1 3.5 44.8 52.9Approach LOS D B D D
intersection SummaryHCM Average Control Delay 39.2 HCM Level of Service DHCM Volume to Capacity ratio 0.89Actuated Cycle Length (s) 120.0 Sum of lost time (s) 16.0Intersection Capacity Utilization 83.1% ICU Level of Service EAnalysis Period (mm) 15c Critical Lane Group
Montaño Station 11/12/2009 AM Peak - Build 100 Spaces Synchro 7 - ReportPage 1NKH
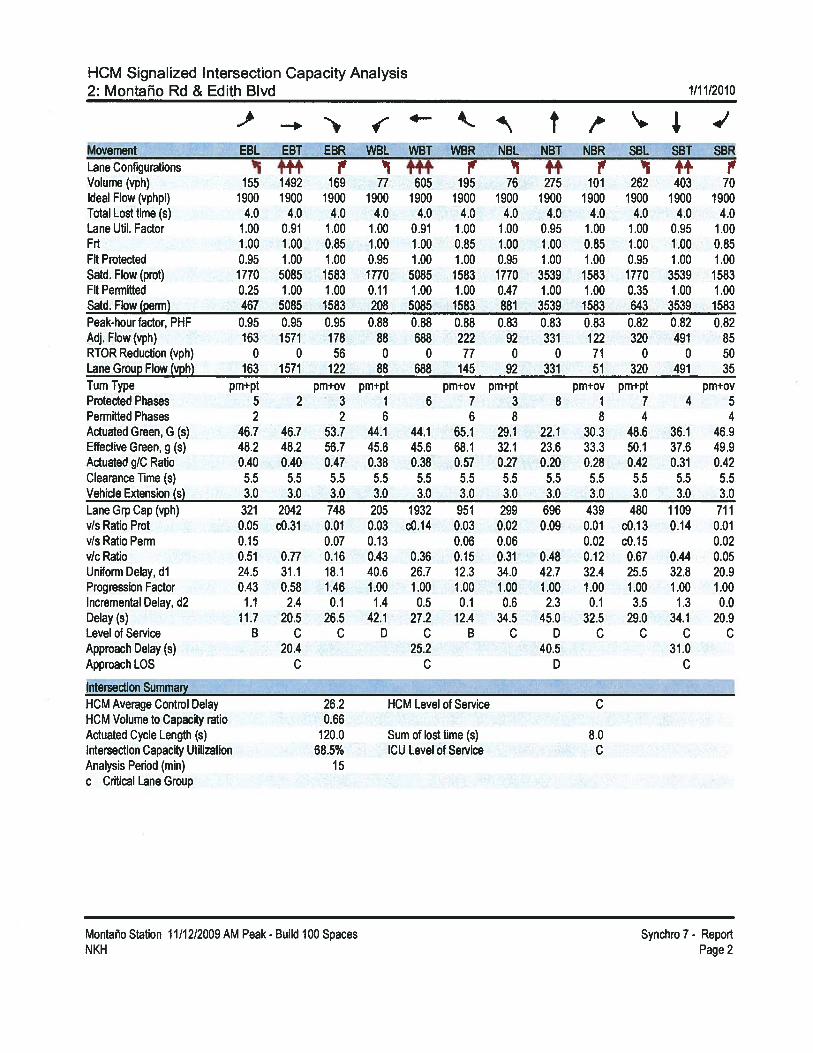
HCM Signalized Intersection Capacity Analysis2: Montaño Rd & Edith Blvd 1/11/2010
Movement EBL EBT EBR WBL WBT WBR NBL NBT NBR SBL SBT SBRLane Configurations “1 +++ +1’ i +1’Volume (vph) 155 1492 169 77 605 195 76 275 101 262 403 70Ideal Flow (vphpl) 1900 1900 1900 1900 1900 1900 1900 1900 1900 1900 1900 1900Total Lost time (s) 4.0 4.0 4.0 4.0 4.0 4.0 4.0 4.0 4.0 4,0 4.0 4.0Lane lJtil. Factor 1.00 0.91 1.00 1.00 0.91 1.00 1.00 0.95 1.00 1.00 0.95 1.00Frt 1.00 1.00 0.85 1.00 1.00 0.85 1.00 1.00 0.85 1.00 1.00 0.85Fit Protected 0.95 1.00 1.00 0.95 1.00 1.00 0.95 1.00 1.00 0.95 1.00 1.00Satd.Flow(prot) 1770 5085 1583 1770 5085 1583 1770 3539 1583 1770 3539 1583FltPermitted 0.25 1.00 1.00 0.11 1.00 1.00 0.47 1.00 1.00 0.35 1.00 1.00Satd. Flow (perm) 467 5085 1583 208 5085 1583 881 3539 1583 643 3539 1583Peak-hourfactor, PHF 0.95 0.95 0.95 0.88 0.88 0.88 0.83 0.83 0.83 0.82 0.82 0.82Adj. Flow (vph) 163 1571 178 88 688 222 92 331 122 320 491 85RTOR Reduction (vph) 0 0 56 0 0 77 0 0 71 0 0 50LaneGroupFlow(vph) 163 1571 122 88 688 145 92 331 51 320 491 35Turn Type pm+pt pm÷ov prn÷pt pm+ov pm÷pt pm+ov pm+pt pm÷ovProtected Phases 5 2 3 1 6 7 3 8 1 7 4 5Permitted Phases 2 2 6 6 8 8 4 4Actuated Green, G (s) 46.7 46.7 53.7 44.1 44.1 65.1 29.1 22.1 30.3 48.6 36.1 46.9Effective Green, g (s) 48.2 48.2 56.7 45.6 45.6 68.1 32.1 23.6 33.3 50.1 37.6 49.9Actuated g/C Ratio 0.40 0.40 0.47 0.38 0.38 0.57 0.27 0.20 0.28 0.42 0.31 0.42Clearance Time (s) 5.5 5.5 5.5 5.5 5.5 5.5 5.5 5.5 5.5 5.5 5.5 5.5Vehicle Extension (s) 3.0 3.0 3.0 3.0 3.0 3.0 3.0 3.0 3.0 3.0 3.0 3.0LaneGrpCap(vph) 321 2042 748 205 1932 951 299 696 439 480 1109 711v/sRatioProt 0.05 cO.31 0.01 0.03 cO.14 0.03 0.02 0.09 0.01 cO.13 0.14 0.01v/sRatioPerm 0.15 0.07 0.13 0.06 0.06 0.02 cO.15 0.02v/c Ratio 0.51 0.77 0.16 0.43 0.36 0.15 0.31 0.48 0.12 0.67 0.44 0.05Uniform Delay, dl 24.5 31.1 18.1 40.6 26.7 12.3 34.0 42.7 32.4 25.5 32.8 20.9Progression Factor 0.43 0.58 1.46 1.00 1.00 1.00 1.00 1.00 1.00 1.00 1,00 1.00Incremental Delay, d2 1.1 2.4 0.1 1.4 0.5 0.1 0.6 2.3 0.1 3.5 1.3 0.0Delay(s) 11.7 20.5 26.5 42.1 27.2 12.4 34.5 45.0 32.5 29.0 34.1 20.9Level of Service B C C D C B C D C C C CApproach Delay (s) 20.4 25.2 40.5 31.0Approach LOS C C D C
Intersection SummaryHCM Average Control Delay 26.2 HCM Level of Service CHCM Volume to Capacity ratio 0.66Actuated Cycle Length (s) 120.0 Sum of lost time (s) 8.0Intersection Capacity Utilization 68.5% ICU Level of Service CAnalysis Period (mm) 15c Critical Lane Group
Montaño Station 11/12/2009 AM Peak - Build 100 SpacesNKH
Synchro 7 - ReportPage 2

HCM Signalized Intersection Capacity Analysis9: Montaño Rd & Site Dwy
—I-. •*_4\ ,
1111/2010
Movement EBT EBR WBL WBT NBL NBRLane Configurations +14’ +1+ ‘i ‘Volume (vph) 1799 10 22 729 3 5ideal Flow (vphpl) 1900 1900 1900 1900 1900 1900Total Lost time (s) 4.0 4.0 4.0 4.0 4.0 4.0Lane Util. Factor 0.91 1.00 1.00 0.91 1.00 1.00Frt 1.00 0.85 1.00 1.00 1.00 0.85Fit Protected 1.00 1.00 0.95 1.00 0.95 1.00Satd. Flow (prot) 5085 1583 1770 5085 1770 1583Fit Permitted 1.00 1.00 0.06 1.00 0.95 1.00Satd. Flow (perm) 5085 1583 103 5085 1770 1583Peak-hour factor, PHF 0.92 0.25 0.25 0.89 0.25 0.25Adj.Fiow(vph) 1955 40 88 819 12 20RTOR Reduction (vph) 0 17 0 0 0 14LaneGroupFlow(vph) 1955 23 88 819 12 6Turn Type Perm pm+pt PermProtected Phases 4 3 8 2Permitted Phases 4 8 2Actuated Green, G (s) 66.8 66.8 77.3 77.3 31.7 31.7Effective Green, g (s) 68.3 68.3 78.8 78.8 33.2 33.2Actuated g/C Ratio 0.57 0.57 0.66 0.66 0.28 0.28Clearance Time (s) 5.5 5.5 5.5 5.5 5.5 5.5Vehicle Extension (s) 3.0 3.0 3.0 3.0 3.0 3.0LaneGrpCap(vph) 2894 901 158 3339 490 438vfsRatioProt cO.38 cO.03 0.16 cOOlv/s Ratio Pem, 0.01 0.34 0.00v/c Ratio 0.68 0.03 0.56 0.25 0.02 0.01UniformDelay,dl 18.1 11.3 16.3 8.4 31.6 31.5Progression Factor 0.44 0.14 0.35 0.78 1.00 1.00Incremental Delay, d2 0.3 0.0 4.1 0.0 0.1 0.1Delay (s) 8.4 1.6 9.8 6.6 31.7 31.6Level of Service A A A A C CApproach Delay (s) 8.2 7.0 31.6Approach LOS A A C
Intersection SummaryHCM Average Control Delay 8.1 HCM Level of Service AHCM Volume to Capacity ratio 0.47Actuated Cycle Length (s) 120.0 Sum of lost time (s) 12.0Intersection Capacity Utilization 44.8% ICU Level of Service AAnalysis Period (mm) 15c Critical Lane Group
Montaño Station 11/12/2009 AM Peak - Build 100 Spaces Synchro 7 - ReportNKH Page 3

HCM Signalized Intersection Capacity Analysis1: Montaño Rd & 2nd St 1/11/2010
1--k4\ t,’dMovement EBL EBT EBR WBL WBT WBR NBL NBT NBR SBL SBT SBRLane Configurations j •4i. jiv
Volume (vph) 100 647 142 159 1225 325 298 987 167 108 574 173Ideal Flow (vphpl) 1900 1900 1900 1900 1900 1900 1900 1900 1900 1900 1900 1900Total Lost time (s) 4.0 4,0 4.0 4.0 4.0 4.0 4.0 4.0 4.0 4.0 4.0 4.0Lane Util. Factor 0.97 0.95 1.00 0.97 0.95 1.00 0.97 0.95 1.00 0.97 0.95 1.00Frt 1.00 1.00 0.85 1.00 1.00 0.85 1.00 1.00 0.85 1.00 1.00 0.85FIt Protected 0.95 1.00 1.00 0.95 1.00 1.00 0.95 1.00 1.00 0.95 1.00 1.00Satd.Flow(prot) 3433 3539 1583 3433 3539 1583 3433 3539 1583 3433 3539 1583FIt Permitted 0.95 1.00 1.00 0.95 1.00 1.00 0.95 1.00 1.00 0.95 1.00 1.00Satd. Flow (perm) 3433 3539 1583 3433 3539 1583 3433 3539 1583 3433 3539 1583Peak-hourfactor, PHF 0.92 0.92 0.92 0.95 0.95 0.95 0.93 0.93 0.93 0.93 0.93 0.93Adj. Flow (vph) 109 703 154 167 1289 342 320 1061 180 116 617 186RTOR Reduction (vph) 0 0 27 0 0 11 0 0 52 0 0 18LaneGroupFlow(vph) 109 703 127 167 1289 331 320 1061 128 116 617 168Turn Type Prot pm+ov Prot pm+ov Prot pm+ov Prot pm+ovProtected Phases 5 2 3 1 6 7 3 8 1 7 4 5Permitted Phases 2 6 8 4Actuated Green, G (s) 4.6 42.5 57.6 9.4 47.3 54.3 15.1 39.1 48.5 7.0 31.0 35.6Effective Green,g (s) 6.1 44.0 60.6 10.9 48.8 57.3 16.6 40.6 51.5 8.5 32.5 38.6Actuated g/C Ratio 0.05 0.37 0.51 0.09 0.41 0.48 0.14 0.34 0.43 0.07 0.27 0.32Clearance Time (s) 5.5 5.5 5.5 5.5 5.5 5.5 5.5 5.5 5.5 5.5 5.5 5.5Vehicle Extension (s) 3.0 3.0 3.0 3.0 3.0 3.0 3.0 3.0 3.0 3.0 3.0 3.0LaneGrpCap(vph) 175 1298 799 312 1439 809 475 1197 732 243 958 509v/s Ratio Prot 0.03 0.20 0.02 cOOS cO.36 0.03 0.09 cO.30 0.02 0.03 cO.17 0.02v/s Ratio Perm 0.06 0.18 0.06 0.09v/c Ratio 0.62 0.54 0.16 0.54 0.90 0.41 0.67 0.89 0.17 0.48 0.64 0.33Uniform Delay, dl 55.8 30.0 16.0 52.1 33.2 20.4 49.1 37.5 21.1 53.6 38.6 30.9Progression Factor 1.00 1.00 1.00 0.76 0.41 0.14 1.00 1.00 1.00 1.00 1.00 1.00lncrementalDelay,d2 6.7 1.6 0.1 1.6 8.4 0.3 3.8 9.8 0.1 1.5 3.3 0.4Delay(s) 62.6 31.7 16.1 41.2 21.9 3.1 52.9 47.4 21.3 55.1 42.0 31.3Levelof Service E C B D C A D D C E D CApproach Delay (s) 32.7 20.2 45.5 41.5Approach LOS C C D D
Intersection SummaryHCM Average Control Delay 33.7 HCM Level of Service CHCM Volume to Capacity ratio 0.82Actuated Cycle Length (s) 120.0 Sum of lost time (s) 8.0Intersection Capacity Utilization 81.1% ICU Level of Service DAnalysis Period (mm) 15c Critical Lane Group
Montaño Station 11/12/2009 PM Peak - Build 100 Spaces Synchro 7 - ReportNKH Page 1

HCM Signalized Intersection Capacity Analysis2: Montaño Rd & Edith Blvd 1/11/2010
ç-k4\
Movement EBL EBT EBR WBL WBT WBR NBL NBT NBR SBL SBT SBRLane Configurations j ff+ ‘ ff1’ ?‘ ‘ ++ lv +4’ lvVolume (vph) 128 911 67 99 1366 175 212 618 118 176 299 135Ideal Flow (vphpl) 1900 1900 1900 1900 1900 1900 1900 1900 1900 1900 1900 1900TotalLosttime(s) 4.0 4.0 4.0 4.0 4.0 4.0 4.0 4.0 4.0 4.0 4.0 4.0Lane Util. Factor 1.00 0.91 1.00 1.00 0.91 1.00 1.00 0.95 1.00 1.00 0.95 1.00Frt 1.00 1.00 0.85 1.00 1.00 0.85 1.00 1.00 0.85 1.00 1.00 0.85Fit Protected 0.95 1.00 1.00 0.95 1.00 1.00 0.95 1.00 1.00 0.95 1.00 1.00Satd. Flow (prot) 1770 5085 1583 1770 5085 1583 1770 3539 1583 1770 3539 1583Fit Permitted 0.11 1.00 1.00 0.27 1.00 1.00 0.45 1.00 1.00 0.18 1.00 1.00Satd. Flow (perm) 212 5085 1583 505 5085 1583 847 3539 1583 327 3539 1583Peak-hour factor, PHF 0.90 0.90 0.90 0.95 0.95 0.95 0.89 0.89 0.89 0.88 0.88 0.88Adj. Flow (vph) 142 1012 74 104 1438 184 238 694 133 200 340 153RTOR Reduction (vph) 0 0 36 0 0 53 0 0 43 0 0 59Lane Group Flow (vph) 142 1012 38 104 1438 131 238 694 90 200 340 94Turn Type pm+pt pm÷ov pm+pt pm÷ov pm+pt pm÷ov pm÷pt pm÷ovProtected Phases 5 2 3 1 6 7 3 8 1 7 4 5Permitted Phases 2 2 6 6 8 8 4 4Actuated Green, G (s) 45.6 45.6 59.0 42,5 42.5 55.9 45.0 31.6 39.0 45.0 31.6 42.1Effective Green, g (s) 47.1 47.1 62.0 44.0 44.0 58.9 48.0 33.1 42.0 48.0 33.1 45.1Actuated g/C Ratio 0.39 0.39 0.52 0.37 0.37 0.49 0.40 0.28 0.35 0.40 0.28 0.38Clearance Time (s) 5.5 5.5 5.5 5.5 5.5 5,5 5.5 5.5 5.5 5.5 5.5 5.5Vehicle Extension (s) 3.0 3.0 3.0 3.0 3.0 3.0 3.0 3.0 3.0 3.0 3.0 3.0LaneGrpCap(vph) 239 1996 818 279 1865 830 453 976 554 310 976 648v/s Ratio Prot cO,06 0.20 0.01 0.03 cO.28 0.02 0.07 cO.20 0.01 cO.08 0.10 0.01v/sRatioPerm 0.17 0.02 0.11 0.06 0.14 0.04 0.18 0.05v/c Ratio 0.59 0.51 0.05 0.37 0.77 0.16 0.53 0.71 0.16 0.65 0.35 0.15Uniform Delay, dl 28.4 27.6 14.4 30.3 33.6 16.9 25.1 39.1 26.9 26.2 34.8 24.7Progression Factor 0.75 0.93 3.01 1.00 1.00 1.00 1.00 1.00 1.00 1.00 1.00 1.00Incremental Delay, d2 3.9 0.9 0.0 0.8 3.2 0.1 1.1 4.4 0.1 4.6 1.0 0.1Delay(s) 25.3 26.5 43.3 31.2 36.7 16.9 26.2 43.5 27.0 30.8 35.8 24.8LevelofService C C D C D B C D C C D CApproach Delay (s) 27.4 34.3 37.6 31.9Approach LOS C C D C
intersection SummaryHCM Average Control Delay 32.9 HCM Level of Service CHCM Volume to Capacity ratio 0.71Actuated Cycle Length (s) 120.0 Sum of lost time (s) 16.0Intersection Capacity Utilization 73.7% ICU Level of Service DAnalysis Period (mm) 15c Critical Lane Group
Montaño Station 11/12/2009 PM Peak - Build 100 Spaces Synchro 7- ReportPage 2NKH

HCM Signalized Intersection Capacity Analysis9: Montaño Rd & Site Dwy 1/11/2010
j+4\ /Movement EBT EBR WBL WBT NBL NBR:;Lane Configurations ff4’ ‘ ff4’ iVolume (vph) 918 4 9 1704 14 30Ideal Flow(vphpl) 1900 1900 1900 1900 1900 1900Total Lost time (s) 4.0 4.0 4,0 4.0 4.0 4.0Lane Util. Factor 0.91 1.00 1.00 0.91 1.00 1.00Frt 1.00 0.85 1.00 1.00 1.00 0.85FltProtected 1.00 1.00 0.95 1.00 0.95 1.00Satd. Flow (prot) 5085 1583 1770 5085 1770 1583Fit Permitted 1.00 1.00 0.21 1.00 0.95 1.00Satd. Flow (perm) 5085 1583 382 5085 1770 1583Peak-hour factor, PHF 0.92 0.25 0.25 0.95 0.25 0.25Adj. Flow (vph) 998 16 36 1794 56 120RTOR Reduction (vph) 0 8 0 0 0 76Lane Group Flow (vph) 998 8 36 1794 56 44Turn Type Perm pm+pt PermProtected Phases 4 3 8 2Permitted Phases 4 8 2Actuated Green, G (s) 56.7 56.7 66.4 66.4 42.6 42.6Effective Green, g (s) 58.2 58.2 67.9 67.9 44.1 44.1Actuated g/C Ratio 0.49 0.49 0.57 0.57 0.37 0.37Clearance Time (s) 5.5 5.5 5.5 5.5 5.5 5.5Vehicle Extension (s) 3.0 3.0 3.0 3.0 3.0 3.0LaneGrpCap(vph) 2466 768 282 2877 650 582v/s Ratio Prot 0.20 0.01 cO.35 cO.03v/s Ratio Perm 0.00 0.07 0.03v/c Ratio 0.40 0.01 0.13 0.62 0.09 0.08Uniform Delay, dl 19.8 16.0 12.7 17.5 24.8 24.7Progression Factor 0.63 0.26 0.23 0.27 1.00 1.00Incremental Delay, d2 0.1 0.0 0.1 0.3 0.3 0.3Delay (s) 12.5 4.1 3.0 5.0 25.0 24.9Level of Service B A A A C CApproach Delay (s) 12.4 5.0 25.0Approach LOS B A C
Intersection SummaryHCM Average Control Delay 8.6 HCM Level of Service AHCM Volume to Capacity ratio 0.41Actuated Cycle Length (s) 120.0 Sum of lost time (s) 8.0Intersection Capacity Utilization 42.9% ICU Level of Service AAnalysis Period (mm) 15c Critical Lane Group
Montaño Station 11/12/2009 PM Peak - Build 100 Spaces Synchro7- ReportNKH Page 3

HCM Unsignalized Intersection Capacity Analysis9: Montaño Rd & Site Dwy 1/1 1/2010
Movement EBT EBR WBL WBT NBL NBRLane Configurations “I +14 ‘ ?Volume (veh/h) 1799 10 22 729 3 5Sign Control Free Free StopGrade 0% 0% 0%Peak Hour Factor 0.92 0.25 0.25 0.89 0.25 0.25Hourly flow rate (vph) 1955 40 88 819 12 20PedestriansLane Width (if)Walking Speed (ft/s)Percent BlockageRight turn flare (veh)Median type None NoneMedian storage veh)Upstream signal (ft) 1050pX, platoon unblocked 0.71 0.71 0.71vC, conflicting volume 1995 2404 652vCl, stage 1 conf volvC2, stage 2 conf volvCu, unblocked vol 966 1543 0tC,single(s) 4.1 6.8 6.9tC, 2 stage (s)tF(s) 2.2 3.5 3.3p0 queue free% 82 81 97cM capacity (veh/h) 502 62 769
Direction, Lane # EB 1 EB 2 EB 3 EB 4 WB 1 WB 2 WB 3 WB 4 NB I NB 2Volume Total 652 652 652 40 88 273 273 273 12 20Volume Left 0 0 0 0 88 0 0 0 12 0Volume Right 0 0 0 40 0 0 0 0 0 20cSH 1700 1700 1700 1700 502 1700 1700 1700 62 769Volume to Capacity 0.38 0.38 0.38 0.02 0.18 0.16 0.16 0.16 0.19 0.03Queue Length 95th (ft) 0 0 0 0 16 0 0 0 16 2Control Delay (s) 0.0 0.0 0.0 0.0 13.7 0.0 0.0 0.0 76.9 9.8LaneLOS B F AApproach Delay (s) 0.0 1.3 35.0Approach LOS D
Intersection SummaryAverage Delay 0.8Intersection Capacity Utilization 44.8% CU Level of Service AAnalysis Period (mm) 15
Montaño Station 11/12/2009 AM Peak - Build 100 Spaces Synchro 7 ReportNKH Page 1
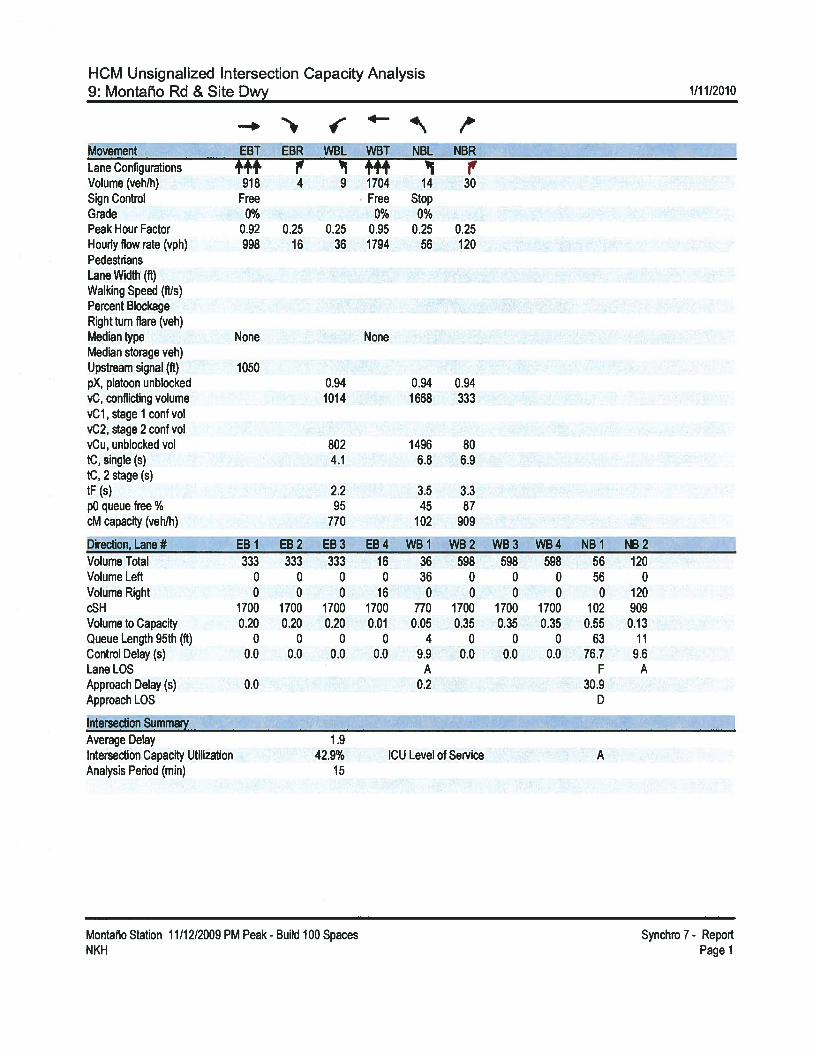
HCM Unsignalized Intersection Capacity Analysis9: Montaño Rd & Sfte Dwy 1/1 1/2010
ç4_ ,,
Movement EBT EBR WBL WBT NBL NBRLane Configurations ++$‘ ‘ “ •4’ ‘ j’Volume (vehlh) 918 4 9 1704 14 30Sign Control Free Free StopGrade 0% 0% 0%Peak Hour Factor 0.92 0.25 0.25 0.95 0.25 0.25Houyflowrate(vph) 998 16 36 1794 56 120PedestnansLane Width (ft)Walking Speed (ft/s)Percent BlockageRight turn flare (veh)Median type None NoneMedian storage veh)Upstream signal (ft) 1050pX, platoon unblocked 0.94 0.94 0.94vC, conflicting volume 1014 1668 333vCl, stage 1 conf volvC2, stage 2 conf volvCu, unblocked vol 802 1496 80tC, single (s) 4.1 6.8 6.9tC, 2 stage (s)tF(s) 2.2 3.5 3.3p0 queue free% 95 45 87cM capacity (veh/h) 770 102 909
Direction, Lane # EB 1 EB 2 EB 3 EB 4 WB I WB 2 WB 3 WB 4 NB 1 NB 2Volume Total 333 333 333 16 36 598 598 598 56 120Volume Left 0 0 0 0 36 0 0 0 56 0VolumeRight 0 0 0 16 0 0 0 0 0 120cSH 1700 1700 1700 1700 770 1700 1700 1700 102 909Volume to Capacity 0.20 0.20 0.20 0.01 0.05 0.35 0.35 0.35 0.55 0.13Queue Length 95th (ft) 0 0 0 0 4 0 0 0 63 11Control Delay (s) 0.0 0.0 0.0 0.0 9.9 0.0 0.0 0.0 76.7 9.6LaneLOS A F AApproach Delay (s) 0.0 0.2 30.9Approach LOS D
Intersection SummaryAverage Delay 1 .9Intersection Capacity Utilization 42,9% ICU Level of Service AAnalysis Period (mm) 15
Montaño Station 11/12/2009 PM Peak - Build 100 Spaces Synchro 7- ReportNKH Page 1
Appendix F
Alternative 2 Level of Service Analyses
Level of Service Analysis PagesAlternative 2 AM - Signalized 3Alternative 2 PM - Signalized 3Alternative 2 AM - Unsignalized 1Alternative 2 PM - Unsignalized 1

HCM Signalized Intersection Capacity Analysis1: Montaño Rd &2nd St 1/11/2010
_fk4\
Movement EBL EBT EBR WBL WBT WBR NBL NBT NBR SBL SBT SBRLane Configurations j f 1 ++ +4’ V
Volume (vph) 116 1372 272 108 466 116 79 467 148 311 932 106ideal Flow (vphpl) 1900 1900 1900 1900 1900 1900 1900 1900 1900 1900 1900 1900Total Lost time (s) 4.0 4.0 4.0 4.0 4.0 4.0 4.0 4.0 4.0 4.0 4.0 4.0Lane Util. Factor 0.97 0.95 1.00 0.97 0.95 1.00 0.97 0.95 1.00 0.97 0.95 1.00Frt 1.00 1.00 0.85 1.00 1.00 0.85 1.00 1.00 0.85 1.00 1.00 0.85Fit Protected 0.95 1.00 1.00 0.95 1.00 1.00 0.95 1.00 1.00 0.95 1.00 1.00Satd. Flow (prot) 3433 3539 1583 3433 3539 1583 3433 3539 1583 3433 3539 1583Fit Permitted 0.95 1.00 1.00 0,95 1.00 1.00 0.95 1.00 1.00 0.95 1.00 1.00Satd. Flow (perm) 3433 3539 1583 3433 3539 1583 3433 3539 1583 3433 3539 1583Peak-hour factor, PHF 0.92 0,92 0.92 0.89 0.89 0.89 0.84 0.84 0.84 0.93 0.93 0.93Ad]. Flow(vph) 126 1491 296 121 524 130 94 556 176 334 1002 114RTOR Reduction (vph) 0 0 8 0 0 26 0 0 11 0 0 70LaneGroupFlow(vph) 126 1491 288 121 524 104 94 556 165 334 1002 44Turn Type Prot pm+ov Prot pm÷ov Prot pmi-ov Prot pm+ovProtected Phases 5 2 3 1 6 7 3 8 1 7 4 5Permitted Phases 2 6 8 4Actuated Green, G (s) 7.3 53.5 58.0 4.5 50.7 63.9 4.5 26.8 31.3 13.2 35.5 42.8Effective Green, g (s) 8.8 55.0 61.0 6.0 52.2 66.9 6.0 28.3 34.3 14.7 37.0 45.8Actuated g/C Ratio 0.07 0.46 0.51 0.05 0.44 0.56 0.05 0.24 0.29 0.12 0.31 0.38Clearance Time (s) 5.5 5.5 5.5 5.5 5.5 5.5 5.5 5.5 5.5 5.5 5.5 5.5Vehicle Extension (s) 3.0 3.0 3.0 3.0 3.0 3.0 3.0 3.0 3.0 3.0 3.0 3.0LaneGrpCap(vph) 252 1622 805 172 1539 935 172 835 505 421 1091 604v/sRatioProt cO.04 cO.42 0.02 0.04 0.15 0.01 0.03 cO.16 0.02 0.10 cO.28 0.01v/s Ratio Perm 0.16 0.05 0.09 0.02v/cRatio 0.50 0.92 0.36 0.70 0.34 0.11 0.55 0.67 0.33 0.79 0.92 0.07Uniform Delay, dl 53.5 30.4 17.7 56.1 22.5 12.5 55.7 41.6 33.7 51.2 40.0 23.6Progression Factor 1.00 1.00 1.00 0.90 0.30 0.07 1.00 1.00 1.00 1.00 1.00 1.00Incremental Delay, d2 1.6 9.9 0.3 12.2 0.6 0.1 3.5 4.2 0.4 9.9 13.6 0.1Delay(s) 55.0 40.3 18.0 63.0 7.4 1.0 59.2 45.7 34.1 61.1 53.6 23.6Level of Service E D B E A A E D C E D CApproach Delay (s) 37.9 15.0 44.8 53.0Approach LOS D B D D
Intersection SummaryHCM Average Control Delay 39.9 HCM Level of Service DHCM Volume to Capacity ratio 0.89Actuated Cycle Length (s) 120.0 Sum of lost time (s) 16.0Intersection Capacity Utilization 83.7% ICU Level of Service EAnalysis Period (mm) 15c Critical Lane Group
Montaño Station 11/12/2009 AM Peak - Build 200 Spaces Synchro 7- ReportNKH Page 1
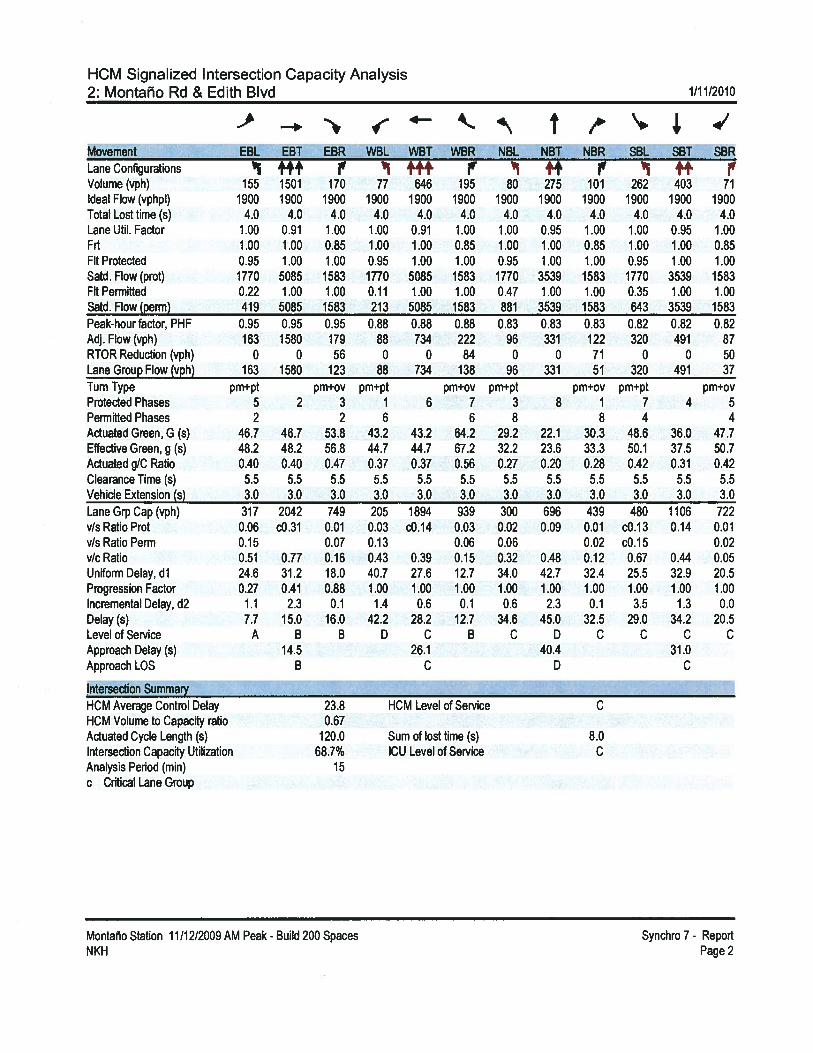
HCM Signalized Intersection Capacity Analysis2: Montaño Rd & Edith Blvd 1/1 1/2010
-k4\
Movement EBL EBT EBR WBL WBT WBR NBL NBT NBR SBL SBT SBRLane Configurations j “1 fM’ i’ ‘ ++ i M’Volume (vph) 155 1501 170 77 646 195 80 275 101 262 403 71Ideal Flow (vphpl) 1900 1900 1900 1900 1900 1900 1900 1900 1900 1900 1900 1900Total Lost time (s) 4.0 4.0 4.0 4.0 4.0 4.0 4.0 4.0 4.0 4.0 4.0 4.0Lane Util. Factor 1.00 0.91 1.00 1.00 0.91 1.00 1.00 0.95 1.00 1.00 0.95 1.00Frt 1.00 1.00 0.85 1.00 1.00 0.85 1.00 1.00 0.85 1.00 1.00 0.85FltProtected 0.95 1.00 1.00 0.95 1.00 1.00 0.95 1.00 1.00 0.95 1.00 1.00Satd.Flow(prot) 1770 5085 1583 1770 5085 1583 1770 3539 1583 1770 3539 1583FltPermitted 0.22 1.00 1.00 0.11 1.00 1.00 0.47 1.00 1.00 0.35 1.00 1.00Satd.Flow(perm) 419 5085 1583 213 5085 1583 881 3539 1583 643 3539 1583Peak-hourfactor, PHF 0.95 0.95 0.95 0.88 0.88 0.88 0.83 0.83 0.83 0.82 0.82 0.82Adj. Flow (vph) 163 1580 179 88 734 222 96 331 122 320 491 87RTOR Reduction (vph) 0 0 56 0 0 84 0 0 71 0 0 50Lane Group Flow (vph) 163 1580 123 88 734 138 96 331 51 320 491 37Turn Type pmi-pt pm÷ov pm+pt pm+ov pm÷pt pm+ov pm+pt pm÷ovProtected Phases 5 2 3 1 6 7 3 8 1 7 4 5Permitted Phases 2 2 6 6 8 8 4 4Actuated Green, G (s) 46.7 46.7 53.8 43.2 43.2 64.2 29.2 22.1 30.3 48.6 36.0 47.7Effective Green, g (s) 48.2 48.2 56.8 44.7 44.7 67.2 32.2 23.6 33.3 50.1 37.5 50.7Actuated g/C Ratio 0.40 0.40 0.47 0.37 0.37 0.56 0.27 0.20 0.28 0.42 0.31 0.42Clearance Time (s) 5.5 5.5 5.5 5.5 5.5 5.5 5.5 5.5 5.5 5.5 5.5 5.5Vehicle Extension (s) 3.0 3.0 3.0 3.0 3.0 3.0 3.0 3.0 3.0 3.0 3.0 3.0LaneGrpCap(vph) 317 2042 749 205 1894 939 300 696 439 480 1106 722v/s Ratio Prot 0.06 cO.31 0.01 0.03 cO.14 0.03 0.02 0.09 0.01 cO.13 0.14 0.01v/sRatioPerm 0.15 0.07 0.13 0.06 0.06 0.02 cO.15 0.02v/c Ratio 0.51 0.77 0.16 0.43 0,39 0.15 0.32 0.48 0.12 0.67 0.44 0.05Uniform Delay, dl 24.6 31.2 18.0 40.7 27.6 12.7 34.0 42.7 32.4 25.5 32.9 20.5Progression Factor 0.27 0.41 0.88 1.00 1.00 1.00 1.00 1.00 1.00 1.00 1.00 1.00lncrementalDelay,d2 1.1 2.3 0.1 1.4 0.6 0.1 0.6 2.3 0.1 3.5 1.3 0.0Delay(s) 7.7 15.0 16.0 42.2 28.2 12.7 34.6 45.0 32.5 29.0 34.2 20.5LevelofService A B B D C B C D C C C CApproachDelay(s) 14.5 26.1 40.4 31.0Approach LOS B C D C
Intersection SummaryHCM Average Control Delay 23.8 HCM Level of Service CHCM Volume to Capacity ratio 0.67Actuated Cycle Length (s) 120.0 Sum of lost time (s) 8.0Intersection Capacity Utilization 68.7% ICU Level of Service CAnalysis Period (mm) 15c Critical Lane Group
Montaño Station 11/12/2009 AM Peak - Build 200 Spaces Synchro 7 - ReportNKH Page 2
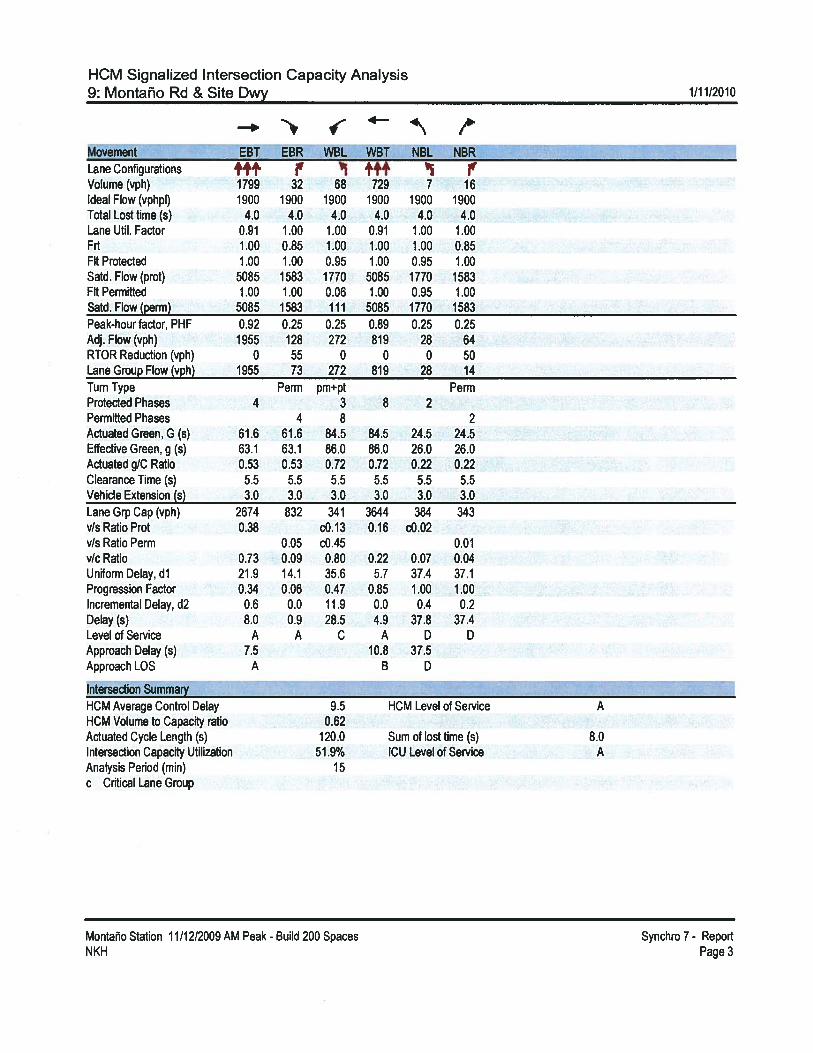
HCM Signalized Intersection Capacity Analysis
9: Montaño Rd & Site Dwy 1/1 1/2010
j4_4\ ,
Movement EBT EBR WBL WBT NBL NBRLane ConfigurationsVolume (vph) 1799 32 68 729 7 16Ideal Flow (vphpl) 1900 1900 1900 1900 1900 1900Total Lost time (s) 4.0 4.0 4.0 4.0 4.0 4.0Lane Util. Factor 0.91 1.00 1.00 0.91 1.00 1.00Frt 1.00 0.85 1.00 1.00 1.00 0.85Fit Protected 1.00 1.00 0.95 1.00 0.95 1.00Satd. Flow (prot) 5085 1583 1770 5085 1770 1583Fft Permitted 1.00 1.00 0.06 100 0.95 1.00Satd. Flow (perm) 5085 1583 111 5085 1770 1583Peak-hour factor, PHF 0.92 0.25 0.25 0.89 0.25 0.25Adj. Flow (vph) 1955 128 272 819 28 64RTOR Reduction (vph) 0 55 0 0 0 50Lane Group Flow (vph) 1955 73 272 819 28 14Turn Type Perm pm÷pt PermProtected Phases 4 3 8 2Permitted Phases 4 8 2Actuated Green,G (s) 61.6 61.6 84.5 84.5 24.5 24.5Effective Green, g (s) 63.1 63.1 86.0 86.0 26.0 26.0Actuated g/C Ratio 0.53 0.53 0.72 0.72 0.22 0.22Clearance Time (s) 5.5 5.5 5.5 5.5 5.5 5.5Vehicle Extension (s) 3.0 3.0 3,0 3.0 3.0 3.0Lane Grp Cap (vph) 2674 832 341 3644 384 343v/s Ratio Prot 0.38 cO.13 0.16 cO.02v/s Ratio Perm 0.05 cO.45 0.01v/c Ratio 0.73 0.09 0.80 0.22 0.07 0.04Uniform Delay, dl 21.9 14.1 35.6 5.7 37.4 37.1Progression Factor 0.34 0.06 0.47 0.85 1.00 1.00Incremental Delay, d2 0.6 0.0 11.9 0.0 0.4 0.2Delay (s) 8.0 0.9 28.5 4.9 37.8 37.4Level of Service A A C A D DApproach Delay (s) 7.5 10.8 37.5Approach LOS A B D
intersection SummaryHCM Average Control Delay 9.5 HCM Level of Service AHCM Volume to Capacity ratio 0.62Actuated Cycle Length (s) 120.0 Sum of lost time (s) 8.0Intersection Capacity Utilization 51.9% ICU Level of Service AAnalysis Period (mm) 15c Ctical Lane Group
Montaño Station 11/12/2009 AM Peak - Build 200 Spaces Synchro 7- ReportNKH Page3
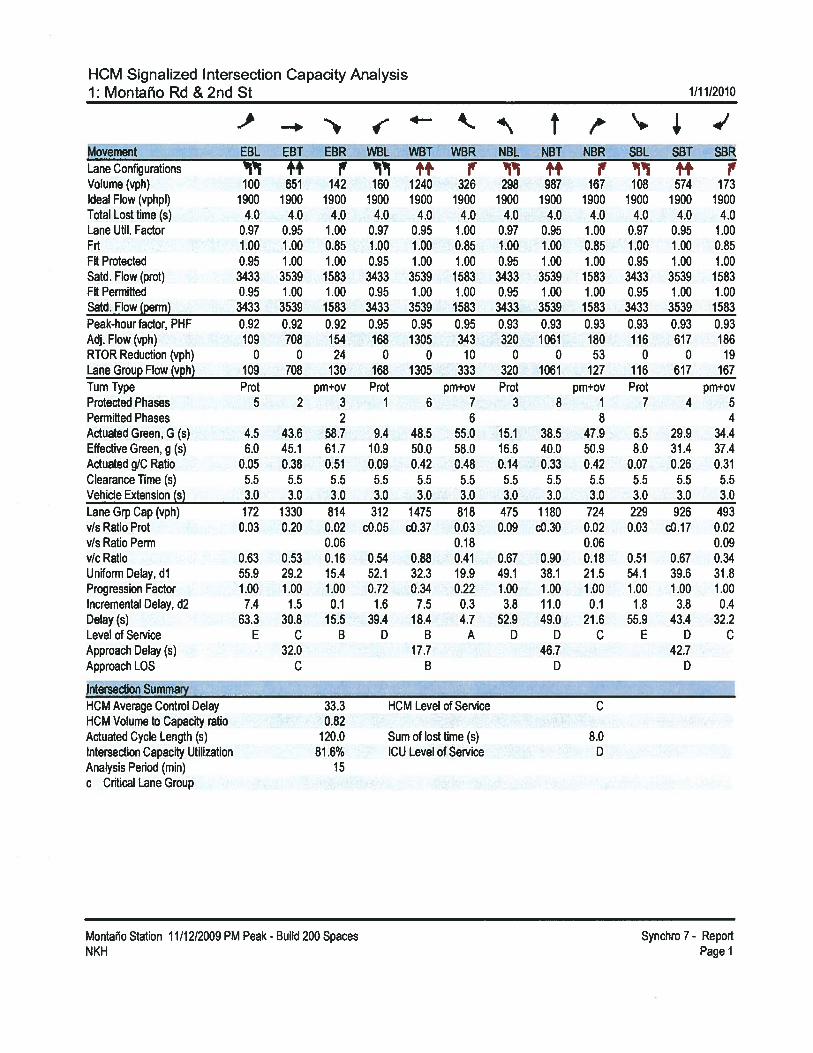
HCM Signalized Intersection Capacity Analysis1: Montaño Rd & 2nd St 1/11/2010
_1--k4\
Movement EBL EBT EBR WBL WBT WBR NBL NBT NBR SBL SBT SBRLane Configurations i ++ ? ‘i ++ ++ r i ++ v
Volume (vph) 100 651 142 160 1240 326 298 987 167 108 574 173ideal Flow (vphpl) 1900 1900 1900 1900 1900 1900 1900 1900 1900 1900 1900 1900TotalLosttime(s) 4.0 4.0 4.0 4.0 4.0 4.0 4.0 4.0 4.0 4.0 4.0 4.0Lane Util. Factor 0.97 0.95 1.00 0.97 0,95 1.00 0.97 0.95 1.00 0.97 0.95 1.00Frt 1.00 1.00 0.85 1.00 1.00 0.85 1.00 1.00 0.85 1.00 1.00 0.85Fit Protected 0.95 1.00 1.00 0.95 1.00 1.00 0.95 1.00 1.00 0.95 1.00 1.00Satd. Flow (prot) 3433 3539 1583 3433 3539 1583 3433 3539 1583 3433 3539 1583FIt Permitted 0.95 1.00 1.00 0.95 1.00 1.00 0.95 1.00 1.00 0.95 1.00 1.00Satd. Flow (perm) 3433 3539 1583 3433 3539 1583 3433 3539 1583 3433 3539 1583Peak-hour factor, PHF 0.92 0.92 0.92 0.95 0.95 0.95 0.93 0.93 0.93 0.93 0.93 0.93Adj.Flow(vph) 109 708 154 168 1305 343 320 1061 180 116 617 186RTOR Reduction (vph) 0 0 24 0 0 10 0 0 53 0 0 19Lane Group Flow (vph) 109 708 130 168 1305 333 320 1061 127 116 617 167Turn Type Prot pm+ov Prot pm+ov Prot pm+ov Prot pm+ovProtected Phases 5 2 3 1 6 7 3 8 1 7 4 5Permitted Phases 2 6 8 4Actuated Green, G (s) 4.5 43.6 58.7 9.4 48.5 55.0 15.1 38.5 47.9 6.5 29.9 34.4Effective Green, g (s) 5.0 45.1 61.7 10.9 50.0 58.0 16.6 40.0 50.9 8.0 31.4 37.4Actuated g/C Ratio 0.05 0.38 0.51 0.09 0.42 0.48 0.14 0.33 0.42 0.07 0.26 0.31Clearance Time (s) 5.5 5.5 5.5 5.5 5.5 5.5 5.5 5.5 5.5 5.5 5.5 5.5Vehicle Extension (s) 3.0 3.0 3.0 3.0 3.0 3.0 3.0 3.0 3.0 3.0 3.0 3.0Lane Grp Cap (vph) 172 1330 814 312 1475 818 475 1180 724 229 926 493v/s Ratio Prot 0.03 0.20 0.02 cO.05 cO.37 0.03 0.09 cO.30 0.02 0.03 cO.17 0.02v/s Ratio Pemi 0.06 0.18 0.06 0.09v/c Ratio 0.63 0.53 0.16 0.54 0.88 0.41 0.67 0.90 0.18 0.51 0.67 0.34Uniform Delay, dl 55.9 29.2 15.4 52.1 32.3 19.9 49.1 38.1 21.5 54.1 39.6 31.8Progression Factor 1.00 1.00 1.00 0.72 0.34 0.22 1.00 1.00 1.00 1.00 1.00 1.00lncrementalDelay,d2 7.4 1.5 0.1 1.6 7.5 0.3 3.8 11.0 0.1 1.8 3.8 0.4Delay(s) 63.3 30.8 15.5 39.4 18.4 4.7 52.9 49.0 21.6 55.9 43.4 32.2LevelofService E C B D B A D D C E D CApproach Delay (s) 32.0 17.7 46.7 42.7Approach LOS C B D D
Intersection SummaryHCM Average Control Delay 33.3 HCM Level of Service CHCM Volume to Capacity ratio 0.82Actuated Cycle Length (s) 120.0 Sum of lost time (s) 8.0Intersection Capacity Utilization 81.6% ICU Level of Service DAnalysis Period (mm) 15c Critical Lane Group
Montaño Station 11/12/2009 PM Peak - Build 200 SpacesNKH
Synchro7- ReportPage 1

HCM Signalized Intersection Capacity Analysis2: Montaño Rd & Edith Blvd 1/1 1/2010
f%çl_4\
Movement EBL EBT EBR WBL WBT WBR NBL NBT NBR SBL SBT SBRLane Configurations j “I ++t ‘ ++ i lvVolume (vph) 128 940 70 99 1375 175 213 618 118 176 299 135Ideal Flow (vphpi) 1900 1900 1900 1900 1900 1900 1900 1900 1900 1900 1900 1900Total Lost time (s) 4.0 4.0 4.0 4.0 4.0 4.0 4.0 4.0 4.0 4.0 4.0 4.0LaneUtil.Factor 1.00 0.91 1.00 1.00 0.91 1.00 1.00 0.95 1.00 1.00 0.95 1.00Frt 1.00 1.00 0.85 1.00 1.00 0.85 1.00 1.00 0.85 1.00 1.00 0.85Fit Protected 0.95 1.00 1.00 0.95 1.00 1.00 0.95 1.00 1.00 0.95 1.00 1.00Satd. Flow (prot) 1770 5085 1583 1770 5085 1583 1770 3539 1583 1770 3539 1583Fit Permitted 0.11 1.00 1.00 0.26 1.00 1.00 0.45 1.00 1.00 0.18 1.00 1.00Satd. Flow (perm) 212 5085 1583 488 5085 1583 844 3539 1583 328 3539 1583Peak-hour factor, PHF 0.90 0.90 0.90 0.95 0.95 0.95 0.89 0.89 0.89 0.88 0.88 0.88Adj. Flow (vph) 142 1044 78 104 1447 184 239 694 133 200 340 153RTOR Reduction (vph) 0 0 37 0 0 53 0 0 43 0 0 59Lane Group Flow (vph) 142 1044 41 104 1447 131 239 694 90 200 340 94Turn Type prn+pt pm+ov pm+pt pm+ov pm+pt pm+ov pm+pt pm+ovProtected Phases 5 2 3 1 6 7 3 8 1 7 4 5Permitted Phases 2 2 6 6 8 8 4 4Actuated Green, G (s) 45.6 45.6 59.1 42.5 42.5 55.9 45.1 31.6 39.0 44.9 31.5 42.0Effective Green, g (s) 47.1 47.1 62.1 44.0 44.0 58.9 48.1 33.1 42.0 47.9 33.0 45.0Actuated g/C Ratio 0.39 0.39 0,52 0.37 0.37 0.49 0.40 0.28 0.35 0.40 0.28 0.38Clearance Time (s) 5.5 5.5 5.5 5.5 5.5 5.5 5.5 5.5 5.5 5.5 5.5 5.5Vehicle Extension (s) 3.0 3.0 3.0 3.0 3.0 3.0 3.0 3.0 3.0 3.0 3.0 3.0LaneGrpCap(vph) 239 1996 819 274 1865 830 454 976 554 310 973 646v/s Ratio Prot cO.06 0.21 0.01 0.03 cO.28 0.02 0.07 cO.20 0.01 cO.08 0.10 0.01v/sRatioPerm 0.17 0.02 0.11 0.06 0.15 0.04 0.18 0.04v/c Ratio 0.59 0.52 0.05 0.38 0.78 0.16 0.53 0.71 0.16 0.65 0.35 0.15Uniform Delay, dl 28.4 27.9 14.3 30.6 33.6 16.9 25.1 39.1 26.9 26.3 34.9 24.8Progression Factor 0,64 0.80 2.81 1.00 1.00 1.00 1.00 1.00 1.00 1.00 1.00 1.00incremental Delay, d2 3.8 1.0 0.0 0.9 3.2 0.1 1.1 4.4 0.1 4.6 1.0 0.1Delay(s) 21.9 23.2 40.4 31.5 36.9 16.9 26.2 43.5 27.0 30.8 35.9 24.9LeveiofService C C D C D B C D C C D CApproach Delay (s) 24.1 34.4 37.6 32.0Approach LOS C C D C
Intersection SummaryHCM Average Control Delay 32.0 HCM Level of Service CHCM Volume to Capacity ratio 0.69Actuated Cycle Length (s) 120.0 Sum of lost time (s) 12.0intersection Capacity Utilization 73.8% ICU Level of Service DAnalysis Period (mm) 15c Critical Lane Group
Montaño Station 11/12/2009 PM Peak - Build 200 Spaces Synchro 7- ReportNKH Page2

HCM Signalized Intersection Capacity Analysis9: Montaño Rd & Site Dwy 1/11/2010
I\ /Movement EBT EBR WBL WBT NBL NBRLane Configurations +14’ “ +++ !IVolume (vph) 918 9 19 1704 29 63Ideal Flow (vphpl) 1900 1900 1900 1900 1900 1900Total Lost time (s) 4.0 4.0 4.0 4.0 4.0 4.0Lane Util. Factor 0.91 1.00 1.00 0.91 1.00 1.00Frt 1.00 0.85 1.00 1.00 1.00 0.85Fit Protected 1.00 1.00 0.95 1.00 0.95 1.00Satd. Flow (prot) 5085 1583 1770 5085 1770 1583Fit Permitted 1.00 1.00 0.20 1.00 0.95 1.00Satd. Flow (perm) 5085 1583 371 5085 1770 1583Peak-hour factor, PHF 0.92 0.25 0.25 0.95 0.25 0.25Adj. Flow (vph) 998 36 76 1794 116 252RTOR Reduction (vph) 0 19 0 0 0 146Lane Group Flow (vph) 998 17 76 1794 116 106Turn Type Perm pm÷pt PermProtected Phases 4 3 8 2Permitted Phases 4 8 2Actuated Green, G (s) 54.1 54.1 65.2 65.2 43.8 43.8Effective Green, g (s) 55.6 55.6 66.7 66.7 45.3 45.3Actuated g/C Ratio 0.46 0.46 0.56 0.56 0.38 0.38Clearance Time (s) 5.5 5.5 5.5 5.5 5.5 5.5Vehicle Extension (s) 3.0 3.0 3.0 3.0 3.0 3.0LaneGrpCap(vph) 2356 733 289 2826 668 598v/s Ratio Prot 0.20 0.02 cO.35 0.07v/s Ratio Perm 0.01 0.13 cO.07v/c Ratio 0.42 0.02 0.26 0.63 0.17 0.18Uniform Delay, dl 21.5 17.5 13.7 18.3 24,9 24.9Progression Factor 0.49 0.09 0.22 0.46 1.00 1.00Incremental Delay, d2 0,1 0.0 0.4 0.3 0.6 0.6Delay(s) 10.6 1.5 3.4 8.8 25.4 25.6Level of Service B A A A C CApproach Delay (s) 10.3 8.6 25.5Approach LOS B A C
Intersection SummaryHCM Average Control Delay 11.0 HCM Level of Service BHCM Volume to Capacity ratio 0.45Actuated Cycle Length (s) 120.0 Sum of lost time (s) 8.0intersection Capacity Utilization 42.9% ICU Level of Service AAnalysis Period (mm) 15c Critical Lane Group
Montaño Station 11/12/2009 PM Peak - Build 200 SpacesNKH
Synchro 7 - ReportPage 3

HCM Unsignalized Intersection Capacity Analysis9: Montaño Rd & Site Dwy 1/11/2010
1\ ,Movement EBT EBR WBL WBT NBL NBRLane Configurations ‘1 +4’+ ‘ ?‘Volume (veh/h) 1799 32 68 729 7 16Sign Control Free Free StopGrade 0% 0% 0%PeakHourFactor 0.92 0.25 0.25 0.89 0.25 0.25Hourlyflow rate (vph) 1955 128 272 819 28 64PedestilansLane Width (ft)Walking Speed (ft/s)Percent BlockageRight turn flare (veh)Median type None NoneMedian storage veh)Upstream signal (ft) 1050pX, platoon unblocked 0.72 0.72 0.72vC, conflicting volume 2083 2772 652vCl, stage 1 conf volvC2, stage 2 conf volvCu, unblocked vol 1150 2105 0tC,single(s) 4,1 6,8 6.9tC, 2 stage (s)tF(s) 2.2 3.5 3.3p0 queue free% 37 0 92cM capacity (veh/h) 435 12 782
Direction, Lane # EB 1 EB 2 EB 3 EB 4 WB 1 WB 2 WB 3 WB 4 NB 1 NB 2Volume Total 652 652 652 128 272 273 273 273 28 64Volume Left 0 0 0 0 272 0 0 0 28 0Volume Right 0 0 0 128 0 0 0 0 0 64cSH 1700 1700 1700 1700 435 1700 1700 1700 12 782VolumetoCapacity 0.38 0.38 0.38 0.08 0.63 0.16 0.16 0.16 2.34 0.08QueueLength95th(ft) 0 0 0 0 104 0 0 0 110 7Control Delay (s) 0.0 0.0 0.0 0.0 26.1 0.0 0.0 0.0 1248.0 10.0LaneLOS D F BApproach Delay (s) 0.0 6.5 386.8Approach LOS F
Intersection SummaryAverage Delay 13.1Intersection Capacity Utilization 51.9% ICU Level of Service AAnalysis Period (mm) 15
Montaño Station 11/12/2009 AM Peak - Build 200 Spaces Synchro 7- ReportNKH Page 1

HCM Unsignalized Intersection Capacity Analysis9: Montaño Rd & Site Dwy 1/11/2010
-+,
Movement EBT EBR WBL WBT NBL NBRLane Configurations +1+ r lPj +1’+ ‘i iiVolume (veh/h) 918 9 19 1704 29 63Sign Control Free Free StopGrade 0% 0% 0%Peak Hour Factor 092 0.25 0.25 0.95 0.25 0.25Hourlyflow rate (vph) 998 36 76 1794 116 252PedestrlansLane Width (ft)Walking Speed (ft/s)Percent BlockageRight turn flare (veh)Median type None NoneMedian storage veh)Upstream signal (ft) 1050pX, platoon unblocked 0.95 0.95 0.95vC, conflicting volume 1034 1748 333vCl, stage 1 conf volvC2, stage 2 conf volvCu, unblocked vol 860 1609 123tC, single (s) 4.1 6.8 6.9tC, 2 stage (s)tF(s) 2.2 3.5 3.3p0 queue free% 90 0 71cM capacity (veh/h) 740 82 861
DirecUon, Lane # EB 1 EB 2 EB 3 EB 4 WB I WB 2 WB 3 WB 4 NB I NB 2Volume Total 333 333 333 36 76 598 598 598 116 252Volume Left 0 0 0 0 76 0 0 0 116 0Volume Right 0 0 0 36 0 0 0 0 0 252cSH 1700 1700 1700 1700 740 1700 1700 1700 82 861VolumetoCapacity 0.20 0.20 0.20 0.02 0.10 0.35 0.35 0.35 1.42 0.29Queue Length 95th (ft) 0 0 0 0 9 0 0 0 227 31ControlDelay(s) 0.0 0.0 0.0 0.0 10.4 0.0 0.0 0.0 337.6 10.9LaneLOS B F BApproach Delay (s) 0.0 0.4 113.9Approach LOS F
Intersection SummaryAverage Delay 13.1Intersection Capacity Utilization 42,9% CU Level of Service AAnalysis Period (mm) 15
Montaho Station 11/12/2009 PM Peak - Build 200 Spaces Synchro 7- ReportNKH Page 1
Appendix G
Alternative 3 Level of Service Analyses
Level of Service Analysis PagesAlternative 3 AM - Signalized 3Alternative 3 PM - Signalized 3Alternative 3 AM - Unsignalized 1Alternative 3 PM - Unsignalized 1
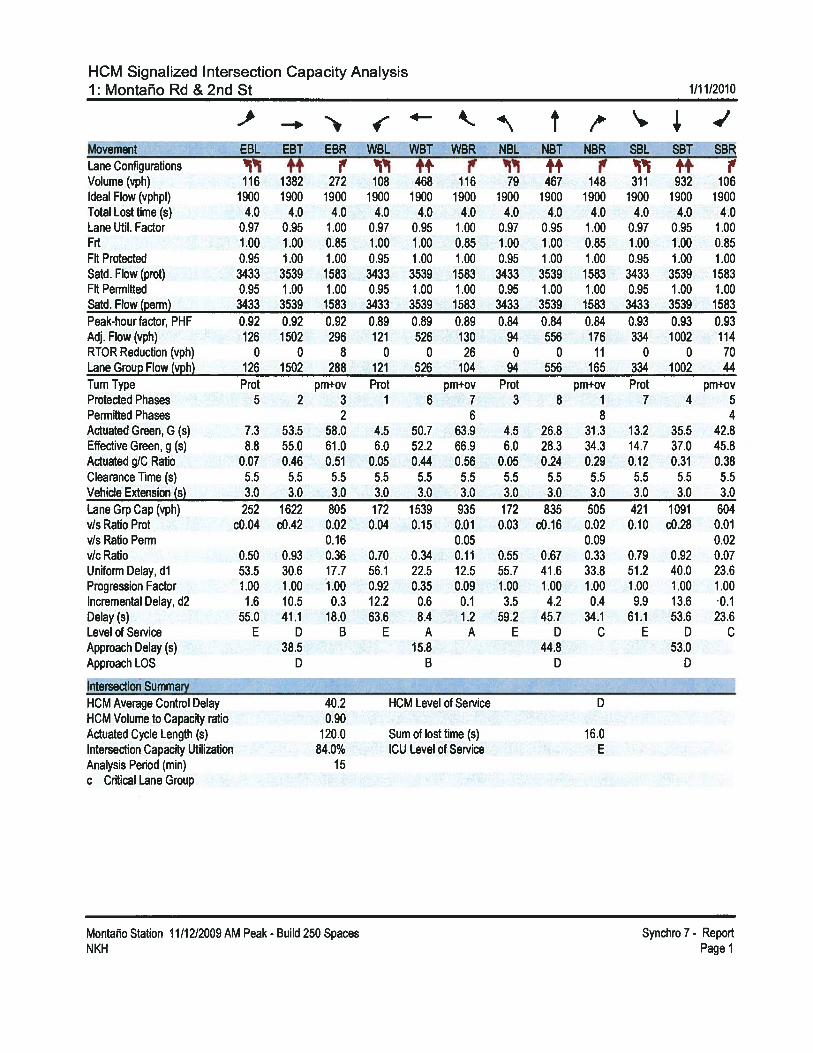
HCM Signalized Intersection Capacity Analysis1: Montaño Rd &2nd St 1/1112010
f1-4%4\
Movement EBL EBT EBR WBL WBT WBR NBL NBT NBR SBL SBT SBRLane Configurations j SMI. i i1 ++ Ii +1’ rVolume (vph) 116 1382 272 108 468 116 79 467 148 311 932 106Ideal Flow (vphpl) 1900 1900 1900 1900 1900 1900 1900 1900 1900 1900 1900 1900Total Lost time (s) 4.0 4.0 4.0 4.0 4.0 4.0 4.0 4.0 4.0 4.0 4.0 4.0Lane Util. Factor 0.97 0.95 1.00 0.97 0.95 1.00 0.97 0.95 1.00 0.97 0.95 1.00Frt 1.00 1.00 0.85 1.00 1.00 0.85 1.00 1.00 0.85 1.00 1.00 0.85FIt Protected 0.95 1.00 1.00 0.95 1.00 1.00 0.95 1.00 1.00 0.95 1.00 1.00Satd. Flow (prot) 3433 3539 1583 3433 3539 1583 3433 3539 1583 3433 3539 1583FIt Permitted 0.95 1.00 1.00 0.95 1.00 1.00 0.95 1.00 1.00 0.95 1.00 1.00Satd. Flow (perm) 3433 3539 1583 3433 3539 1583 3433 3539 1583 3433 3539 1583Peak-hour factor, PHF 0.92 0.92 0.92 0.89 0.89 0.89 0.84 0.84 0.84 0.93 0.93 0.93Adj. Flow (vph) 126 1502 296 121 526 130 94 556 176 334 1002 114RTOR Reduction (vph) 0 0 8 0 0 26 0 0 11 0 0 70LaneGroupFlow(vph) 126 1502 288 121 526 104 94 556 165 334 1002 44Turn Type Prot pm+ov Prot pm+ov Prot pm+ov Prot pm÷ovProtected Phases 5 2 3 1 6 7 3 8 1 7 4 5Permitted Phases 2 6 8 4Actuated Green, G (s) 7.3 53.5 58.0 4.5 50.7 63.9 4.5 26.8 31.3 13,2 35.5 42.8Effective Green, g (s) 8.8 55.0 61.0 6.0 52.2 66.9 6.0 28.3 34.3 14.7 37.0 45.8Actuated g/C Ratio 0.07 0.46 0.51 0.05 0.44 0.56 0.05 0.24 0.29 0.12 0.31 0.38Clearance Time (s) 5.5 5.5 5.5 5.5 5.5 5.5 5.5 5.5 5.5 5.5 5.5 5.5Vehicle Extension (s) 3.0 3.0 3.0 3.0 3.0 3.0 3.0 3.0 3.0 3.0 3.0 3.0LaneGrpCap(vph) 252 1622 805 172 1539 935 172 835 505 421 1091 604v/s Ratio Prot cO.04 cO.42 0.02 0.04 0.15 0.01 0.03 cO.16 0.02 0.10 cO.28 0.01v/s Ratio Perm 0.16 0.05 0.09 0.02v/cRatio 0.50 0.93 0.36 0.70 0.34 0.11 0.55 0.67 0.33 0.79 0.92 0.07Uniform Delay, dl 53.5 30.6 17.7 56.1 22.5 12.5 55.7 41.6 33.8 51.2 40.0 23.6Progression Factor 1.00 1.00 1.00 0.92 0.35 0.09 1.00 1.00 1.00 1.00 1.00 1.00Incremental Delay, d2 1.6 10.5 0.3 12.2 0.6 0.1 3.5 4.2 0.4 9.9 13.6 ‘0.1Delay(s) 55.0 41.1 18.0 63.6 8.4 1.2 59.2 45.7 34.1 61.1 53.6 23.6Levelof Service E D B E A A E D C E D CApproach Delay (s) 38.5 15.8 44.8 53.0Approach LOS D B D D
Intersection SummaryHCM Average Control Delay 40.2 HCM Level of Service DHCM Volume to Capacity ratio 0.90Actuated Cycle Length (s) 120.0 Sum of lost time (s) 16.0Intersection Capacity Utilization 84.0% ICU Level of Service EAnalysis Period (mm) 15c Critical Lane Group
Montaño Station 11/12/2009 AM Peak - Build 250 Spaces Synchro 7- ReportNKH Page 1
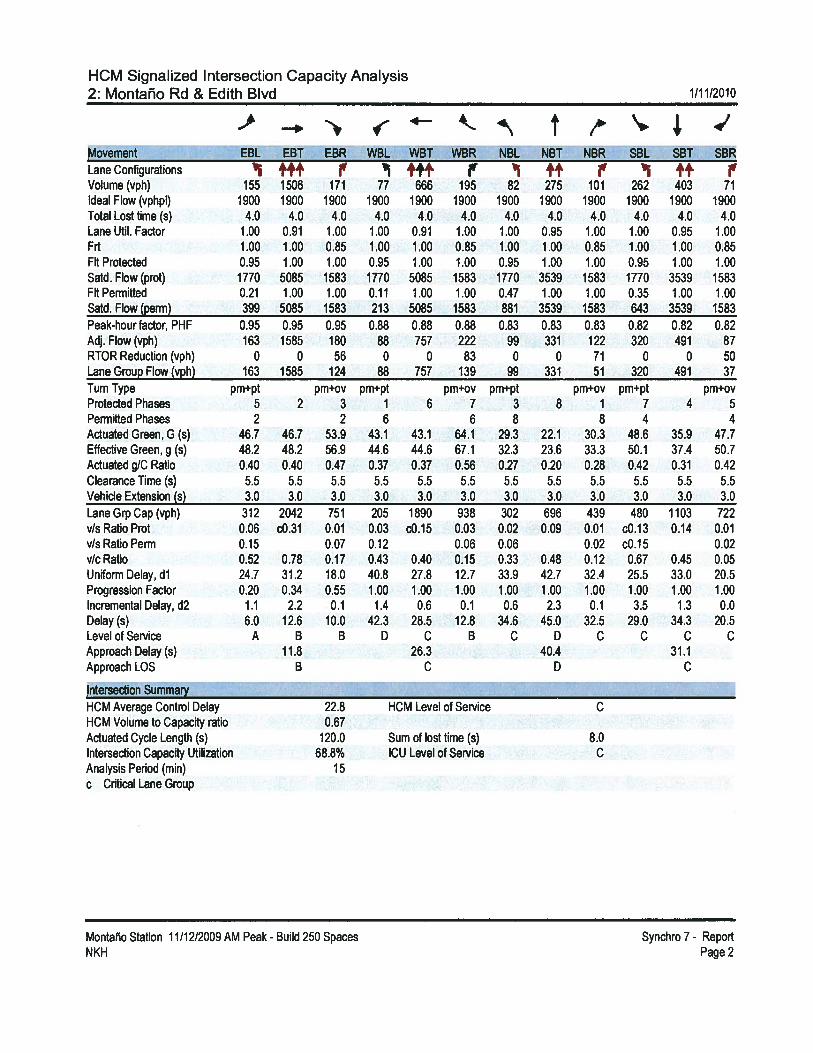
HCM Signalized Intersection Capacity Analysis
2: Montaño Rd & Edith Blvd 1/11/2010
Movement EBL EBT EBR WBL WBT WBR NBL NBT NBR SBL SBT SBRLane ConIgurations Iv ++ Ij ++Volume (vph) 155 1506 171 77 666 195 82 275 101 262 403 71ideal Flow (vphpl) 1900 1900 1900 1900 1900 1900 1900 1900 1900 1900 1900 1900Total Lost time (s) 4,0 4.0 4.0 4.0 4.0 4.0 4.0 4.0 4.0 4.0 4.0 4.0Lane Util. Factor 1.00 0.91 1.00 1.00 0.91 1.00 1.00 0.95 1.00 1.00 0.95 1.00Frt 1.00 1.00 0.85 1.00 1.00 0.85 1.00 1.00 0.85 1.00 1.00 0.85FIt Protected 0.95 1.00 1.00 0.95 1.00 1.00 0.95 1.00 1.00 0.95 1.00 1.00Satd.Flow(prot) 1770 5085 1583 1770 5085 1583 1770 3539 1583 1770 3539 1583FIt Permitted 0.21 1.00 1.00 0.11 1.00 1.00 0.47 1.00 1.00 0.35 1.00 1.00Satd.Flow(perm) 399 5085 1583 213 5085 1583 881 3539 1583 643 3539 1583Peak-hourfactor, PHF 0.95 0.95 0.95 0.88 0.88 0.88 0.83 0.83 0.83 0.82 0.82 0.82Adj. Flow (vph) 163 1585 180 88 757 222 99 331 122 320 491 87RTOR Reduction (vph) 0 0 56 0 0 83 0 0 71 0 0 50LaneGroupFlow(vph) 163 1585 124 88 757 139 99 331 51 320 491 37Turn Type pm+pt pm+ov pm+pt pm+ov pm+pt pm÷ov pm+pt pm+ovProtected Phases 5 2 3 1 6 7 3 8 1 7 4 5Permitted Phases 2 2 6 6 8 8 4 4Actuated Green, G (s) 46.7 46.7 53.9 43.1 43.1 64.1 29.3 22.1 30.3 48.6 35.9 47.7Effective Green, g (s) 48.2 48.2 56.9 44.6 44.6 67.1 32.3 23.6 33.3 50.1 37.4 50.7Actuated g/C Ratio 0.40 0.40 0.47 0.37 0.37 0.56 0.27 0.20 0.28 0.42 0.31 0.42Clearance Time (s) 5.5 5.5 5.5 5.5 5.5 5.5 5.5 5,5 5•5 5,5 5.5 5.5Vehicle Extension (s) 3.0 3.0 3.0 3.0 3.0 3.0 3.0 3.0 3.0 3.0 3.0 3.0LaneGrpCap(vph) 312 2042 751 205 1890 938 302 696 439 480 1103 722v/s Ratio Prot 0.06 cO.31 0.01 0.03 cO.15 0.03 0.02 0.09 0.01 cO.13 0.14 0.01v/s Ratio Perm 0.15 0.07 0.12 0.06 0.06 0.02 cO.15 0.02v/c Ratio 0.52 0.78 0.17 0.43 0.40 0.15 0.33 0.48 0.12 0.67 0.45 0.05Uniform Delay, dl 24.7 31.2 18.0 40.8 27.8 12.7 33.9 42.7 32.4 25.5 33.0 20.5Progression Factor 0.20 0.34 0.55 1.00 1.00 1.00 1.00 1.00 1.00 1.00 1.00 1.00Incremental Delay, d2 1.1 2.2 0.1 1.4 0.6 0.1 0.6 2.3 0.1 3.5 1.3 0.0Delay(s) 6.0 12.6 10.0 42.3 28.5 12.8 34.6 45.0 32.5 29.0 34.3 20.5Level of Service A B B D C B C D C C C CApproach Delay (s) 11.8 26.3 40.4 31.1Approach LOS B C D C
Intersection SummaryHCM Average Control Delay 22.8 HCM Level of Service CHCM Volume to Capacity ratio 0.67Actuated Cycle Length (s) 120.0 Sum of lost time (s) 8.0Intersection Capacity Utilization 68.8% ICU Level of Service CAnalysis Period (mm) 15c Crftical Lane Group
Montaño Station 11/12/2009 AM Peak - Build 250 Spaces Synchro 7 - ReportPage 2NKH
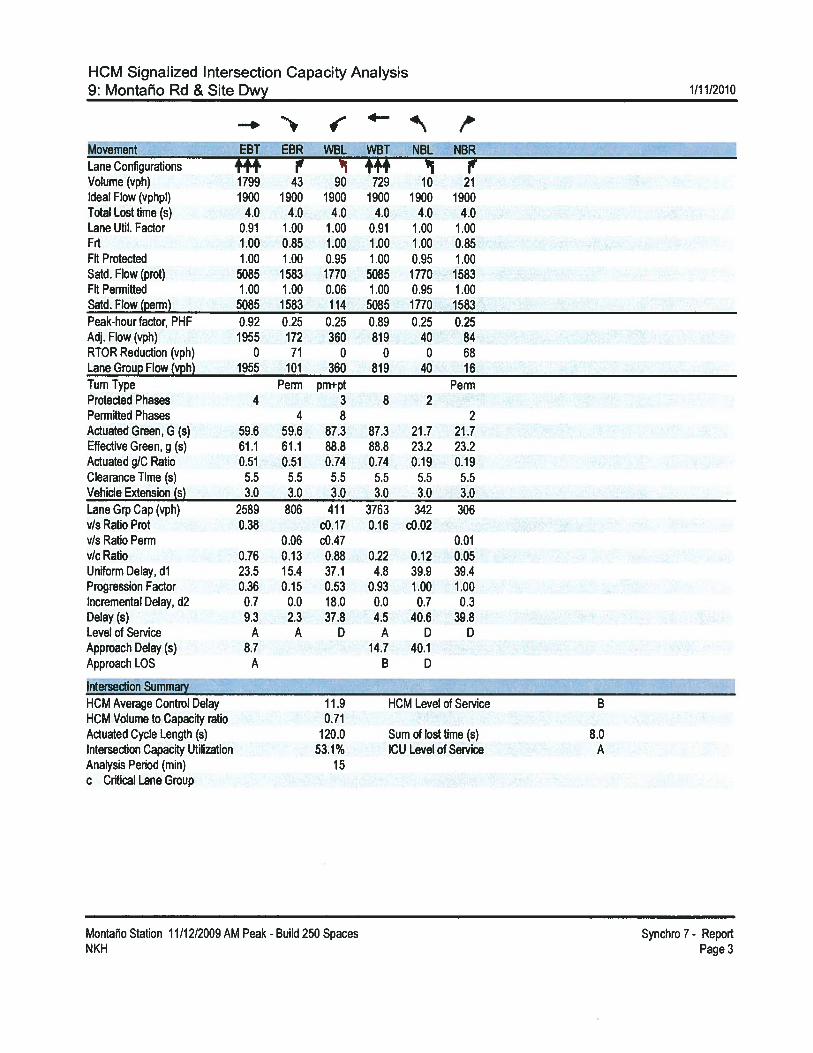
HCM Signalized Intersection Capacity Analysis9: Montaño Rd & Site Dwy 1/1 1/2010
—,
1_\ ,Movement EBT EBR WBL WBT NBL NBRLane Configurations i’Volume (vph) 1799 43 90 729 10 21Ideal Flow (vphpl) 1900 1900 1900 1900 1900 1900Total Lost time (s) 4.0 4.0 4,0 4.0 4.0 4.0Lane Util. Factor 0.91 1.00 1.00 0.91 1.00 1.00Frt 1.00 0.85 1.00 1.00 1.00 0.85Fit Protected 1.00 1.00 0.95 1.00 0.95 1.00Satd. Flow (prot) 5085 1583 1770 5085 1770 1583Fit Permitted 1.00 1.00 0.06 1.00 0.95 1.00Satd. Flow (perm) 5085 1583 114 5085 1770 1583Peak-hour factor, PHF 0.92 0.25 0.25 0.89 0.25 0.25Adj. Flow (vph) 1955 172 360 819 40 84RTOR Reduction (vph) 0 71 0 0 0 68Lane Group Flow (vph) 1955 101 360 819 40 16Turn Type Perni prn÷pt PermProtected Phases 4 3 8 2Permitted Phases 4 8 2Actuated Green, G (s) 59.6 59.6 87.3 87.3 21,7 21.7Effective Green, g (s) 61.1 61.1 88.8 88.8 23.2 23.2Actuated g/C Ratio 0.51 0.51 0.74 0.74 0.19 0.19Clearance Time (s) 5.5 5.5 5.5 5.5 5.5 5.5Vehicle Extension (s) 3.0 3.0 3.0 3.0 3.0 3.0LaneGrpCap(vph) 2589 806 411 3763 342 306v/s Ratio Prot 0.38 cO.17 0.16 cO.02v/s Ratio Perm 0.06 cO.47 0.01v/c Ratio 0.76 0.13 0.88 0.22 0.12 0.05Uniform Delay, dl 23.5 15.4 37.1 4.8 39.9 39.4Progression Factor 0.36 0.15 0.53 0.93 1.00 1.00Incremental Delay, d2 0.7 0.0 18.0 0.0 0.7 0.3Delay(s) 9.3 2.3 37.8 4.5 40.6 39.8Level of Service A A D A D DApproach Delay (s) 8.7 14.7 40.1Approach LOS A B D
Intersection SummaryHCM Average Control Delay 11.9 HCM Level of Service BHCM Volume to Capacity ratio 0.71Actuated Cycle Length (s) 120.0 Sum of lost time (s) 8.0Intersection Capacity Utilization 53.1% ICU Level of Service AAnalysis Period (mm) 15c Critical Lane Group
Montaño Station 11/12/2009 AM Peak - Build 250 Spaces Synchro 7 - ReportNKH Page3

HCM Signalized Intersection Capacity Analysis1: Montaño Rd & 2nd St 1/11/2010
Movement EBL EBT EBR WBL WBT WBR NBL NBT NBR SBL SBT SBRLane Configurations 44 ‘ ff’ ++ •4’. jVolume (vph) 100 654 142 160 1247 326 298 987 167 108 574 173Ideal Flow(vphpi) 1900 1900 1900 1900 1900 1900 1900 1900 1900 1900 1900 1900Total Lost time (s) 4.0 4.0 4.0 4.0 4.0 4.0 4.0 4.0 4.0 4.0 4.0 4.0Lane Utii. Factor 0.97 0.95 1.00 0.97 0.95 1.00 0.97 0.95 1.00 0.97 0.95 1.00Frt 1.00 1.00 0.85 1.00 1.00 0.85 1.00 1.00 0.85 1.00 1.00 0.85Fit Protected 0.95 1.00 1.00 0.95 1.00 1.00 0.95 1.00 1.00 0.95 1.00 1.00Satd. Flow (prot) 3433 3539 1583 3433 3539 1583 3433 3539 1583 3433 3539 1583FIt Permitted 0.95 1.00 1.00 0.95 1.00 1.00 0.95 1.00 1.00 0.95 1.00 1.00Satd. Flow (perm) 3433 3539 1583 3433 3539 1583 3433 3539 1583 3433 3539 1583Peak-hour factor, PHF 0.92 0.92 0.92 0.95 0.95 0.95 0.93 0.93 0.93 0.93 0.93 0.93Adj. Flow (vph) 109 711 154 168 1313 343 320 1061 180 116 617 186RTOR Reduction (vph) 0 0 24 0 0 10 0 0 52 0 0 19LaneGroupFlow(vph) 109 711 130 168 1313 333 320 1061 128 116 617 167Turn Type Prot pm+ov Prot pm÷ov Prot pm+ov Prot pm+ovProtected Phases 5 2 3 1 6 7 3 8 1 7 4 5Permitted Phases 2 6 8 4Actuated Green, G (s) 4.5 43.6 58.7 9.4 48.5 55.0 15.1 38.5 47.9 6.5 29.9 34.4Effective Green, g (s) 6.0 45.1 61.7 10.9 50.0 58.0 16.6 40.0 50.9 8.0 31.4 37.4Actuated g/C Ratio 0.05 0.38 0.51 0.09 0.42 0.48 0.14 0.33 0.42 0.07 0.26 0.31Clearance Time (s) 5.5 5.5 5.5 5.5 5.5 5.5 5.5 5.5 5.5 5.5 5.5 5.5Vehicle Extension (s) 3.0 3.0 3.0 3,0 3.0 3.0 3.0 3.0 3.0 3.0 3.0 3.0LaneGrpCap(vph) 172 1330 814 312 1475 818 475 1180 724 229 926 493v/s Ratio Prot 0.03 0.20 0.02 cO.05 cO.37 0.03 0.09 cO.30 0.02 0.03 cO.17 0.02v/s Ratio Perm 0.06 0.18 0.06 0.09v/c Ratio 0.63 0.53 0.16 0.54 0.89 0.41 0.67 0.90 0.18 0.51 0.67 0.34Uniform Delay, dl 55.9 29.3 15.4 52.1 32.5 19.9 49.1 38.1 21.5 54.1 39.6 31.8Progression Factor 1.00 1.00 1.00 0.76 0.48 0.28 1.00 1.00 1.00 1.00 1.00 1.00Incremental Delay, d2 7.4 1.5 0.1 1.6 7.8 0.3 3.8 11.0 0.1 1.8 3.8 0.4Delay(s) 63.3 30.8 15.5 41.0 23.3 5.8 52.9 49.0 21.6 55.9 43.4 32.2Level of Service E C B D C A D D C E D CApproach Delay (s) 32.0 21.7 46.7 42.7Approach LOS C C D D
Intersection SummaryHCM Average Control Delay 34.6 HCM Level of Service CHCM Volume to Capacity ratio 0.82Actuated Cycle Length (s) 120.0 Sum of lost time (s) 8.0Intersection Capacity Utilization 81.8% CU Level of Service DAnalysis Period (mm) 15c Critical Lane Group
Montano Station 11/12/2009 PM Peak - Build 250 Spaces Synchro7- ReportPage 1NKH

Turn TypeProtected PhasesPermitted PhasesActuated Green, G (s)Effective Green, g (s)Actuated gIG RatioClearance Time (s)Vehicle Extension (s)Lane Grp Cap (vph)v/s Ratio Protv/s Ratio Permv/c RatioUniform Delay, dlProgression FactorIncremental Delay, d2Delay(s)Level of ServiceApproach Delay (s)Approach LOS
Intersection Summary
pm+pt52
45.3 45.346.8 46.80.39 0.39
5.5 5.53.0 3.0
241 1983cO.06 0.210.170.59 0.5428.5 28.20.78 0.93
3.7 1.025.9 27.1
C C27.5
C
2
HCM Average Control DelayHCM Volume to Capacity ratioActuated Cycle Length (s)Intersection Capacity UtilizationAnalysis Period (mm)c Critical Lane Group
Sum of lost time (s)CU Level of Service
Montaño Station 11/12/2009 PM Peak - Build 250 Spaces Synchro 7 - ReportPage 2
HCM Signalized Intersection Capacity Analysis2: Montaño Rd & Edith Blvd 1/11/2010
f14_4%4\
Movement EBL EBT EBR WBL WBT WBR NBL NBT NBR SBL SBT SBRLane Configurations ‘j ••• ‘1 ++ ‘ ++ jV
Volume (vph) 129 955 71 99 1379 175 213 618 118 176 299 135Ideal Flow (vphpl) 1900 1900 1900 1900 1900 1900 1900 1900 1900 1900 1900 1900Total Lost time (s) 4.0 4.0 4.0 4.0 4.0 4.0 4.0 4.0 4.0 4.0 4.0 4.0LaneUtil.Factor 1.00 0.91 1.00 1.00 0.91 1.00 1.00 0.95 1.00 1.00 0.95 1.00Frt 1.00 1.00 0,85 1.00 1.00 0.85 1.00 1.00 0.85 1.00 1.00 0.85FltProtected 0.95 1.00 1.00 0.95 1.00 1.00 0.95 1.00 1.00 0.95 1.00 1.00Satd. Flow (prot) 1770 5085 1583 1770 5085 1583 1770 3539 1583 1770 3539 1583FIt Permitted 0.12 1.00 1.00 0.26 1.00 1.00 0.45 1.00 1.00 0.18 1.00 1.00Satd. Flow (perm) 215 5085 1583 479 5085 1583 844 3539 1583 328 3539 1583Peak-hourfactor, PHF 0.90 0.90 0.90 0.95 0.95 0.95 0.89 0.89 0.89 0.88 0.88 0.88Adj. Flow (vph) 143 1061 79 104 1452 184 239 694 133 200 340 153RTOR Reduction (vph) 0 0 37 0 0 53 0 0 43 0 0 59Lane Group Flow (vph) 143 1061 42 104 1452 131 239 694 90 200 340 94
6 8 4pm+ov pm+pt pm÷ov pm+pt pm+ov pm÷pt pm÷ov
3 1 7 3 1 7 52 6 6 8 8 4 4
58.8 42.4 42.4 55.8 45.1 31.6 39.3 44.9 31.5 42.161.8 43.9 43.9 58.8 48.1 33.1 42.3 47.9 33.0 45.10.51 0.37 0.37 0.49 0.40 0.28 0.35 0.40 0.28 0.38
5.5 5.5 5.5 5.5 5.5 5.5 5.5 5.5 5.5 5.53.0 3.0 3.0 3.0 3.0 3.0 3.0 3.0 3.0 3.0
815 274 1860 828 454 976 558 310 973 6480.01 0.03 cO.29 0.02 0.07 cO.20 0.01 cO.08 0.10 0.010.02 0.11 0.06 0.15 0.04 0.18 0.040.05 0.38 0.78 0.16 0.53 0.71 0.16 0.65 0.35 0.1514.5 30.9 33.8 16.9 25.1 39.1 26.7 26.3 34.9 24.72.42 1.00 1.00 1.00 1.00 1.00 1.00 1.00 1.00 1.000.0 0.9 3.3 0.1 1.1 4.4 0.1 4.6 1.0 0.1
35.2 31.7 37.1 17.0 26.2 43.5 26.8 30.8 35.9 24.8D C D B C D C C D C
34.7 37.6 32.0C D C
HCM Level of Service33.00.69
120.074.0%
15
C
12.0D
NKH

HCM Signalized Intersection Capacity Analysis9: Montaño Rd & Site Dwy 1/11)2010
- +4\ ,
Movement EBT EBR WBL WBT NBL NBRLane Configurations ff’4’ ‘Volume (vph) 918 11 24 1704 37 80ideal Flow (vphpl) 1900 1900 1900 1900 1900 1900Total Lost time (s) 4.0 4.0 4.0 4.0 4.0 4.0Lane Util. Factor 0.91 1.00 1.00 0.91 1.00 1.00Frt 1.00 0.85 1.00 1.00 1,00 0.85Fit Protected 1.00 1.00 0.95 1.00 0.95 1.00Satd. Flow (prot) 5085 1583 1770 5085 1770 1583FltPermitted 1.00 1.00 0.19 1.00 0.95 1.00Satd. Flow (perm) 5085 1583 358 5085 1770 1583Peak-hour factor, PHF 0.92 0.25 0.25 0.95 0.25 0.25Adj. Flow (vph) 998 44 96 1794 148 320RTOR Reduction (vph) 0 25 0 0 0 144Lane Group Flow (vph) 998 19 96 1794 148 176Turn Type Perm pm÷pt PermProtected Phases 4 3 8 2Pem,itted Phases 4 8 2Actuated Green, G (s) 51.3 51.3 63.8 63.8 45.2 45.2Effective Green, g (s) 52.8 52.8 65.3 65.3 46.7 46.7Actuated g/C Ratio 0.44 0.44 0.54 0.54 0.39 0.39Clearance Time (s) 5.5 5.5 5.5 5.5 5.5 5.5Vehicle Extension (s) 3.0 3.0 3.0 3.0 3.0 3.0LaneGrpCap(vph) 2237 697 295 2767 689 616v/s Ratio Prot 0.20 0.02 cO.35 0.08v/sRatioPerm 0.01 0.15 cOilv/c Ratio 0.45 0.03 0.33 0.65 0.21 0.29Uniform Delay, dl 23.4 19.0 14.7 19.3 24.4 25.2Progression Factor 0.57 0.12 0.29 0.26 1.00 1.00Incremental Delay, d2 0.1 0.0 0.5 0.4 0.7 1.2Delay (s) 13.4 2.3 4.7 5.5 25.1 26.4Level of Service B A A A C CApproach Delay (s) 12.9 5.4 26.0Approach LOS B A C
Intersection SummaryHCM Average Control Delay 10.6 HCM Level of Service BHCM Volume to Capacity ratio 0.50Actuated Cycle Length (s) 120.0 Sum of lost time (s) 8.0Intersection Capacity Utilization 42.9% ICU Level of Service AAnalysis Period (mm) 15c Critical Lane Group
Montano Station 11/12/2009 PM Peak - Build 250 Spaces Synchro7- ReportNKH Page 3
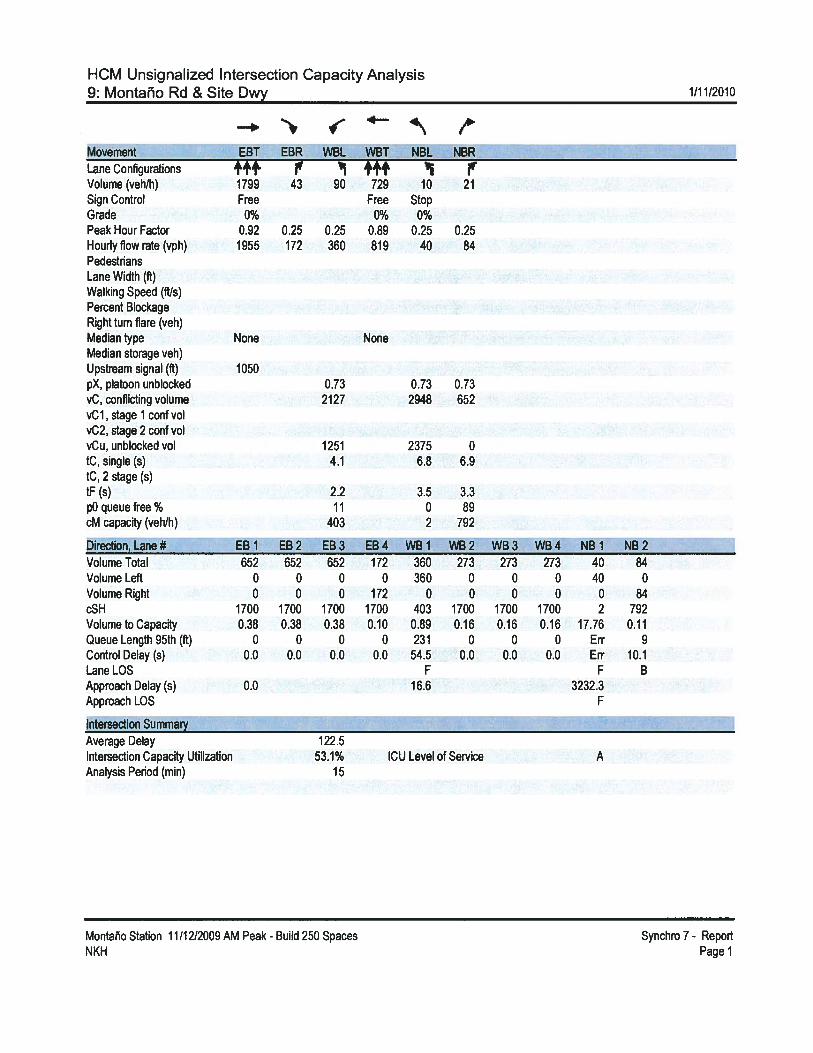
HCM Unsignalized Intersection Capacity Analysis9: Montaño Rd & Site Dwy 1/1 1/2010
f+4\ /Movement EBT EBR WBL WBT NBL NBRLane Configurations P ‘ +++ ‘ PVolume (veh/h) 1799 43 90 729 10 21Sign Control Free Free StopGrade 0% 0% 0%PeakHourFactor 0.92 0.25 0.25 0.89 0.25 0.25Hourly flow rate (vph) 1955 172 360 819 40 84PedestriansLane Width (ft)Walking Speed (ft/s)Percent BlockageRight turn flare (veh)Median type None NoneMedian storage veh)Upstream signal (ft) 1050pX, platoon unblocked 0.73 0.73 0.73vC, conflicting volume 2127 2948 652vCl, stage 1 conf volvC2, stage 2 conf volvCu, unblocked vol 1251 2375 0tC, single (s) 4.1 6.8 6.9tC, 2 stage (s)tF(s) 2.2 3.5 3.3p0 queue free% 11 0 89cM capacity (veh/h) 403 2 792
Direction, Lane # EB I EB 2 EB 3 EB 4 WB I WB 2 WB 3 WB 4 NB 1 NB 2Volume Total 652 652 652 172 360 273 273 273 40 84Volume Left 0 0 0 0 360 0 0 0 40 0Volume Right 0 0 0 172 0 0 0 0 0 84cSH 1700 1700 1700 1700 403 1700 1700 1700 2 792VolumetoCapacity 0.38 0.38 0.38 0.10 0.89 0.16 0.16 0.16 17.76 0.11Queue Length 95th (ft) 0 0 0 0 231 0 0 0 Err 9Control Delay (s) 0.0 0.0 0.0 0.0 54.5 0.0 0.0 0.0 Err 10.1LaneLOS F F BApproach Delay (s) 0.0 16.6 3232.3Approach LOS F
Intersection SummaryAverage Delay 122.5Intersection Capacity Utilization 53.1% ICU Level of Service AAnalysis Period (mm) 15
Montano Station 11/12/2009 AM Peak - Build 250 Spaces Synchro 7 - ReportNKH Page 1
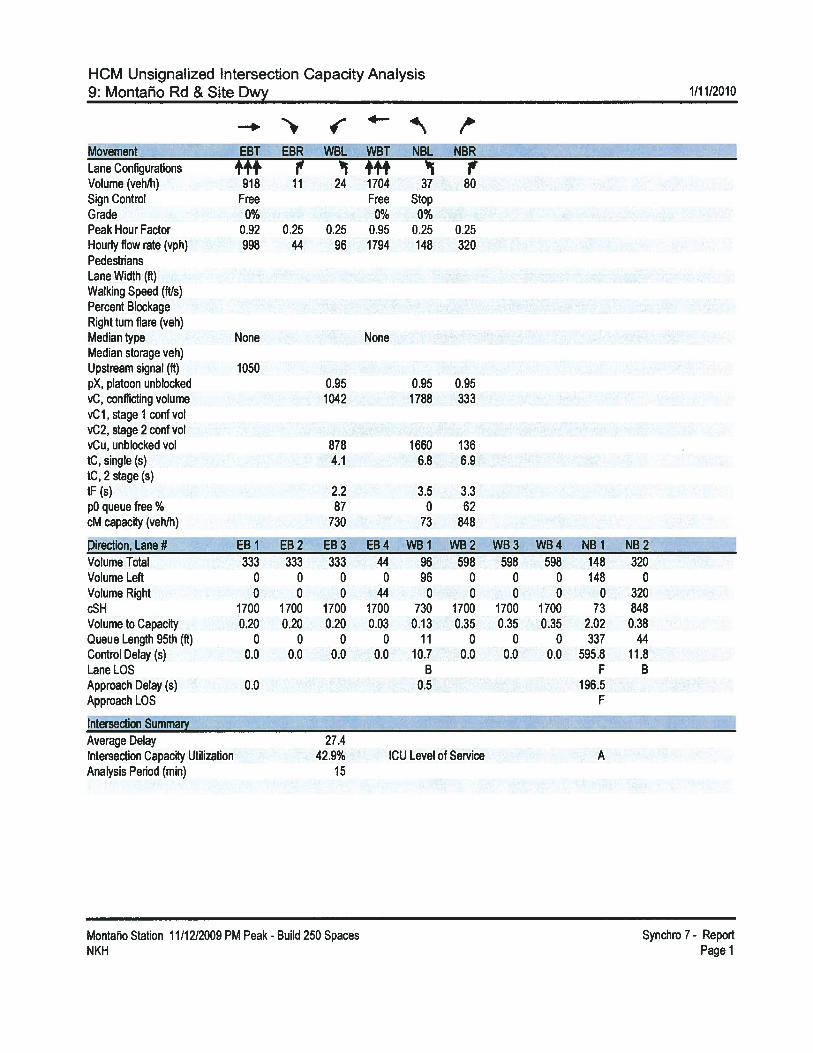
HCM Unsignalized Intersection Capacity Analysis
9: Montaño Rd & Site Dwy 1/1 1/2010
-* f+\ ,Movement EBT EBR WBL WBT NBL NBRLane Configurations ++i r ‘ +1”?’ “1Volume (veh/h) 918 11 24 1704 37 80Sign Control Free Free StopGrade 0% 0% 0%PeakHourFactor 0.92 0.25 0.25 0.95 0.25 0.25Hourly flow rate (vph) 998 44 96 1794 148 320PedestriansLane Width (if)Walking Speed (fIJs)Percent BlockageRight turn flare (veh)Median type None NoneMedian storage veh)Upstream signal (ft) 1050pX, platoon unblocked 0.95 0.95 0.95vC, conflicting volume 1042 1788 333vC 1, stage 1 conf volvC2, stage 2 conf volvCu, unblocked vol 878 1660 136tC, single (s) 4.1 6,8 6.9tC, 2 stage (s)tF(s) 2.2 3.5 3.3p0 queue free% 87 0 62cM capacity (veh/h) 730 73 848
Direction, Lane # EB 1 EB 2 EB 3 EB 4 WB I WB 2 WB 3 WB 4 NB 1 NB 2Volume Total 333 333 333 44 96 598 598 598 148 320Volume Left 0 0 0 0 96 0 0 0 148 0Volume Right 0 0 0 44 0 0 0 0 0 320cSH 1700 1700 1700 1700 730 1700 1700 1700 73 848Volume to Capacity 0.20 0.20 0.20 0.03 0.13 0.35 0.35 0.35 2.02 0.38Queue Length 95th (if) 0 0 0 0 11 0 0 0 337 44Control Delay (s) 0.0 0.0 0.0 0.0 10.7 0.0 0.0 0.0 595.8 11.8LaneLOS B F BApproach Delay (s) 0.0 0.5 196.5Approach LOS F
Intersection SummaryAverage Delay 27.4Intersection Capacity Utilization 42.9% ICU Level of Service AAnalysis Period (mm) 15
Montaño Station 11/12/2009 PM Peak- Build 250 Spaces Synchro 7- ReportNKH Page 1
Appendix H
Gap Study Summary
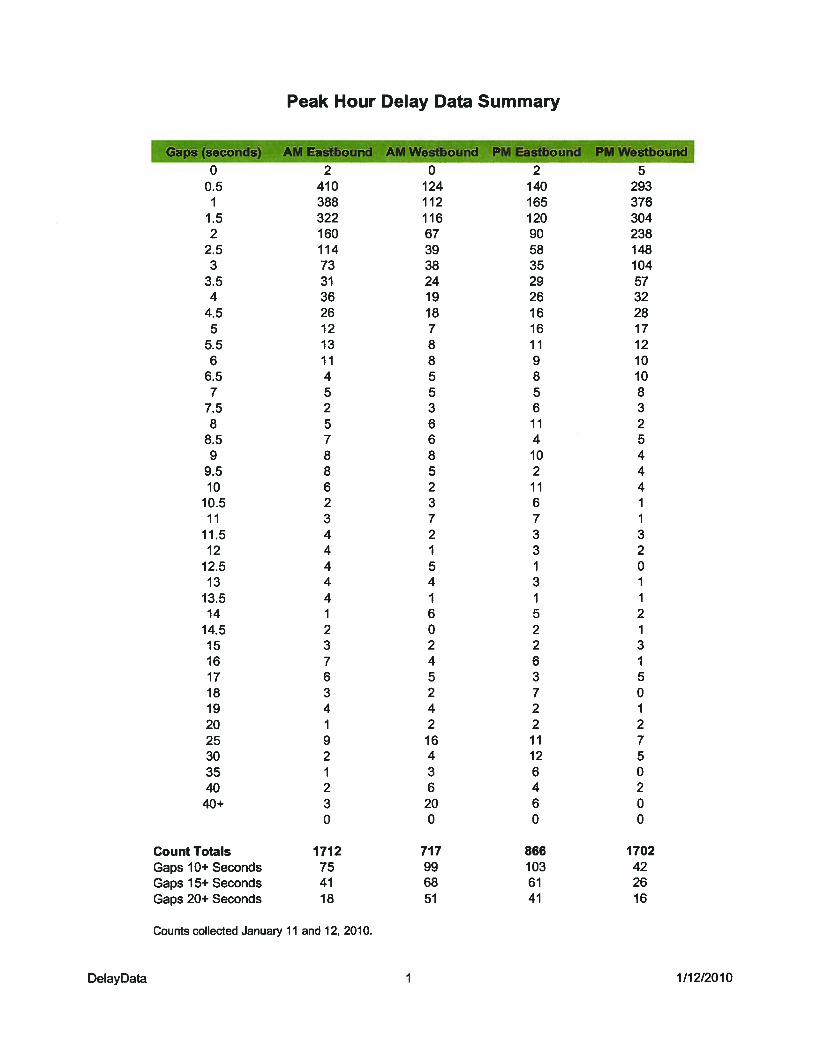
Peak Hour Delay Data Summary
• Gaps (sEconds) AM Eàstboünd AM Westbound PM Eastbound PM Westboundo 2 0 2 5
0.5 410 124 140 293I 388 112 165 376
1.5 322 116 120 3042 160 67 90 238
2.5 114 39 58 1483 73 38 35 104
3.5 31 24 29 574 36 19 26 32
4.5 26 18 16 285 12 7 16 17
5.5 13 8 11 126 11 8 9 10
6.5 4 5 8 107 5 5 5 8
7.5 2 3 6 38 5 6 11 2
8.5 7 6 4 59 8 8 10 4
9.5 8 5 2 410 6 2 11 4
10.5 2 3 6 111 3 7 7 1
11.5 4 2 3 312 4 1 3 2
12.5 4 5 1 013 4 4 3 1
13.5 4 1 1 114 1 6 5 2
14.5 2 0 2 115 3 2 2 316 7 4 6 117 6 5 3 518 3 2 7 019 4 4 2 120 1 2 2 225 9 16 11 730 2 4 12 535 1 3 6 040 2 6 4 2
40+ 3 20 6 00 0 0 0
Count Totals 1712 717 866 1702Gaps 10+ Seconds 75 99 103 42Gaps 15+Seconds 41 68 61 26Gaps 20+ Seconds 18 51 41 16
Counts collected January 11 and 12, 2010.
DelayData 1 1/12/2010
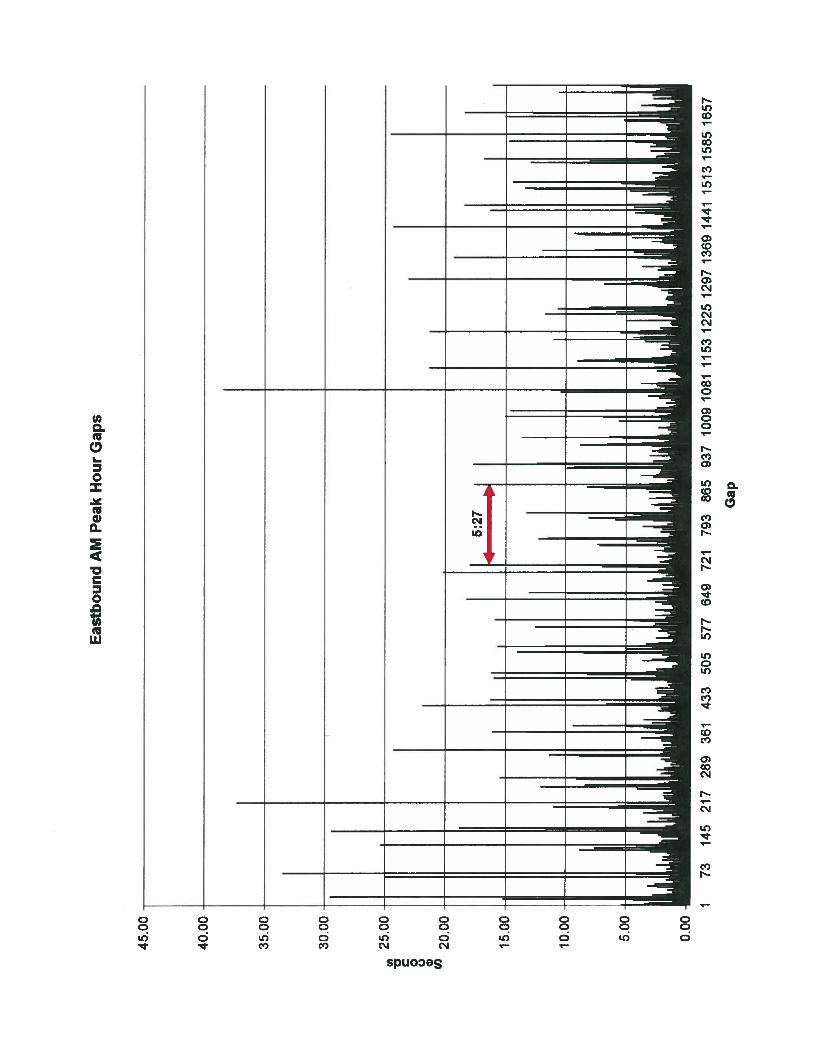
Eas
tbound
AM
Pea
kH
our
Gap
s
25.0
0
0 w20
.00
15.0
0
10.0
0
5.00
45.0
0
40.0
0
35.0
0
30.0
0
5:27
0.00
173
145
217
289
361
433
505
577
649
721
Ii.III
.1Ii
‘79
386
593
710
0910
8111
5312
2512
9713
6914
4115
1315
8516
57
Gap
iiJ
IlLI1
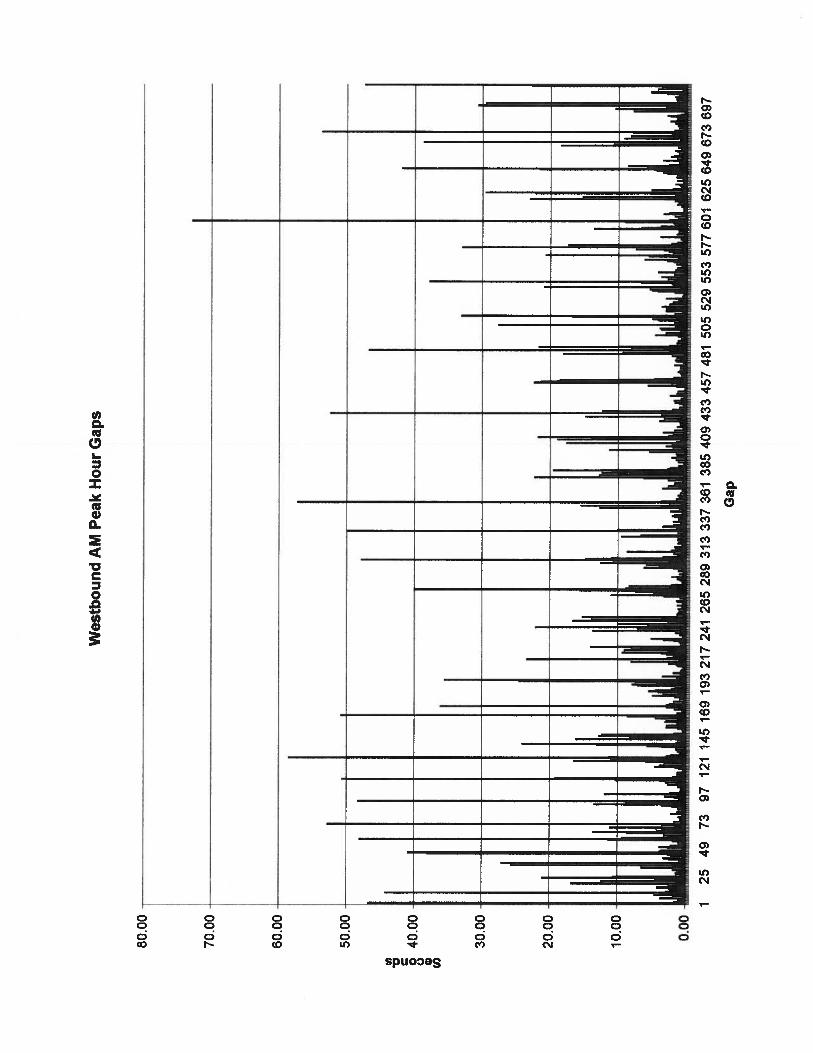
Wes
tbo
un
dA
MP
eak
Hou
rG
aps
80.0
0
70.0
0
60.0
0
50.0
0
0
40.0
0
30.0
0
20.0
0
10.0
0
0.00
125
4973
9712
114
516
919
321
724
126
528
931
333
736
138
540
943
345
748
150
552
955
357
760
162
564
967
369
7
Gap
:
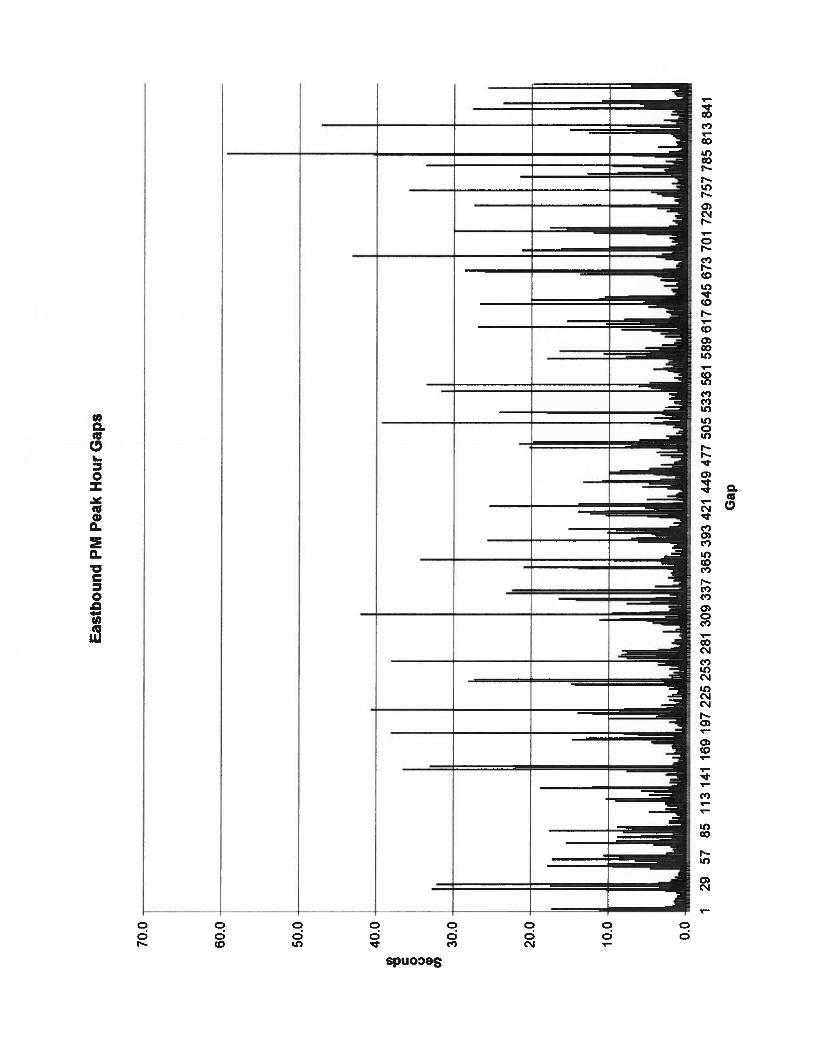
70.0
60.0
50.0
Eas
tbound
PMP
eak
Hou
rG
aps
U) C 0 C., Cl)
40.0
30.0
20.0
10.0 0.0
I29
5785
113
141
169
197
225
253
281
309
337
365
393
421
449
477
505
533
561
589
617
645
673
701
729
757
785
813
841
Gap
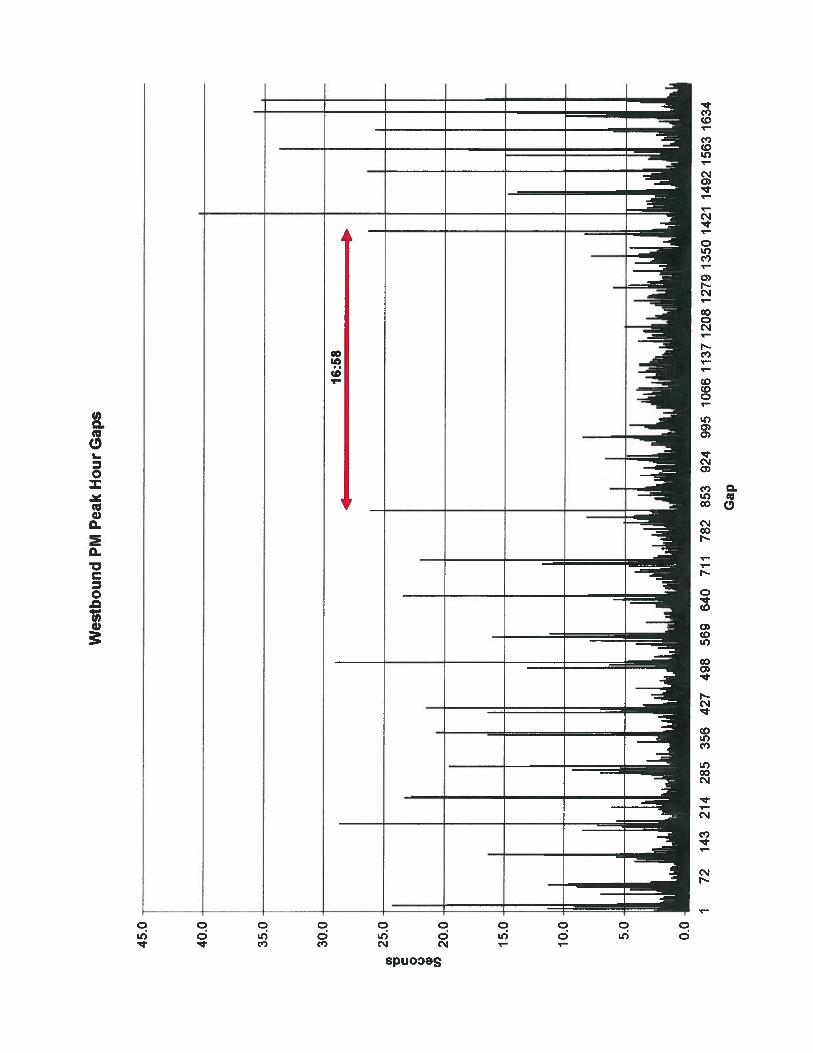
0 C.) Cl)
45.0
40.0
35.0
Wes
tbou
ndPM
Pea
kH
our
Gap
s
30.0
25.0
20.0
15.0
416
:58
II
1iI I
I]
.1IL
Ihu
lLII
IJ
[lii
iI..
172
143
214
285
356
427
498
569
640
711
782
853
924
995
1066
1137
1208
1279
1350
1421
1492
1563
1634
Gap

•I
0
• •‘%•_• •-
4.