traffic safety evaluation at reduced conflict
TRANSCRIPT

Traffic Safety Evaluation at Reduced Conflict Intersections in Minnesota
Max Moreland, PE, PTOE, Principal InvestigatorMinnesota Department of TransportationOffice of Traffic Engineering
AUGUST 2021
Research Report Final Report 2021-22
Office of Research & Innovation • mndot.gov/research

To request this document in an alternative format, such as braille or large print, call 651-366-4718 or 1-800-657-3774 (Greater Minnesota) or email your request to [email protected]. Please request at least one week in advance.
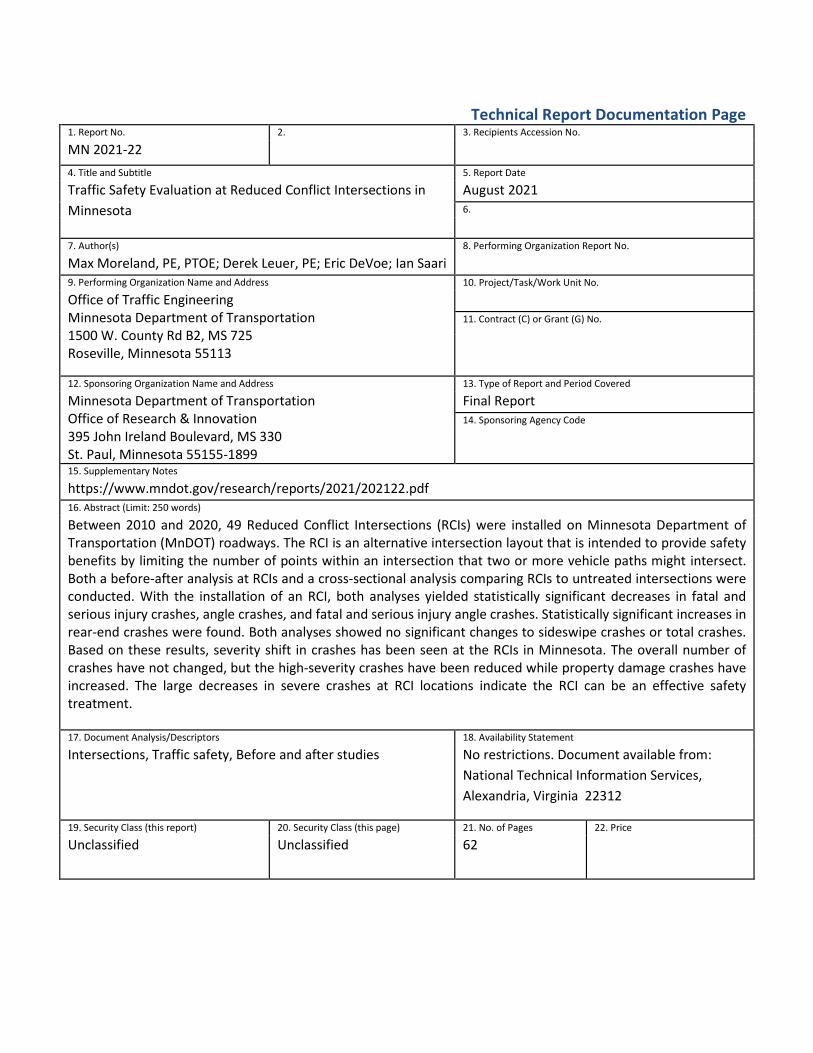
Technical Report Documentation Page 1. Report No.
MN 2021-22 2. 3. Recipients Accession No.
4. Title and Subtitle
Traffic Safety Evaluation at Reduced Conflict Intersections in 5. Report Date
August 2021 Minnesota 6.
7. Author(s)
Max Moreland, PE, PTOE; Derek Leuer, PE; Eric DeVoe; Ian Saari 8. Performing Organization Report No.
9. Performing Organization Name and Address
Office of Traffic Engineering Minnesota Department of Transportation 1500 W. County Rd B2, MS 725 Roseville, Minnesota 55113
10. Project/Task/Work Unit No.
11. Contract (C) or Grant (G) No.
12. Sponsoring Organization Name and Address
Minnesota Department of Transportation Office of Research & Innovation 395 John Ireland Boulevard, MS 330 St. Paul, Minnesota 55155-1899
13. Type of Report and Period Covered
Final Report 14. Sponsoring Agency Code
15. Supplementary Notes
https://www.mndot.gov/research/reports/2021/202122.pdf 16. Abstract (Limit: 250 words)
Between 2010 and 2020, 49 Reduced Conflict Intersections (RCIs) were installed on Minnesota Department of Transportation (MnDOT) roadways. The RCI is an alternative intersection layout that is intended to provide safety benefits by limiting the number of points within an intersection that two or more vehicle paths might intersect. Both a before-after analysis at RCIs and a cross-sectional analysis comparing RCIs to untreated intersections were conducted. With the installation of an RCI, both analyses yielded statistically significant decreases in fatal and serious injury crashes, angle crashes, and fatal and serious injury angle crashes. Statistically significant increases in rear-end crashes were found. Both analyses showed no significant changes to sideswipe crashes or total crashes. Based on these results, severity shift in crashes has been seen at the RCIs in Minnesota. The overall number of crashes have not changed, but the high-severity crashes have been reduced while property damage crashes have increased. The large decreases in severe crashes at RCI locations indicate the RCI can be an effective safety treatment.
17. Document Analysis/Descriptors
Intersections, Traffic safety, Before and after studies 18. Availability Statement
No restrictions. Document available from: National Technical Information Services, Alexandria, Virginia 22312
19. Security Class (this report)
Unclassified 20. Security Class (this page)
Unclassified 21. No. of Pages
62 22. Price

TRAFFIC SAFETY EVALUATION AT REDUCED CONFLICT
INTERSECTIONS IN MINNESOTA
FINAL REPORT
Prepared by:
Max Moreland, PE, PTOE
Derek Leuer, PE
Eric DeVoe
Ian Saari
Minnesota Department of Transportation
Office of Traffic Engineering
AUGUST 2021
Published by:
Minnesota Department of Transportation
Office of Research & Innovation
395 John Ireland Boulevard, MS 330
St. Paul, Minnesota 55155-1899
This report represents the results of research conducted by the authors and does not necessarily represent the views or policies
of the Minnesota Department of Transportation. This report does not contain a standard or specified technique.
The authors and the Minnesota Department of Transportation do not endorse products or manufacturers. Trade or
manufacturers’ names appear herein solely because they are considered essential to this report.

TABLE OF CONTENTS
CHAPTER 1: Introduction ....................................................................................................................1
CHAPTER 2: History of RCIs in Minnesota ............................................................................................3
CHAPTER 3: Methodology ..................................................................................................................4
3.1 Locations ............................................................................................................................................. 4
3.2 Crash Data ........................................................................................................................................... 5
3.3 Analysis Overview ............................................................................................................................... 5
CHAPTER 4: Results ............................................................................................................................7
4.1 Before-After Analysis .......................................................................................................................... 7
4.1.1 Question Addressed .................................................................................................................... 7
4.1.2 Locations ..................................................................................................................................... 7
4.1.3 Crash Data ................................................................................................................................... 8
4.1.4 Crash Analysis .............................................................................................................................. 8
4.2 Cross-Sectional Analysis ................................................................................................................... 10
4.2.1 Question Addressed .................................................................................................................. 10
4.2.2 Locations ................................................................................................................................... 10
4.2.3 Crash Data ................................................................................................................................. 11
4.2.4 Crash Analysis ............................................................................................................................ 13
4.3 Comparative Low-Volume Interchange and Rural SIgnal Analysis ................................................... 14
4.3.1 Question Addressed .................................................................................................................. 14
4.3.2 Locations ................................................................................................................................... 14
4.3.3 Crash Data ................................................................................................................................. 14
4.3.4 Crash Analysis ............................................................................................................................ 16
CHAPTER 5: CONCLUSIONS ............................................................................................................... 19
APPENDIX A RCI Locations & Characteristics
APPENDIX B RCI Crash Data By Severity And Type Per Year
APPENDIX C RCI Severe Crash Details
APPENDIX D RCI Construction Year Severe Crashes
APPENDIX E RCI Target Crash Type Breakdowns

LIST OF FIGURES
Figure 1.1 - Standard At-Grade Expressway Intersection Layout ................................................................. 1
Figure 1.2 - Standard At-Grade Expressway Intersection Layout ................................................................. 1
Figure 3.1 - RCI Locations in Minnesota ........................................................................................................ 4
Figure 4.1 – Locations for Before-After Analysis .......................................................................................... 7
Figure 4.2 – Locations for Cross-Sectional Analysis .................................................................................... 11
Figure 4.3 – Comparative Analysis Severe Crash Rates .............................................................................. 16
Figure 4.4 – Comparative Analysis Other Crash Rates ................................................................................ 16
LIST OF TABLES
Table 2.1 - Number of RCIs Constructed Each Year in Minnesota ................................................................ 3
Table 4.1 - Before-After Crash Data at RCIs .................................................................................................. 8
Table 4.2 - Results of Wilcoxon Signed-Rank Test for Before-After Analysis at RCIs.................................... 9
Table 4.3 - Cross-Sectional Analysis Entering Volumes .............................................................................. 12
Table 4.4 - Cross-Sectional Crash Counts .................................................................................................... 12
Table 4.5 - Cross-Sectional Crash Rates ...................................................................................................... 12
Table 4.6 - Results of Mann-Whitney U-Test for Cross-Sectional Analysis ................................................. 13
Table 4.7 - 2017-2019 Comparative Analysis Entering Volumes ................................................................ 15
Table 4.8 - 2017-2019 Comparative Analysis Crash Volumes ..................................................................... 15
Table 4.9 - 2017-2019 Comparative Analysis Crash Rates .......................................................................... 15
Table 4.10 - 2017-2019 Comparative Analysis Significance Testing Results .............................................. 17

LIST OF ABBREVIATIONS & DEFINITIONS OF TERMS
Acronym Meaning KA Fatal and Serious Injury Crash MEV Million Entering Vehicles MnDOT Minnesota Department of Transportation RCI Reduced Conflict Intersection RCUT Restricted Crossing U-Turn Crash Severities
K Crash: Fatal crash. At least one person involved in the crash died as a result of injuries sustained in the crash.
A Crash: Suspected serious injury crash. The crash resulted in a suspected serious injury for at least one person involved in the crash.
B Crash: Suspected minor injury crash. The crash resulted in a suspected minor injury for at least one person involved in the crash.
C Crash: Possible injury crash. The crash resulted in a possible injury for at least one person involved in the crash.
N Crash: Property damage only crash. The crash resulted in property damage with no injuries for anyone involved in the crash.
Crash Types:
Angle: The front of a vehicle strikes the side of another vehicle at a perpendicular angle.
Rear End: The front of a vehicle strikes the rear of another vehicle travelling in the same direction.
Sideswipe: A vehicle strikes another vehicle in an indirect way that results in the sides of each vehicle colliding with one another. This can occur when vehicles are travelling in either the same or opposite directions.
Intersection Related: This can include any type of crash but is specifically noted by the officer writing the crash report that it occurred in a manner or at a location that is related to an intersection.
Other Definitions:
Site-Year: One year of data at a site.

EXECUTIVE SUMMARY
Between 2010 and 2020, 49 Reduced Conflict Intersections (RCIs) were installed on Minnesota Department of Transportation (MnDOT) roadways. The RCI is an alternative intersection layout that is intended to provide safety benefits by limiting the number of points within an intersection that two or more vehicle paths might intersect. Specifically, the design of the intersection is intended to reduce the likelihood that vehicles travelling in different directions will collide at various angles thereby reducing the number of crashes that result in fatalities or serious injuries. This report includes the results of both a before-after analysis at RCIs and a cross-sectional analysis comparing RCIs to untreated intersections. With the installation of an RCI, the before-after analysis yielded the following statistically significant results:
69% decrease in fatal and serious injury crashes
70% decrease in angle crashes
100% decrease in fatal and serious injury angle crashes
103% increase in rear-end crashes The cross-sectional analysis delivered similar results. There were clear and statistically significant reductions in the number of fatal and serious injury crashes reported after these intersections were converted to RCIs. Both analyses showed no significant changes to sideswipe crashes or total crashes. Based on these results, severity shift in crashes has been seen at the RCIs in Minnesota. The overall number of crashes have not changed, but the high-severity crashes have been reduced while property damage crashes increased. The large decreases in severe crashes at RCI locations indicate the RCI can be an effective safety treatment.

1
CHAPTER 1: INTRODUCTION
A Reduced Conflict Intersection (RCI), also known as a Restricted Crossing U-Turn (RCUT) or J-turn, is an
at-grade intersection design used on high-speed, multi-lane expressways. The goal of an RCI is to improve
safety by reducing the number and severity of angle crashes. From 2015 through 2019, 18% of all fatal
and serious injury crashes in Minnesota were caused by angle crashes at intersections. Figure 1.1 shows
the layout of a standard at-grade expressway intersection and Figure 1.2 shows the layout of an RCI.
Figure 1.1 - Standard At-Grade Expressway Intersection Layout
Figure 1.2 - Standard At-Grade Expressway Intersection Layout
At an RCI, vehicles on the mainline retain full access while those on the crossroad may only make right
turns. Vehicles on the crossroad wishing to either turn left onto the mainline or continue straight through
on the crossroad must make a right turn onto the mainline then make a U-turn to get onto the opposing
direction of the mainline. Those vehicles can then turn right onto the crossroad or stay on the mainline.
While the travel distance for those vehicles is increased, travel time is typically not significantly impacted
due to the need to only find gaps in one direction of opposing traffic at a time at an RCI.

2
With the RCI eliminating the option for vehicles on the crossroad to travel straight through the middle of
the intersection, the overall likelihood of right-angle crashes is reduced. Right-angle crashes, commonly
referred to as T-bone crashes, often have severe outcomes.
High-speed roadways with wide medians and/or side-street stop-controlled intersections may present
greater risk of severe angle crashes. Potential solutions at these sites include signals, RCIs, or grade
separation. Signalization often does not protect angle crashes while grade separation is often cost
prohibitive. This RCIs are a lower-cost strategy that may be more effective at reducing these severe angle
crashes.
The purpose of this evaluation is to review the crash history at RCIs in Minnesota to determine what
impact the installation of RCIs has on crashes and crash severity. Crashes at RCIs will also be compared
against crashes at rural signals on high-speed roadways as well as at low-volume interchanges.

3
CHAPTER 2: HISTORY OF RCIs IN MINNESOTA
The first RCI in Minnesota was installed during 2010 in Willmar. As of the end of 2020, there were 49 RCIs
in Minnesota. There are 34 more RCIs that are either already planned or under consideration for
construction in the next few years. Table 2.1 lists the number of RCIs constructed each year in Minnesota.
Table 2.1 - Number of RCIs Constructed Each Year in Minnesota
Year Number of RCIs Constructed
2010 1
2011 0
2012 4
2013 1
2014 3
2015 2
2016 2
2017 8
2018 7
2019 14
2020 7
The RCIs in Minnesota include a variety of layouts. RCIs are at both four and three-leg intersections,
include U-turns on either both sides or just one side of the intersection, have medians that have one or
two left turning movements, and have U-turn distances that range from 350 feet to 2100 feet away from
the center of the intersection. One RCI in Minnesota is signalized while the rest are unsignalized.
Many of the earlier RCI locations were likely selected as reactive safety treatments due to high crash rates
and/or frequent severe crashes. Some of the later RCIs were selected as proactive safety treatments.
Appendix A lists traits and locations of each of the existing RCIs in Minnesota.

4
CHAPTER 3: METHODOLOGY
3.1 LOCATIONS
As mentioned, there are 49 RCIs that have been constructed in Minnesota through the year 2020.
Appendix A lists traits and locations of each of the existing RCIs in Minnesota. Figure 3.1 shows those
locations on a map. As mentioned, there are also 34 locations where RCIs are either planned or under
consideration to be constructed in the next few years.
Figure 3.1 - RCI Locations in Minnesota
5
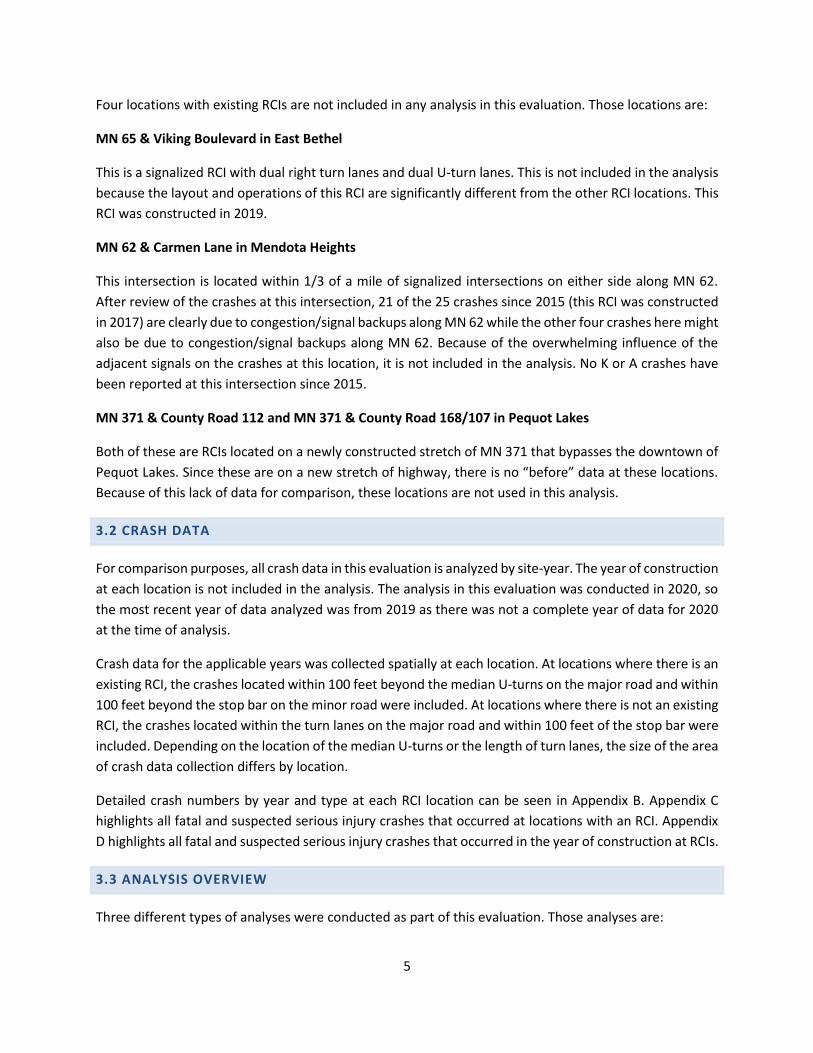
Four locations with existing RCIs are not included in any analysis in this evaluation. Those locations are:
MN 65 & Viking Boulevard in East Bethel
This is a signalized RCI with dual right turn lanes and dual U-turn lanes. This is not included in the analysis
because the layout and operations of this RCI are significantly different from the other RCI locations. This
RCI was constructed in 2019.
MN 62 & Carmen Lane in Mendota Heights
This intersection is located within 1/3 of a mile of signalized intersections on either side along MN 62.
After review of the crashes at this intersection, 21 of the 25 crashes since 2015 (this RCI was constructed
in 2017) are clearly due to congestion/signal backups along MN 62 while the other four crashes here might
also be due to congestion/signal backups along MN 62. Because of the overwhelming influence of the
adjacent signals on the crashes at this location, it is not included in the analysis. No K or A crashes have
been reported at this intersection since 2015.
MN 371 & County Road 112 and MN 371 & County Road 168/107 in Pequot Lakes
Both of these are RCIs located on a newly constructed stretch of MN 371 that bypasses the downtown of
Pequot Lakes. Since these are on a new stretch of highway, there is no “before” data at these locations.
Because of this lack of data for comparison, these locations are not used in this analysis.
3.2 CRASH DATA
For comparison purposes, all crash data in this evaluation is analyzed by site-year. The year of construction
at each location is not included in the analysis. The analysis in this evaluation was conducted in 2020, so
the most recent year of data analyzed was from 2019 as there was not a complete year of data for 2020
at the time of analysis.
Crash data for the applicable years was collected spatially at each location. At locations where there is an
existing RCI, the crashes located within 100 feet beyond the median U-turns on the major road and within
100 feet beyond the stop bar on the minor road were included. At locations where there is not an existing
RCI, the crashes located within the turn lanes on the major road and within 100 feet of the stop bar were
included. Depending on the location of the median U-turns or the length of turn lanes, the size of the area
of crash data collection differs by location.
Detailed crash numbers by year and type at each RCI location can be seen in Appendix B. Appendix C
highlights all fatal and suspected serious injury crashes that occurred at locations with an RCI. Appendix
D highlights all fatal and suspected serious injury crashes that occurred in the year of construction at RCIs.
3.3 ANALYSIS OVERVIEW
Three different types of analyses were conducted as part of this evaluation. Those analyses are:
6
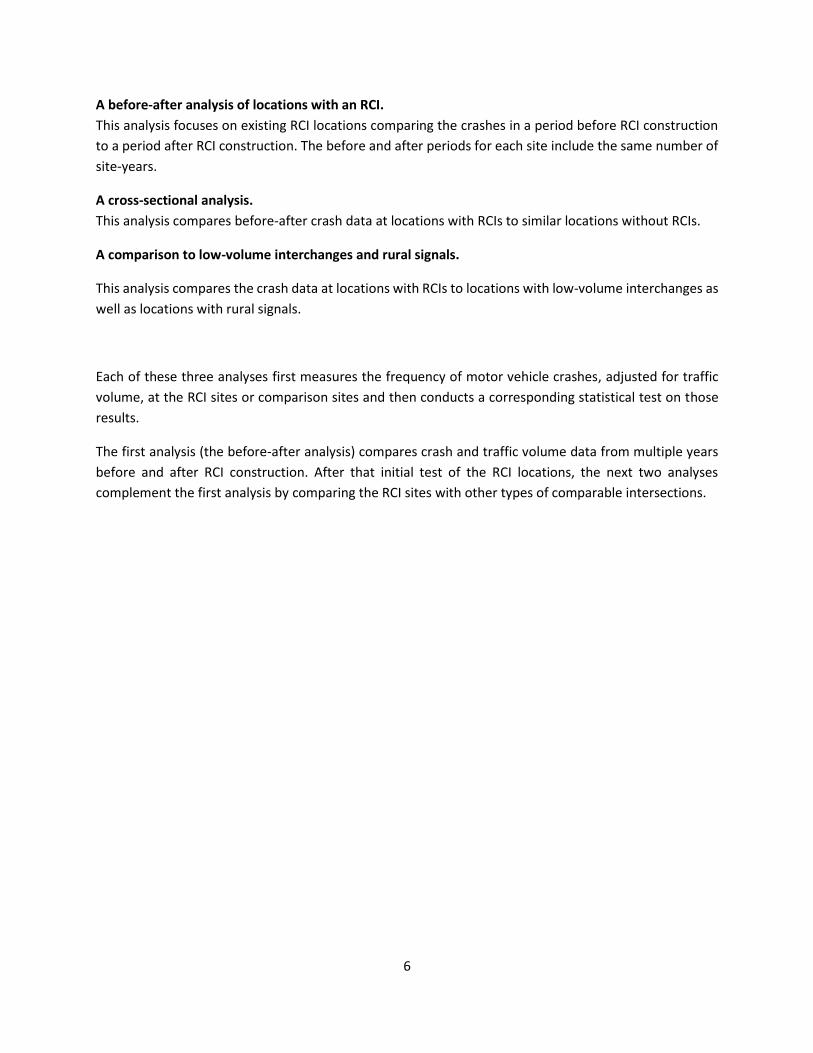
A before-after analysis of locations with an RCI.
This analysis focuses on existing RCI locations comparing the crashes in a period before RCI construction
to a period after RCI construction. The before and after periods for each site include the same number of
site-years.
A cross-sectional analysis.
This analysis compares before-after crash data at locations with RCIs to similar locations without RCIs.
A comparison to low-volume interchanges and rural signals.
This analysis compares the crash data at locations with RCIs to locations with low-volume interchanges as
well as locations with rural signals.
Each of these three analyses first measures the frequency of motor vehicle crashes, adjusted for traffic
volume, at the RCI sites or comparison sites and then conducts a corresponding statistical test on those
results.
The first analysis (the before-after analysis) compares crash and traffic volume data from multiple years
before and after RCI construction. After that initial test of the RCI locations, the next two analyses
complement the first analysis by comparing the RCI sites with other types of comparable intersections.

7
CHAPTER 4: RESULTS
4.1 BEFORE-AFTER ANALYSIS
The before-after analysis compares crash data at RCI locations before the RCI was installed and after the
RCI was installed.
4.1.1 Question Addressed
How do crashes change after an RCI is installed at a location?
4.1.2 Locations
The analysis for this evaluation was conducted in the year 2020. Without having a full year of crash data
for 2020, there is no after data for the RCIs constructed in 2019 or 2020. Those locations are therefore
not utilized in the analysis as treatment sites.
This leaves 25 RCI locations that have at least one site-year of before and one site-year of after data which
totals to 89 site-years of before data and 89 site-years of after data. Figure 4.1 shows the locations of the
included sites.
Figure 4.1 – Locations for Before-After Analysis

8
4.1.3 Crash Data
The before-after crash data at the 25 RCI locations was collected and compiled. Table 4.1 shows that
compiled crash data. The total entering volumes (sum of daily volumes at each site) were 696,248,993
vehicles in the before scenarios and 720,974,828 vehicles in the after scenarios. Crash rates, in units of
crashes per million entering vehicles (MEV), for the before-after scenarios are also included in Table 4.1.
A graphical breakdown showing the locations of the after crashes at RCIs for angle, rear end, and
sideswipe crashes can be seen in Appendix E.
Table 4.1 - Before-After Crash Data at RCIs
Crash Severity/Type Before
# of Crashes After
# of Crashes Before
Crash Rate After
Crash Rate
K Crashes 10 1 0.014 0.001
A Crashes 12 6 0.017 0.008
KA Crashes 22 7 0.032 0.010
B Crashes 59 26 0.085 0.036
C Crashes 79 56 0.113 0.078
N Crashes 186 245 0.267 0.340
Total Crashes 346 334 0.497 0.463
Angle Crashes 127 39 0.182 0.054
KA Angle Crashes 15 0 0.022 0.000
Intersection Related Crashes 209 133 0.300 0.184
Rear-End Crashes 56 118 0.080 0.164
Sideswipe Crashes 35 48 0.050 0.067
4.1.4 Crash Analysis
To compare the before-after crash data samples, a Wilcoxon signed-rank test was used. Like a paired
samples t-test, this test is used to compare two related (or dependent) samples with independent
observations. However, the Wilcoxon signed-rank test does not require normality in the data which was
needed given the unique distribution of the sample data. The Wilcoxon Signed Rank Test tests the
assumptions of a null hypothesis, although this test will not be comparing averages by relying on
differences in group means. Since this test converts all of the observed values into two ordinal sets of
ranks, the measure we are using for each group’s average will be its median (or middle) value. For this
analysis, the null hypothesis being tested is that the median difference between paired observations at
the RCIs sites is equal to zero (i.e., the two distributions are the same). The alternative hypothesis being
tested is that the median difference between pairs of the sample observations is not equal to zero (i.e.,
the two distributions are different).
The analysis and testing were focused on six crash severities/types. These are based on both the expected
benefits of RCIs as well as commonly heard concerns about RCIs. These focus types are listed below.
Fatal (K) and suspected serious injury (A) crashes. RCIs are an alternative intersection intended to
improve safety by reducing crashes with these serious outcomes.

9
Angle crashes. This is the target crash type RCIs are intended to reduce.
K and A angle crashes. These are the most severe outcome types of the target crash type that RCIs
are intended to reduce.
Rear-end crashes. It is commonly heard that RCIs will contribute to an increase in rear-end
crashes.
Sideswipe crashes. It is commonly heard that RCIs will contribute to an increase in sideswipe
crashes.
Total crashes. RCIs are intended to reduce the most severe types of crashes at the intersections
they are installed at, but not necessarily intended to reduce overall crashes.
The Wilcoxon signed-rank test results in a p-value which is compared to a predetermined threshold
significance level of 0.05 in this case. When the p-value is below the significance level, the null hypothesis
is rejected in favor of the alternative hypothesis suggesting there is a significant difference in the before-
after results. The results are shown in Table 4.2.
Table 4.2 - Results of Wilcoxon Signed-Rank Test for Before-After Analysis at RCIs
Category Change in Crash Rate
p-value Significant?
KA Crashes -69.3% 0.030 Yes
Angle Crashes -70.3% 0.001 Yes
KA Angle Crashes -100.0% 0.005 Yes
Rear-End Crashes +103.5% 0.002 Yes
Sideswipe Crashes +32.4% 0.316 No
Total Crashes -6.8% 0.737 No
As seen in Table 4.2, the conversion of these intersections to RCIs resulted in statistically significant
decreases in fatal and serious injury crashes (KA crashes), angle crashes, and fatal and serious injury angle
crashes. Additionally, there was found to be a statistically significant increase in rear-end crashes as a
result of the conversions to RCIs. Though there were increases in sideswipe crashes and decreases in total
crashes, these changes were not found to be statistically significant.
As seen in Table 4.1, the crash rates for all injury type crashes decreased with the installation of RCIs, but
the crash rates for non-injury crashes (property damage only crashes) increased. With no statistically
significant change in total crashes shown in Table 4.2, the data is suggesting the installation of RCIs result
in a severity shift of crashes from higher to lower severities.
It is noted that the crash reporting system behind the crash data in Minnesota underwent changes in the
beginning of 2016. While this upgrade improved the crash data system in many ways, a change in the
percentage of injury severity crashes was found. Two injury severity definitions were changed to align
with national standard definitions, though the underlying scale used to rank crash severity remained
unchanged.
“A – Incapacitating injury” became “A – Suspected serious injury”
“B – Non-incapacitating injury” became “B – Suspected minor injury”

10
As the result of these label changes, Minnesota experienced a dramatic increase in A and B severity
crashes from 2015 to 2016 (increasing by 83% and 51% for A and B crashes, respectively). Based on this
change, some of the locations in the before-after analyses may have been impacted. However, Table 4.1
shows that A and B severity crashes both experienced large decreases at the RCI locations. This
emphasizes the decreases seen at RCI locations.
4.2 CROSS-SECTIONAL ANALYSIS
The cross-sectional analysis takes a group of locations that have RCIs at them (treatment sites) and
compares the before-after crash data there against the before-after crash data at a group of similar
intersections without RCIs (control sites).
4.2.1 Question Addressed
How much of the crash reduction can be attributed to RCIs?
4.2.2 Locations
For this comparison, only RCI locations that had at least three years of “after” data were included. There
are 13 locations that have RCIs during this 2017 through 2019 period.
For the control group, these locations should be similar to the treatment sites but cannot have had an RCI
at them during the entire 2017 through 2019 period. The sites that were included in this group were the
seven locations where RCIs were constructed in 2020, the 34 locations with future RCIs
planned/considered, and one additional location that was a potential RCI site but ended up with a more
standard intersection reconstruction in 2020. That totaled to 42 locations for the control group.
When determining control sites to be used in a comparison group against treatment sites, locations are
typically chosen that have similar characteristics to the treatment sites. Since the control group in this
evaluation is made up of sites that are also selected for RCIs, the characteristics are therefore similar to
the treatment sites. However, these locations for future RCIs may have been chosen due to a crash history
at the site which could introduce some bias into the results of the comparison. RCI location selection is
not exclusively based on crash history and, due to the similar characteristics of these intersections, this
control group is used in the analysis with the potential bias noted.
Figure 4.2 shows the locations of the control and treatment sites used in this analysis.
11
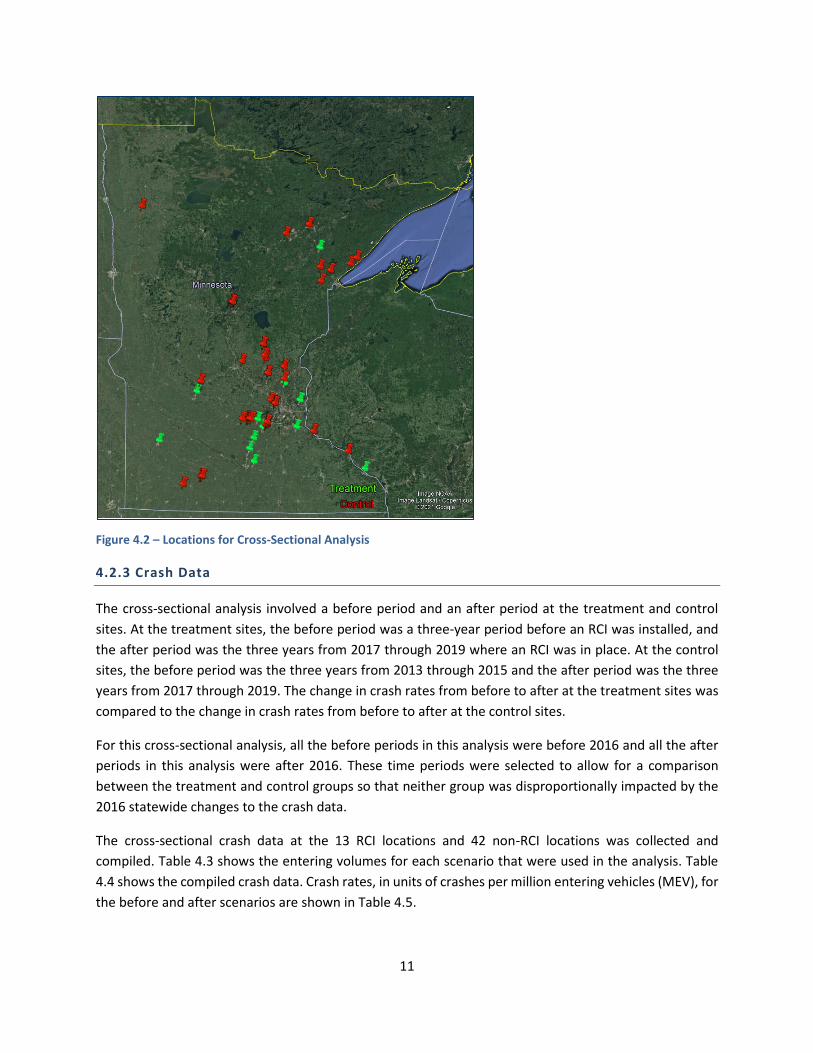
Figure 4.2 – Locations for Cross-Sectional Analysis
4.2.3 Crash Data
The cross-sectional analysis involved a before period and an after period at the treatment and control
sites. At the treatment sites, the before period was a three-year period before an RCI was installed, and
the after period was the three years from 2017 through 2019 where an RCI was in place. At the control
sites, the before period was the three years from 2013 through 2015 and the after period was the three
years from 2017 through 2019. The change in crash rates from before to after at the treatment sites was
compared to the change in crash rates from before to after at the control sites.
For this cross-sectional analysis, all the before periods in this analysis were before 2016 and all the after
periods in this analysis were after 2016. These time periods were selected to allow for a comparison
between the treatment and control groups so that neither group was disproportionally impacted by the
2016 statewide changes to the crash data.
The cross-sectional crash data at the 13 RCI locations and 42 non-RCI locations was collected and
compiled. Table 4.3 shows the entering volumes for each scenario that were used in the analysis. Table
4.4 shows the compiled crash data. Crash rates, in units of crashes per million entering vehicles (MEV), for
the before and after scenarios are shown in Table 4.5.

12
Table 4.3 - Cross-Sectional Analysis Entering Volumes
Treatment
Before Treatment
After Control Before
Control After
Total Entering Volume (sum of daily volumes at
each site) 284,836,328 301,404,590 800,142,753 848,273,323
Table 4.4 - Cross-Sectional Crash Counts
Crash Severity/Type Treatment
Before # of Crashes
Treatment After
# of Crashes
Control Before
# of Crashes
Control After
# of Crashes
K Crashes 4 1 5 3
A Crashes 6 4 7 8
KA Crashes 10 5 12 11
B Crashes 33 11 42 53
C Crashes 37 28 57 43
N Crashes 86 104 196 173
Total Crashes 166 148 307 282
Angle Crashes 57 18 99 114
KA Angle Crashes 7 0 9 11
Intersection Related Crashes 105 55 184 187
Rear-End Crashes 26 61 53 65
Sideswipe Crashes 19 15 41 22
Table 4.5 - Cross-Sectional Crash Rates
Crash Severity/Type Treatment
Before Crash Rate
Treatment After
Crash Rate
Control Before
Crash Rate
Control After
Crash Rate
K Crashes 0.014 0.003 0.006 0.004
A Crashes 0.021 0.013 0.009 0.009
KA Crashes 0.035 0.017 0.015 0.013
B Crashes 0.116 0.036 0.052 0.062
C Crashes 0.130 0.093 0.071 0.051
N Crashes 0.302 0.345 0.245 0.204
Total Crashes 0.583 0.491 0.384 0.332
Angle Crashes 0.200 0.060 0.124 0.134
KA Angle Crashes 0.025 0.000 0.011 0.013
Intersection Related Crashes 0.369 0.182 0.230 0.220
Rear-End Crashes 0.091 0.202 0.066 0.077
Sideswipe Crashes 0.067 0.050 0.051 0.026

13
4.2.4 Crash Analysis
For the cross-sectional crash data analysis, a Mann-Whitney U-Test was used. Like with the previous
analysis, it is necessary to use a nonparametric test because the sampled crash rates are not normally
distributed. Also like the previous test, a Mann-Whitney U test the assumptions of a null hypothesis,
although this test will not be comparing averages by relying on differences in group means. Since this test
converts all of the observed values into two ordinal sets of ranks, the measure we are using for each
group’s average will be its median (or middle) value.
For this analysis, the null hypothesis being tested is that the median difference between pairs of
observations from the two groups (RCI treatment and control) is equal to zero. The alternative hypothesis
being tested is that the median difference between pairs of observations from the two groups is not equal
to zero. Here, the observations being compared are the sites’ crash reduction factors, or the observed
percentage decrease in crashes at the treatment and control sites.
The Mann-Whitney U-Test produces a test statistic with a corresponding p-value, which is then compared
to a predetermined alpha level (in this case, alpha = 0.05) to evaluate the null hypothesis. If the test
produces a result with a p-value that is less that the threshold significance level, the null hypothesis is
rejected in favor of the alternative hypothesis. The results are shown in Table 4.6.
Table 4.6 - Results of Mann-Whitney U-Test for Cross-Sectional Analysis
Category Treatment % Change
Control % Change
p-value Significant? Result Interpretation
KA Crashes -52.75% -13.53% <0.001 Yes KA crashes at RCIs <
KA crashes at controls
Angle Crashes -70.16% 8.62% <0.001 Yes Angle crashes at RCIs <
Angle crashes at controls
KA Angle Crashes -100.00% 15.29% <0.001 Yes KA Angle crashes at RCIs <
KA Angle crashes at controls
Rear-End Crashes 121.72% 15.68% <0.001 Yes Rear-end crashes at RCIs >
Rear-end crashes at controls
Sideswipe Crashes -25.39% -49.39% 0.098 No* Sideswipe crashes at RCIs =
Sideswipe crashes at controls
Total Crashes -15.74% -13.36% 0.890 No Total crashes at RCIs =
Total crashes at controls *Statistically significant at ɑ = 0.10
As seen in Table 4.6, the RCI sites showed statistically significant decreases in fatal and serious injury (KA)
crashes, angle crashes, and fatal and serious injury (KA) angle crashes. These results line up with the goals
of RCIs and are similar to what was seen in the before-after analysis. The installation of RCIs also showed
a statistically significant increase in rear-end crashes with no statistically significant changes at the 0.05
significance level for sideswipe or total crashes.

14
4.3 COMPARATIVE LOW-VOLUME INTERCHANGE AND RURAL SIGNAL ANALYSIS
RCIs typically replace side-street, stop-controlled intersections on high-speed expressways. One
alternative to the RCI would be a grade separated intersection, or an interchange. Interchanges require
more right-of-way and have significantly higher costs associated with them as compared to an RCI.
Another alternative to the RCI would be a signalized intersection.
This analysis compares the crash data at interchanges with volumes similar to what would be found at an
RCI as well as at signalized intersections with volumes and characteristics similar to what would be found
at an RCI to the crash data at RCIs.
4.3.1 Question Addressed
How do RCIs compare with alternative strategies for high-speed expressway intersections?
4.3.2 Locations
There are over 700 interchanges in Minnesota including many that serve very high volumes of traffic. To
be able to get a set of interchanges that would be able to be meaningfully compared to RCIs, the volumes
had to be considered. High volume interchanges, such as those that serve the meeting of two Interstate
Highway System routes, would not be locations where an RCI would ever be considered. Because of that,
only low-volume interchanges were selected. Low volume, in this case, means daily volumes of 45,000 or
less on the mainline with average daily volumes of 6,000 or less on the minor approaches. These volumes
represent the upper end of the volumes seen at RCIs in Minnesota. Using those filters, 225 interchanges
were selected and crash data from 2017 through 2019 was used.
Signalized intersections are utilized on a wide variety of intersection types, so to get a meaningful
comparison site for RCIs, only signalized intersections that are on high-speed, rural roadways with the
same volume constraints as the low-volume interchanges were used. Signalized intersections that include
interchange ramps were not included. Using those filters, 19 intersections were selected and crash data
from 2017 through 2019 was used.
Like in the cross-sectional analysis, the 13 RCI locations that were fully in place from 2017 through 2019
were used for comparison. Using only 2017 through 2019 data avoids any inconsistencies between the
pre-2016 and post-2016 crash data due to the statewide changes previously discussed.
4.3.3 Crash Data
The area included when gathering crash data at RCIs was previously discussed. For low-volume
interchanges, all crashes that were located within 100 feet of the physical gore or curb at the outermost
connection of the interchange were included. For rural, high-speed signals, all crashes that were in the
bounds of the turn lanes on all approaches were included.

15
The following tables show the total entering volumes, the number of crashes, and crash rates (crashes per
MEV) from 2017 through 2019 at the selected locations.
Table 4.7 - 2017-2019 Comparative Analysis Entering Volumes
RCI
(13 sites) Rural Signals
(19 sites) Low-Volume Interchanges
(225 sites)
Total Entering Volume (sum of daily volumes at each site)
301,404,590 339,898,950 3,168,166,785
Table 4.8 - 2017-2019 Comparative Analysis Crash Volumes
Table 4.9 - 2017-2019 Comparative Analysis Crash Rates
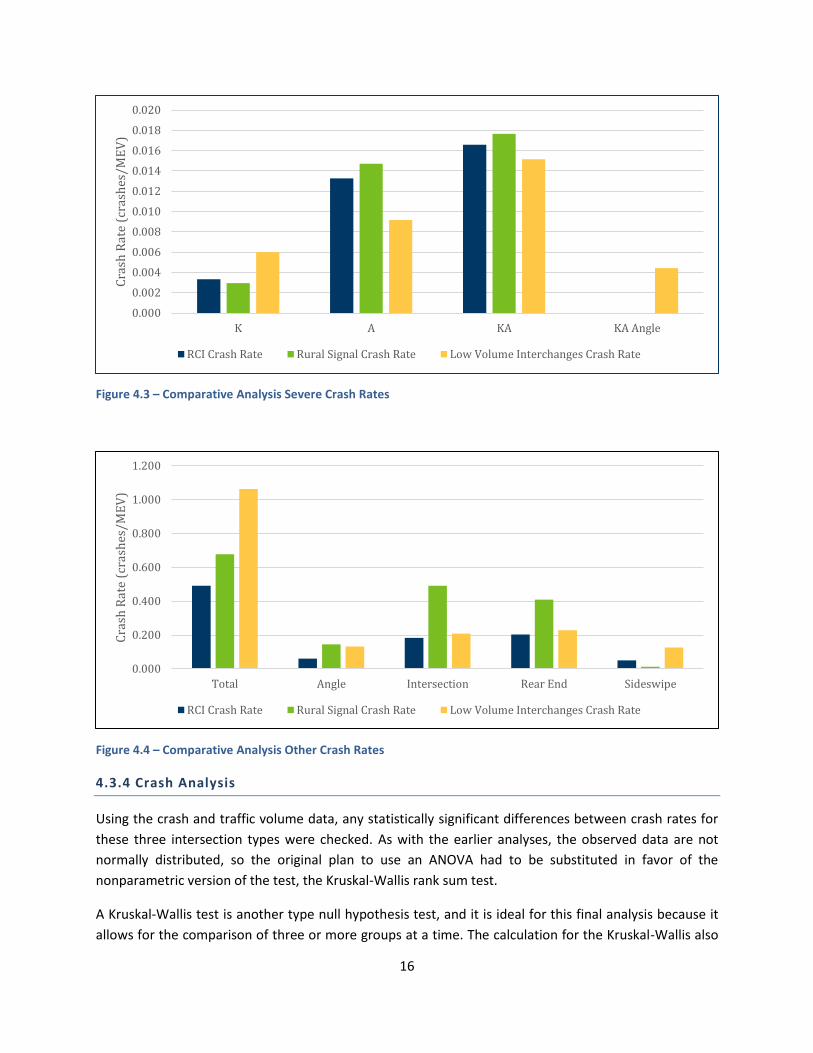
Figures 4.3 and 4.4 illustrate the crash rates of some of the target crash types from Tables 4.8 and 4.9.
Crash Type/Severity RCI
(13 sites) Rural Signals
(19 sites) Low-Volume Interchanges
(225 sites)
K Crashes 1 1 19
A Crashes 4 5 29
B Crashes 11 23 299
C Crashes 28 44 392
N Crashes 104 157 2,628
Total Crashes 148 230 3,367
Angle Crashes 18 49 418
KA Angle Crashes 0 0 14
Intersection Related Crashes 55 167 658
Rear-End Crashes 61 139 722
Sideswipe Crashes 15 4 399
Crash Type/Severity RCI
(13 sites) Rural Signals
(19 sites) Low-Volume Interchanges
(225 sites)
K Crashes 0.003 0.003 0.006
A Crashes 0.013 0.015 0.009
K+A Crashes 0.017 0.018 0.015
Total Crashes 0.491 0.677 1.063
Angle Crashes 0.060 0.144 0.132
KA Angle Crashes 0.000 0.000 0.004
Intersection Related Crashes 0.182 0.491 0.208
Rear-End Crashes 0.202 0.409 0.228
Sideswipe Crashes 0.050 0.012 0.126
16
Figure 4.3 – Comparative Analysis Severe Crash Rates
Figure 4.4 – Comparative Analysis Other Crash Rates
4.3.4 Crash Analysis
Using the crash and traffic volume data, any statistically significant differences between crash rates for
these three intersection types were checked. As with the earlier analyses, the observed data are not
normally distributed, so the original plan to use an ANOVA had to be substituted in favor of the
nonparametric version of the test, the Kruskal-Wallis rank sum test.
A Kruskal-Wallis test is another type null hypothesis test, and it is ideal for this final analysis because it
allows for the comparison of three or more groups at a time. The calculation for the Kruskal-Wallis also
0.000
0.002
0.004
0.006
0.008
0.010
0.012
0.014
0.016
0.018
0.020
K A KA KA Angle
Cra
sh R
ate
(cra
shes
/ME
V)
RCI Crash Rate Rural Signal Crash Rate Low Volume Interchanges Crash Rate
0.000
0.200
0.400
0.600
0.800
1.000
1.200
Total Angle Intersection Rear End Sideswipe
Cra
sh R
ate
(cra
shes
/ME
V)
RCI Crash Rate Rural Signal Crash Rate Low Volume Interchanges Crash Rate

17
differs slightly from the other two nonparametric tests, which use medians as their average values, while
this test computes and compares groups’ mean ranks. Though that is a small mathematical distinction,
for the purpose of this report, there is not a meaningful difference between the median and mean rank
values of the sample groups, so the distinction has little practical significance. This report will continue to
use the term median as the average value tested for the Kruskal-Wallis test since, in many cases, they can
end up being the same.
For the Kruskal-Wallis test, the null hypothesis being tested is that all three groups have equal crash rates
(i.e., the median difference between all three groups of observations is equal to zero). The alternative
hypothesis being tested is that all three groups do not have equal crash rates. In other words, if one
group’s average (median) crash rate is from either of the other two, the null hypothesis would be rejected.
A Wilcoxon rank sum test with continuity correction was then used on the Kruskal-Wallis results to
determine if they are significantly different from one another compared to a significance level of 0.05.
The results of this testing are shown in Table 4.10. Any crash types or severities that did not have a
statistical significance difference between the intersection types are not included in Table 4.10.
Table 4.10 - 2017-2019 Comparative Analysis Significance Testing Results
Crash Type/Severity
RCIs vs Interchanges
p-value
RCIs vs Signals p-value
Signals vs Interchanges
p-valueResult Interpretation
Total Crashes 0.003 0.880 0.005
Total Crashes at Interchanges > Total Crashes at RCIs
& Total Crashes at Interchanges >
Total Crashes at Signals
N Crashes 0.003 0.788 0.003
N Crashes at Interchanges > N Crashes at RCIs
& N Crashes at Interchanges >
N Crashes at Signals
Angle Crashes 0.163 0.092** 0.107
Sideswipe Crashes
0.067** 0.067** 0.001* Sideswipe Crashes at Interchanges >
Sideswipe Crashes at Signals
Intersection Related Crashes
0.183 0.014 0.001*
Intersection Related Crashes at Signals > Intersection Related Crashes at RCIs
& Intersection Related Crashes at Signals >
Intersection Related Crashes at Interchanges
*Less than 0.001**Statistically significant at ɑ = 0.10
Reviewing the results from Table 4.10 and comparing them to Figures 4.3 and 4.4, it can be seen that at a
significance level of 0.05:

18
The average crash rate for total crashes at interchanges is higher than at RCIs and signals.
The average crash rate for property damage only crashes at interchanges is higher than at RCIs and signals.
The average crash rate for sideswipe crashes at interchanges is higher than at signals.
The average crash rate for intersection related crashes at signals is higher than at RCIs and interchanges.
If a significance level of 0.10 were to be used rather than 0.05, the following conclusions could be drawn:
The average crash rate for angle crashes at signals is higher than at RCIs.
The average crash rate for sideswipe crashes at interchanges is higher than at RCIs.
The average crash rate for sideswipe crashes at RCIs is higher than at signals.
With relatively small numbers of K and A crashes at RCIs and rural signals, as shown in Table 4.8, there is
not the ability to draw clear distinctions between the intersection types regarding severe crashes.
RCIs tend to have lower crash rates compared to low-volume interchanges when it comes to overall
crashes and lower crash rates compared to signals when it comes to angle crashes. The low rate of angle
crashes at RCIs is in line with the other results from this study. Though the before-after and cross-sectional
analyses showed increases in rear-end crashes at RCIs, they are not statistically significantly different than
the other intersection types and Figure 4.4 shows they appear to be less common at RCIs than at signals
and interchanges.
Intersection related crashes are crashes that the attending officer determined were located at or
impacted by the presence of an intersection. With RCIs, the area included to collect crashes is quite large
due to the location of the median U-turns. Similarly, interchanges encompass large areas. Because of that,
a portion of the RCI crashes that occur within that large envelope may not be related to the RCI but just
happened to occur at that location. That is always the case with any intersection, but the large envelope
of the RCI makes it potentially more so. The crash rate results for intersection related crashes show RCIs
have lower intersection related crashes than signals, which could indicate even a lower portion of the
total crashes occurring at RCIs are related to the RCI itself.

19
CHAPTER 5: CONCLUSIONS
The results of the before-after and cross-sectional analyses conducted show the RCIs in Minnesota are
exhibiting their intended safety benefits. The analyses showed the following impacts of RCIs:
Reductions in fatal and serious injury crashes
Reductions in angle crashes
Reductions in fatal and serious injury angle crashes
Increases in rear-end crashes
No changes to sideswipe crashes
No changes to total crashes
These results are consistent with the safety goals of RCIs as well as with the previous evaluation of RCIs in
Minnesota. Even though the RCIs are not causing significant changes in total crashes, there is a severity
shift that is resulting in a decrease in high-severity crashes.
A comparison between RCIs, rural signals, and low-volume interchanges show that RCIs appear to result
in lower overall crashes than interchanges as well as lower-angle and intersection-related crashes than
signals.

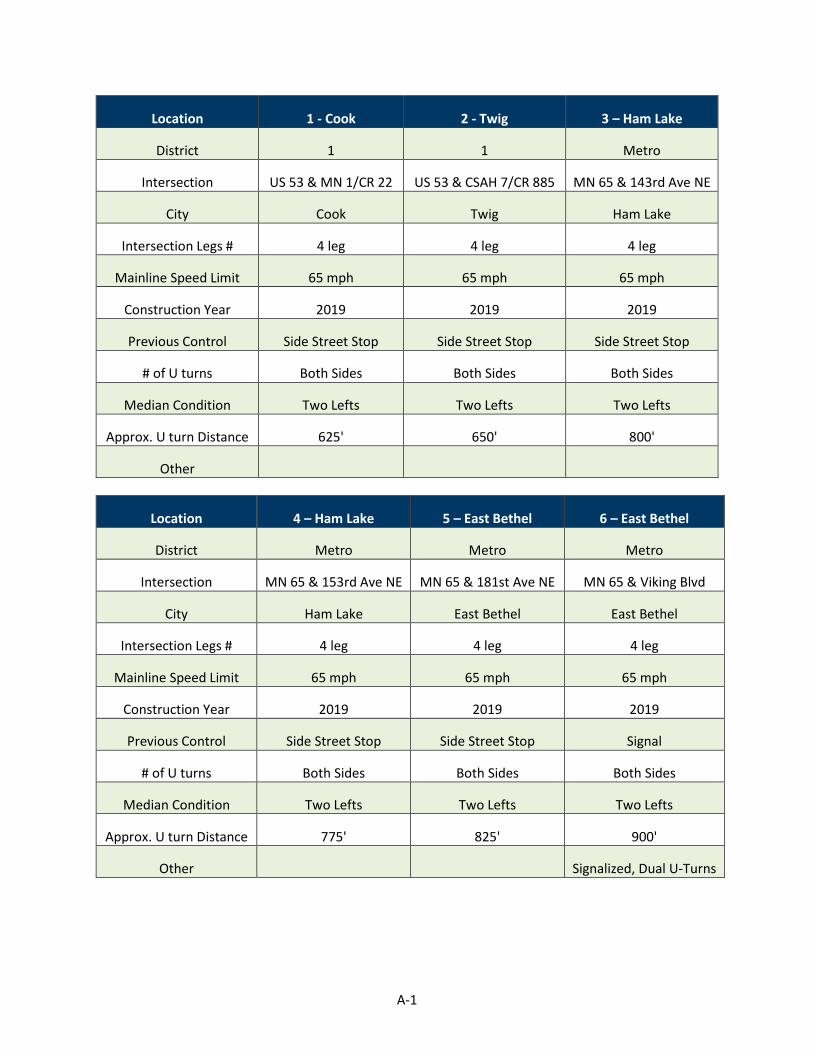
APPENDIX A
RCI LOCATIONS & CHARACTERISTICS
A-1
Location 1 - Cook 2 - Twig 3 – Ham Lake
District 1 1 Metro
Intersection US 53 & MN 1/CR 22 US 53 & CSAH 7/CR 885 MN 65 & 143rd Ave NE
City Cook Twig Ham Lake
Intersection Legs # 4 leg 4 leg 4 leg
Mainline Speed Limit 65 mph 65 mph 65 mph
Construction Year 2019 2019 2019
Previous Control Side Street Stop Side Street Stop Side Street Stop
# of U turns Both Sides Both Sides Both Sides
Median Condition Two Lefts Two Lefts Two Lefts
Approx. U turn Distance 625' 650' 800'
Other
Location 4 – Ham Lake 5 – East Bethel 6 – East Bethel
District Metro Metro Metro
Intersection MN 65 & 153rd Ave NE MN 65 & 181st Ave NE MN 65 & Viking Blvd
City Ham Lake East Bethel East Bethel
Intersection Legs # 4 leg 4 leg 4 leg
Mainline Speed Limit 65 mph 65 mph 65 mph
Construction Year 2019 2019 2019
Previous Control Side Street Stop Side Street Stop Signal
# of U turns Both Sides Both Sides Both Sides
Median Condition Two Lefts Two Lefts Two Lefts
Approx. U turn Distance 775' 825' 900'
Other Signalized, Dual U-Turns
A-2
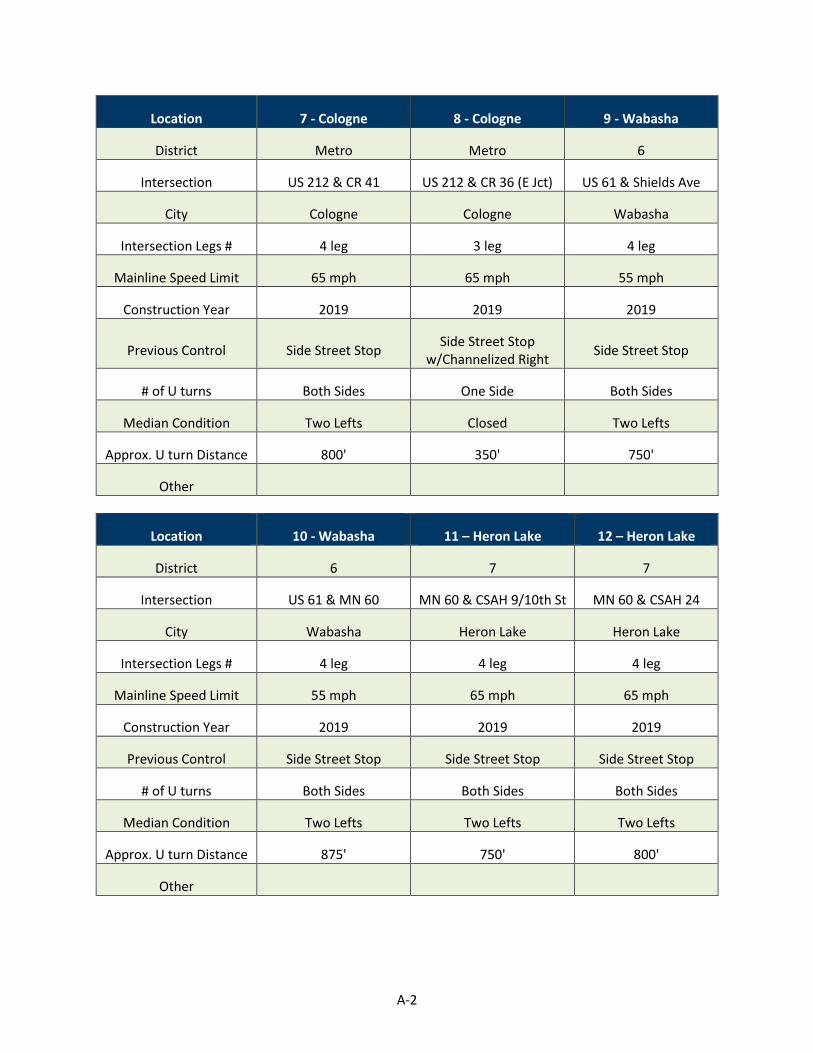
Location 7 - Cologne 8 - Cologne 9 - Wabasha
District Metro Metro 6
Intersection US 212 & CR 41 US 212 & CR 36 (E Jct) US 61 & Shields Ave
City Cologne Cologne Wabasha
Intersection Legs # 4 leg 3 leg 4 leg
Mainline Speed Limit 65 mph 65 mph 55 mph
Construction Year 2019 2019 2019
Previous Control Side Street Stop Side Street Stop
w/Channelized Right Side Street Stop
# of U turns Both Sides One Side Both Sides
Median Condition Two Lefts Closed Two Lefts
Approx. U turn Distance 800' 350' 750'
Other
Location 10 - Wabasha 11 – Heron Lake 12 – Heron Lake
District 6 7 7
Intersection US 61 & MN 60 MN 60 & CSAH 9/10th St MN 60 & CSAH 24
City Wabasha Heron Lake Heron Lake
Intersection Legs # 4 leg 4 leg 4 leg
Mainline Speed Limit 55 mph 65 mph 65 mph
Construction Year 2019 2019 2019
Previous Control Side Street Stop Side Street Stop Side Street Stop
# of U turns Both Sides Both Sides Both Sides
Median Condition Two Lefts Two Lefts Two Lefts
Approx. U turn Distance 875' 750' 800'
Other

A-3
Location 13 – Heron Lake 14 - Marshall 15 – Cass Lake
District 7 8 2
Intersection MN 60 & CR 43/1st St MN 23 & CR 7 US 2 & CR 75
City Heron Lake Marshall Cass Lake
Intersection Legs # 4 leg 4 leg 3 leg
Mainline Speed Limit 65 mph 55 mph 65 mph
Construction Year 2019 2019 2018
Previous Control Side Street Stop Side Street Stop Side Street Stop
# of U turns Both Sides Both Sides One Side
Median Condition Closed Two Lefts One Left
Approx. U turn Distance 625' 800' 925'
Other
Location 16 - Becker 17 – Ham Lake 18 – East Bethel
District 3 Metro Metro
Intersection US 10 & CR
23/Sherburne Ave MN 65 & 157th Ave NE
MN 65 & 187th Ave NE
City Becker Ham Lake East Bethel
Intersection Legs # 3 leg 4 leg 4 leg
Mainline Speed Limit 60 mph 65 mph 65 mph
Construction Year 2018 2018 2018
Previous Control Side Street Stop Side Street Stop Side Street Stop
# of U turns One Side Both Sides Both Sides
Median Condition One Left Two Lefts Two Lefts
Approx. U turn Distance 800' 800' 825'
Other Another access
modified to RI/RO

A-4
between intersection & U-turn
Location 19 - Jordan 20 - Jordan 21 - Marshall
District Metro Metro 8
Intersection US 169 & CR
59/Delaware Ave US 169 & Park Blvd &
CR 66 MN 23 & Lyon St
City Jordan Jordan Marshall
Intersection Legs # 4 leg 5 leg 4 leg
Mainline Speed Limit 65 mph 65 mph 55 mph
Construction Year 2018 2018 2018
Previous Control Side Street Stop Side Street Stop Side Street Stop
# of U turns Both Sides Both Sides Both Sides
Median Condition Two Lefts Two Lefts Two Lefts
Approx. U turn Distance 725' & 1075' 1000' 950'
Other Two intersections
combined into offset Ts with U-turns at Ts
Location 22 – Pequot Lakes 23 – Pequot Lakes 24 - Vermillion
District 3 3 Metro
Intersection MN 371 & CR 112 MN 371 & CR 168/107 US 52 & 180th St
City Pequot Lakes Pequot Lakes Vermillion
Intersection Legs # 4 leg 4 leg 4 leg
Mainline Speed Limit 65 mph 65 mph 65 mph
Construction Year 2017 2017 2017
Previous Control New Intersection New Intersection Side Street Stop
# of U turns Both Sides Both Sides Both Sides
Median Condition Two Lefts Two Lefts Closed
Approx. U turn Distance 800' & 900' 800' & 1000' 725'

A-5
Other no previous location no previous location
Location 25 - Vermillion 26 - Vermillion 27 - Hampton
District Metro Metro Metro
Intersection US 52 & CR 62 (190th St) US 52 & CR 66 US 52 & 210th St
City Vermillion Vermillion Hampton
Intersection Legs # 4 leg 4 leg 4 leg
Mainline Speed Limit 65 mph 65 mph 65 mph
Construction Year 2017 2014 2017
Previous Control Side Street Stop Side Street Stop Side Street Stop
# of U turns One Side Both Sides One Side
Median Condition One Left (SB) Two Lefts Closed
Approx. U turn Distance 725' 950' & 2175' 725'
Other
Location 28 - Hampton 29 – Mendota Heights 30 – Eagle Lake
District Metro Metro 7
Intersection US 52 & 215th St MN 62 & Carmen Ln US 14 & CR 17
City Hampton Mendota Heights Eagle Lake
Intersection Legs # 3 leg 3 leg 4 leg
Mainline Speed Limit 65 mph 55 mph 65 mph
Construction Year 2017 2017 2016
Previous Control Side Street Stop Side Street Stop Side Street Stop
# of U turns One Side One Side One Side
Median Condition Closed One Left Two Lefts
Approx. U turn Distance 725' 625' 900'
Other

A-6
Location 31 – Le Sueur 32 - Marshall 33 - Jordan
District 7 8 Metro
Intersection US 169 & CR 28 MN 23 & Saratoga St US 169 & Candy Store
Access
City Le Sueur Marshall Jordan
Intersection Legs # 4 leg 4 leg 3 leg
Mainline Speed Limit 65 mph 55 mph 65 mph
Construction Year 2015 2015 2012
Previous Control Side Street Stop Side Street Stop Side Street Stop
# of U turns Both Sides Both Sides One Side
Median Condition Two Lefts Two Lefts One Left
Approx. U turn Distance 950' 850' 875'
Other
Location 34 – St. Peter 35 – St. Peter 36 – Lake Elmo
District 7 7 Metro
Intersection US 169 & MN 22/Dodd
Ave US 169 & St. Julien St
MN 36 & DeMontreville Tr
City St. Peter St. Peter Lake Elmo
Intersection Legs # 4 leg 3 leg 4 leg
Mainline Speed Limit 65 mph 65 mph 65 mph
Construction Year 2014 2014 2013
Previous Control Side Street Stop Side Street Stop Side Street Stop
# of U turns Both Sides One Side One Side
Median Condition Two Lefts One Left Two Lefts

A-7
Approx. U turn Distance 925' 700' 3825'
Other
Location 37 - Cotton 38 - Cologne 39 – Ham Lake
District 1 Metro Metro
Intersection US 53 & CR 52 US 212 & MN 284/CR 53 MN 65 & 169th Ave
City Cotton Cologne Ham Lake
Intersection Legs # 4 leg 4 leg 4 leg
Mainline Speed Limit 65 mph 65 mph 65 mph
Construction Year 2012 2012 2012
Previous Control Side Street Stop Side Street Stop Side Street Stop
# of U turns Both Sides Both Sides Both Sides
Median Condition Two Lefts Two Lefts Two Lefts
Approx. U turn Distance 1300' 950' 1675'
Other
Location 40 - Willmar 41 - Winona 42 - Hampton
District 8 6 Metro
Intersection MN 994A (Business 71)
& CR 24 US 61 & Orin St/Gilmore
Ave US 52 & Fischer Ave
City Willmar Winona Hampton
Intersection Legs # 4 leg 4 leg 3 leg
Mainline Speed Limit 55 mph 45 mph 65 mph
Construction Year 2010 2016 2017
Previous Control Side Street Stop Side Street Stop Side Street Stop
# of U turns One Side
(other is EV only) Both Sides One Side

A-8
Median Condition Two Lefts Two Lefts One Left
Approx. U turn Distance 825' 500' & 700' 750'
Other
Location 43 - Milaca 44 – Bogus Brook 45 - Princeton
District 3 3 3
Intersection US 169 & CR 11 US 169 & CR 12 US 169 & CR 13
City Milaca Bogus Brook Township Princeton
Intersection Legs # 4 leg 4 leg 4 leg
Mainline Speed Limit 65 mph 65 mph 65 mph
Construction Year 2020 2020 2020
Previous Control Side Street Stop Side Street Stop Side Street Stop
# of U turns Both Sides Both Sides Both Sides
Median Condition Two Lefts Closed Closed
Approx. U turn Distance 900' 500' 500'
Other
Location 46 - Isanti 47 – St. Cloud 48 - Milaca
District 3 3 3
Intersection MN 65 & Cajima St NE MN 23 & CR 8 US 169 & Pit Entrance
City Isanti St. Cloud Milaca
Intersection Legs # 4 leg 4 leg 4 leg
Mainline Speed Limit 65 mph 65 mph 65 mph
Construction Year 2020 2020 2020
Previous Control Side Street Stop Side Street Stop Side Street Stop
# of U turns Both Sides Both Sides One Side

A-9
Median Condition Two Lefts Two Lefts One Left
Approx. U turn Distance 1000' 800' 800'
Other
Location 49 – Norwood Young America
District Metro
Intersection US 212 & CSAH 34/Tacoma Ave
City Norwood Young America
Intersection Legs # 4 leg
Mainline Speed Limit 60 mph
Construction Year 2020
Previous Control Side Street Stop
# of U turns One Side
Median Condition One Left
Approx. U turn Distance 625'
Other South leg still full movement

APPENDIX B
RCI CRASH DATA BY SEVERITY AND TYPE PER YEAR

B-1
Location: 40 - Willmar Construction Year: 2010 Before Crashes
Year K
Crashes A
Crashes B
Crashes C
Crashes N
Crashes Angle
Crashes
Intersection Related Crashes
Rear- End
Crashes
Sideswipe Crashes
2001 1 1
2002 1 1 2
2003 1 1 1
2004 1 1 1
2005 1 2 1 3 4
2006 1 1 1 2 1
2007 1 1 1 1 3 1
2008 1 1 1 2 1
2009 1 2 3 3 4
After Crashes
Year K
Crashes A
Crashes B
Crashes C
Crashes N
Crashes Angle
Crashes
Intersection Related Crashes
Rear- End
Crashes
Sideswipe Crashes
2011
2012 1 1 1
2013 1 1 1
2014 1
2015
2016 1 1 1
2017 1 1 1
2018
2019 1 1 1

B-2
Location: 33 - Jordan Construction Year: 2012 Before Crashes
Year K
Crashes A
Crashes B
Crashes C
Crashes N
Crashes Angle
Crashes
Intersection Related Crashes
Rear -End
Crashes
Sideswipe Crashes
2005
2006 1 1 1 1 1
2007 1 2 1 1 1
2008 2 2 1 1 2
2009 2 1 1
2010 1 1 1
2011 2 3 1 1 2 2
After Crashes
Year K
Crashes A
Crashes B
Crashes C
Crashes N
Crashes Angle
Crashes
Intersection Related Crashes
Rear- End
Crashes
Sideswipe Crashes
2013 1 1
2014 1 2 1 2
2015 1 3 1 2
2016 2 3 1 5
2017 2 1 1
2018 1 3 4 3 3
2019 1

B-3
Location: 37 - Cotton Construction Year: 2012 Before Crashes
Year K
Crashes A
Crashes B
Crashes C
Crashes N
Crashes Angle
Crashes
Intersection Related Crashes
Rear- End
Crashes
Sideswipe Crashes
2005 2 1 1
2006 2 1 2
2007 1 1 1 2 1 4 5 1
2008 1 1 1 1 1
2009 1 2 1 2 1
2010 1 2 1 3 2
2011
After Crashes
Year K
Crashes A
Crashes B
Crashes C
Crashes N
Crashes Angle
Crashes
Intersection Related Crashes
Rear-End
Crashes
Sideswipe Crashes
2013 1 4 1 1 2
2014 1 1 2 2 1 1
2015 1 3 2
2016 1 3 1
2017 1 1 1
2018 1 1 1
2019

B-4
Location: 38 - Cologne Construction Year: 2012 Before Crashes
Year K
Crashes A
Crashes B
Crashes C
Crashes N
Crashes Angle
Crashes
Intersection Related Crashes
Rear- End
Crashes
Sideswipe Crashes
2005 1 2 3 3 6 1 1
2006 1 1 1
2007 1 1 2 2 3 6 1
2008 2 3 2 4
2009 1 1 2 1 4 2
2010 3 1 3 1
2011 2 2 3 2 5 9
After Crashes
Year K
Crashes A
Crashes B
Crashes C
Crashes N
Crashes Angle
Crashes
Intersection Related Crashes
Rear-End
Crashes
Sideswipe Crashes
2013 1 1 5 1 5 2
2014 1 7 5 3 1
2015 2 1
2016 1 1 3 1 3 2 1
2017 1 6 2 4 2 1
2018 1 3 1 3 1
2019 1 8 3 1 1

B-5
Location: 39 – Ham Lake Construction Year: 2012 Before Crashes
Year K
Crashes A
Crashes B
Crashes C
Crashes N
Crashes Angle
Crashes
Intersection Related Crashes
Rear -End
Crashes
Sideswipe Crashes
2005 2 4 2 4 5 1
2006 1 1 1 4 4 4 1 1
2007 3 2 3 4
2008 1 1 2 1
2009 1 4 3 4 1
2010 1 4 1 2 1 1 1
2011 3 2 2 1 4 3 2
After Crashes
Year K
Crashes A
Crashes B
Crashes C
Crashes N
Crashes Angle
Crashes
Intersection Related Crashes
Rear- End
Crashes
Sideswipe Crashes
2013
2014 1 1
2015 1 1 1 2 3
2016 1 1 1 1
2017 1 1 1 1
2018 1 1 1 2
2019 3 2 2

B-6
Location: 36 – Lake Elmo Construction Year: 2013 Before Crashes
Year K
Crashes A
Crashes B
Crashes C
Crashes N
Crashes Angle
Crashes
Intersection Related Crashes
Rear- End
Crashes
Sideswipe Crashes
2007 3 9 1 3 2 4
2008 1 3 2 1
2009 1 2 4 3 3 1
2010 1 1 6 1 3 1
2011 3 3 1 1 2 1
2012 1 3 2 1
After Crashes
Year K
Crashes A
Crashes B
Crashes C
Crashes N
Crashes Angle
Crashes
Intersection Related Crashes
Rear- End
Crashes
Sideswipe Crashes
2014 1 4 1 2 2
2015 2 2 5 3 6 2 1
2016 5 1 2 2 1
2017 1 4 1
2018 1 1 7 1 4 2
2019 1 3 1 1

B-7
Location: 26 - Vermillion Construction Year: 2014 Before Crashes
Year K
Crashes A
Crashes B
Crashes C
Crashes N
Crashes Angle
Crashes
Intersection Related Crashes
Rear- End
Crashes
Sideswipe Crashes
2009 2 2 6 2 4 3 1
2010 2 3 4 5
2011 2
2012 1 4 10 8 12 1 1
2013 1 3 2 4 1 2 2 1
After Crashes
Year K
Crashes A
Crashes B
Crashes C
Crashes N
Crashes Angle
Crashes
Intersection Related Crashes
Rear -End
Crashes
Sideswipe Crashes
2015 1 1 3 3 1 2 4
2016 7 1 1 2 2
2017 1 1 8 2 8 1
2018 1 1 3 1 1 1 1
2019 1 10 1 6 5

B-8
Location: 34 – St. Peter Construction Year: 2014 Before Crashes
Year K
Crashes A
Crashes B
Crashes C
Crashes N
Crashes Angle
Crashes
Intersection Related Crashes
Rear -End
Crashes
Sideswipe Crashes
2009 1 2 1 1 4 3
2010 1 7 1 3 1
2011 1 4 1 4 2
2012 1 1 1
2013 2 1 1
After Crashes
Year K
Crashes A
Crashes B
Crashes C
Crashes N
Crashes Angle
Crashes
Intersection Related Crashes
Rear-End
Crashes
Sideswipe Crashes
2015 1 3 5 1 5 6
2016 1 3 3 4
2017 1 1 5 4 5
2018 6 3 4 1
2019 1 1 1

B-9
Location: 35 – St. Peter Construction Year: 2014 Before Crashes
Year K
Crashes A
Crashes B
Crashes C
Crashes N
Crashes Angle
Crashes
Intersection Related Crashes
Rear -End
Crashes
Sideswipe Crashes
2009 1
2010 4 2 2
2011 6 2 4 2 1
2012 2 1 1 1
2013 1 1 1 1 2 1
After Crashes
Year K
Crashes A
Crashes B
Crashes C
Crashes N
Crashes Angle
Crashes
Intersection Related Crashes
Rear -End
Crashes
Sideswipe Crashes
2015 3 3 2 5 3 1
2016 1 6 1 4 5
2017 2 2 1 3 2 1
2018 6 4 4 1
2019 1 4 1 5 3 1
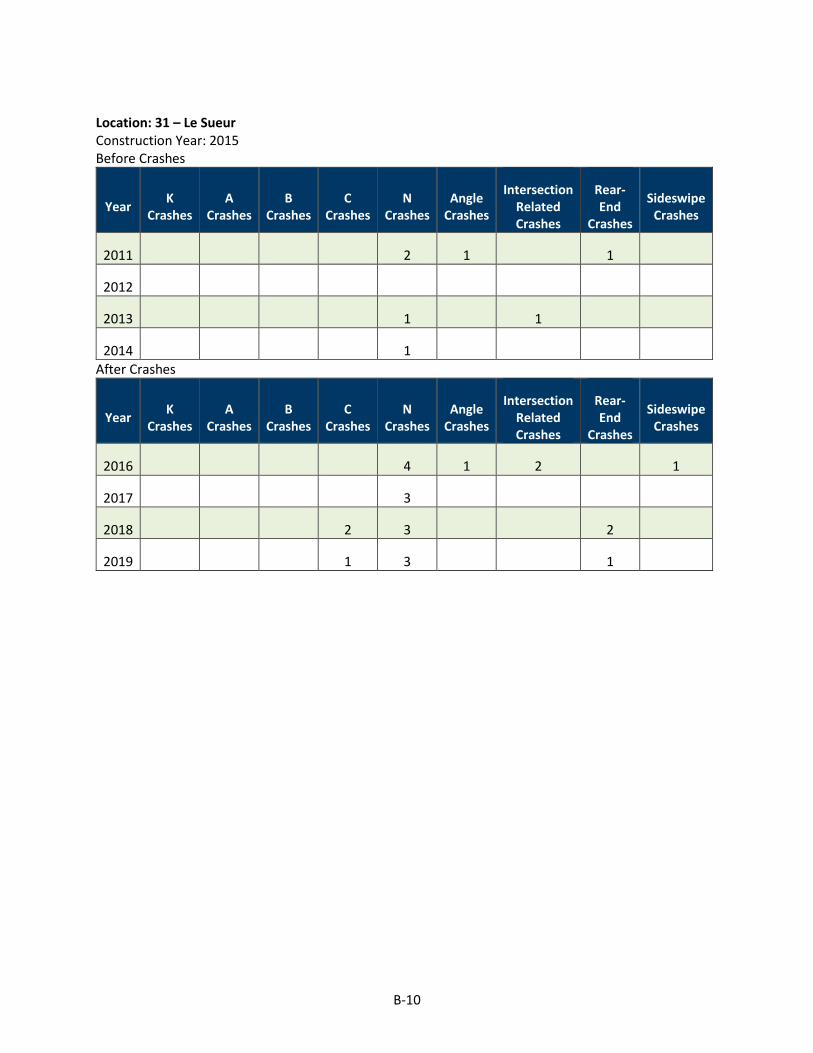
B-10
Location: 31 – Le Sueur Construction Year: 2015 Before Crashes
Year K
Crashes A
Crashes B
Crashes C
Crashes N
Crashes Angle
Crashes
Intersection Related Crashes
Rear- End
Crashes
Sideswipe Crashes
2011 2 1 1
2012
2013 1 1
2014 1
After Crashes
Year K
Crashes A
Crashes B
Crashes C
Crashes N
Crashes Angle
Crashes
Intersection Related Crashes
Rear- End
Crashes
Sideswipe Crashes
2016 4 1 2 1
2017 3
2018 2 3 2
2019 1 3 1

B-11
Location: 32 - Marshall Construction Year: 2015 Before Crashes
Year K
Crashes A
Crashes B
Crashes C
Crashes N
Crashes Angle
Crashes
Intersection Related Crashes
Rear -End
Crashes
Sideswipe Crashes
2011 1 2 2 3 1
2012 2 4 2 6 1 2
2013 1 3 2 4
2014 1 2 1 1 4 5
After Crashes
Year K
Crashes A
Crashes B
Crashes C
Crashes N
Crashes Angle
Crashes
Intersection Related Crashes
Rear- End
Crashes
Sideswipe Crashes
2016 1
2017
2018 1 1 1
2019

B-12
Location: 30 – Eagle Lake Construction Year: 2016 Before Crashes
Year K
Crashes A
Crashes B
Crashes C
Crashes N
Crashes Angle
Crashes
Intersection Related Crashes
Rear- End
Crashes
Sideswipe Crashes
2013 1 1 1
2014 1 2 2 3 1
2015 1 1 1 1 1
After Crashes
Year K
Crashes A
Crashes B
Crashes C
Crashes N
Crashes Angle
Crashes
Intersection Related Crashes
Rear- End
Crashes
Sideswipe Crashes
2017 1 1 1 1 1
2018 1 1 3 2 3
2019 1 4 2 3 2
Location: 41 - Winona Construction Year: 2016 Before Crashes
Year K
Crashes A
Crashes B
Crashes C
Crashes N
Crashes Angle
Crashes
Intersection Related Crashes
Rear-End
Crashes
Sideswipe Crashes
2013 1 4 1 4 2
2014 1 2 1 2 4
2015 2 3 3 5 1
After Crashes
Year K
Crashes A
Crashes B
Crashes C
Crashes N
Crashes Angle
Crashes
Intersection Related Crashes
Rear- End
Crashes
Sideswipe Crashes
2017 1 1
2018 1 1 1
2019 1 2 3

B-13
Location: 24 - Vermillion Construction Year: 2017 Before Crashes
Year K
Crashes A
Crashes B
Crashes C
Crashes N
Crashes Angle
Crashes
Intersection Related Crashes
Rear -End
Crashes
Sideswipe Crashes
2015 1 1
2016 1 1 1
After Crashes
Year K
Crashes A
Crashes B
Crashes C
Crashes N
Crashes Angle
Crashes
Intersection Related Crashes
Rear- End
Crashes
Sideswipe Crashes
2018 3 2 2
2019 1 1
Location: 25 - Vermillion Construction Year: 2017 Before Crashes
Year K
Crashes A
Crashes B
Crashes C
Crashes N
Crashes Angle
Crashes
Intersection Related Crashes
Rear -End
Crashes
Sideswipe Crashes
2015 2 3 1 3 2
2016 1 1 1 1
After Crashes
Year K
Crashes A
Crashes B
Crashes C
Crashes N
Crashes Angle
Crashes
Intersection Related Crashes
Rear -End
Crashes
Sideswipe Crashes
2018 1 12 2 3 1 2
2019 1 6 1 3 3 1

B-14
Location: 27 - Hampton Construction Year: 2017 Before Crashes
Year K
Crashes A
Crashes B
Crashes C
Crashes N
Crashes Angle
Crashes
Intersection Related Crashes
Rear- End
Crashes
Sideswipe Crashes
2015 1 1
2016 1 1 3 1 1 1
After Crashes
Year K
Crashes A
Crashes B
Crashes C
Crashes N
Crashes Angle
Crashes
Intersection Related Crashes
Rear -End
Crashes
Sideswipe Crashes
2018 5 2
2019 3
Location: 28 - Hampton Construction Year: 2017 Before Crashes
Year K
Crashes A
Crashes B
Crashes C
Crashes N
Crashes Angle
Crashes
Intersection Related Crashes
Rear- End
Crashes
Sideswipe Crashes
2015 1
2016
After Crashes
Year K
Crashes A
Crashes B
Crashes C
Crashes N
Crashes Angle
Crashes
Intersection Related Crashes
Rear -End
Crashes
Sideswipe Crashes
2018 1 3 2
2019 1

B-15
Location: 43 - Hampton Construction Year: 2017 Before Crashes
Year K
Crashes A
Crashes B
Crashes C
Crashes N
Crashes Angle
Crashes
Intersection Related Crashes
Rear- End
Crashes
Sideswipe Crashes
2015 1 1
2016 1 2
After Crashes
Year K
Crashes A
Crashes B
Crashes C
Crashes N
Crashes Angle
Crashes
Intersection Related Crashes
Rear- End
Crashes
Sideswipe Crashes
2018 3 1 1
2019 1 1
Location: 15 – Cass Lake Construction Year: 2018 Before Crashes
Year K
Crashes A
Crashes B
Crashes C
Crashes N
Crashes Angle
Crashes
Intersection Related Crashes
Rear- End
Crashes
Sideswipe Crashes
2017 1 3 3 3
After Crashes
Year K
Crashes A
Crashes B
Crashes C
Crashes N
Crashes Angle
Crashes
Intersection Related Crashes
Rear- End
Crashes
Sideswipe Crashes
2019 1 1
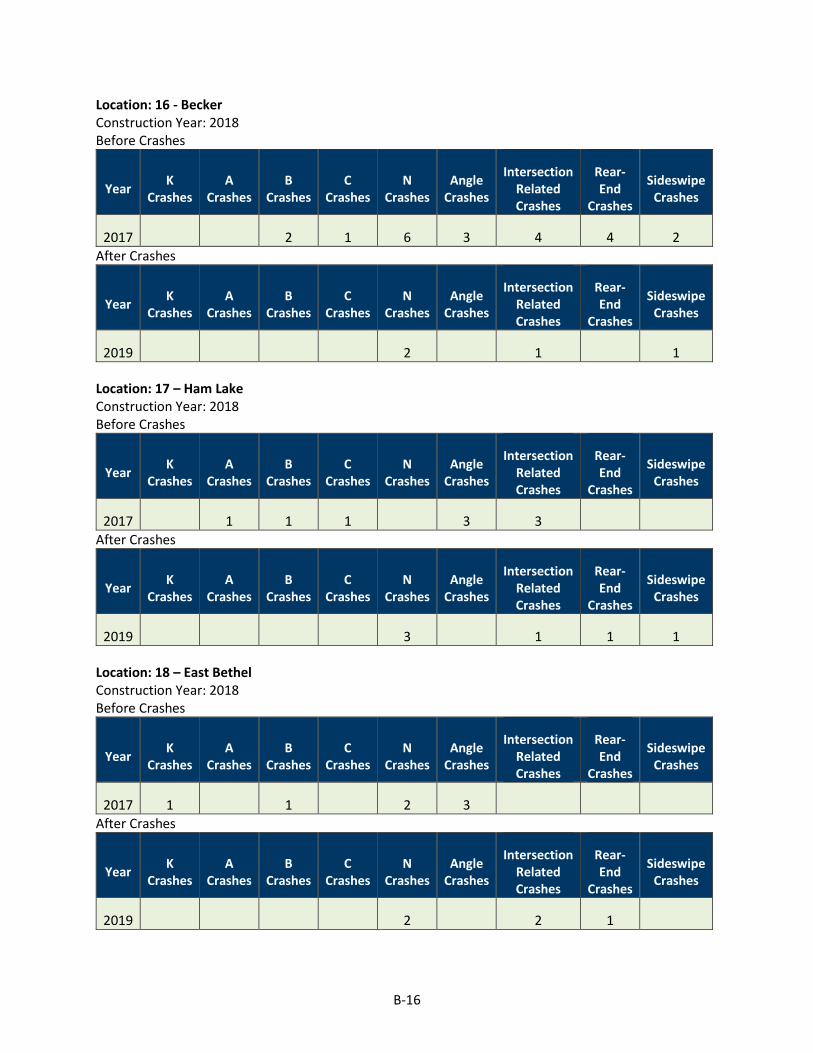
B-16
Location: 16 - Becker Construction Year: 2018 Before Crashes
Year K
Crashes A
Crashes B
Crashes C
Crashes N
Crashes Angle
Crashes
Intersection Related Crashes
Rear- End
Crashes
Sideswipe Crashes
2017 2 1 6 3 4 4 2
After Crashes
Year K
Crashes A
Crashes B
Crashes C
Crashes N
Crashes Angle
Crashes
Intersection Related Crashes
Rear- End
Crashes
Sideswipe Crashes
2019 2 1 1
Location: 17 – Ham Lake Construction Year: 2018 Before Crashes
Year K
Crashes A
Crashes B
Crashes C
Crashes N
Crashes Angle
Crashes
Intersection Related Crashes
Rear- End
Crashes
Sideswipe Crashes
2017 1 1 1 3 3
After Crashes
Year K
Crashes A
Crashes B
Crashes C
Crashes N
Crashes Angle
Crashes
Intersection Related Crashes
Rear- End
Crashes
Sideswipe Crashes
2019 3 1 1 1
Location: 18 – East Bethel Construction Year: 2018 Before Crashes
Year K
Crashes A
Crashes B
Crashes C
Crashes N
Crashes Angle
Crashes
Intersection Related Crashes
Rear- End
Crashes
Sideswipe Crashes
2017 1 1 2 3
After Crashes
Year K
Crashes A
Crashes B
Crashes C
Crashes N
Crashes Angle
Crashes
Intersection Related Crashes
Rear- End
Crashes
Sideswipe Crashes
2019 2 2 1

B-17
Location: 19 - Jordan Construction Year: 2018 Before Crashes
Year K
Crashes A
Crashes B
Crashes C
Crashes N
Crashes Angle
Crashes
Intersection Related Crashes
Rear- End
Crashes
Sideswipe Crashes
2017 1 1 4 3 4 2
After Crashes
Year K
Crashes A
Crashes B
Crashes C
Crashes N
Crashes Angle
Crashes
Intersection Related Crashes
Rear- End
Crashes
Sideswipe Crashes
2019 1 1 1 3
Location: 20 - Jordan Construction Year: 2018 Before Crashes
Year K
Crashes A
Crashes B
Crashes C
Crashes N
Crashes Angle
Crashes
Intersection Related Crashes
Rear- End
Crashes
Sideswipe Crashes
2017
After Crashes
Year K
Crashes A
Crashes B
Crashes C
Crashes N
Crashes Angle
Crashes
Intersection Related Crashes
Rear-End
Crashes
Sideswipe Crashes
2019 1 4 1 2 2
Location: 21 - Marshall Construction Year: 2018 Before Crashes
Year K
Crashes A
Crashes B
Crashes C
Crashes N
Crashes Angle
Crashes
Intersection Related Crashes
Rear- End
Crashes
Sideswipe Crashes
2017
After Crashes
Year K
Crashes A
Crashes B
Crashes C
Crashes N
Crashes Angle
Crashes
Intersection Related Crashes
Rear- End
Crashes
Sideswipe Crashes
2019 1 1 1

APPENDIX C
RCI SEVERE CRASH DETAILS
C-1
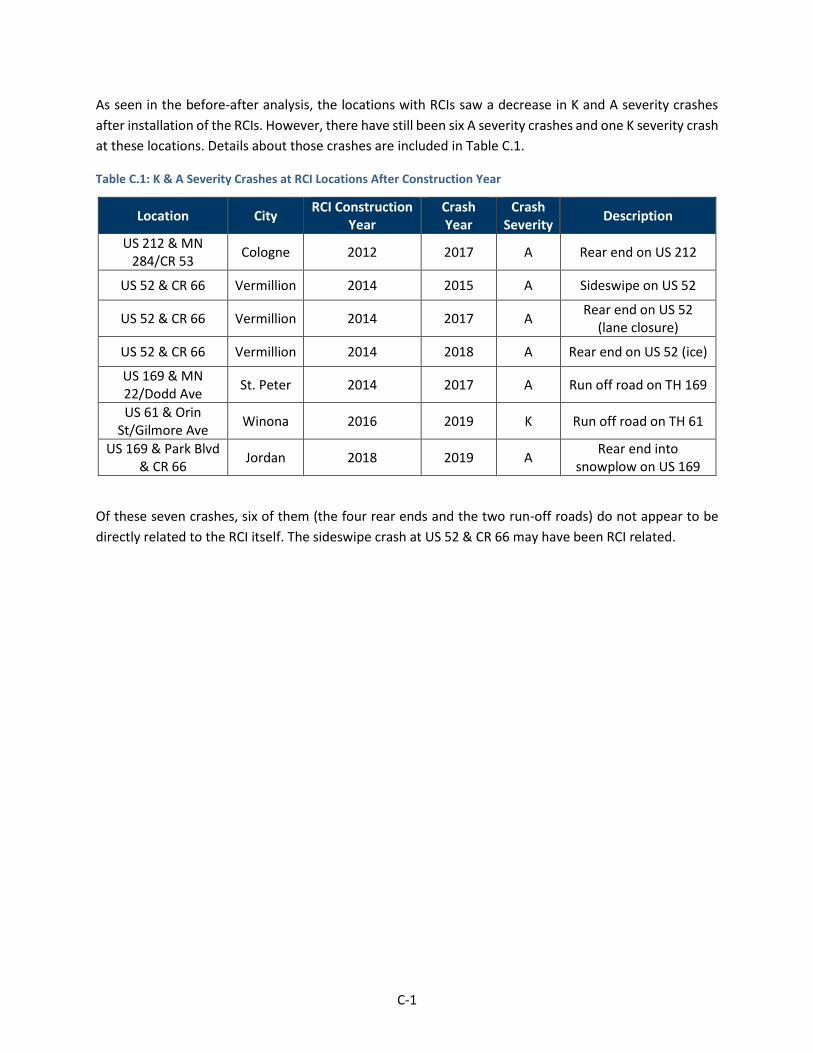
As seen in the before-after analysis, the locations with RCIs saw a decrease in K and A severity crashes
after installation of the RCIs. However, there have still been six A severity crashes and one K severity crash
at these locations. Details about those crashes are included in Table C.1.
Table C.1: K & A Severity Crashes at RCI Locations After Construction Year
Location City RCI Construction
Year Crash Year
Crash Severity
Description
US 212 & MN 284/CR 53
Cologne 2012 2017 A Rear end on US 212
US 52 & CR 66 Vermillion 2014 2015 A Sideswipe on US 52
US 52 & CR 66 Vermillion 2014 2017 A Rear end on US 52
(lane closure)
US 52 & CR 66 Vermillion 2014 2018 A Rear end on US 52 (ice)
US 169 & MN 22/Dodd Ave
St. Peter 2014 2017 A Run off road on TH 169
US 61 & Orin St/Gilmore Ave
Winona 2016 2019 K Run off road on TH 61
US 169 & Park Blvd & CR 66
Jordan 2018 2019 A Rear end into
snowplow on US 169
Of these seven crashes, six of them (the four rear ends and the two run-off roads) do not appear to be
directly related to the RCI itself. The sideswipe crash at US 52 & CR 66 may have been RCI related.
APPENDIX D
RCI CONSTRUCTION YEAR SEVERE CRASHES

D-1
As mentioned, crashes during the construction years were not included in the analysis. There were nine K
and A severity crashes at RCI locations during those construction years. Six of those occurred before the
RCI was constructed, but Table D.1 lists each of those nine with descriptions for the three that occurred
after the RCI installation.
Table D.1: K & A Severity Crashes at RCI Locations After Construction Year
Location City Construction/
Crash Year Crash
Severity
Before or After Construction of
RCI Description
MN 23 & Saratoga St
Marshall 2015 K Before
MN 23 & Saratoga St
Marshall 2015 K Before
US 10 & CR 23/Sherburne Ave
Becker 2018 K After Pedestrian on US 10
MN 65 & 157th Ave Ham Lake
2018 K Before
MN 65 & 187th Ave East
Bethel 2018 A Before
MN 65 & 153rd Ave Ham Lake
2019 A Before
MN 65 & 181st Ave East
Bethel 2019 A After
Sideswipe heading to U-turn in RCI on
MN 65
MN 65 & Viking Blvd (signalized
RCI)
East Bethel
2019 A Before
MN 65 & Viking Blvd (signalized
RCI)
East Bethel
2019 K After Run off road on MN
65
Of the three crashes that occurred after the RCIs were constructed, one of them (the run-off road crash)
at MN 65 & Viking Blvd does not appear to be directly related to the RCI itself. The sideswipe crash at MN
65 & 181st Ave was RCI-related. The details of the pedestrian crash at US 10 & CR 23/Sherburne Ave leave
it unclear if it is related to a pedestrian crossing the roadway at the intersection or walking along the
shoulder/lane of the roadway near the intersection.

APPENDIX E
RCI TARGET CRASH TYPE BREAKDOWNS

E-1
Figures E.1 through E.3 show a breakdown of how and where rear end, angle, and sideswipe crashes are
occurring at RCIs. The crash numbers shown in these figures are from the after portion of the Before-After
analysis when RCIs were fully in place.
Figure E.1 - Breakdown of Rear-End Crashes at RCIs
Figure E.2 - Breakdown of Angle Crashes at RCIs
Figure E.3 - Breakdown of Sideswipe Crashes at RCIs