traffic modeling and network simulation #5
TRANSCRIPT

1Traffic Modeling and Simulation
Traffic Modeling and Network Simulation
#5
2Traffic Modeling and Simulation
Network Design ProblemGoalGiven
– QoS requirement, e.g., Average delayLoss probability
– Characterization of the traffic: the input to the network
Common traffic characteristics Average interarrival time (arrival rate)Average holding time (message length)
Design the system

3Traffic Modeling and Simulation
Network Performance Evaluation
Solution methodologies:Simulation techniques good for more
detailed analysis Mathematical analysis
–Model this type of process as a Queueing System good for initial design
4Traffic Modeling and Simulation
Outline
Traffic modeling Describes the nature of what is transported over communications
networks. Understanding traffic can be used to improve network performance Traffic is random
– Time between packet arrivals, interarrival time. Average rate of packet arrivals = – Packet length
Holding time = E[L]/C, e.g., E[L]= 1000 bits, C=1Mb/s then holding time = 1ms
Simulation

5Traffic Modeling and Simulation
Application QoS Requirements Data loss some apps (e.g., audio) can
tolerate some loss other apps (e.g., file transfer,
telnet) require 100% reliable data transfer
Timing some apps (e.g., Internet
telephony, interactive games) require low delay to be “effective”
Throughput some apps (e.g., multimedia) require
minimum amount of throughput to be “effective”
other apps (“elastic apps”) make use of whatever throughput they get
Modified from Computer Networking: A Top Down Approach Featuring the Internet, 4nd edition. Jim Kurose, Keith Ross, Addison-Wesley, Copyright 1996-2002, J .F Kurose and K.W. Ross, All Rights Reserved
6Traffic Modeling and Simulation
Application QoS Requirements
Application
file transfere-mail
Web documentsreal-time audio/video
stored audio/videointeractive gamesinstant messaging
Data loss
no lossno lossno lossloss-tolerant
loss-tolerantloss-tolerantno loss
Throughput
elasticelasticelasticaudio: 5kbps-1Mbpsvideo:10kbps-5Mbpssame as above few kbps upelastic
Modified from Computer Networking: A Top Down Approach Featuring the Internet, 4nd edition. Jim Kurose, Keith Ross, Addison-Wesley, Copyright 1996-2002, J .F Kurose and K.W. Ross, All Rights Reserved
7Traffic Modeling and Simulation
Traffic CharacterizationCustomers request informationRate of requests = requests/secCalls/sec Packets/secmp3’s/hour
The volume of information requested Length of the phone call (sec/call) Length of movie (Bytes) Size of picture (Bytes)
8Traffic Modeling and Simulation
Traffic Characterization
Traffic characterization describes the user demands for network resourcesHow often a customer:
– Requests a web page– Down loads an MP3– Makes a phone call
Size/length (how long you hold network resources)– Web page– Song– Phone call
9Traffic Modeling and Simulation
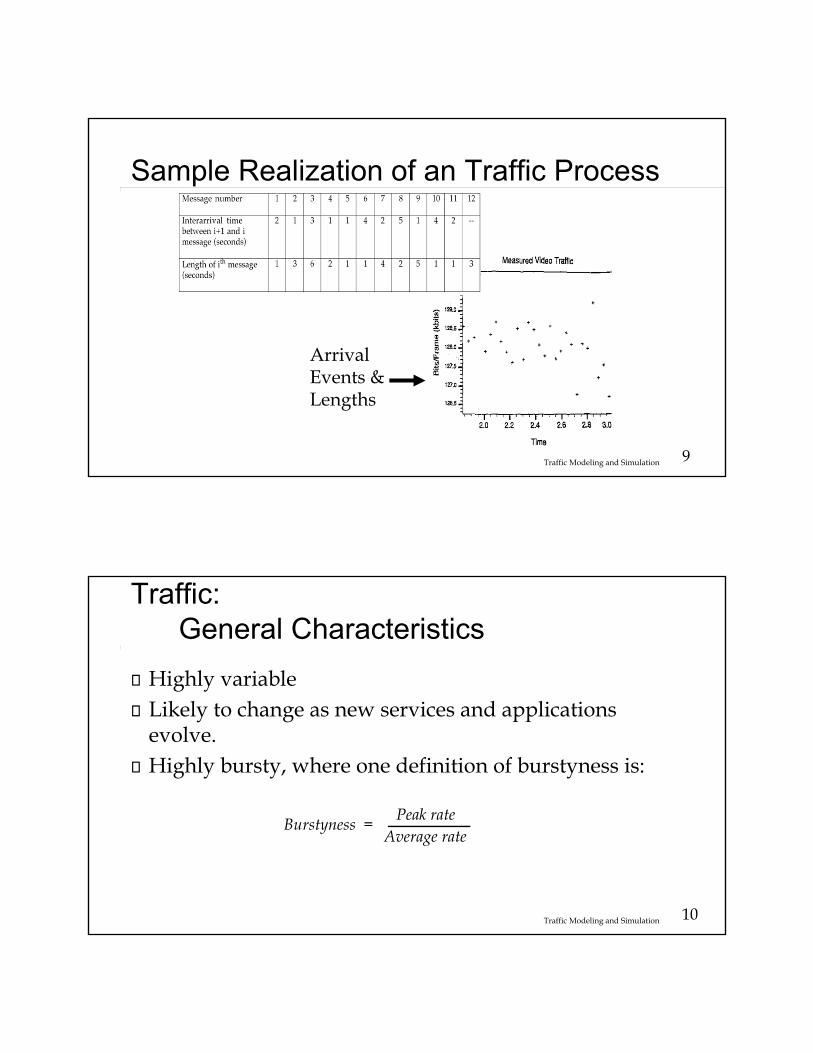
Sample Realization of an Traffic Process
ArrivalEvents &Lengths
10Traffic Modeling and Simulation
Traffic: General Characteristics
Highly variableLikely to change as new services and applications evolve.Highly bursty, where one definition of burstyness is:
Burstyness =Peak rate
Average rate

11Traffic Modeling and Simulation
Traffic: General Characteristics
Example: During a typical remote login connectionover a 19.2kb/s modem a user types at a rate of 1 symbol/sec or 8 bits/sec and then transfers a 100 kbyte file. Assume the total holding time of the connection is 10 min.
What is the burstyness of this data session?
12Traffic Modeling and Simulation
Traffic: General Characteristics
The time to transfer the file is (800,000 bits)/(19,200 b/s) = 41 sec.So for 600 - 41sec = 559 sec. the data rate is 8 bits/sec or 4,472 bits were transferred in 559 sec. Thus in 600 sec. 4,472 + 800,000 bits were transferred, yielding a average rate of:804,472 bits/600 sec = 1,340 bits/sec.The peak rate was 19.2 Kb/s so the burstyness for this data session was:
19,200/1,340 = 14.3

13Traffic Modeling and Simulation
Traffic: General Characteristics
User Burst
Idle TimeComputer Burst
Think Time
User Burst
Idle TimeComputer Burst
Asymmetric Nature of Interactive Traffic
This Asymmetric property has lead to asymmetric services
14Traffic Modeling and Simulation
From the Internet into DatavisionMean = 8.876 Mb/s.
Maximum = 18.952 Mb/s
From Datavision out to the Internet Mean = 5.133 Mb/s.
Maximum = 12.093 Mb/s
Time of Day Variations
15Traffic Modeling and Simulation
In General Traffic
Very burstyProblems with traffic modeling Rapidly evolving applicationsComplex network interactions
Issues:Do models match “real” traffic flows?Are the performance models based on specific traffic
assumption robust
16Traffic Modeling and Simulation
Packet voice/video looks like a steady flow or Constant Bit Rate (CBR) trafficHowever, voice/video can be Variable Bit Rate or VBR “silence detection” Variable rate coding
Problem: After going through the network the packets will not arrive equally spaced in time. Thus playback of packet voice must deal with variable network delays
Packet Voice (applies to packet video)

17Traffic Modeling and Simulation
Packet Voice (applies to packet video)
Example: Parameters for a packet voice system 1 source Sample rate = 8000 samples/sec (ITU G.711) 8 bits/sample (1 byte/sample) 8 ms of voice/packet Critical parameter Packet size (bytes/packet) = (8ms/packet)*(8000
bytes/sec)=64 Bytes [assuming no overhead bytes]
Link rate = 10 Mb/s Clocking time/packet (or Holding time/packet)=
(64bytes/packet)*8bits/byte)/(10 Mb/s)= 51.2us
18Traffic Modeling and Simulation
Voice Traffic: Packet Voice
51.2 us
8 ms time
51.2 us
X ms time
8 ms
Transmit at a Constant Bit Rate (CBR)
X not equal 8ms because of random network delaysIf X is too big packet may arrive too late for play out
Receive with variable interpacket arrival times

19Traffic Modeling and Simulation
Voice Traffic: Packet VoiceAssume network delay is uniformly distributed between
[25 ms, 75 ms] Same as having a fixed propagation delay of 25 ms with a random
network delay uniformly distributed between [0 ms, 50 ms]Note receiver will run out of bytes to playout after 8 ms.Solution: Jitter Buffer 50 ms (or 8 packets or 2.8 Kbits) Worst case, receiver will run out of data just as a new packet arrives
20Traffic Modeling and Simulation
Voice Traffic: Packet VoiceNew problem: networks delays are unknown and maybe unboundedA voice packet may arrive at 85 ms and be too late to be played back Late packets are dropped Last packet may be played out in dead time
Packet voice (video) schemes must be able to deal with variable delay and packet loss
(Should voice packets be retransmitted?)

21Traffic Modeling and Simulation
VoIP Quality
ITU-T Recommandation G.114-One-way transmission time, May 2003
22Traffic Modeling and Simulation
Voice Traffic: Packet VoiceG.723.1 is a voice codingstandard, linear predictioncompressionalgorithm
From: Performance Evaluation of the Architecture for End-to-End Quality-of-Service Provisioning,Katsuyoshi Iida, Kenji Kawahara, Tetsuya Takine, and Yuji Oie, IEEE Communications Magizine, April 2000

23Traffic Modeling and Simulation
VoIP- Delay budgetFactors in End to End Delay
Assumption: maximum delay from mouth-to-ear needs to be on the order of 200 -300 ms
From: http://www.protocols.com/papers/voip2.htm
ITU G.114 - < 150 ms acceptable for most applications- [150ms, 400 ms] acceptable for international- > 400 ms unacceptable
24Traffic Modeling and Simulation
Delay & Packet Loss Sources
From: http://portal.etsi.org/stq/workshop2003/presentations2003/06HenrikAstromPresentation%20.pdf
25Traffic Modeling and Simulation
VoIP- Delay budget Factors in End-to-End Delay
Example: Delay Budget (depends on assumptions) Formation of VoIP packet at TX ~ 30 ms
20ms of voice/packet is default for Cisco 7960 router Other VoIP packet processing ~70 ms
(see: http://www.rmav.arauc.br/pdf/voip.pdf) Propagation ~10 ms Network Delays ~10 ms Extraction of VoIP packet at Receiver ~30 ms Jitter Buffer ~ 100 ms
Compensates for variable network delay Total 250 ms
Possible trade-offs: Jitter Buffer vs voice packet loss VoIP packet size vs length of jitter buffer
Ref: http://www.lightreading.com/document.asp?site=lightreading&doc_id=53864&page_number=6
For examples see: https://www.cisco.com/c/en/us/support/docs/voice/voice-quality/5125-delay-details.html#packetizationdelay
26Traffic Modeling and Simulation
Network SimulationDefine network simulationDiscuss attributes and application of simulationPresent implementation of simulation systemsDiscuss analysis of simulation resultsDiscuss selection of simulation toolsProvide an overview of ExtendSim. On the start up Extendsim window there is: A button for tutorials and a video showing how to build
models A link to “ExtendSim for DESS Textbook”, a that is a tutorial
on the tool. Other useful tools. There is a link to getting the whole user manual on the class
web page. (It is long DO NOT PRINT the whole pdf file.)

27Traffic Modeling and Simulation
A Definition of Communication Network Simulation
Communication network simulation involves generating pseudo-random sequences representing
network traffic (message lengths and interarrival times or other input processes, e.g. time varying link quality) then using these sequences to exercise an algorithmic
description of the network operation.
28Traffic Modeling and Simulation
Attributes of SimulationSimulation Is a Very Flexible Evaluation Tool General Network Characteristics (Sources, Topology,
Protocols, Etc.) Minute Detail
Simulation Models Can Be Expensive to Construct Human Effort
Simulation Models Can Be Expensive to Run Computer Effort
Statistical Analysis of the Results Can Be Difficult Requires Careful Interpretation
Difficult to Gain Insight Into System Behavior Simulate Only a Set of Specific Scenarios

29Traffic Modeling and Simulation
When to Use Simulation
Whenever Mathematical Analysis Is Difficult or Impossible For Studying Transient Behavior of Networks For Systems With Adaptive Routing For Systems With Adaptive Flow Control For Systems With Blocking (Finite Buffers) For Systems With General Message Interarrival Statistics
For Validating Analytic Models and Approximations How Accurate Is the Model? Do Approximations Distort the Results?
For Experimentation Without Disturbing an Operational System Test Possible Modifications and Adjustments
30Traffic Modeling and Simulation
Modeling Elements for Communication Networks
Traffic and Input Processes Message Arrival Process
– Often Interarrival Times
Message Lengths Other Message Attributes
– Service Class– Error models
Algorithmic Descriptions of Network Processing Protocols Links and Queues Routing

31Traffic Modeling and Simulation
Time Step Approach to Network Simulation
Approaches to Discrete Event Simulation Time Step Approach (Fixed Increment Time Advance)
Event-Scheduling Approach
Fixed Increment Time Advance Choice of Increment Important Too Large: Multiple Events Happen In Single Step Too Small: Wasted Processing Time Update System States at End of Each Fixed Time Interval
32Traffic Modeling and Simulation
Event Scheduling Approach to Network SimulationVariable Time Advance Advance Time To Next Occurring Event
Update System State Only When Events Occur For Example, Arrivals or Departures
Event Calendar Events: Instantaneous Occurrences That Change the State of the System An Event is Described by
– The Time the Event is to Occur– The Activity to Take Place at the Event Time
The Calendar is a Time-Ordered List of Events

33Traffic Modeling and Simulation
Event Scheduling Approach:Simplified Flow Control
An Executive (or Mainline) Controls the Selection of Next Event
Use Event Listto determine next event to process
Advance simulation clock to event time
Update system stateusing event routines
Update event listusing event routines
34Traffic Modeling and Simulation
Event Scheduling for Simple Statistical Multiplexer

35Traffic Modeling and Simulation
Verification and Validation of Simulation Models
Model Mathematical (Algorithmic) Description of Behaviour of “Real
Thing”Verification Determining Whether the Simulation Model Performs As Intended In Programming Terminology, “Debugging” Example: Is M/M/1 Model Producing Exponential Message
Lengths?Validation Determining Whether the Simulation Model Itself Is an “Accurate”
Representation of the Communication Network Under Study (the “Real Thing”)
Example: Is the Assumption of Exponential Message Lengths Accurate?
36Traffic Modeling and Simulation
Verification Methods
Modular Development and Verification Break Large System Into Smaller ComponentsVerify Component-by-Component
Structured Walk-Through Step-by-Step Analysis of Behavior for Simple Case

37Traffic Modeling and Simulation
Verification MethodsEvent Trace Detailed Analysis of Model Behavior Compare to Walk-Through Analysis
Model Simplification and Comparison to Analytic ResultsGraphical Display of Network Status As the Model Progresses To “See” What Is Happening As It Happens
38Traffic Modeling and Simulation
Some Comments on ValidationSimulation Models Are Always ApproximationsA Simulation Model Developed for One Application May Not Be Valid for OthersModel Development and Validation Should Be Done SimultaneouslySpecific Modeling Assumptions Should Be TestedSensitivity Analysis Should Be PerformedAttempt to Establish That the Model Results Resemble the Expected Performance of the Actual SystemGenerally, Validation Is More Difficult Than Verification
39Traffic Modeling and Simulation
Analysis of Results: Statistical Considerations
Starting Rules Overcoming Initial Transients An Initial Transient Period Is Present Which Can Bias the Results Achieving Steady State
– Use a Run-in Period:Determine Tb Such That the Long-Run Distribution Adequately Describes the System for t > Tb
– Use a “Typical” Starting Condition (State) to Initialize the Model
Quality of Performance Estimates Variance of Estimated Performance Measures
40Traffic Modeling and Simulation
Quality of Performance EstimatesSimulation results are like laboratory measurements, they can be modeled as random variables Performance estimates should have acceptable varianceThe more observation reduces the variance.HOWEVER Observations taken from network simulation will be correlated Cannot directly apply standard statistical approaches based
on iid (Independent, Identically Distributed) observations
41Traffic Modeling and Simulation
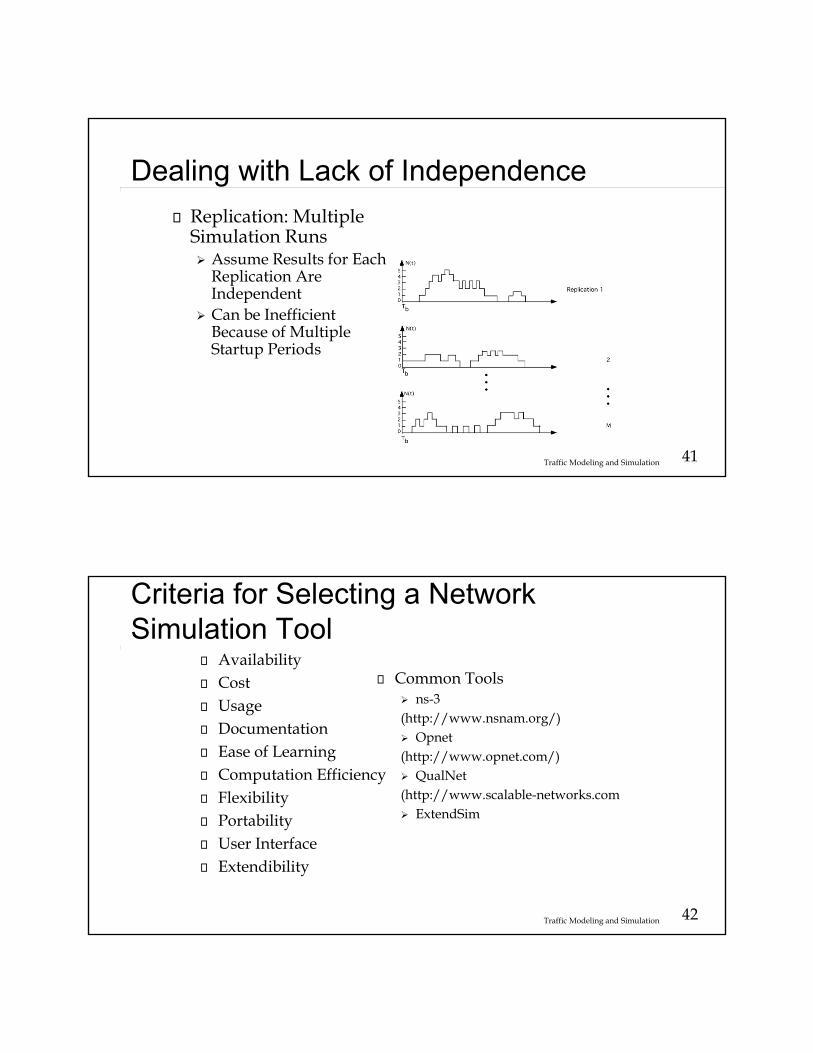
Dealing with Lack of Independence
Replication: Multiple Simulation Runs Assume Results for Each
Replication Are Independent
Can be Inefficient Because of Multiple Startup Periods
42Traffic Modeling and Simulation
Criteria for Selecting a Network Simulation Tool
AvailabilityCostUsageDocumentationEase of LearningComputation EfficiencyFlexibilityPortabilityUser InterfaceExtendibility
Common Tools ns-3 (http://www.nsnam.org/) Opnet(http://www.opnet.com/) QualNet(http://www.scalable-networks.com ExtendSim

43Traffic Modeling and Simulation
Guidelines to Network Modeling and Simulation
Things to Know Know the Customer Know the Network Know the Important Performance Metrics
Things to Do Establish a Credible Model Expect the Model to Evolve Plan for success Apply Good Software Management Techniques
44Traffic Modeling and Simulation
Conclusions
Simulation Can Be an Important Tool for Communication Network Design and AnalysisCare and Thought Must Go Into Construction of Communication Network ModelsCare and Thought Must Go Into Interpretation of Model Output
45Traffic Modeling and Simulation
Extend® Overview
Allows Graphical Description of Networks Sources, Links, Nodes, Etc.
Data Flow Block DiagramsHierarchical Structure to Control ComplexityBe sure and create libraries when creating complex models