traffic information system a thesis submitted to the
TRANSCRIPT

i
TRAFFIC INFORMATION SYSTEM
A Thesis
Submitted to the Department of Computer Science and
Engineering
of
BRAC University
by
Tanjima Ali
Student ID: 07110097
In Partial Fulfillment of the
Requirements for the Degree
of
Bachelor of Science in Electronics and Communication
Engineering
April 2010

ii
DECLARATION
I, Tanjima Ali, student of Electronics and Communication Engineering
department, BRAC University represent my thesis work “Traffic Information
System of Dhaka City” as requirement of completion of bachelor degree. This
thesis reserch was performed under supervision of Dr. Mumit Khan,
Professor, BRAC University, Dhaka, Bangladesh.
This is to declare that the thesis work was done by me and it has not been
submitted before. The help that was taken from internet and books was
mentioned at references.
Signature of
Supervisor
Signature of
Author

iii
ACKNOWLEDGMENTS
I am grateful to my Almighty Lord for blessing me with the patience and
knowledge and the opportunity to learn something new.
I am thankful whole heartedly to my thesis supervisor Dr Mumit Khan for his
believing in my and pushing me to do better. He inspired me and gave
solutions to problems I could not solve.
I am thankful to all my teachers who gave me suggestions and advices.
I thank Syed Rakib Al Hasan to help me out with the Java codes.
And last but not the least I thank my family to support me in times of need.

iv
ABSTRACT
Traffic Information System will assist travelers with planning, perception,
analysis and decision making to improve the convenience, safety and
efficiency of travel . It will provide the traveler three facilities: route planning,
alerting for traffic jams and alternative routes.. The goal of route planning is to
locate a connected sequence of road segments from a current location to a
destination. Route computation may be based on criteria such as the shortest
travel distance or travel time. Route computation is also useful for travel
during rush hour, travel in unfamiliar areas, and/or travel to an unfamiliar
destination. The goal of route evaluation is to find the attributes of a given
route between two points. These attributes may include travel time and traffic
congestion information, and thus route evaluation is also useful for selecting
travel time by a familiar path. The goal of route display is to effectively
communicate the optimal route to the traveler for navigation. In this project,
the focus is put on algorithms for real-time route computation on maps stored
in a database and to compute the data to be delivered to the traveler.

v
TABLE OF CONTENTS
Page
TITLE……………………………………………………………….......................…i
DECLARATION….......................................................................................…..ii
ACKNOWLEDGEMENTS................................................................................iii
ABSTRACT………...........................................................................................iv
TABLE OF CONTENTS..........................................................................…......v
LIST OF TABLES...........................................................................................vii
LIST OF FIGURES.........................................................................................viii
Chapter 1: INTRODUCTION
1.1 Current Traffic Situation…………………………………...............1
1.2 Research Objective…………………………………………….......1
1.3 Traffic Information System….……………………………………..2
Chapter 2: Literature survey
2.1 Background…………………………………………………………5
2.2 Literature Survey……………………………………………………5
2.3 My Contribution…………………………………………………….8
Chapter 3: Methology……………………………………………………………..9
3.1 Variables……………………………………………………………..9
3.2 Historical Profile……………………………………………………11
3.3 Enterprises …………………………………………………………13
3.4 Graph Distribution of Trafic……………………………………….15
3.5 Pattern Recognition………………………………………………..17
3.6 Link Weight.................................................................................20
3.6.1 Segmentation....................................................................20
3.7 Digitizing………………………………….....................................23
3.7.1 Geo-Referencing…………………………………………….24
3.7.2 Digitizing………………………………………………………24

vi
3.8 Nodes and Links Refencing………............................................24
3.9 Building Graph...........................................................................27
4.0 Algorithm...................................................................................28
4.1 Shortest Path........................................................................... 30
Chapter4: Summary……………………………………………………………….31
Conclusion……………………………………………………………….31
Chapter 5: Future Work ………………………………………………………….32
REFERENCES...............................................................................................33
APPENDICES
A. Java Classes for computing edge……………………………………….
B. Matlab M file for equation derivation……………………………………

vii
LIST OF TABLES
Table Page
Table1: Link Database …………………………………………………………..10
Table2: Monthly Update on roadworks and weather hazards ……………...10
Table3: Link objects and properties …………………………………………..11
TABLE6: Establishment type …………………………………………………..15
Table 7: Day Segmentation…………………………………………………….20
Table8 : establishment weight Throughout the day………………………….21
Table 9: Referencing the Nodes ………………………………………………25
Table 10: Node and Link Database for efficient path computation ……….26
Table 11: Types of road and their test values as speed ……………………27
Table 12: Link data ……………………………………………………………...27

viii
LIST OF FIGURES
Figure Page
Fig 1: Overall View of the System 3
Fig 2: Result by SMS and on web…………………………………………………4
Fig 3: Data flow in the system…………………………………………………… 4
Fig 4: Hourly basec traffic pattern [Google Image]………………………….. 12
Fig 5: Traffic pattern for each days of the week. [Google Image]……………12
Fig 6: Different destity of different establishment at every 2 hour interval of the
day …………………………………………………………………………………..14
Fig7: similar pattern for Schools of different size………………………………16
Fig8: Graph distribution gives us the assumption on number of cars in that
time of the day ……………………………………………………………………..17
Fig8 : Number of vehicle for a day in 4 different enterprises of each medium
sized. No of vehicle versus time of the day…………………………………….18
Fig9: We can use matlab to generate the pattern……………………………...18
Fig10 :Graph and equation for a Small School…………………………………19
Fig11: Graph and equation for a Medium School………………………………19
Fig12: Graph and equation for a Big School……………………………………20
Fig: 13 No. of Vehicle to time assumption……………………………………..22
Fig14 : Scanned copy of Dhaka city …………………………………………….24
Fig 15: Link weight computation towards the destination only………………..25
Fig16: A directed graph……………………………………………………………28
Fig 17: Dijkstra’s Shortest Path Algorithm………………………………………29

1
CHAPTER 1: INTRODUCTION
1.1 Current Condition*
The number of vehicles in Dhaka city is around 7 times the capacity of its
roads. 180 new vehicles including motorbikes step onto the city streets everyday.
In last 6 years, the volume of motorized and non-motorized vehicles has almost
doubled, while only 2 new main inter-city roads (thoroughfares) - Doyaganj to Jurain
and Bijoy Sarani to Agargaon, built in last two decades.
A mega-city like Dhaka should have 25 % of its size dedicated to roads. In Dhaka,
currently, only 8 % of its total area is claimed by roads and 3 % of that is meant for
public transport and heavy vehicles.
These are the main reasons why we take 2 hours to reach our destination which is
actual 20 minute drive. We waste a large portion of our time in roads, get tired and
lose money, creating more traffic jam and make us immobile. * The datas are from reference [1],[2,][3]
1.2 Research Objective
.
This paper has been developed for advancing the mobility of the Dhaka City
dwellers with traffic information system. Mobility is a factor that enables us to
accommodate visiting friends and family apart from our home and work within our
daily schedule, as well as to allow us to do business across a wider region.
Transportation has the ability to provide some powerful benefits to our society.
Dhaka being the center of all important establishments, more and more people are
coming to Dhaka making the city more and more congested. Having better
transportation system will enable people to do business and work beyond the

2
perimeters of Dhaka. Transportation will help Dhaka to decentralize and less
congestion. Apart from these, faster transportation will provide us with the sort of
mobility and accessibility we need to live our lives in the way we want to live them.
But there is always a link between economic well-being and good transportation.
Nonetheless, there is a price to pay for good transportation. This comes in the form
of undesirable and at times unavoidable side effects such as environmental impacts,
energy consumption, land take, congestion, casualties and money required building
infrastructure. Growing concern about the impact of these undesirable side effects
has influenced most developed countries to move away from the infrastructure-
intensive, capital-intensive transportation strategies, toward more balanced and
sustainable transportation solutions. That is where Traffic Information System (TIS)
comes into picture and holds the promise of sustainability.
1.3 Traffc Information System
Traffic Information Systems (TIS) is the name given to the application of
computer and communications technologies to transport problems. It is mostly
recognized as Information Transport System (ITS).
The system is designed so that users can plan their route according to the congesion
level and distance to save them time and energy.
The first part is to collect the raw data. Datas that need for the computation of the
shortest path are Maps, road speeds, location of enterprises, and time of the day.

3
PHP dHTML
dHTML
HTML HTML
WML WML
stylesheetXSL
Dijkstra J2EE
request
Client format
XML
Combining engine
delivery engine
Client format
RAW data
Asynchronous update
Fig 1: Overall View of the System [taken from Personalized Services for Mobile
Route Planning: A Demonstration - by W.-T. Balke, W. Kießling & C. Unbehend]
Fig 1 displays the overall picture of the system. The client Gives the input of the
souce and the destination. Asynchronous update of the server is turned on always.
The update is asynchronous because of the fat that different variable are updated at
different frequency. For example traffic update can be done as frequent as every 10
minute, whereas informaion on roadworks are done once a month.
Based on the user input, the start node and the end node is marked and relevant
datas are extracted from the server. Dijkstra’s algorithm runs on the graph which
computes the shortest path.
Once the routes are selected standard XML technology – including XSLT – achieves
the automatic conversion of traffic information in generic XML formats for the
delivery to a variety of mobile devices as stated in [7]. The result can be wrapped
according to the stylesheet and result can be displayed on the web as well.

4
Fig 2: Result by SMS and on web
This paper focuses on giving weight to links and connecting them to nodes based on
traffic updates and historical profile to compute the shortest path based on distance
and drive time.
The flow of the data in the context of this thesis is is slown in fig 3.
Fig 3: Data flow in the system
5
CHAPTER 2: Literature survey
2.1 Background
Japanese seems to have initiated the whole modern day notion of ITS with work
carried out in the 1980s. The United States was also addressing the application of
ITS at an early stage in the course of the Electronic Route Guidance project (ERGS)
in the 1970’s. The European Union picked up the theme, and referred to it as Road
Transport Informatics. In the course of time the name of this technology subjected to
many changes until USA had given a name called ITS to it.
The countries like USA, Canada, Japan, U.K., Australia and Germany which have
embarked upon intelligent transport system (ITS) don’t have scarcity of funds.
Considering these facts, Bangladesh needs a system, which is cost effective, and
efficient, at the same time is also compatible with the present level of development in
the country in the related areas. At present no such system is running in our Country.
Related research papers include: GIS Based Real Time Traveler Information System
that supports the operation of an Advanced Traveler Information System (ATIS) in
the context of the available media of Bangladesh. 2.2 Literature Survey
Source: Personalized Services for Mobile Route Planning: A Demonstration -
by W.-T. Balke, W. Kießling & C. Unbehend
The Paper demonstrates how an entire system is developed starting from data
collection from all different sources to implementing in online demonstration based
on wireless network. The application requires high band width to process and deliver
the output to the user. Situation ware mobile demonstration keeps in mind of all
kinds of variables such as driver preference, route condition, and real time traffic
update. It guarantees the output in 3 seconds based on the Noval SR algorithm.

6
Source: Performance and Quality Evaluation of a Personalized Route Planning
System – by Wolf-Tilo Balke, Werner Kießling & Christoph Unbehend
This paper is a total evaluation of the personalized route planning system. The
papers describes in details about the various functions and the variables it takes to
compute the digital weight of the traffic. It also deals with special events and
incidents like blocked roads and snowfall. Testing of the algorithm to understand its
run time is demonstrated clearly.
Source: Top-k Query Processing in Uncertain Databases – by Mohamed A.
Soliman, Ihab F. Ilyas & Kevin Chen- Chuan Chang
The paper describes about the Top-k Query Processing which is described as an
efficient stack which can return data from database in constant time. Top-k Query is
an uncertain database that is it receives data at random basis. As the name
suggests the tuples are stacked in priority based and returns the top most tuple on a
query. the paper also discusses about certain database cases and scenarios where
Top-k Query performed seamlessly.
Source: A Situation-aware Mobile Traffic Information System – by W.-T. Balke,
W. Kießling & C. Unbehend
This is the main paper of the Mobile Traffic Information System. The paper
describes all the variables and the necessary information about the design of the
system. It shows hoe effective the SR algorithm runs when incorporated with Top-k
Query. The resulting performance of the system when tested on an entire city of
Germany is only 3 seconds. The system provides all the solution of traffic and route
planning problem only drawback being the system is applicable under high
bandwidth.

7
Source: GIS Based Real Time Traveler Information System: An Efficient
Approach to Minimize Travel Time Using Available Media – by Md. Abul Hasnat,
Mohammad Mahmudul Haque & Mumit Khan
The paper is a comprehensive traffic information system within the context of Dhaka.
The System keeps a database to keep its data and to update. The system is done in
a small scale and sufficient testing is done to validate the outputs. The system is
scalable and can be extended for bigger database.
Source: Simulation of Dijkstra Routing Algorithm – by Sriram Narayanan
A complete understanding on how the dijkstra’s algorithm works for small and large
networks. The paper also gives detailed analysis of static and dynamic routing using
dijstra’s algorithm to compute the shortest and the most efficient path.
Source: Path Computation in Advanced Traveler Information Systems – by
Shashi Shekhar & Andrew Fetterer
The paper gives comparison on shortest path algorithms between iteration method,
Dijkstra’s Algorithm and A* Algorithm. The paper computes their running cost and
derives the Big Oh for each algorithm.
Source: AN INTERACTIVE DIGITAL GUIDE MAP OF DHAKA CITY – by Meher
Nigar Neema, Farhana Ahmed, Farzana Akhter & K. M. Maniruzzaman
The paper is a development of Dhaka city using ArcView and GIS software for
customizing, creating and editing maps. The maps can add, delete establishments
and computes data logs which can be used for route planning, to measure length of
roads and to find the closest facility.
Source: GIS Based Navigation System of Dhaka City – by Mufti Shahriar Haque
& Tapan Biswas
8
A GIS based software design that requires digitizing the data and this is done by
Google Earth in this paper with the use of longitudes and latitudes to compute the
length of roads.
2.3 My Contribution
My thesis is focused on improving the mobility of the residents of Dhaka through an
Intelligent Transport System (ITS).
According to the context of Dhaka city, the system is designed such that every link
can be declared independent of its surroundings. The establishments carry the
weight which computes to be the total weight of te link itself. Matlab is used to
determine the characterictics of the establishments at a given time of the day.
The graph can be digitized using ARC View GIS where we can customize maps and
add and remove establishments.
The overall system will hold huge database. Parallel computation of weight
establishments and graph making are done to ensure real time traffic update.
The design also keeps into consideration of searching the graph only in the direction
needed rather than computing the weights of the entire links and then run the
alrogithm into the entire map of Dhaka city.
The system has been designed in such a way that it can be extended and be used
for the entire country. There are plenty of room for improve and research. The static
update of the system can be converted into dynamic update and the frequency of
update can be changed accordingly.

9
CHAPTER 3: METHODOLOGY
Collecting Raw data:
Traffic congestion has many factors associated with it.
• Road maps with average speed in each road: which is a fixed variable.
Assuming the only mean of transportation being CNG and the average speed
being 15m/s. Though the speed at night is way higher than at day, but that too
is due to the fact that more cars are around at day which slows the speed
down.
• Information on Road works : this information if mainly whether the lanes are
capable of passing vehicle or not. Being updated once a month will be good
enough.
• Weather Reports: in context of Bangladesh where a little rain causes many
important lanes to go under water, whether plays a major role in determining
the time required for travelling. Traffic pattern based on whether has to be
updated regularly during rainy season.
• Historical profiles: one of the most important factors through which we can
make probabilistic assumption about the weight of the traffic in each lane.the
profile is created by counting the number of cars passing a lane with and
without establishment.
• Real time traffic information: we will keep the traffic update as fresh as
possible to build reliable historical profile, as real time traffic data is difficult to
collect.
3.1 Variables to be stored:
Roads in the city were categorized as highways(Big), major roads(Medium) and
minor roads(Small). Each category in the database is given a different average
speed. Roads which are having names are identified and that data is stored in this
database. More than type of vehicle travels on one road. Storing all types of vehicles
traveling on each road segment is very difficult; besides this it increases the size of
database. Data base for one-way, road segment length, speed limit and drive time is

10
created. List of establishments for example educational institutions, hospitals, bus
stations, offices, are stored in their corresponding data bases. Description and
information of fields in data bases of different links are given in table 1.
Link RoadName
Linked
Nodes Length/m Road Type
Speed
m/s
Avg No.
vehicle/hr
link
establishment
Link1 Banani11
Node1,
Node3 1500 Medium 15 380
School2,
Office1,
ShoppingMall2
Link2 Lane2
Node3,
Node2 600 Small 20 65 School1
Table1: Link Database
Apart from the properties and feature of each link, databases will keep records of
roadworks and weather reports. This data are updated once a month and the maps
are refreshed accordingly
Table 2 demonstrates one such table where data till July is available.
Jan Feb Mar Arp May Jun Jul Aug Sep Oct Nox Dec
Link1 Ok Ok Ok Ok Down Down Down N/a N/a N/a N/a N/a
Link2 Down Down Ok Ok Ok Ok Ok N/a N/a N/a N/a N/a
Link3 Ok Ok Ok Ok Ok Ok Ok N/a N/a N/a N/a N/a
Table2: Monthly Update on roadworks and weather hazards

11
Link Objects Link Properties
Schools Distance
Hospitals Speed
Shopping Mall one-way
Offices Vehicle numbers
Length
Table3: Link objects and properties
3.2 Historical profiles:
A Historical Profile (HP) is summary statistics such as mean/median travel time for
each time period (e.g. every 10 minutes) of a link which are observed for a certain
past time periods (e.g. last 100 days). For example, if average travel time is used as
a HP, it represents the average value of the observed link travel times over the
certain past time periods.Therefore each link is assigned to a representative value
for each time period. To illustrate the HP, consider a freeway road from Gulshan 1 to
2. Figure 4 shows the congestion on an hourly basis. It may be seen that various
levels of congestion occur during both the peak and non-peak periods. The data
were collected over a twenty- four hour period each weekday in both directions of
travel for a certain number of days, suppose 100 weekdays from May to August, to
generate a pattern for the traffic congestion of that particular link.

12
Fig 4: Hourly basec traffic pattern [Google Image]
Fig 5: Traffic pattern for each days of the week. [Google Image]
Figure shows a typical congested traffic pattern exhibits on a particular day of the
week. Two graphs, for two consecutive days, are compared, and large congestion
areas are found at around the same locations during the same time of the day.
Based on the fact that the traffic possesses deterministic behavior, we can predict
future travel time using historical data. However, since travel time is highly volatile to
environmental impact, namely weather conditions and traffic incidents, obtaining

13
impeccable predictions are highly unlikely and require substantial amount of
knowledge not only on environmental factors but traveler’s driving habit as well.
Current predicting time and historical mean profile has to be merged to get output of
maximum reliability. Current time predicting method computes travel time from the
data available at the instant when prediction is performed. Historical mean predicting
method computes travel time from the average travel time of the historical traffic data
at the same time of day and day of week.
Other important issue to be cleared with respect to HP is about “how many days data
should be used for HP” and at the same time “how frequently the HP should be
calibrated. This will widely vary depending of the survey and pattern of the reports.
3.3 Role of Enerprises and their significance:
Establishments are academic buildings, hospitals, schools, offices, banks, shopping
mall and other places which causes traffic congestion. It has been noticed
establishments causes traffic to attact and thus more congestion. In the context of
this paper all roads are of equal weight without any congestion. It is the addition of
establishment on roads that makes the link more congested than others.
The paper demonstrates the system with four types of establishment:
• School
• Office
• Shopping Mall
• Hospital
The types are categorized based on the similarity of traffic attraction by each
establishment. For example building that are mostly comgested at around 7am to
9am and 1pm to 3 pm are put into type School. Office shows similar characteristics
but at different time of the day like 8am to 10 am and again at 4pm to 6 pm.
Whereas Shopping Mall and hospitals shows somewhat moderate traffic throughout

14
the day with a peak toward the evening. Moreover hospitals also has a small traffic
even at midnight which any other establiment lacks as exhibited in figure.
-50
0
50
100
150
200
250
300
School Office Shopping Mall Hospital
Fig 6: Different destity of different establishment at every 2 hour interval of the day
But problem arises when we generalize a big sized school and a small one into
same type. Thus each of the establishment can be catagorised into 3 types:
• Big
• Medium
• Small

15
0
50
100
150
200
250
4am 6am 8am 10am 12pm 2pm 4pm
Small Medium Big
Fig7: similar pattern for Schools of different size
It is observed that each of the graphs follow a similar pattern. If the equation of the
graph is
ax3+ bx2+ cx + d
Then only the variables a,b,c,d for each of the category of small medium and large
will vary.
Size Key Small 1
Medium 2 Big 3
TABLE4: ESTABLISHMENT TYPE
For example if we have a small sized school and a big sized school, they are
referenced as School1 and School 3 recpectively.

16
3.4 Graph Distribution of Traffic:
We count the number of cars passing the links in the predefined parts of the day. For
example for time frame ‘b’ that is 7am to 12 pm we keep a log of the no of vehicles
that the establishment attracts and time required to pass for that establishment. This
is recorded every day for 1 month and the results are fed into matlab to produce the
function that predicts the time taken to traverse given the time of the day for that
particular establishment.
Fig8: Graph distribution gives us the assumption on number of cars in that time of
the day
Distribution of traffic congession is done graphically by plotting graph of time versus
no of vehicle as shown in fig 4.

17
0
50
100
150
200
250
300
School Office Shopping Mall Hospital
Fig8 : Number of vehicle for a day in 4 different enterprises of each medium sized.
No of vehicle versus time of the day
Matlab can be used to generate the average equation for each of the enterprise.
3.5 Pattern Recognition:
Pattern recognition is done to genralise the graph maps. Small and Big schools show
similar pattern in their graphs. Therefore all Schools are dealth in the same way that
is all Schools are eliminated from the weight calcution of links during the time frame
of a, (that is 12 am to 7 am).

18
0
50
100
150
200
250
4am 6am 8am 10am 12pm 2pm 4pm
Small Medium Big
Fig9: We can use matlab to generate the pattern
We can get the graphs of these data. It is observed that all School follow the same
pattern, with varying coefficient
Fig10 :Graph and equation for a Small School

19
Fig11: Graph and equation for a Medium School

20
Fig12: Graph and equation for a Big School
3.6 Link Weight and time calculation
3.6.1 Segmentation
One day i.e 24 hours is segmented into ‘n’ parts. For the context of this thesis
‘n’ has been considered as 4 as shown in the figure
Keys Time frame
a 12am to 6am b 6am to 12pm c 12pm to 6pm d 6pm to 12pm
Table 7: Day Segmentation
This is done to take into consideration of only relevant establishment while
computing weights.

21
Establishments are added into the links depending on the time of the day. For
example. During the night time a link might have school but to compute the link
weight it will not be considered. Only hospitals are taken into consideration at night.
At morning Schools and offices make up for the maximum weight with hospitals
giving moderate weight and shopping malls the least weight. This is how a link
determines its weight throughout the day.
Time frame establishment Weight
A Hospital 1
School, 2
Shopping mall 1
Hospital 2
B
Office 2
Offices, 2
Shopping Mall 3
Hospital, 3
C
School 1
Hostipal, 2 D
Shopping Mall 2
Table8 : establishment weight Throughout the day.
This weights are simple the vehicle density ratio. For hospital at night it has the least
traffic density and at the evening the most.
School, Office, has no traffic at night. Thus they have no link weight.
Each link will have its own length. Time taken to traverse that is t0. Then the link
adds up establishments depending on the time of the day and each establishment
assigns its own weight. These total weights of the links are added and coverted to

22
time from the graph. This multiplied by the time factor which was obtained by the
matlab function.
The graph gives us y i.e no of vehicle at a given time of the day i.e x. Once we input
x we get the corresponding y. This value of y is multiples by a factor depending on
the size of the establishment. As it was noted from the pattern that the coefficients of
a big extablishment is 3 times the coefficient of small establishment.
This is done so that we only need to feed data from one graph for each
establishment. Once we have the Vehivles number we can get the time to traverse
that number of vehicles for that establishment as shown in figure 13. This added with
all other times compute tt . Thefore the total time is initial time added with the
shortest time.
ttotal = to+ts
Fig: 13 No. of Vehicle to time assumption
23
3.7 Digitizing Maps
The city map is already defined and it remains static till the administer manually
updates the city map that is delete or add new roads.
Graph built with the distance as link weight is the path based on diatance. ArcView
GIS software which is a desktop GIS with an easy-to-use, point-and-click graphical
user interface (GUI) that lets us easily load spatial and tabular data so we can
display the data as maps, tables, and charts can help us to get the distances
between nodes.
ArcView scripts are macros written in Avenue, ArcView's programming language and
development environment. Avenue can customize almost every aspect of ArcView,
from adding a new button to run a written script, to creating an entire custom
application that we can distribute.
The paper al
3.7.1 Geo-Referencing
Raster data is obtained by scanning maps or collecting aerial photographs and
satellite images. Scanned maps don’t usually contain information as to where the
area represented on the map fits on the surface of the earth. The location
information delivered with aerial photos and satellite imaginary is often inadequate to
perform analysis or display in proper alignment with other data. To establish the
relationship between an image (row, column) coordinate system and a map (x, y)
coordinate system we need to align or georeference the raster data (image).
3.7.2Digitizing
Digitizing is a process of encoding geographic features in digital form as x, y
coordinates. It is carried out in order to create spatial data from existing hardcopy
maps and documents. In the present work, the raster images of Dhaka city can be
digitixed using ArcView GIS. This type of digitization is called on-line digitization.
Road network of the study area can be digitized as line features. Schools, hospitals,
offices, and Shopping areas are digitized as point features.

24
Fig14 : Scanned copy of Dhaka city
This will help us to get the road length and r\to create the database of
establishments linked to particular roads
3.8 Nodes and Links Referencing
Once we have the nodes and the links from the digital maps we need to
restrict the search directions to ensure efficiency. From a source A to destination B
which is North of A as shown in figure, we want to take the routes that will be
towards A rather than the ones opposite to the destination. This will save us time of
computing the weight of each link.
25
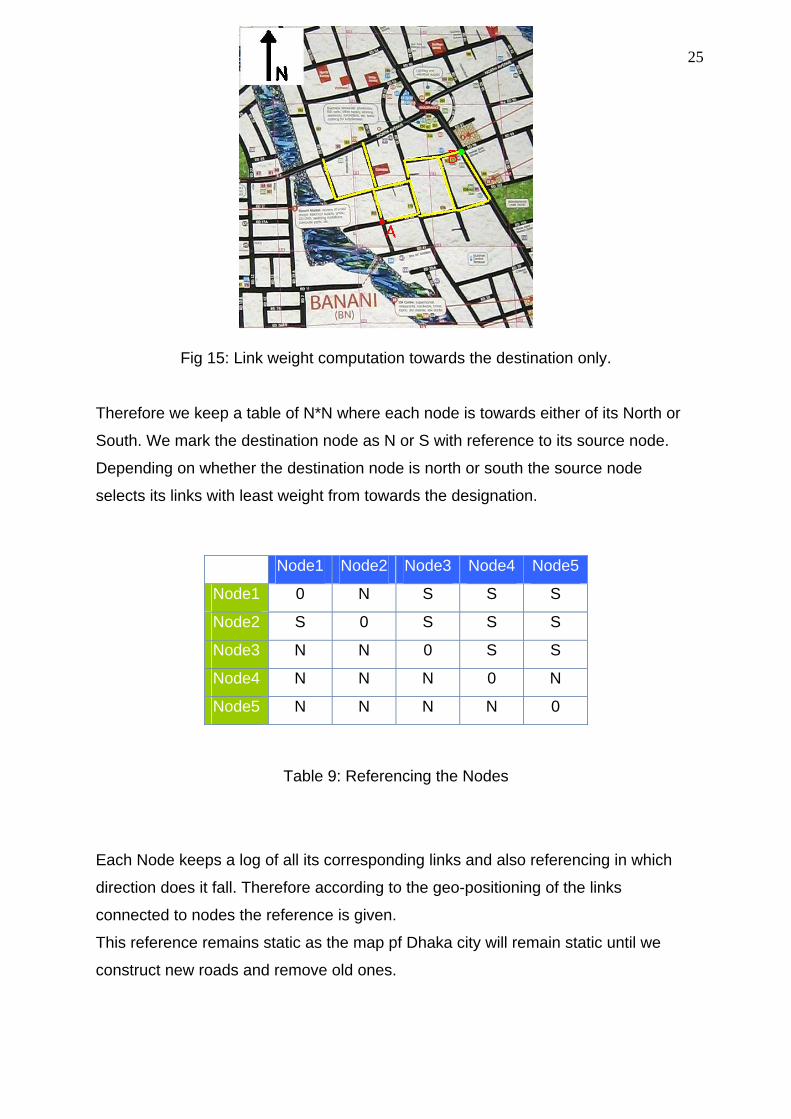
Fig 15: Link weight computation towards the destination only.
Therefore we keep a table of N*N where each node is towards either of its North or
South. We mark the destination node as N or S with reference to its source node.
Depending on whether the destination node is north or south the source node
selects its links with least weight from towards the designation.
Node1 Node2 Node3 Node4 Node5
Node1 0 N S S S
Node2 S 0 S S S
Node3 N N 0 S S
Node4 N N N 0 N
Node5 N N N N 0
Table 9: Referencing the Nodes
Each Node keeps a log of all its corresponding links and also referencing in which
direction does it fall. Therefore according to the geo-positioning of the links
connected to nodes the reference is given.
This reference remains static as the map pf Dhaka city will remain static until we
construct new roads and remove old ones.

26
Node Link Position
Node1 Link1 N
Link2 S
Link3 S
Link4 S
Node2 Link1 S
Link5 S
Link6 S
Node3 Link2 N
Link5 N
Link7 S
Link8 S
Node4 Link3 N
Link8 N
Node5 Link4 N
Link7 N
Link6 N
Table 10: Node and Link Database for efficient path computation
Table 3 shows how links keep their objects. As Link1 has School1, School1, and
Office3 under its colum opf establishment. This signifies Link1 has two small sized
school and one Big sized Office. Therefore while computing the weight of the link,
the relevant weights of the establishments will be added. Then comes the type of the
Link. Link1 is catagorised as Small. Which imples, Link1 will use 15m/s as in table its
road speed to traverse its length of 1500 metre.

27
Road Link Type Average Speed Streets Small 15m/s Main Streets Medium 18m/s Highway Big 25m/s
Table 11: Types of road and their test values as speed
Therefore the links will have its weight based on the relevant establishment at a
certain time of the day. Every link will have a initial traverse time that is the time
taken to pass that road given the speed which is independent of time of the day and
number of establishment.
Link Establishments Type Length/m
Link1
School1,
School1,Office3 Small 1500
Link2 Hospital2 Small 1800
Link3
School1,
ShoppingMall2 Medium 2500
Link4 School3, Office1 Big 4800
Link5 ShoppingMall3 Small 3500
Link6 Null Small 700
Link7 Null Small 1100
Link8 Office1 Small 600
Table 12: Link data

28
3.9 Buiding Graph
Fig16: A directed graph
A (directed) graph G = (N, E, C) consists of a node set N, a cost set C(link weight),
and an edge set E. The edge set E is a set of all the links that connects the Nodes N.
Each element (u, v) in E is an edge that joins node u to node v. Each edge (u,v) is
associated with a cost C(u, v). Cost C(u, v) takes values from the weight
computation of each link.. A node v is a neighbor of node u if edge (u, v) is in E. The
degree of a node is the number of neighboring nodes. A path in a graph from a
source node s to a destination node d is a sequence of nodes (v0, v1, v2, ..., vk)
where s = v0, d = vk, and the edges (v0, v1), (v1, v2), ..., (vk-1,d) are present in E.
The cost of the path is the sum of the cost of the edges.
4.0 Algoritm Analysis
For the efficient real-time evaluation of numerical preferences we can use the
novel SR-Combine algorithm [5]. A system prototype has been demonstrated
recently at [6].
The best-first search has been a framework for heuristics which speed up algorithms
by using semantic information about a domain and it has been explored in database
contexts for single-pair path computation [8]. A* is a special case of the best-first
29
search algorithms. It uses an estimator function f(u,d) to estimate the cost of the
shortest path between node u and d. A* has been quite influential due to its
optimality properties. A best-first search without estimator functions is not very
different from Dijkstra's algorithm
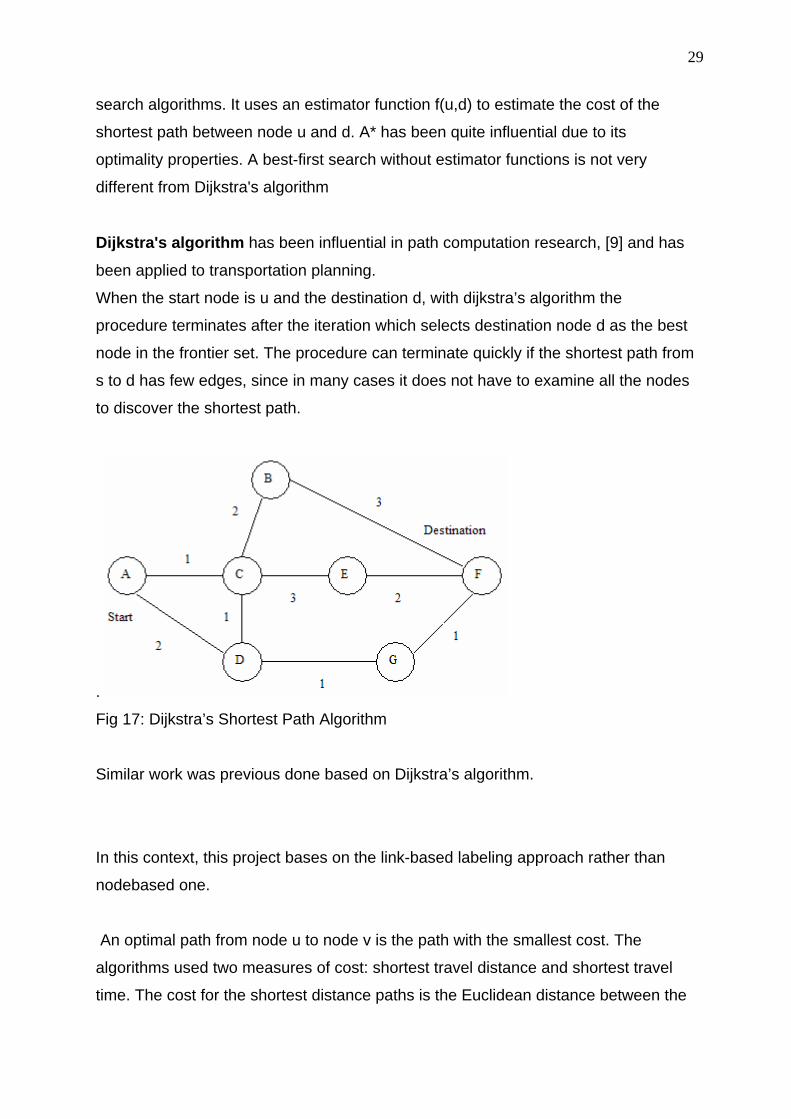
Dijkstra's algorithm has been influential in path computation research, [9] and has
been applied to transportation planning.
When the start node is u and the destination d, with dijkstra’s algorithm the
procedure terminates after the iteration which selects destination node d as the best
node in the frontier set. The procedure can terminate quickly if the shortest path from
s to d has few edges, since in many cases it does not have to examine all the nodes
to discover the shortest path.
.
Fig 17: Dijkstra’s Shortest Path Algorithm
Similar work was previous done based on Dijkstra’s algorithm.
In this context, this project bases on the link-based labeling approach rather than
nodebased one.
An optimal path from node u to node v is the path with the smallest cost. The
algorithms used two measures of cost: shortest travel distance and shortest travel
time. The cost for the shortest distance paths is the Euclidean distance between the

30
nodes, and the cost for the shortest travel time paths will be the average travel time
across the edge.
4.1 Shortest Path
The dijkstra algorithm will run on the same graph connecting the nodes and
links. The links will have traffic congesion as weights. This path will be the shortest
path based on time. If the weights of the links are based on distance, the algorithm result gives the path
based on shortest distance.

31
CHAPTER 4: SUMMARY
Route planning is a process that helps vehicle drivers to plan a route prior to
or during a journey. It is widely recognized as a fundamental issue in the field of
transportation. A variety of route optimization criteria or planning criteria may be
used in route planning. The quality of a route depends on many factors such as
distance, travel time, travel speed and number of turns. These all factors all can be
referred as travel cost. Some drivers may prefer the shortest path based on
distance and some prefer based on travel time [4].
The route selection criteria can be either fixed by a design or implemented via a
selectable user interface. In the current project route selection is via user interface.
In the optimization of the travel distance (road segment length), distance was stored
in digital data base and the route planning algorithm was used. In the optimization of
travel time, road segment length and speed limit on that road are stored in digital
data base and travel time was calculated (distance/speed limit). The calculated travel
time was used as travel cost in the performance of path optimization.
Comclusion
The transportation of Dhaka City has been progressively deteriorating over for
years now. We the residents have become so tired of complaining that it has now
become a part of our daily life. This has emerged now as a major barrier to our
economic growth. Corruption, bureaucracy and poor urban planning have reached
an abysmal level resulting in only two new roads over the last two decades. Traffic
Information System will assist travelers with planning, perception, analysis and
decision making to improve the convenience, safety and efficiency of travel. It will
provide the traveler three facilities: route planning, alerting for traffic jams and
alternative routes. The goal of route planning is to locate a connected sequence of
road segments from a current location to a destination.
Needless to say that the woes of the residents of Dhaka due to its poor
transportation infrastructure can only be solved by good governance and proper
attention from the authorities. My Transport Information System would, however,
help the users to the least plan their travel time intelligently and informatively.

32
CHAPTER 4: FUTURE WORK
The system will provide travelers with planning and deciding on the shortest
and most efficient route. It has enouh scope for improvement and research. The
paper covers a proposed method to contain a reliable assumption on route weights.
The paper uses test datas for the design purpose.
The next step to process would be collecting actual datas and run the system in
small scale. Keeping in mind of efficient output and interactive results, the variables
fields can be fine tuned to obtain dynamic system that can provide real time traffic
update.
The system is designed independent of each other. Each lane has only its length as
a fixed variable. Establishments can be added and removed as required.
We can also dele lane or upgrade a narrow road into a main road if needed.
Using more time segmentation of the day, we can get much better results. We can
also include more types of establishment.
The system is designed in JAVA where each establishment is an object. Link itself is
an object which adds up other objects to it to compute the weight. Schools, Hospitals
are instance of establishment.
User Interface for wev based application and mobile application will be the next step
of thr process.

33
LIST OF REFERENCES
[1] http://www.southasianoutlook.com/issues/2010/march/diabolic_dhaka.html
[2] http://www.thedailystar.net/story.php?nid=125228
[3] www.dwatch-bd.org/rassu1/reports/transportation.doc
[4]. Yilin Zhao,” Vehicle location and navigation systems”, Artech house, London,
1997.
[5] W.-T. Balke, U. Güntzer, and W. Kießling. On Real-time Top k Querying for
Mobile Services,
Intern. Conf. on Cooperative Information Systems (CoopIS’02), Irvine, 2002.
[6] W-T. Balke, W. Kießling, C. Unbehend. Personalized Services for Mobile Route
Planning:
A Demonstration. In Proceedings of the 19th International Conference on Data
Engineering
(ICDE 2003), Bangalore, India, IEEE Computer Society Press, 2003.
[7] A Situation-aware Mobile Traffic Information System
W.-T. Balke, W. Kießling, C. Unbehend
Institut für Informatik, University of Augsburg, Augsburg, Germany
{balke, kiessling, unbehend}@informatik.uni-augsburg.de
[8]http://reference.kfupm.edu.sa/content/p/a/path_computation_in_advanced_travele
r_in_1682442.pdf [ Path Computation in Advanced Traveler Information Systems]
[9] http://bulletin-mif.unde.ro/docs/20091/7FEKI_FIRAS.pdf [ Advanced Traveler
Information System: An Agent-based Approach for Itineraries Web-Services
Composition

34
APPENENDICES
A. JAVA Files public class Edge{
private final int roadAvgSpeed = 15; //in meters per second;
private Structure [] buildings = new Structure[10];
private Structure [] filteredBuildings;
private String roadLabel = "noRoadName";
private int marker = 0;
private int normalTraverseTime = 0; //in seconds
private int totalStructuresWeight = 0;
private int totalStructuresTime = 0; //in seconds
private int totalRoadTime = 0; //in seconds
public Edge (String roadLabel , int roadLength){
//roadLength in meters;
this.roadLabel = roadLabel;
calculateNormalTraverseTime(roadLength);
}
private void calculateNormalTraverseTime(int roadLength){
normalTraverseTime = roadLength / roadAvgSpeed; //in seconds
}
//add a building to the edge and updates the marker
public void addStructure(Structure struct){
if (marker >= buildings.length){
System.err.println("Too many buildings for one road");
}
else{
buildings [marker++] = struct;
}
}
private void filterStructures(char timePeriod){
filteredBuildings = new Structure[marker+1]; //creating a container for filtered buildings
/*
* timePeriod a = 12am to 7am;

35
* timePeriod b = 7am to 12pm;
* timePeriod c = 12pm to 5pm;
* timePeriod d = 5pm to 9pm;
* timePeriod e = 9pm to 12am;
*/
totalStructuresWeight = 0;
int filterMarker = 0;
for (int i=0; i<marker+1 ; i++){
if (timePeriod == 'a'){ //keep hospitals
if (buildings[i] instanceof Hospital){
filteredBuildings[filterMarker++] = buildings[i];
}
else{
}
}
else if (timePeriod == 'b'){ //elimintate shoppingMall
if ( !(buildings[i] instanceof ShoppingMall) ){
filteredBuildings[filterMarker++] = buildings[i];
}
else{
}
}
else if (timePeriod == 'c'){ //keep all
filteredBuildings[filterMarker++] = buildings[i];
}
else if (timePeriod == 'd'){ //eliminate academics
if ( !(buildings[i] instanceof School) ){
filteredBuildings[filterMarker++] = buildings[i];
}
else{
}
}
else if (timePeriod == 'e'){ //keep shoppingMall and Hospital
if ( (buildings[i] instanceof ShoppingMall) || (buildings[i] instanceof Hospital) ){
filteredBuildings[filterMarker++] = buildings[i];
}
else{
}
}
else{

36
System.err.println("Time Period is not set as a or b or c or d or e");
}
return;
}
}
private void calculateTotalStructuresTime(char timePeriod){
filterStructures(timePeriod);
for (int i=0; i<filteredBuildings.length; i++){
if (filteredBuildings[i] != null){
//System.out.println("Structures FIltered \n" + filteredBuildings[i] + "\n i = " + i);
totalStructuresWeight += filteredBuildings[i].getWeight();
//System.out.println("U cant c me");
}
else{}
}
if (timePeriod == 'a')
totalStructuresWeight = totalStructuresWeight * 1;
else if (timePeriod == 'b')
totalStructuresWeight = totalStructuresWeight * 6;
else if (timePeriod == 'c')
totalStructuresWeight = totalStructuresWeight * 3;
else if (timePeriod == 'd')
totalStructuresWeight = totalStructuresWeight * 6;
else if (timePeriod == 'e')
totalStructuresWeight = totalStructuresWeight * 4;
else
System.err.println("Time Period is not set as a or b or c or d or e");
totalStructuresTime = totalStructuresWeight * 60; //in seconds
}
private void calculateTotalTime(char timePeriod){
calculateTotalStructuresTime(timePeriod);
totalRoadTime = normalTraverseTime + totalStructuresTime; //in seconds
}
public int getTotalTime(char timePeriod){
calculateTotalTime(timePeriod);
System.out.println(this);
return totalRoadTime; //in seconds

37
}
public String toString(){
return "" + roadLabel + "\n" + (totalRoadTime/60) + " minutes and " + totalRoadTime%60 + "
seconds";
}
}
public class Hospital extends Structure{
public Hospital(String s){
super (s); //defines if big mediun or small
}
}
public class Node{
Node north;
Node south;
Node east;
Node west;
}
public class Office extends Structure{
public Office(String s){
super (s); //defines if big mediun or small
}
}
public class School extends Structure{
public School(String s){
super (s); //defines if big mediun or small
}
}
public class ShoppingMall extends Structure{
public ShoppingMall(String s){
super (s); //defines if big mediun or small
}
}
public abstract class Structure{

38
public Structure(String s){
if (s.equals ("Big"))
setWeight(3);
else if (s.equals ("Medium"))
setWeight(2);
else if (s.equals ("Small"))
setWeight(1);
else
System.err.println("no classification of big medium or small");
}
private int weight;
public void setWeight(int w){
weight = w;
}
public int getWeight(){
return weight;
}
}
B. MATLAB .m Files and .fig
function importfile(fileToRead1) %IMPORTFILE(FILETOREAD1) % Imports data from the specified file % FILETOREAD1: file to read % Auto-generated by MATLAB on 15-Apr-2010 06:06:01 % Import the file newData1 = importdata(fileToRead1); % For some XLS and other spreadsheet files, returned data are packed % within an extra layer of structures. Unpack them. fields = fieldnames(newData1.data); newData1.data = newData1.data.(fields{1}); fields = fieldnames(newData1.textdata); newData1.textdata = newData1.textdata.(fields{1}); fields = fieldnames(newData1.colheaders); newData1.colheaders = newData1.colheaders.(fields{1}); % Create new variables in the base workspace from those fields. vars = fieldnames(newData1); for i = 1:length(vars) assignin('base', vars{i}, newData1.(vars{i})); end
plot(data, 'DisplayName', 'data', 'YDataSource', 'data'); figure(gcf)

39