traditional price index methods in the context of scanner data
TRANSCRIPT

Delivering insight through data for a better Canada
Traditional price index methods in the context of scanner data
UN GWG on Big Data for Official Statistics
Workshop on Scanner Data and Official Statistics
Kigali, Rwanda. 29 April – 1 May 2019

Delivering insight through data for a better Canada
Outline
• Definition and uses of a consumer price index• Review of traditional price index formula• Construction of a national consumer price index• Preprocessing of scanner data for CPI calculation• Scanner data and traditional price index formula• Multilateral price index methods: general principle
1

Delivering insight through data for a better Canada
Consumer price index: definition and uses
• What is the Consumer Price Index (CPI):
• An indicator of the changes in consumer prices that are experienced by a target population. It measures average price changes by comparing, through time, the cost of a fixed basket of goods and services.
• The goods and services in the basket must be of unchanging or equivalent quantities and qualities
• Reflects a pure price change, NOT a Cost-Of-Living Index
• Price movements of CPI product categories are weighted according to their relative importance in the total expenditures of consumers
2

Delivering insight through data for a better Canada
Consumer price index: definition and uses
• Uses of the CPI:
• Central banks: as a measure of inflation, for monetary policy
• Benefits recipients, workers and unions: to index, escalate or adjust nominal values
• Governments: budget projection, deflation of nominal values to obtain constant dollar figures
• Other uses: financial markets and traders
• Not always easy to accommodate all specific requirements of all uses
3

Delivering insight through data for a better Canada
• Index formula for elementary price indices
t=0 t=1 t=2 t=3 t=4 t=5 t=6Prices (standardized)
Candy 1 $ 6.00 $ 6.00 $ 7.00 $ 6.00 $ 6.00 $ 6.00 $ 6.60 Candy 2 $ 7.00 $ 7.00 $ 6.00 $ 7.00 $ 7.00 $ 7.20 $ 7.70 Candy 3 $ 2.00 $ 3.00 $ 4.00 $ 5.00 $ 2.00 $ 3.00 $ 2.20 Candy 4 $ 5.00 $ 5.00 $ 5.00 $ 4.00 $ 5.00 $ 5.00 $ 5.50 Arithmetic Mean prices $ 5.00 $ 5.25 $ 5.50 $ 5.50 $ 5.00 $ 5.30 $ 5.50 Geometric Mean Prices $ 4.53 $ 5.01 $ 5.38 $ 5.38 $ 4.53 $ 5.05 $ 4.98
Carli Month-to-Month index 100.0 112.5 108.9 101.8 91.2 113.2 100.0Carli Chained month-to-month index 100.0 112.5 122.5 124.8 113.9 128.9 129.0Carli Direct index on t=0 100.0 112.5 125.6 132.5 100.0 113.2 110.0Dutot Month-to-Month index 100.0 105.0 104.8 100.0 90.9 106.0 103.8Dutot Chained month-to-month index 100.0 105.0 110.0 110.0 100.0 106.0 110.0Dutot Direct index on t=0 100.0 105.0 110.0 110.0 100.0 106.0 110.0Jevons Month-to-Month index 100.0 110.7 107.5 100.0 84.1 111.4 98.7Jevons Chained month-to-month index 100.0 110.7 118.9 118.9 100.0 111.4 110.0Jevons Direct index on t=0 100.0 110.7 118.9 118.9 100.0 111.4 110.0
𝐼𝐼𝐶𝐶𝐶𝐶𝐶𝐶𝐶𝐶𝐶𝐶0:𝑡𝑡 =1𝑛𝑛�
𝐶𝐶
𝑛𝑛 𝑝𝑝𝐶𝐶𝑡𝑡
𝑝𝑝𝐶𝐶0
𝐼𝐼𝐷𝐷𝐷𝐷𝑡𝑡𝐷𝐷𝑡𝑡0:𝑡𝑡 =1𝑛𝑛∑𝐶𝐶
𝑛𝑛 𝑝𝑝𝐶𝐶𝑡𝑡
1𝑛𝑛∑𝐶𝐶
𝑛𝑛 𝑝𝑝𝐶𝐶0
𝐼𝐼𝐽𝐽𝐽𝐽𝐽𝐽𝐷𝐷𝑛𝑛𝐽𝐽0:𝑡𝑡 = �1
𝑛𝑛 𝑝𝑝𝐶𝐶𝑡𝑡
𝑝𝑝𝐶𝐶0
1𝑛𝑛
4
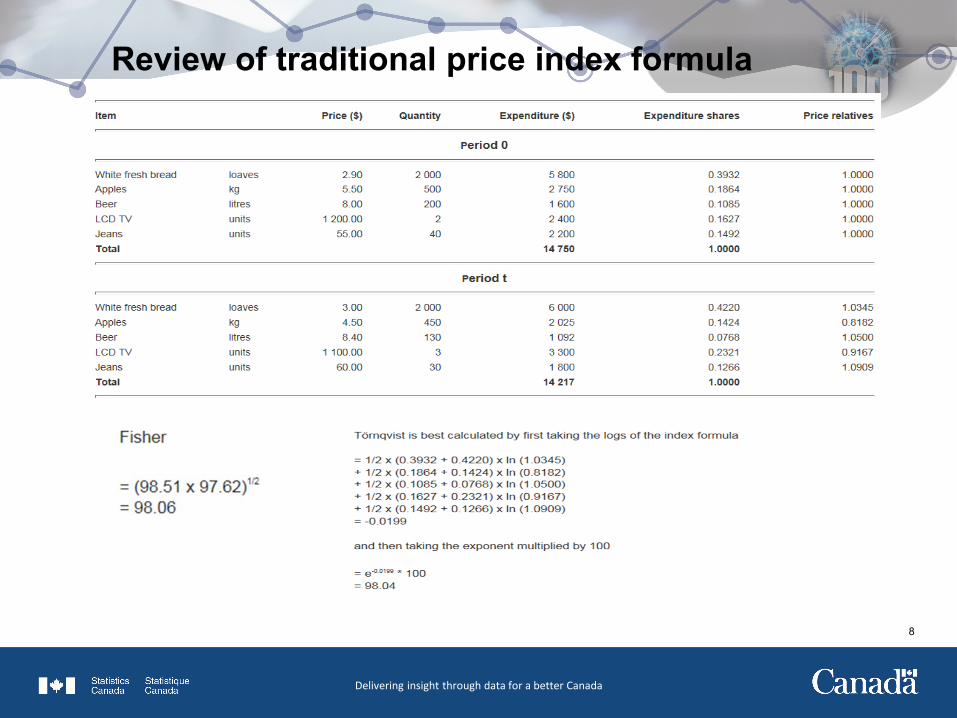
Review of traditional price index formula

Delivering insight through data for a better Canada
• Index formula for elementary price indices
5
Review of traditional price index formula
• Are chained and direct indexes equal?• Carli index: Chained ≠ Direct • Dutot and Jevons index: Chained = Direct• So avoid chained Carli index!
• When prices go back to base level (t=4 and t=0), index level should go back to 100
• Chained Carli index fails this property!• By default, G20 countries – except Japan, use, generally a
Chained Jevons index rather than a Chained Dutot• Dutot only works well for very homogeneous products, which means for
EAs that are very narrowly defined and products that have the same unit of measure

Delivering insight through data for a better Canada
Review of traditional price index formula
6
Index name Laspeyres Paasche Fischer Törnqvist Lowe
Formula
0
0: 1,
0 0
1
nti i
t iL A n
i ii
p qI
p q
=
=
=∑
∑
0: 1P,
0
1
nt ti i
t iA n
ti i
i
p qI
p q
=
=
=∑
∑0: 1
,0
1
nt bi i
t iLo A n
bi i
i
p qI
p q
=
=
=∑
∑( )
10: 0: 0: 2F, , P,
t t tA L A AI I I= ×
( )012
0:, 0
1
ti is stn
t iT A
i i
pIp
+
=
=
∏
• Index formula for aggregate price indices
0: 0, 0
1
tnt b i
Lo A ii i
pI sp=
=
∑
00
0
1
bb i i
i nb
i ii
p qsp q
=
≡
∑
0: 0, 0
1
tnt i
L A ii i
pI sp=
=
∑
0 00
0 0
1
i ii n
i ii
p qsp q
=
≡
∑
0:, 1
01
1tP A tn
t ii
i i
Ipsp
−
=
=
∑
1
t tt i ii n
t ti i
i
p qsp q
=
≡
∑

Delivering insight through data for a better Canada
Review of traditional price index formula
7
Delivering insight through data for a better Canada
Review of traditional price index formula
8
Delivering insight through data for a better Canada
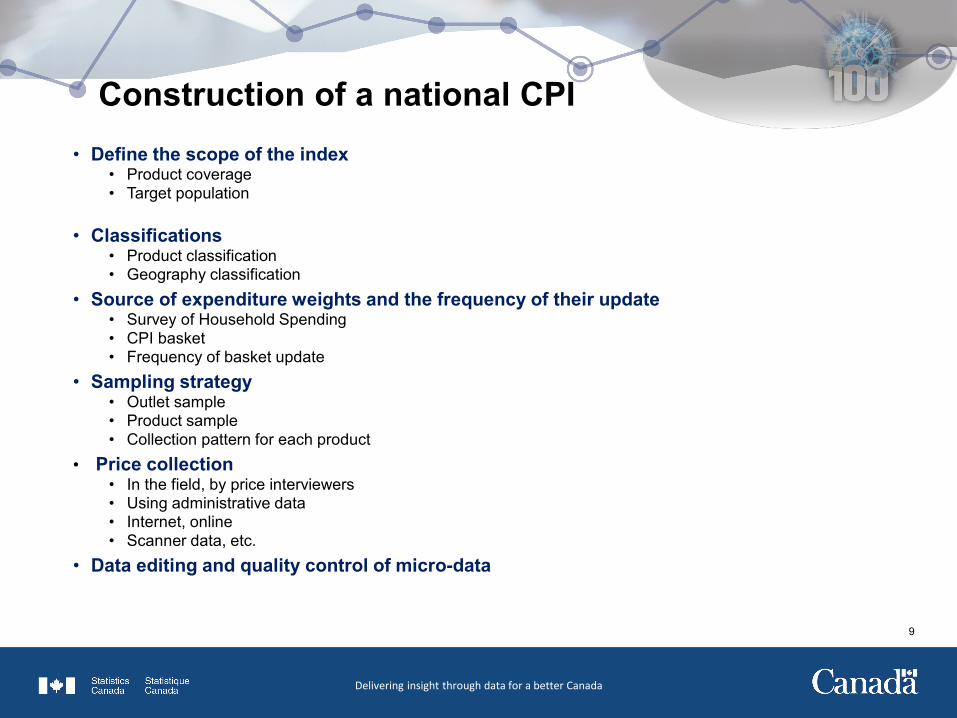
Construction of a national CPI
9
• Define the scope of the index• Product coverage• Target population
• Classifications• Product classification• Geography classification
• Source of expenditure weights and the frequency of their update• Survey of Household Spending• CPI basket• Frequency of basket update
• Sampling strategy• Outlet sample• Product sample• Collection pattern for each product
• Price collection• In the field, by price interviewers• Using administrative data • Internet, online• Scanner data, etc.
• Data editing and quality control of micro-data

Delivering insight through data for a better Canada
Construction of a national CPI
10
• CPI is built up from price indices for elementary aggregates (EA)• Elementary aggregates are pairings of lowest level product classes and lowest level
geography classes• Banana in geo strata 1, banana in geo strata 2 are two different EAs• Banana in Canada is not an EA• Some product classes may not be available in some geo classes• Canada: 695 lowest level product classes, 19 lowest level geo classes
• EAs price indices estimated by direct price observation or by imputation
• Elementary price indices :• In general, Jevons index formula is used in most countries• Prices for goods and services of same quantity and same quality observed over time
• Aggregate level indices: • Consumption expenditures, to give relative importance to product/geo classes• Expenditures must be price-updated: the expenditure value of each category is multiplied by its
monthly price change. Same quantities valued at current month’s prices• In general, Lowe index aggregation formula is used in most countries

Delivering insight through data for a better Canada
Preprocessing of scanner data for CPI calculation
11
• Typical structure of scanner data
• Potential advantages of scanner data:• Full enumeration of products sold during a given time period
• Universe of products purchased by consumers
• Quantity and turnover information • Actual average transaction price paid by consumers
Large scale increase in CPI product sample sizeLower amount of resources for price collection
• Possible drawback: Risk of over-coverage• Purchases made by businesses are included!• Is that really an issue?
Variable Format ExampleDate Numeric or date 20180104, 01/04/2018Store ID Text or numeric Store_0001Store address Text 123 ABC street, Region, postal codeProvince/Region Text or numeric OntarioProduct identifier (UPC, SKU) Numeric or text ABC_0001Retailer classification Text or numeric Grocery – Dairy – Cheese – Entertainment CheeseDescription Text ‘Tasty’ Brand Brie Cheese 200gQuantity Numeric 61 unitsTurnover Numeric or currency $501

Delivering insight through data for a better Canada
12
• How is a product defined?• A set of homogeneous items• Associated with: Global Trade Item Number (GTIN), Universal Product Code (UPC) or retailer
assigned codes, Stock Keeping Unit (SKU)?• What if GTINs change frequently with very small or no changes in product characteristics:
relaunches?
• Data aggregation
• Individual transactions during a time period need to be aggregated • Total quantities, total turnover and average prices
• Doing this aggregation at outlet (location) level or at retailer level?• Do prices differ across stores of the same retailer? • No, in general; but a market intelligence research recommended
• Doing this aggregation at regional level?• National or regional pricing? • Do purchasing patterns vary by region? Regional weights may be needed!
• For monthly CPI, how many weeks to include in the aggregation? • Depends on the CPI production cycle• Ideally, all days of the month• Practically, 2 or 3 weeks.
Preprocessing of scanner data for CPI calculation

Delivering insight through data for a better Canada
Scanner data and traditional price index formula
13
• Ideally, we would use a method that:
• Uses census of products• Weights prices at the product (and product group) level• and automated processes (less resources)
• ILO/IMF Consumer Price Index manual recommends ‘superlative’ indexes (e.g. Fisher, Törnqvist) as the ideal CPI target
• Can we apply these methods directly to scanner data?
• Could use ‘direct’ or ‘chained’ weighted bilateral indexes
• However, dynamic nature of transactions data can make these methods perform poorly

Delivering insight through data for a better Canada
Scanner data and traditional price index formula
14
• ‘Direct’ bilateral indexes suffer from a ‘matching’ problem

Delivering insight through data for a better Canada
Scanner data and traditional price index formula
15
• Consumers responsive to sales: price and quantity bouncing can cause problems for chained indexes

Delivering insight through data for a better Canada
Scanner data and traditional price index formula
16
• Chained bilateral indexes suffer from a ‘chain drift’ problem

Delivering insight through data for a better Canada
Multilateral price index methods: general principle
• Many National Statistical Institutes (NSI) continue to use a geometric mean at elementary aggregate level
• No weight used at this level• Mostly supermarket products• Belgium, Canada, Denmark, Iceland, Netherlands, Norway, Sweden, Switzerland
• A few NSI have implemented multilateral index methods for some of their CPI components:
• Statistics Netherlands (CBS): Mobile phone and department store products• Statistics New Zealand (SNZ): Audio visual and household appliance products• Australia Bureau of Statistics (ABS): Food expenditure classes
17

Delivering insight through data for a better Canada
Multilateral price index methods: general principle
• Bilateral index methods compare prices between two time periods
• Multilateral index methods: • Price comparisons across multiple (three or more) time periods• Historically used in constructing spatial price indexes (comparison of price
levels between countries)• Use all matched products between any two months• Are “average” of multiple bilateral indexes:
• Example:
• Weight products by their economic importance (turnover)• Are free of ‘chain drift’
18
( )1/ 1
0
TT
jl jk klk
I I I+
=
= ∏

Delivering insight through data for a better Canada
Questions?
Thank you!
19