trading success principles volume analysis - amazon s3 · © trading concepts, inc. 4 volume...
TRANSCRIPT

© Trading Concepts, Inc.
3
Trading Success Principles
Volume Analysis

© Trading Concepts, Inc. 2
Trading Success Principles
Volume Analysis
By Todd Mitchell
© Copyright 2014 by Trading Concepts, Inc.
All Rights Reserved
This training program, or parts thereof, may not be reproduced in any
form without the prior written permission of Trading Concepts, Inc.
No claim is made by Trading Concepts, Inc. that the E-Mini futures trading strategies shown here will result in profits and will not result in losses. E-Mini futures trading
may not be suitable for all recipients of this Training Program. All comments, trading
strategies, techniques, concepts and methods shown within our Course are not and should not be construed as an offer to buy or sell futures contracts – they are opinions
based on market observation and years of experience. Therefore, the thoughts
expressed are not guaranteed to produce profits in any way. All opinions are subject to change without notice. Each E-Mini futures trader/investor is responsible for
his/her own actions, if any. Your purchase of the Trading Concepts Comprehensive
EMINI SUCCESS FORMULA™2.0 Mentoring Program constitutes your agreement to this
disclaimer and exempts Trading Concepts from any liability or litigation.
Important Notice - Risk Disclaimer: E-Mini futures trading has large potential rewards, but also large potential risk. You must
be aware of the risks and be willing to accept them in order to invest in the futures market. Don't trade with money you can' t
afford to lose. This is neither a solicitation nor an offer to buy or sell futures contracts. No representation is being made that
any account will or is likely to achieve profits or losses similar to those discussed in our training program. The past
performance of any futures trading strategy or methodology is not necessarily indicative of future results. Hypothetical or
simulated performance results have certain inherent limitations. Unlike an actual performance record, simulated results do not
represent actual E-Mini futures trading. Also, since the E-Mini futures trades have not actually been executed, the results may
have under- or over-compensated for the impact, if any, of certain market factors, such as lack of liquidity. Simulated futures
trading programs in general are also subject to the fact that they are designed with the benefit of hindsight. No representation
is being made that any account will or is likely to achieve profits or losses similar to those that may be shown.

© Trading Concepts, Inc. 3
Table of Contents
Volume Analysis ............................................................................ 4
SIDEWAYS (Trading Range): BREAKOUT .............................................. 6
SIDEWAYS (Trading Range): BREAKDOWN ........................................... 8
3 General Volume Rules ................................................................. 11
Strong UPMOVE Volume Examples .................................................... 12
Strong DOWNMOVE Volume Examples ................................................ 14
© Trading Concepts, Inc. 4
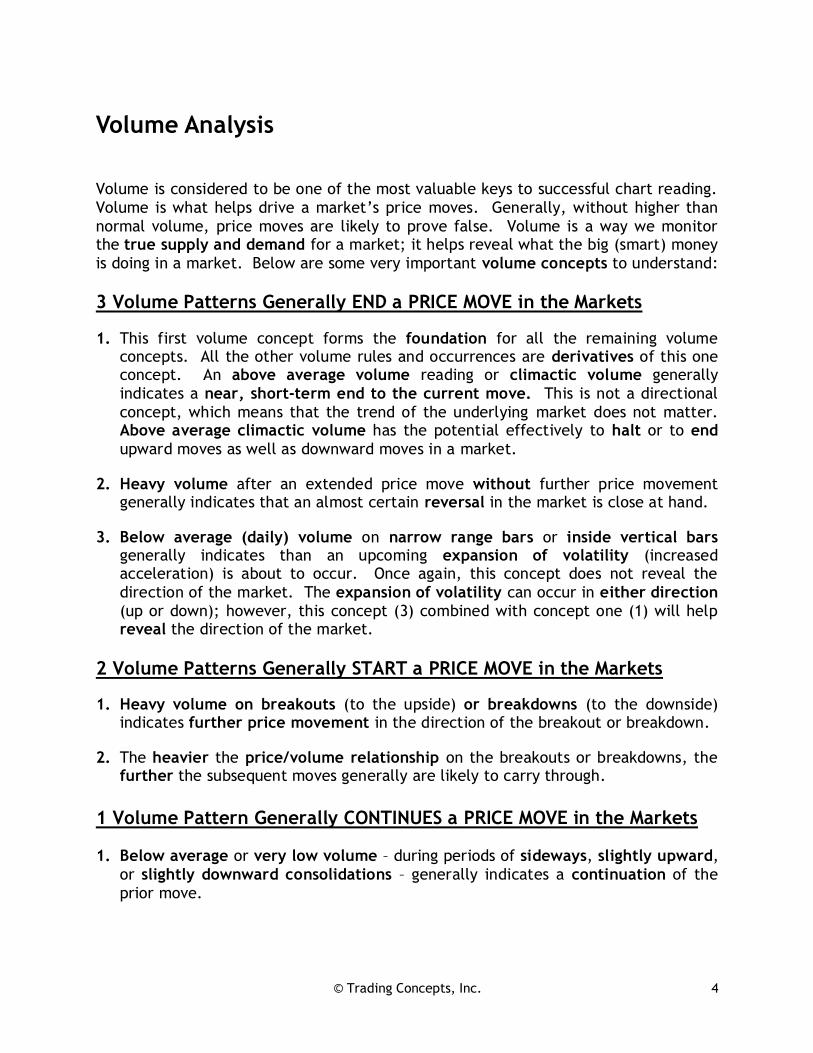
Volume Analysis
Volume is considered to be one of the most valuable keys to successful chart reading.
Volume is what helps drive a market’s price moves. Generally, without higher than
normal volume, price moves are likely to prove false. Volume is a way we monitor the true supply and demand for a market; it helps reveal what the big (smart) money
is doing in a market. Below are some very important volume concepts to understand:
3 Volume Patterns Generally END a PRICE MOVE in the Markets
1. This first volume concept forms the foundation for all the remaining volume concepts. All the other volume rules and occurrences are derivatives of this one concept. An above average volume reading or climactic volume generally
indicates a near, short-term end to the current move. This is not a directional
concept, which means that the trend of the underlying market does not matter. Above average climactic volume has the potential effectively to halt or to end
upward moves as well as downward moves in a market.
2. Heavy volume after an extended price move without further price movement generally indicates that an almost certain reversal in the market is close at hand.
3. Below average (daily) volume on narrow range bars or inside vertical bars generally indicates than an upcoming expansion of volatility (increased acceleration) is about to occur. Once again, this concept does not reveal the
direction of the market. The expansion of volatility can occur in either direction
(up or down); however, this concept (3) combined with concept one (1) will help reveal the direction of the market.
2 Volume Patterns Generally START a PRICE MOVE in the Markets
1. Heavy volume on breakouts (to the upside) or breakdowns (to the downside) indicates further price movement in the direction of the breakout or breakdown.
2. The heavier the price/volume relationship on the breakouts or breakdowns, the further the subsequent moves generally are likely to carry through.
1 Volume Pattern Generally CONTINUES a PRICE MOVE in the Markets 1. Below average or very low volume – during periods of sideways, slightly upward,
or slightly downward consolidations – generally indicates a continuation of the
prior move.

© Trading Concepts, Inc. 5
3 Volume Patterns Generally END a PRICE MOVE in the Markets (1st and 2nd of 3)
3 Volume Patterns Generally END a PRICE MOVE in the Markets (3rd of 3)

© Trading Concepts, Inc. 6
SIDEWAYS (Trading Range): BREAKOUT
The two illustrations and chart examples below show the market breaking out of a
trading range (SIDEWAYS TREND) on heavy volume, which generally indicates
further price movement in the direction of the breakout. In other words, this indicates that the market should start trending in the direction of the breakout.
EXAMPLE 1: A breakout to the upside from a trading range on heavy volume
generally indicates follow through to the upside; thus the market should start an
UPTREND. This should not prove to be a false breakout since there was heavy
volume on the breakout. Look for a Trading Strategy to BUY.

© Trading Concepts, Inc. 7
2 Volume Patterns Generally START a PRICE MOVE in the Markets

© Trading Concepts, Inc. 8
SIDEWAYS (Trading Range): BREAKDOWN
EXAMPLE 2: A breakdown to the downside from a trading range on heavy volume
generally indicates follow through to the downside; thus the market should start a DOWNTREND. This should not prove to be a false breakdown since there was heavy
volume on the breakdown. Look for a Trading Strategy to SELL.

© Trading Concepts, Inc. 9
2 Volume Patterns Generally START a PRICE MOVE in the Markets

© Trading Concepts, Inc. 10
1 Volume Pattern Generally CONTINUES a PRICE MOVE in the Markets

© Trading Concepts, Inc. 11
3 General Volume Rules
1. If – after a market decline or within a sideways base – a market develops heavy
volume while resisting further decline, a good potential BUYING opportunity is
likely setting up. Look for a potential Trading Strategy here.
2. If a market breaks upward out of a trading range on heavy volume, a trader generally can BUY either on the breakout or on the first pullback after the breakout. The stronger/heavier the initial price-volume surge, the further
subsequent moves generally are likely to carry. Look for a potential Trading
Strategy here.
3. If a market breaks downward out of a trading range on heavy volume, a trader generally can SELL either on the breakdown or on the first pullback after the
breakdown. The stronger/heavier the initial price-volume surge, the further
subsequent moves generally are likely to carry. Look for a potential Trading
Strategy here.

© Trading Concepts, Inc. 12
Strong UPMOVE Volume Examples (not necessarily an UPTREND)
Example A shows heavy volume after a strong move to the upside, which should tell you (the trader) that at least a temporary end to the current up move potentially is
close at hand.
Example B shows light volume after a strong up move occurring on a Narrow Range
Bar (NRB).
Example C shows light volume after a strong up move occurring on an Inside Vertical Bar (IVB).
Example D shows heavy volume after a Bearish Outside Vertical Bar (BEOVB).
Example E shows heavy volume after a strong up move occurring on a Bearish Blow-
Off-Bar (BEBOB).
All five price pattern/volume scenarios indicate an almost certain price reversal to
the downside, a retracement back down to logical SUPPORT, or a potential
complete reversal if the market is testing a critical HIGH. Examples A, B, C, D, and E can be very BEARISH and can lead to a very sharp drop in price if/when the market
penetrates down through the lows of the price bars.

© Trading Concepts, Inc. 13
IMPORTANT NOTE: Examples A, B, C, D, and E (described above and illustrated on
the previous page) become incredibly important (potent) reversals if they occur at or near potential RESISTANCE areas, such as:
(1) Mid to Upper Keltner Channel Bands in a defined DOWNTREND,
(2) a Fibonacci Retracement Level in a defined DOWNTREND, (3) back to the 79 SMA and/or 89 EMA in a defined DOWNTREND, and
(4) if the market is testing a major HIGH.

© Trading Concepts, Inc. 14
Strong DOWNMOVE Volume Examples (Not necessarily a DOWNTREND)
Example A shows heavy volume after a strong move to the downside, which should tell you (the trader) that at least a temporary end to the current down move
potentially is close at hand.
Example B shows light volume after a strong down move occurring on a Narrow
Range Bar (WRVB, as discussed in the Price Action Analysis module).
Example C shows light volume after a strong down move occurring on an Inside Vertical Bar (IVB).
Example D shows heavy volume after a Bullish Outside Vertical Bar (BUOVB).
Example E shows heavy volume after a strong down move occurring on a Bullish
Blow-Off-Bar (BUBOB).
All five price pattern/volume scenarios indicate an almost certain price reversal to
the upside, a retracement back up to logical RESISTANCE, or a potential complete
reversal if the market is testing a critical LOW. Examples A, B, C, D, and E can be very BULLISH and can lead to a very sharp increase in price if/when the market
penetrates up through the highs of the price bars.
© Trading Concepts, Inc. 15
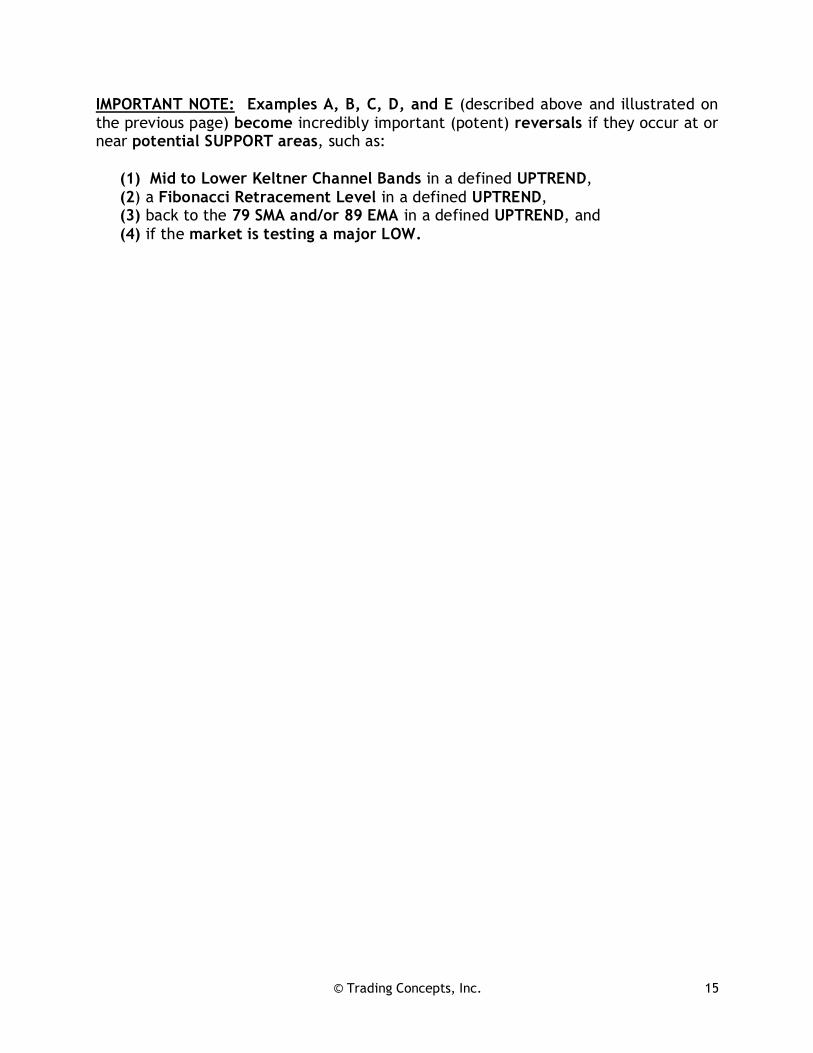
IMPORTANT NOTE: Examples A, B, C, D, and E (described above and illustrated on
the previous page) become incredibly important (potent) reversals if they occur at or near potential SUPPORT areas, such as:
(1) Mid to Lower Keltner Channel Bands in a defined UPTREND,
(2) a Fibonacci Retracement Level in a defined UPTREND, (3) back to the 79 SMA and/or 89 EMA in a defined UPTREND, and
(4) if the market is testing a major LOW.