trading strategy trade-offs presentation 09-29-16 - …files.meetup.com/18318413/trading strategy...
TRANSCRIPT
Trading StrateTrading Strategy – A rulesystematic approach intesystematic approach inte
gains from financial mderived from an infinite
f dprice patterns, fundamother analytic tools ap
random price data streamrandom price data streamof markets, time fra‐ Steve Penacho sSteve Penacho sCopyright 2016 – A
egy Trade-offse based, methodology or ended to extract financial ended to extract financialarkets utilizing and/or e selection of indicators,
l l d/mental analysis and/or plied to the essentially ms of an infinite selectionms of an infinite selection ames and bar types.spenacho@cox [email protected] Rights Reserved
Trading StrateTrading Strate•Discuss the Benefits andFollowing and Mean Rev
•Plus•Learn How to Quickly anAny Symbol or Market hAny Symbol or Market hMean Reverting TendencProfit Potential
•Using the “World’s Grea
egy Trade-Offsegy Trade Offsd Drawbacks of Trend verting Strategies
nd Easily Determine if as Trend Following oras Trend Following or cies and Discover its
test Testing Strategy”
A PDF fil f th Slid dThings Sho
A PDF file of these Slides and “World’s Greatest Testing Straposted in the MeetUp.com – SFiles SectionFiles Section
Any Statistical Trades shown tAny Statistical Trades shown tpurposes only and were not re
N t T d R d tiNot Trade Recommendations indicative of Future Results ‐
A lot to get through today….Pand Comments until the end o
T d t ti ld Fil f thown Todaya Tradestation .eld File of the ategy” have already been San Diego Traders Group ‐
oday are for educationaloday are for educational eal trades
P t P f i NOT– Past Performance is NOT Trade at Your Own Risk
lease Hold your Questions of the PowerPoint section
Trading StrateSome Observations fro‐ Some Observations frostrategy testing of HowStrategies Interact witgDiscussion of some of Drawbacks.
‐ *** I Tend to Use UncoAnalyze Symbols and MSh f U‐ Share some of my Uncways to easily determitype to match a partictype to match a particprice movement chara
egy Trade-offsom my many years ofom my many years of w Different Types of h Price Movement and a their Benefits and
onventional Ways to Markets ***
ti l P ti lconventional Practical ine the proper strategy cular symbol’s naturalcular symbol s natural acteristics
What is a T•A situation in which you mybalance two things that areat the same time
• Something that you do notorder to have something th
•A giving up of one thing in
•A compromise
•What must be given up, aneconomic decision is made
Trade-Off?ust choose between or e opposite or cannot be had
t want, but must accept in hat you do want
return for another
d what is gained, when an e.
Two Types of GCh t i ti dCharacteristics and
•Trend/Momen
•Mean R
• (Market = Symbol =• (Market = Symbol =
General Market T f St t i Types of Strategies
ntum Following
Revertingg
Financial Instrument)Financial Instrument)
Extraordinaryy
•All Symbols have Pre•All Symbols have PreTendencies towards Trend Following Charor Mean Reversion Cor Mean Reversion Cgiven time
y Assumptiony p
edominateedominate either racteristics haracteristics at anyharacteristics at any
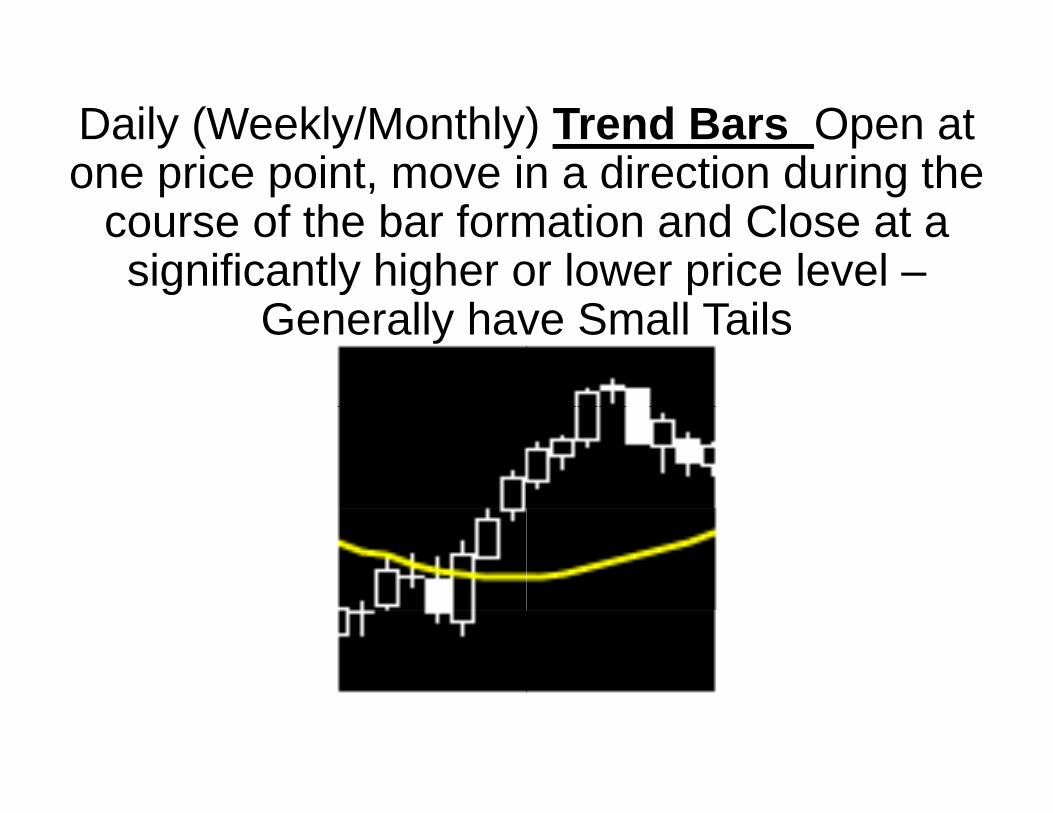
Daily (Weekly/Monthlyone price point, move i
course of the bar formsignificantly higher o
G ll hGenerally hav
) Trend Bars Open at n a direction during the
mation and Close at a or lower price level –
S ll T ilve Small Tails
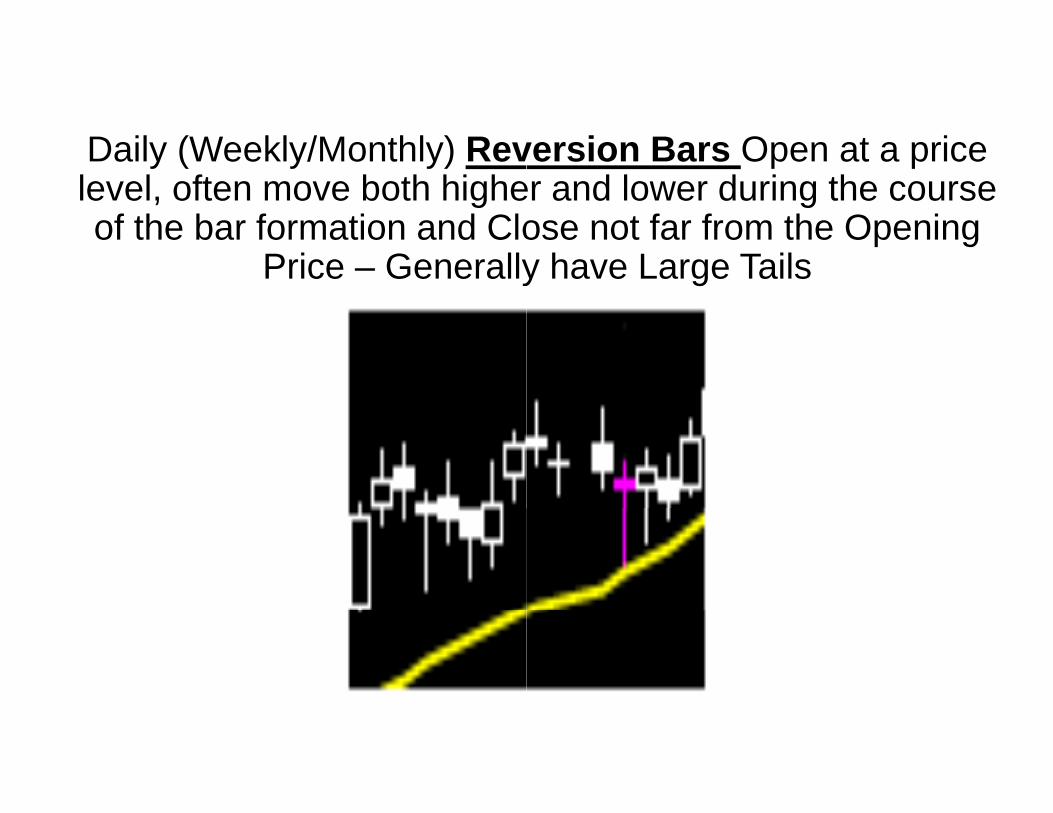
Daily (Weekly/Monthly) Revlevel, often move both highe, gof the bar formation and Clo
Price – Generally
version Bars Open at a price er and lower during the course gose not far from the Opening y have Large Tails

Two Different MarkeTwo Types oTwo Types o
Trend/Momentum FollowingTrend/Momentum Following• Trading from a quiet area or from the middle and looking for expansion away from the middleSt t hi th bb b d• Stretching the rubber band
et Conditions Need of Strategiesof Strategies
Mean ReversionMean Reversion• Trading from an expansion area back to the middle or opposite expansion
• Rubber Band snapping back
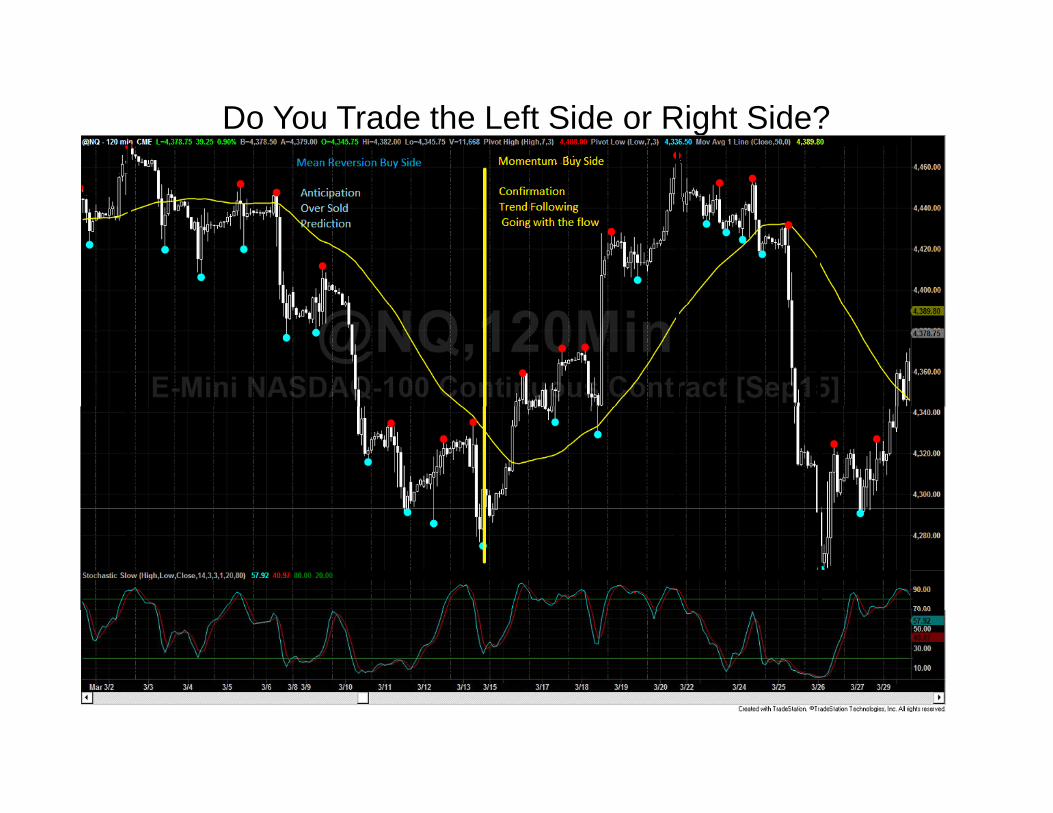
Do You Trade the Lefft Side or Right Side?
Trend/MomenStrate
To Go With(Trading from the Ri( g
the Bottom
tum Followingegies
h the Flowight Hand Side After gor the Top)
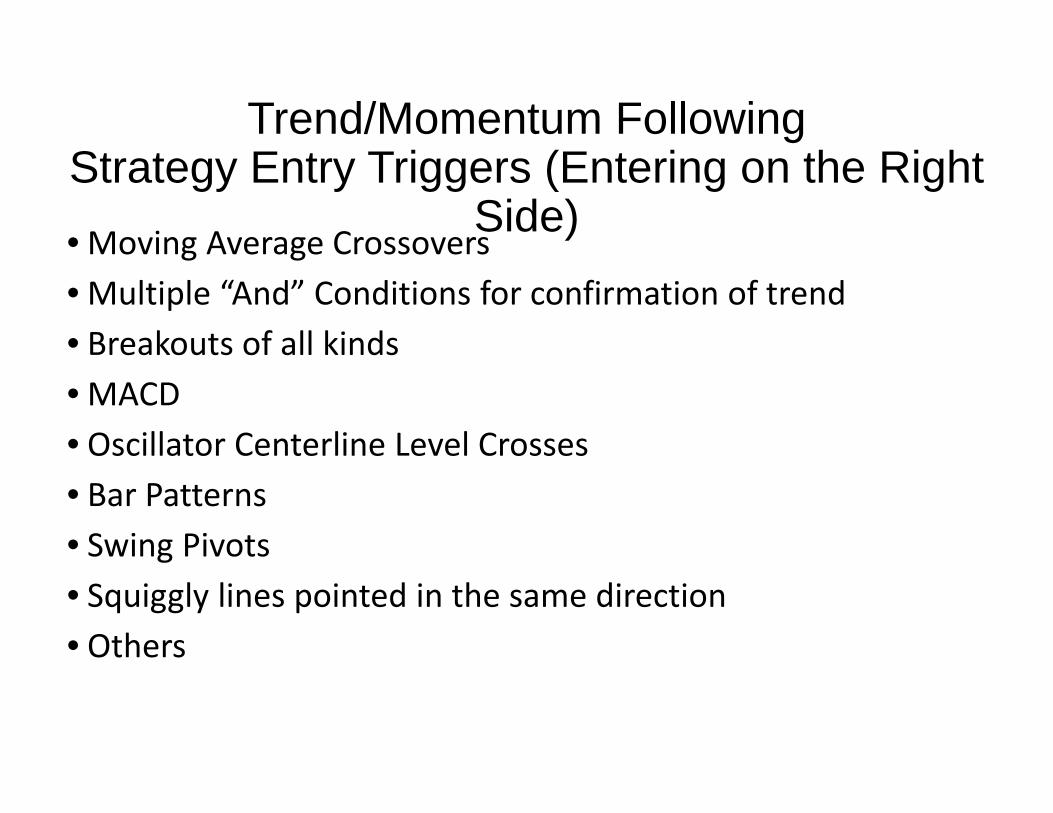
Trend/MomenStrategy Entry Triggers
SidSid• Moving Average Crossovers• Multiple “And” Conditions for p• Breakouts of all kinds• MACD• Oscillator Centerline Level Cro• Bar Patterns• Swing Pivots• Squiggly lines pointed in the saq gg y p• Others
tum Following s (Entering on the Right d )de)confirmation of trend
osses
ame direction
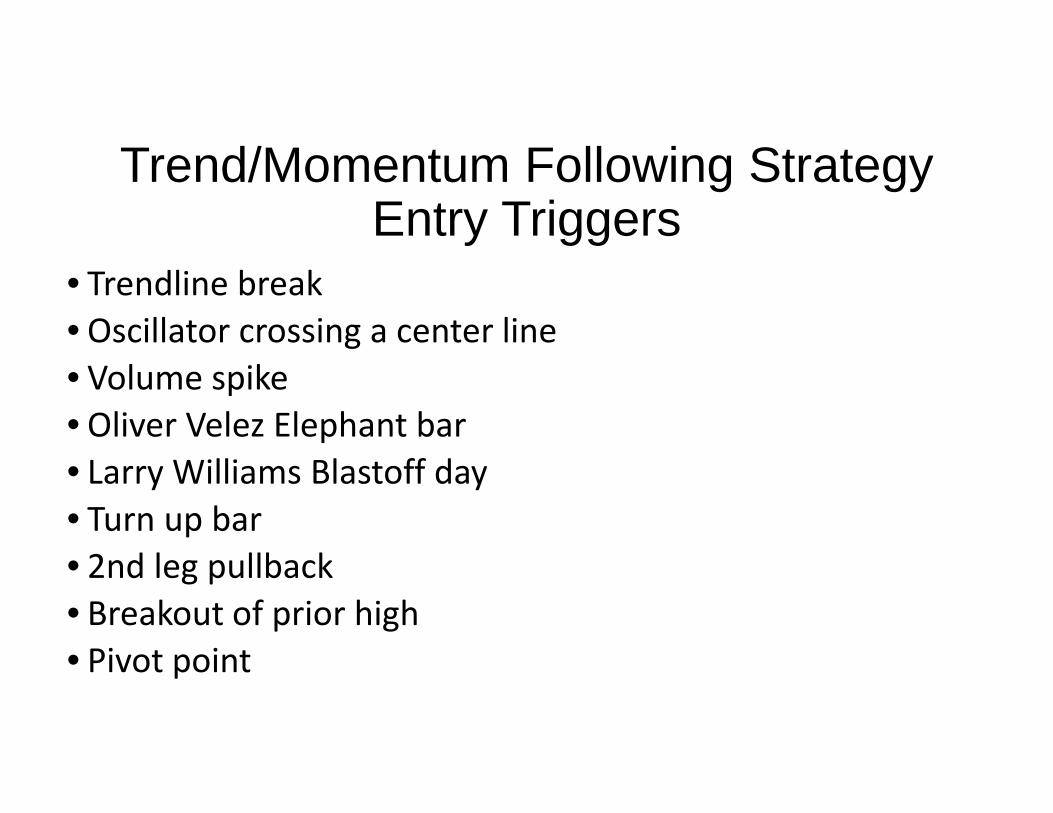
Trend/Momentum E t TEntry T
• Trendline break•Oscillator crossing a center lin• Volume spike•Oliver Velez Elephant bar• Larry Williams Blastoff dayT b• Turn up bar
• 2nd leg pullback• Breakout of prior high• Breakout of prior high• Pivot point
Following Strategy T iTriggers
ne
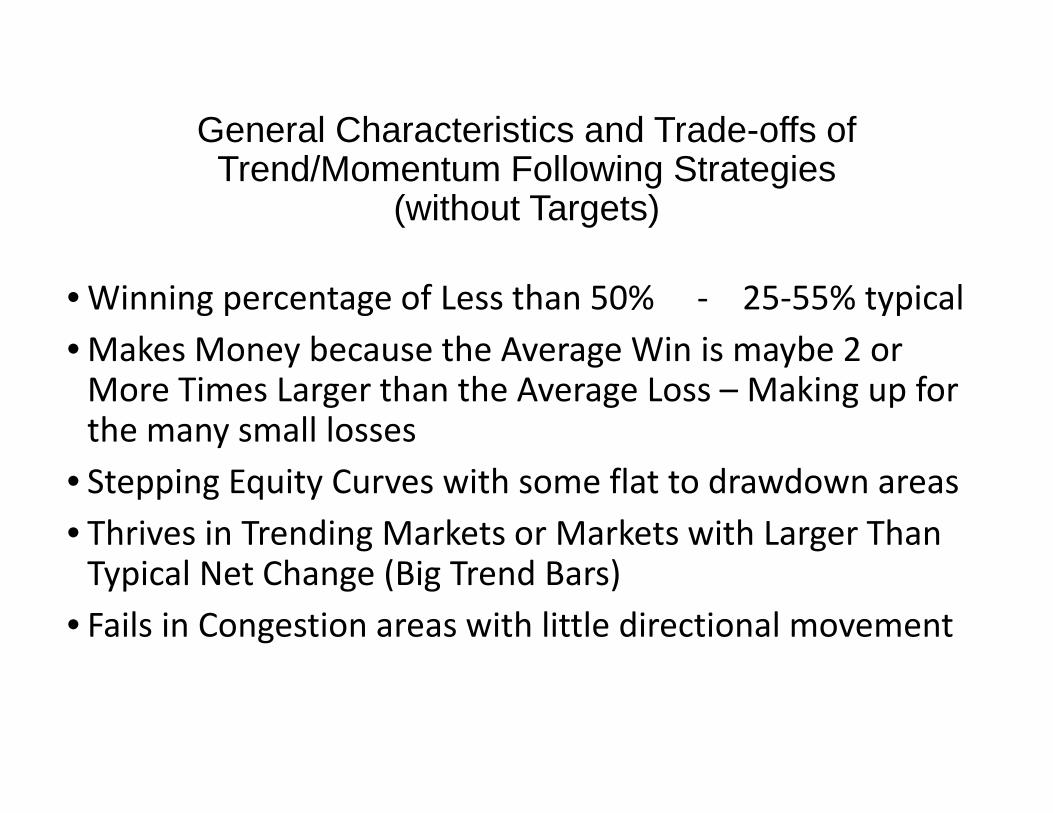
General CharacteristTrend/Momentum F
(without(without
•Winning percentage of Less tWinning percentage of Less t•Makes Money because the AvMore Times Larger than the Agthe many small losses
• Stepping Equity Curves with s• Thrives in Trending Markets oTypical Net Change (Big Trend
• Fails in Congestion areas with
tics and Trade-offs of Following Strategies Targets)Targets)
han 50% ‐ 25‐55% typicalhan 50% 25 55% typicalverage Win is maybe 2 or Average Loss – Making up for g g p
some flat to drawdown areasor Markets with Larger Than d Bars)h little directional movement
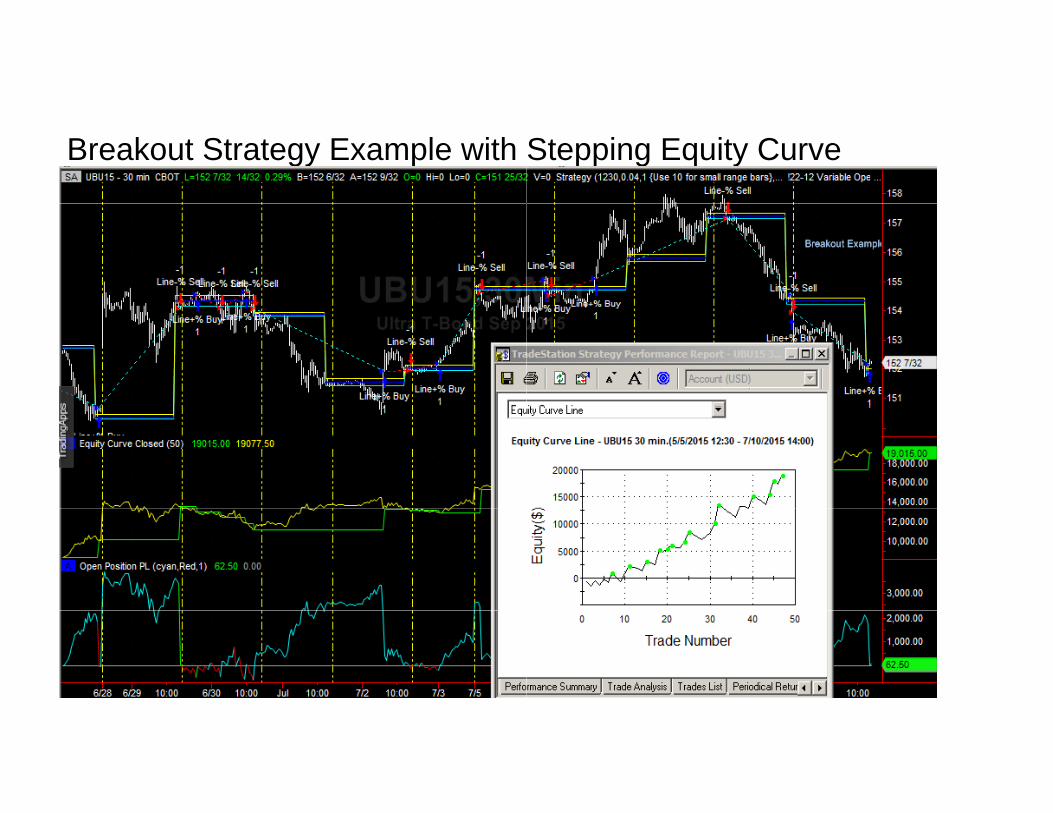
Breakout Strategy Example with Stepping Equity Curve
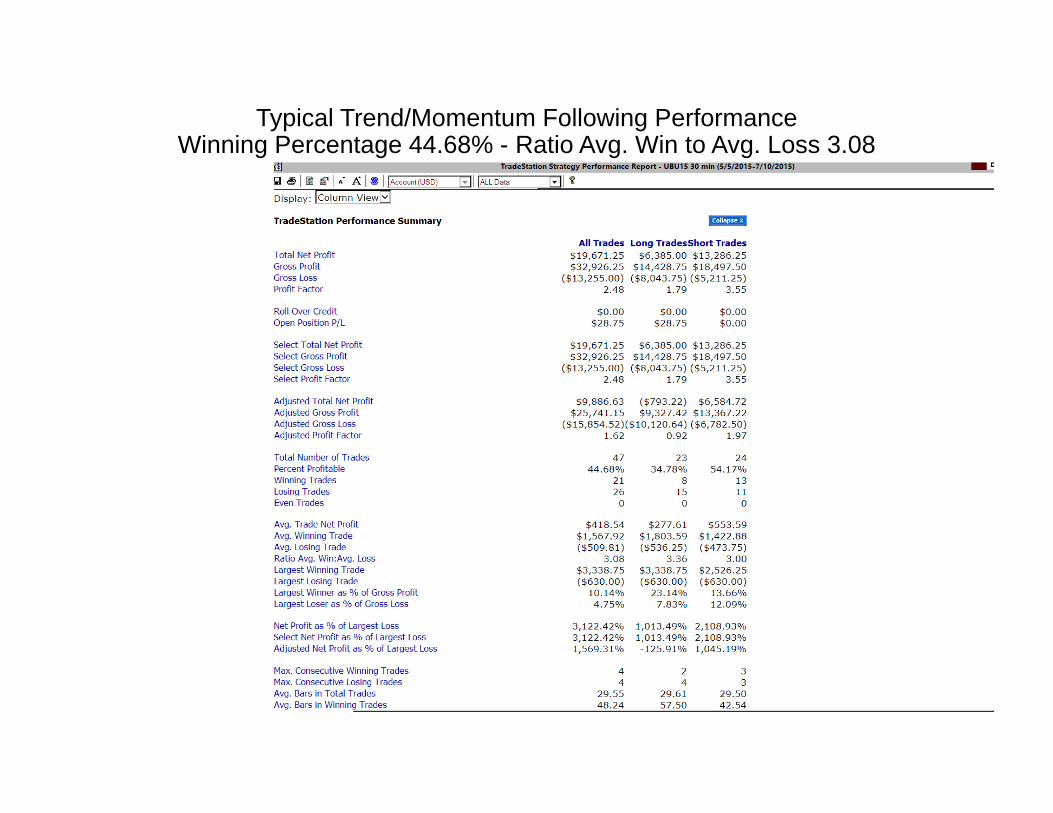
Typical Trend/MomentumWinning Percentage 44.68% - R
m Following PerformanceRatio Avg. Win to Avg. Loss 3.08
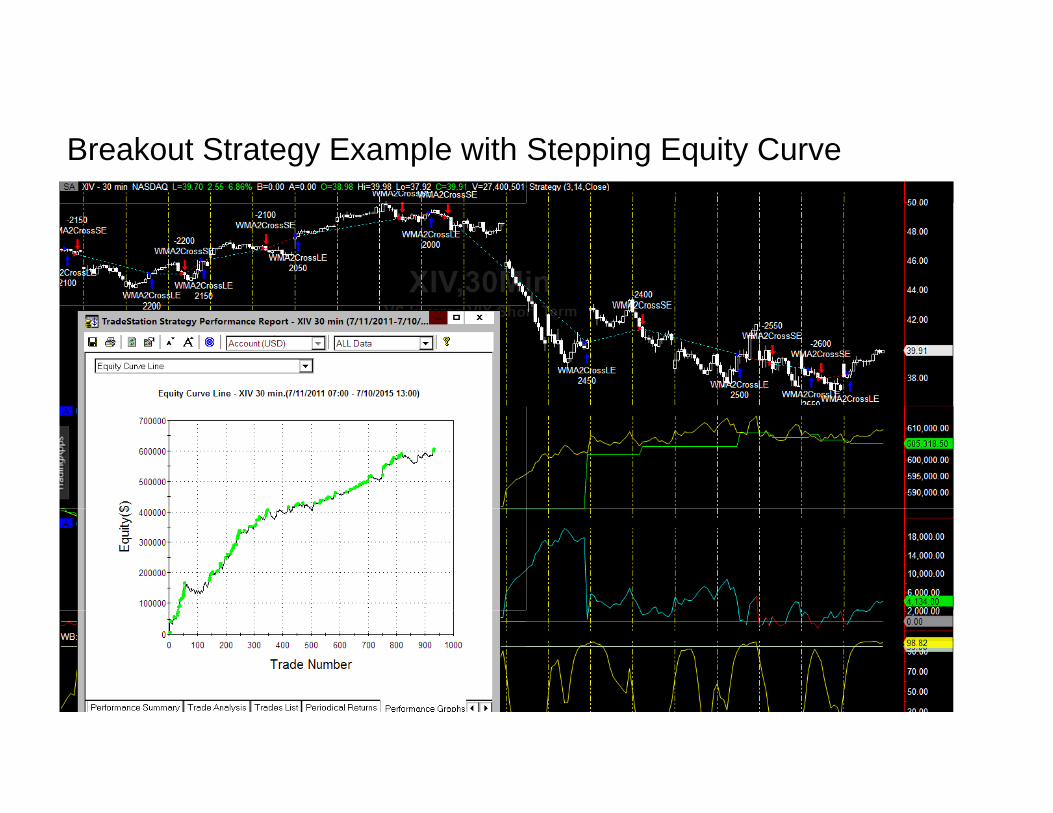
Breakout Strategy Example with Stepping Equity Curve
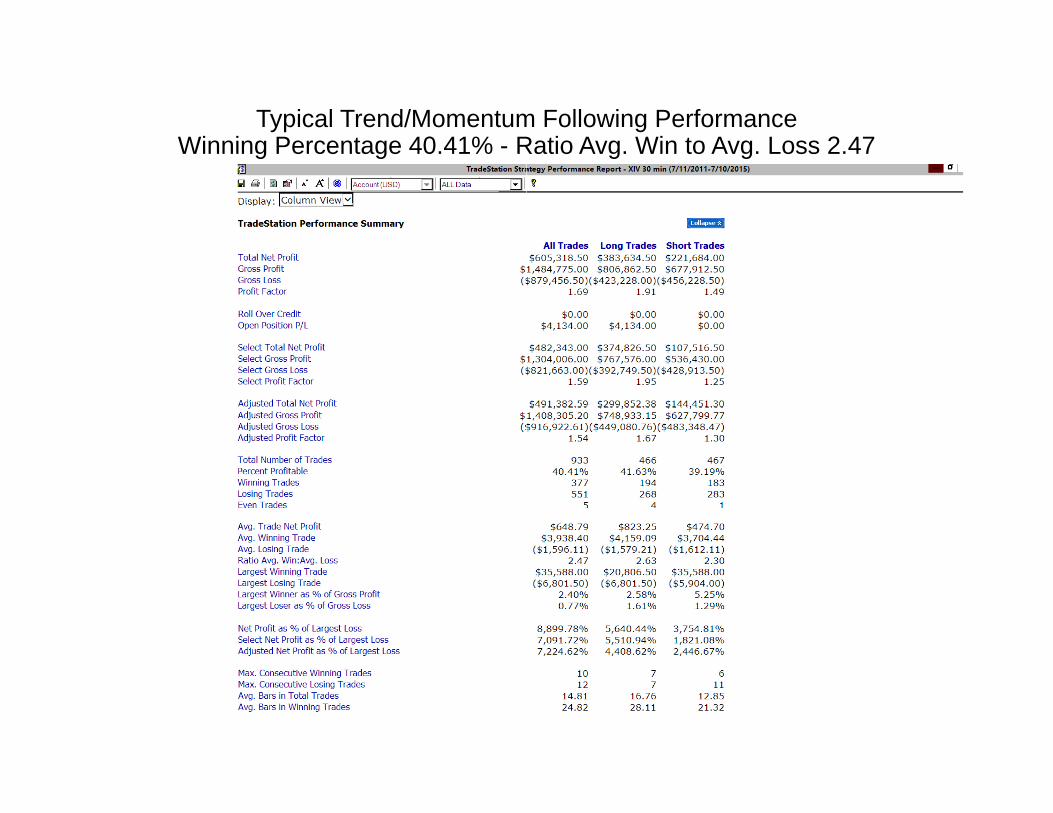
Typical Trend/MomentumWinning Percentage 40.41% - R
m Following PerformanceRatio Avg. Win to Avg. Loss 2.47
Trend Following Goo
•Always Eventually on the RL t f Littl L Bi W• Lots of Little Losses vs Big W
•Often Gives up Gains befor•Never Exits Early• Sometimes Enters “Late” (R• Typical winning trade usualong
od or Bad Trade-offs
ight side of the BIG movesWiWinnersre reversal exit
Right Side of the Bottom)lly not in drawdown for
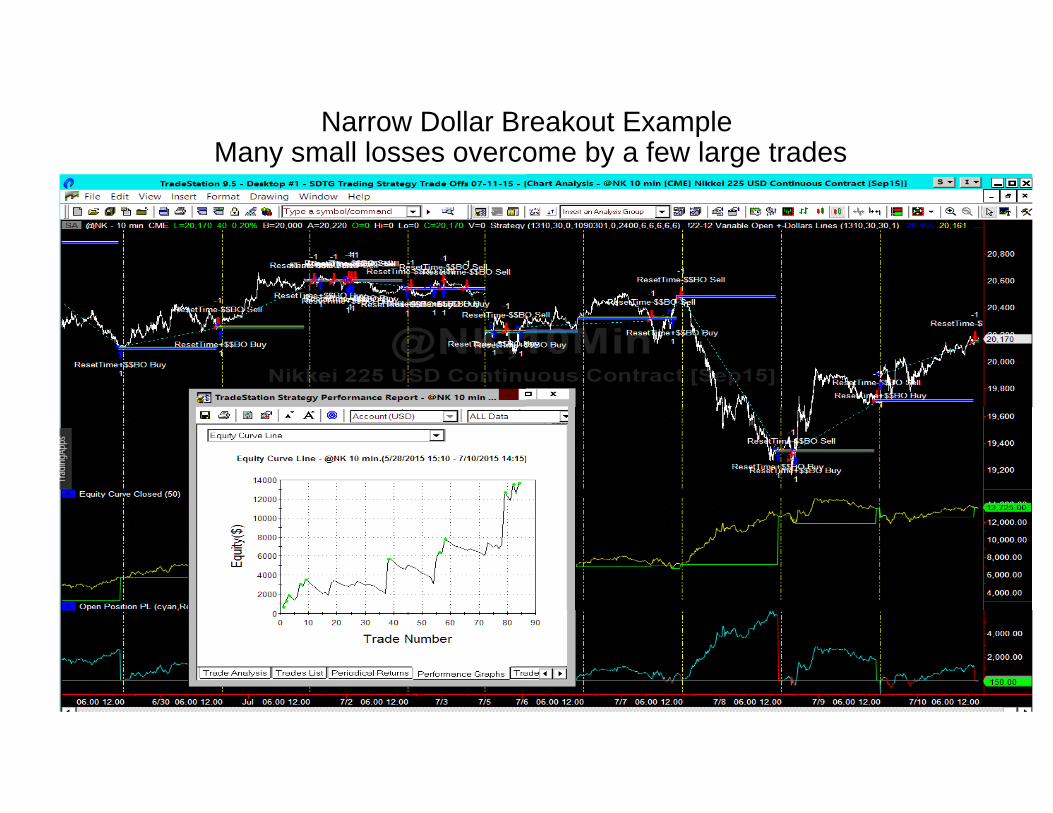
Narrow Dollar BrMany small losses overco
reakout Example ome by a few large trades

Narrow Dollar BrWinning Percentage 28.57% - R
reakout Example Ratio Avg. Win to Avg. Loss 5.25
Mean ReversiMean Reversi
To Anticipate the T(Trading from the Left Sid(Trading from the Left Sid
ion Strategiesion Strategies
Top or the Bottomde of the Top or Bottom)de of the Top or Bottom)
Mean Reversion - Str(Entering on t
•Oscillator – Overbought/Ov•Reversal Bar Patterns•%R extremes•Bollinger Band Break In – EBollinger Band Break In EDeviations
• Expanded Average True RaExpanded Average True Ra•Keltner Channel Break In•Horizontal Lines Break In –•Horizontal Lines Break In –•Others
rategy Entry Triggers the Left Side)versold – Peaks or Dips
Expanded StandardExpanded Standard
ngenge
like Pivot Pointslike Pivot Points
More Mean Revers• Bollinger bands• kStochastic – (Free at ken.xsprofits.co• kholygrail – (Free at ken.xsprofits.com• New low with higher closeNew low with higher close• New High closes lower• Supply and Demand Areas• Oscillators – Overbought or oversold • Andrews pitchfork• Trendline breakse d e b ea s• Reversal bar pattern• Down Naked ClosePi t P i t• Pivot Points
• Speed Bars
sion Entry Triggersom)m)
– peak or dips
General CharacteristMean Reversion Strat
• High Winning Percentage ‐ Typica
• Average Win Amount in $$ is usuaLoss in $$
• Needs the High Winning Percentag
• Thrives in Congestion Areas SmallThrives in Congestion Areas, Small
• Fails Spectacularly in a Fast Moving
• “Pretty” closed trade equity curvesrevealed….
tics and Trade-offs of tegies without Targetsg gally over 50% ‐ up to 90%
lly Almost Equal to the Average
ge rate to make money
Swing Areas or Noisy marketsSwing Areas or Noisy markets
g Trending Market (on Wrong side)
s – Until the drawdown details are
More Mean Reversion G•Potentially Large Drawdow•Potentially Large Drawdow• Can be caught on the Wrong SMove
•Absolutely Needs a “DisastMoves
•Many Small Wins vs a few p• Entries are usually “Early” tSide of the Top or Bottom)Side of the Top or Bottom)
• “One Man’s Pullback is Anoth•Many Profitable trades are•Many Profitable trades are Ride Trades
Good or Bad Trade-offswnswnsSide of a Fast or Big Trending
er Stop” for those Trending
possibly BIG lossesto the top or bottom (Left
her Man’s Trend Change” – S.P.in a Drawdown first Wildin a Drawdown first – Wild
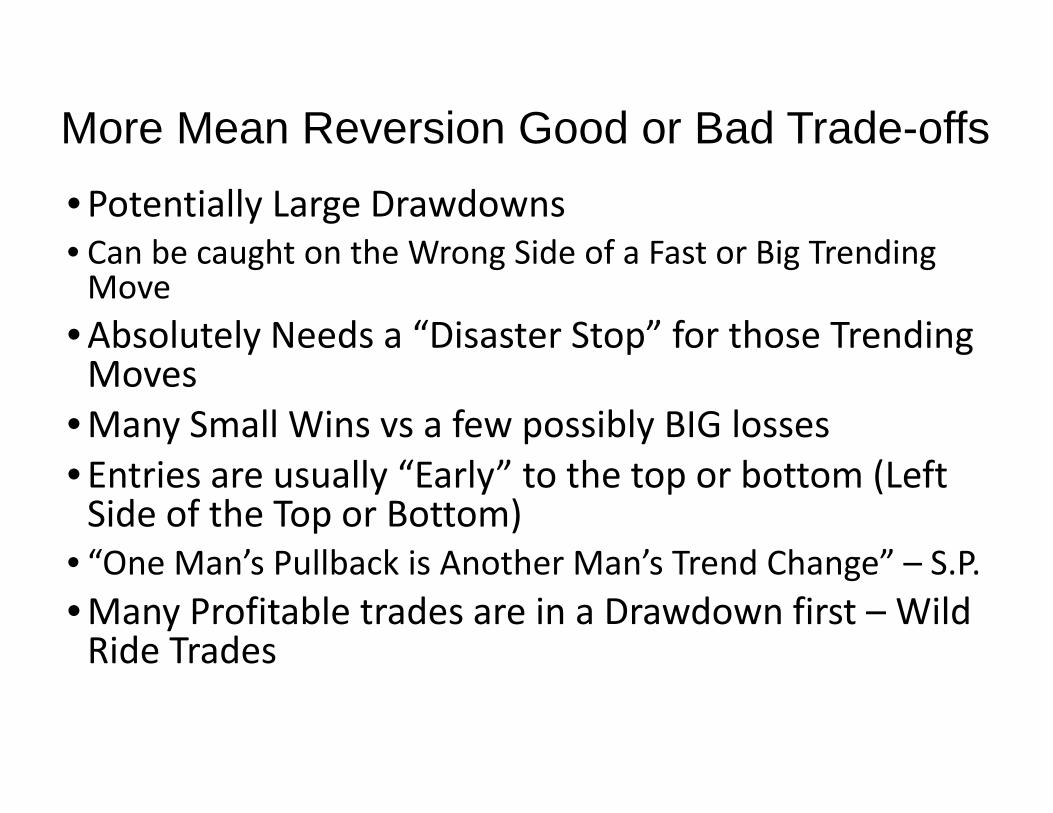
Mean Reversion Example – Bollinger Band BrEquity Curve
reak In Strategy and typical Closed Trade
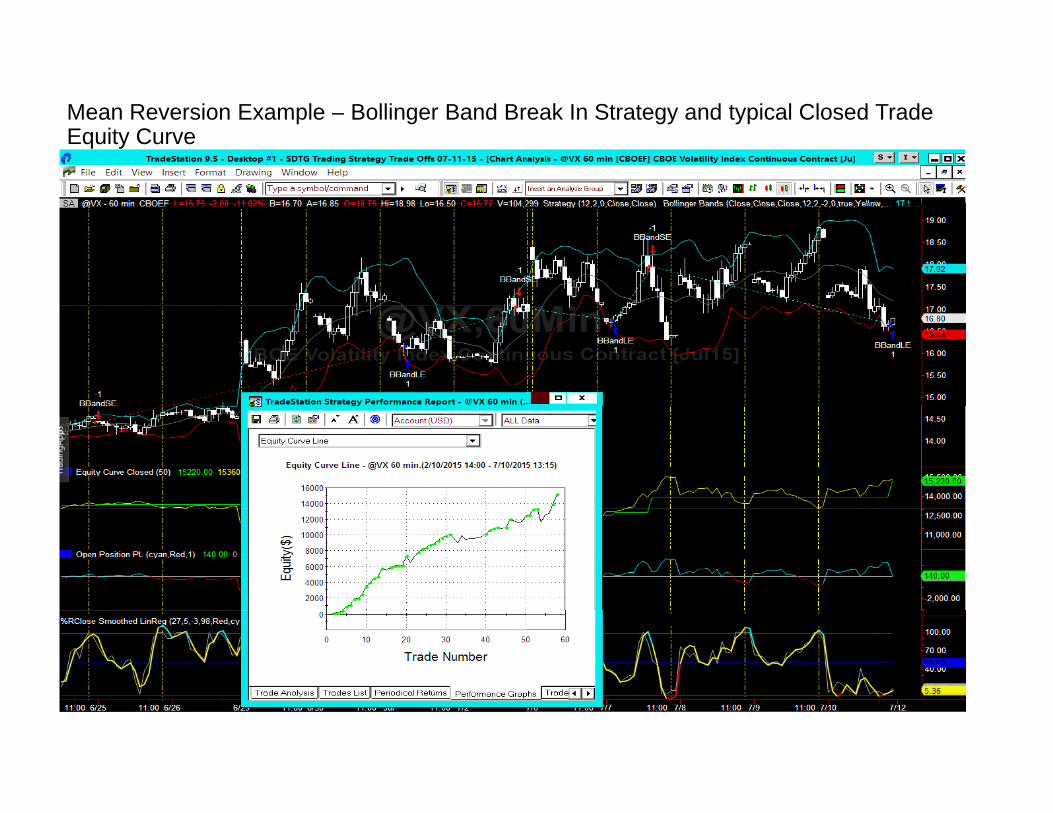
Mean Reversion Example – BoTypical DETAILED Equity C
ollinger Band Break In Strategy Curve Showing Drawdowns
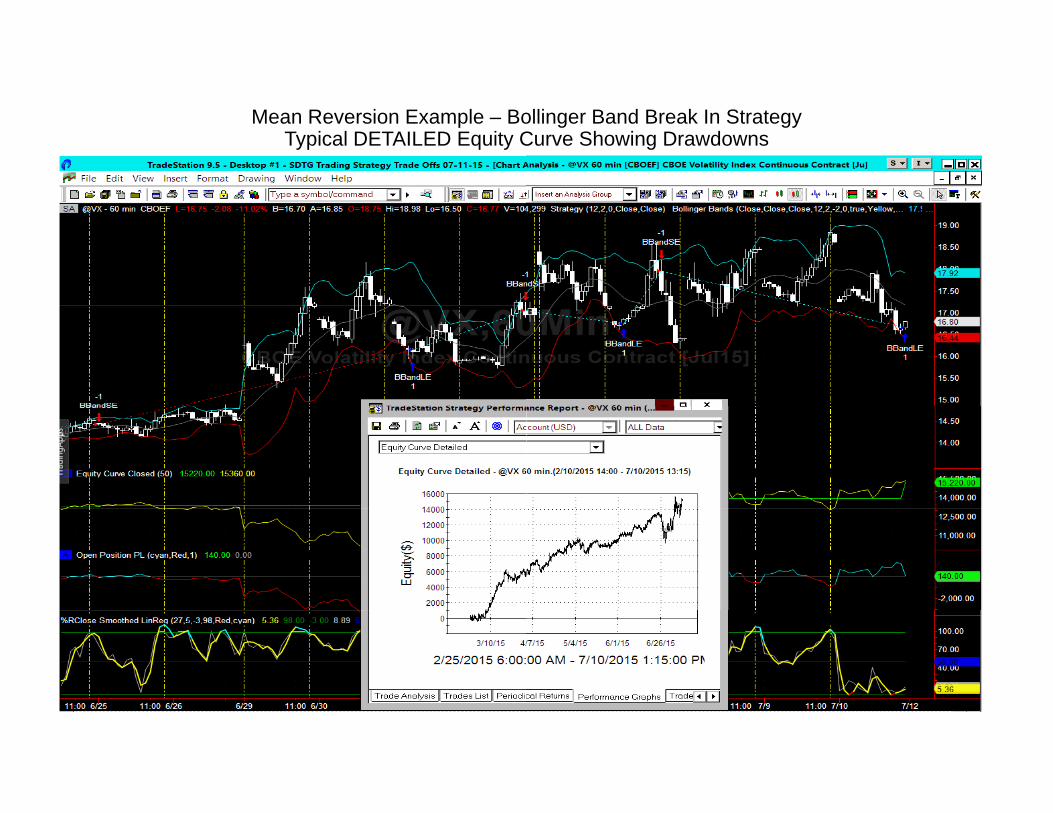
Mean Reversion vs Treend Following Breakout
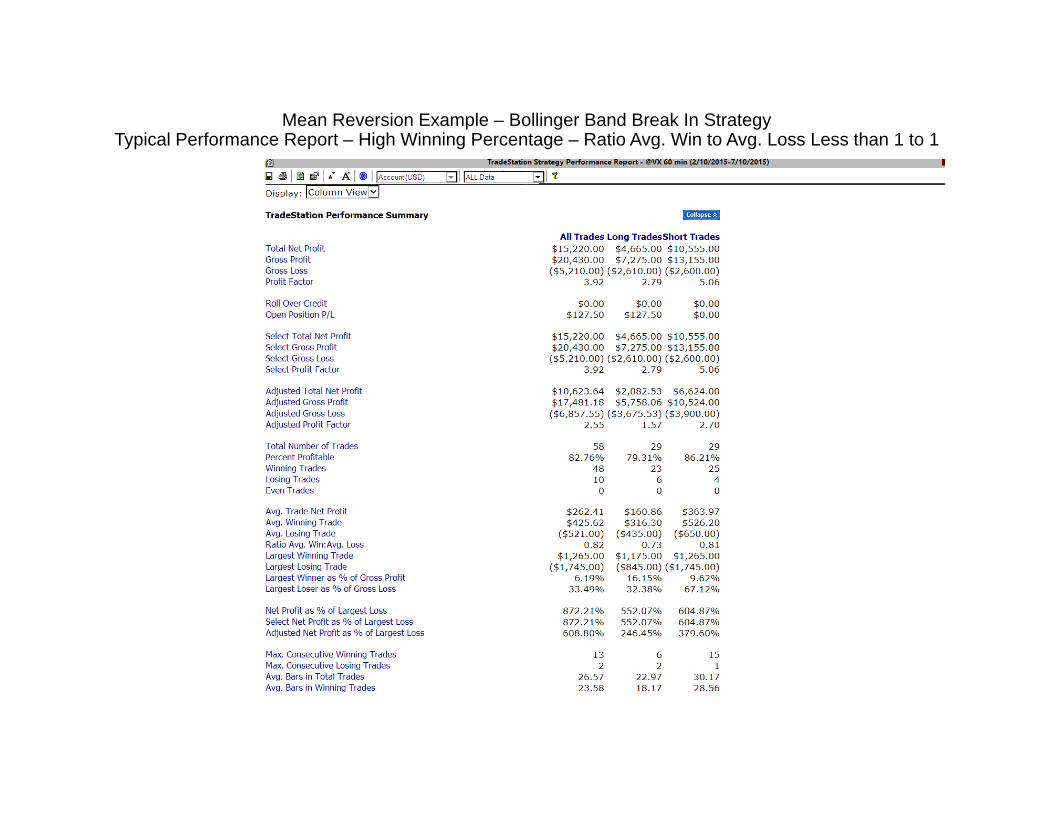
Mean Reversion Example – BoTypical Performance Report – High Winning Percen
ollinger Band Break In Strategy ntage – Ratio Avg. Win to Avg. Loss Less than 1 to 1
What AbouWhat Abou
•What happens whenpp
h h l ?•Do they help?
ut Targets?ut Targets?
n Targets are used?g
Target Tr
•Using Targets will smooth o•But will rarely make more m
• Targets, in general, Increaseh iDecrease the Average Win
closer to a 1 to 1 ratio.
•Why? Because it is similar top or bottom is, and the tatop or bottom is, and the tabefore the top or the botto
rade-offs
out the equity curve…money than All In – All Out
e the Win Rate, but ito Average Loss Ratio to
to anticipating where the arget will probably bearget will probably be om.

Target Good or T t ill h l if d th• Targets will help if used on thestrategy
• Targets will sometimes help if Strategies in Noisy or Choppy
• Using Targets can make you Fea profit….
• Disappointment when you gotthen the market trends much
• All In – All Out almost always m
Bad Trade-offst t d id f the countertrend side of the
used with Trend Following Market Conditions
eel Good. Happy that you took
t out with a small profit and further
makes more money

What AboWhat Abo
What happens whe
Do they help?Do they help?
out Stops?out Stops?
en Stops are used?
Stop Tra• Using Stops will prevent Trading
• Having Stops too close to the esystem performance, due to besystem performance, due to be
• (Someone Remind Me to Show
M R i S t d• Mean Reversion Systems need effectively, but not so large thatwhen hit.
• Market based trailing stops willposition
• Sometimes the best trailing sto
ade-offsg Account Disasters
ntries will often degrade the eing hit too many times.eing hit too many times. an Example of this Later)
l t t tlarge stops to operate t they damage the account
l help to maintain a long term
p is the reversal entry signal

What AboutWhat About
•What happens when Sis applied?is applied?
•Does it help?
Scaling In?Scaling In?
Scaling In to Positions
Scaling In T d/M t F ll i• Trend/Momentum Following:
• If the additional Buy entries arfirst entry then it is further “ufirst entry, then it is further uchance of being profitable. – (
• Mean Reversion:• If the Additional Buy Entries arfirst entry then it can possibly additional drawdown size. Thebecome Profitable Sooner thabecome Profitable Sooner thagoes up.
Trade-offs
re at a Higher price than the p the hill” and has a decreasedp the hill and has a decreased examples to follow)
re at a Lower price than the help with the trade off of e Additional Entries will n the earlier entries if the pricen the earlier entries if the price
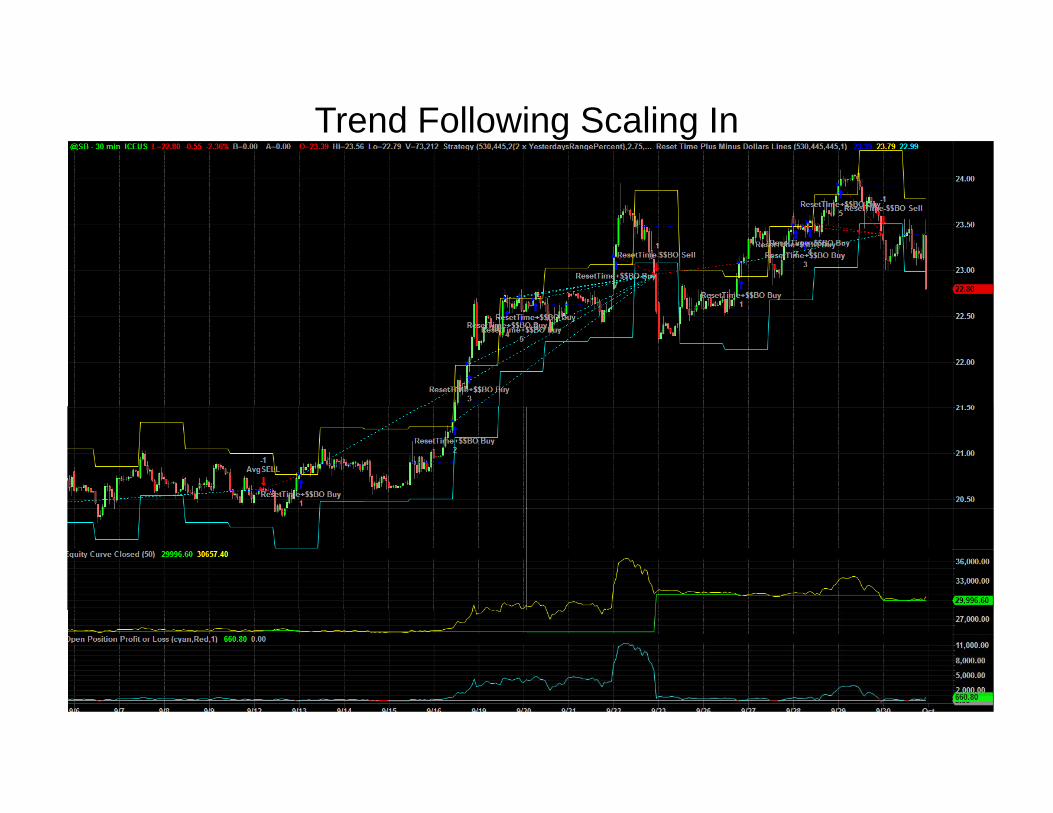
Trend Followiing Scaling In
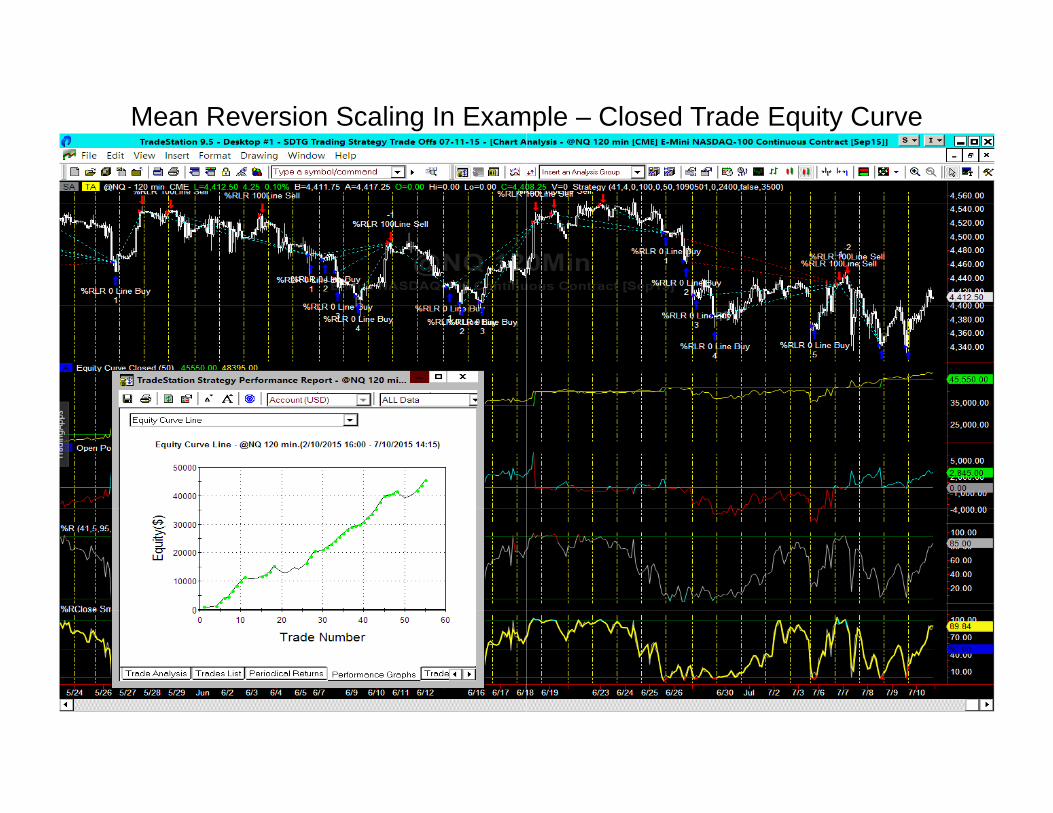
Mean Reversion Scaling In Exammple – Closed Trade Equity Curve
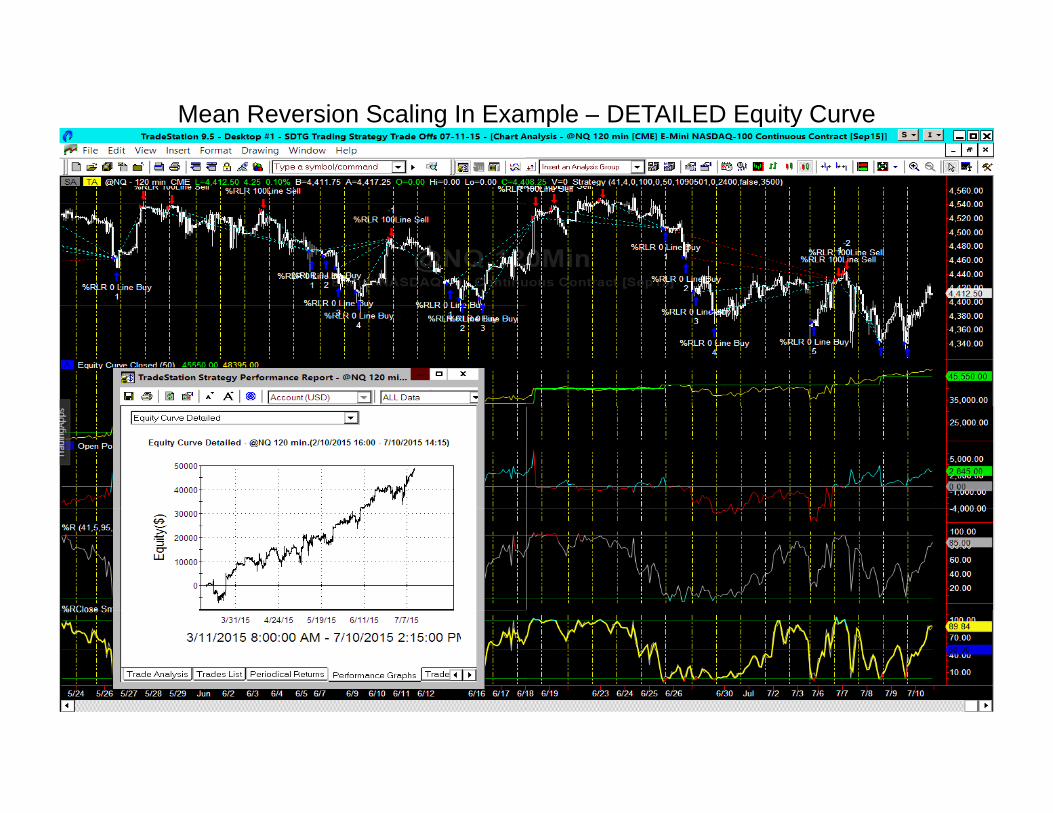
Mean Reversion Scaling In Exammple – DETAILED Equity Curve
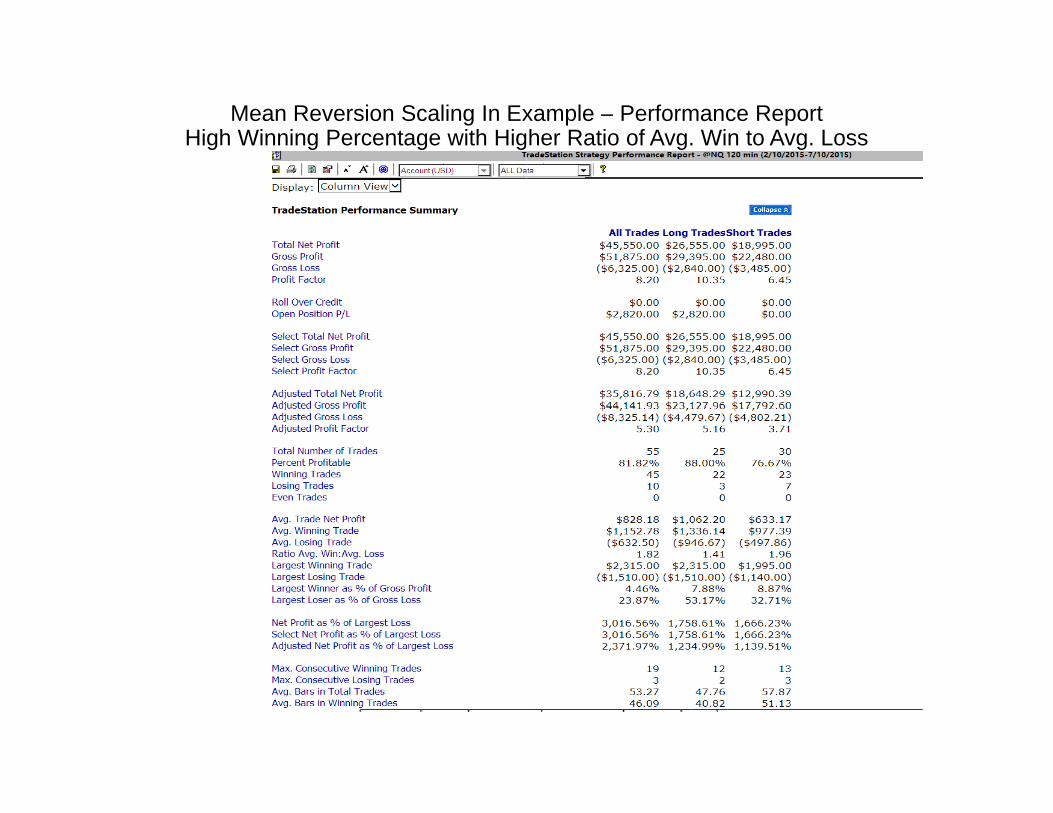
Mean Reversion Scaling In ExHigh Winning Percentage with Hig
xample – Performance Reporther Ratio of Avg. Win to Avg. Loss
More StrategMore Strateg
•High winning percentageHigh winning percentagerequire Small Targets an
•How often a strategy traHow often a strategy traTime Frames or Bar Sizin
•Strategies need Tradable•Strategies need Tradableprofit, which might increSizeSize
gy Trade-offsgy Trade offs
e strategies usually e strategies usuallyd Large Stopsades is often a function ofades is often a function of nge Swings in order toe Swings in order to ease the Average Loss
What About Trading
• In general, my observation using Daily Charts instead ocharts is that in exchange fopositions for a longer time,M t th t b tMovement that can be extr
•Daily Charts are really gooduptrends or large peaks in dPicture Trend DirectionPicture Trend Direction
g with Daily Charts?
is that the Trade‐Off with of Minute, Tick or Volume or fewer trades and holding , there is usually Less
t d f th k tracted from the markets.
d for finding large dips in downtrends and for Bigger
Steve’s Tips for S• Simple Strategies have the band Continue to Work into th
• Simple Strategies will work inconditions that the strategy w
•Decide which side of the Swit di (T di Pl )trading ‐ (Trading Plan)
•Decide what and how often yPlan)Plan)
• The fewer Optimizable Input• Virtually any single indicator• Virtually any single indicator weaponized into a strategy –
Strategy Designsest chance to stay Robust he Futuren most markets in the
fwas designed for. ing you are most comfortable
you want to trade (Trading
ts to Trigger Entries the betteror price pattern can beor price pattern can be
– Be Creative

Steve’s Tips for S• There is no one strategy whichmarket conditions – Symbols so
• Stop Looking for the Holy Grai• Develop a handful of “Good Enadapt to changing market con
• Don’t try to eliminate all the ri• Don’t try to eliminate all the riRisk!!
• Use Diversification of MarketsUse Diversification of Markets • Learn to Program your own Indnot as hard as you think….
• Test, Test, Test until you undercomfortable trading them
Strategy Designsh will work all the time in all ometimes change characteristics
lnough” strategies to apply and ditionsisk in strategy Embrace theisk in strategy – Embrace the
and Strategies to Reduce Riskand Strategies to Reduce Riskdicators and Strategies – It is
rstand your strategies and are
Steve’s Tips for Which Sy• Symbols/Markets with LargeSymbols/Markets with LargeDaily Net Changes (Big Dailydesign strategies for and are
k•More Market Movement = MExtract
• The Most Popular symbols oNoisiest Markets and Trend//Strategies often struggle in
• Symbols or Markets with thparticipation typically trend
ymbols/Markets to Tradeer Daily Ranges and Largerer Daily Ranges and Larger y Trend Bars) are easier to e typically more profitable
l llMore Potential Dollars to
or markets are probably the /Momentum Following / gnoisy conditions
e least popularity and d or swing better
More Tips for Which Sy
• Determine whether a symboltrading/trending tendencies otrading/trending tendencies otendencies. Apply the Appro
• (I’ll show you an easy way to ( y y y• Be Cautious trading symbols wevery day. Continuous price f
• There are Thousands of Symbfrom. Be flexible. Find the ont t N t A i t itstrategy, Not Against it.
mbols/Markets to Trade
or market has good swing or has mean revertingor has mean reverting priate Strategy Type.do this later…..))which have big opening Gaps flow is easier to trade.bols or Markets to choose nes that will Work With your

Steve’s HSteve s H
Consistently trade a “Strategy in the Right gy gSymbol is exhibiting tConditions where thaTh iThrive.
h• Steve Penacho – s
Holy GrailHoly Grail
“Good Enough” Symbol when that ythe Right Market at Strategy Can
Our Goal aOur Goal a
•To Enter and Exit PositioTo Enter and Exit PositioExtracting as much MarkPossible in Our Favor, wh,as Low as Possible.
• (More Market MovemenMoney to be made)
• (No Movement = No Mo
as Tradersas Traders
ns with the Intention ofns with the Intention of ket Movement as hile keeping Risk Levels p g
nt = More Potential
oney)
Test, Test,
•That is what we are •We are going to exp•We are going to expOptimization TestingWorld’s Greatest TesWorld s Greatest TesEquity Curves and Stdetermine the Predodetermine the PredoCharacteristics, MovPossibilities for TradPossibilities for TradMarket.
Test……..
going to do today.lore throughlore through g and looking at “The sting Strategy’s”sting Strategy s tatistics to ominateominate vement Potential and ing Any Symbol oring Any Symbol or
Test, Tes•We are not going to optimisettings, rather we will Use
l ikvery simple strategy Like a determine if a market has Tor Mean Reversion Tendenor Mean Reversion Tenden
• (Think along the lines of FuEarnings Per Share or FreeEarnings Per Share or Free
• This Indicator will also giveComparison to compare difComparison to compare difPotential Profitability based
st, Test…ize to select the best e the Testing Results of a
d l diFundamental Indicator to Trend Following Tendencies ciescies. undamental Indicators like Cash Flow)Cash Flow)e us a Numerical Units of fferent Symbols forfferent Symbols for d on Amount of Movement
The World’s GreatestCan Tell Us T
• 1) One Simple Test to QuicklyPredominately Trend FollowiCharacteristicsCharacteristics
• 2) Provides a Base Line MeasC M t d P tCompare Movement and PotAmounts between Symbols –Question of Which Symbol wo( h h h h• ( Which Ones might give us th
• 3) Provides a Base Line Num3) Provides a Base Line NumOther Strategies on the Same
t Strategy for Testing Three Things
y Determine if a Symbol has ng or Mean Reverting
surement Number to t ti l M M kitential Money Making – Helps to Answer the ould be Better to Trade?h f h k )he Best Bang for the Buck )
ber to Compare with ourber to Compare with our e Symbol and Time Frame

•And the World’s GreAnd the World s GreStrategy is………………
eatest Testingeatest Testing …
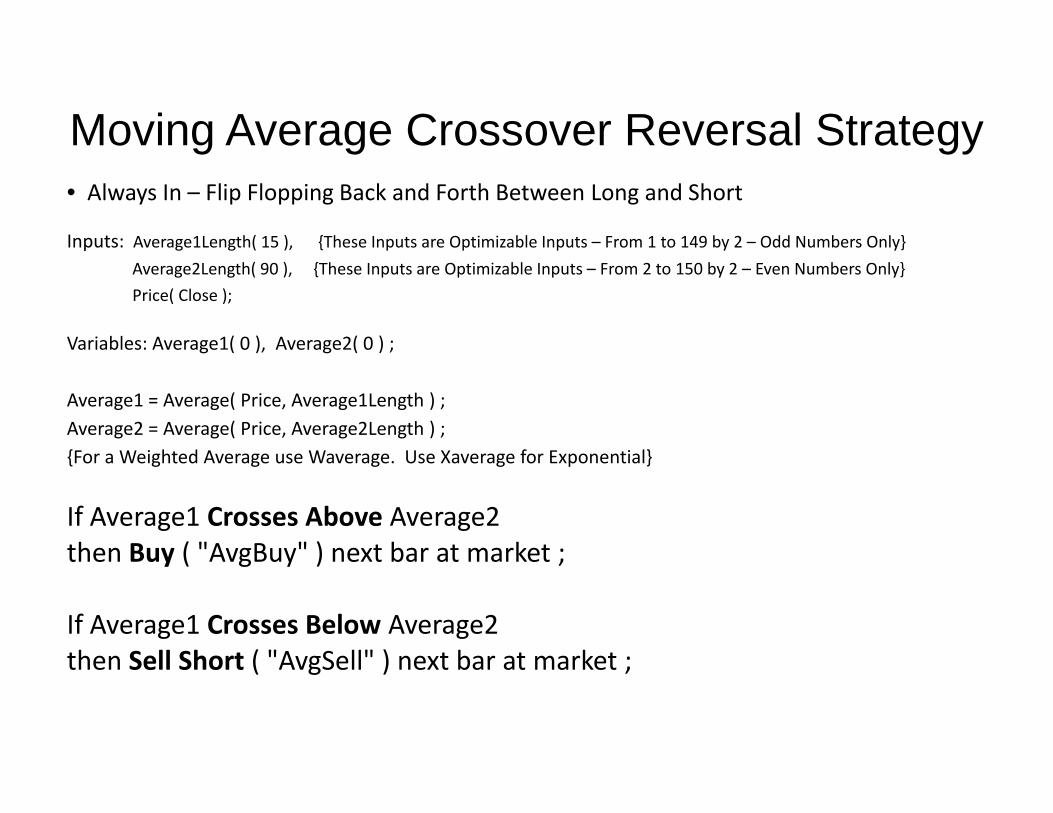
Moving Average Crosso• Always In – Flip Flopping Back and Forth Bety p pp g
Inputs: Average1Length( 15 ), {These Inputs are Optimizabl
Average2Length( 90 ), {These Inputs are Optimizable
Price( Close );
Variables: Average1( 0 ), Average2( 0 ) ;
Average1 = Average( Price, Average1Length ) ; g g ( , g g ) ;Average2 = Average( Price, Average2Length ) ;{For a Weighted Average use Waverage. Use Xaverage f
If A 1 C Ab A 2If Average1 Crosses Above Average2 then Buy ( "AvgBuy" ) next bar at mark
If Average1 Crosses Below Average2 then Sell Short ( "AvgSell" ) next bar at
over Reversal Strategytween Long and Shortg
le Inputs – From 1 to 149 by 2 – Odd Numbers Only}
e Inputs – From 2 to 150 by 2 – Even Numbers Only}
or Exponential}
ket ;
market ;
Moving Average Crosso
•Any type of Moving Averagy yp g g
• Simple Average WeightedSimple Average, Weighted Average, Hull Moving Avera
• Today we will use only the
over Reversal Strategy
ges can by used.g y
Average ExponentialAverage, Exponential age……
Simple Average.
What Moving Average Re
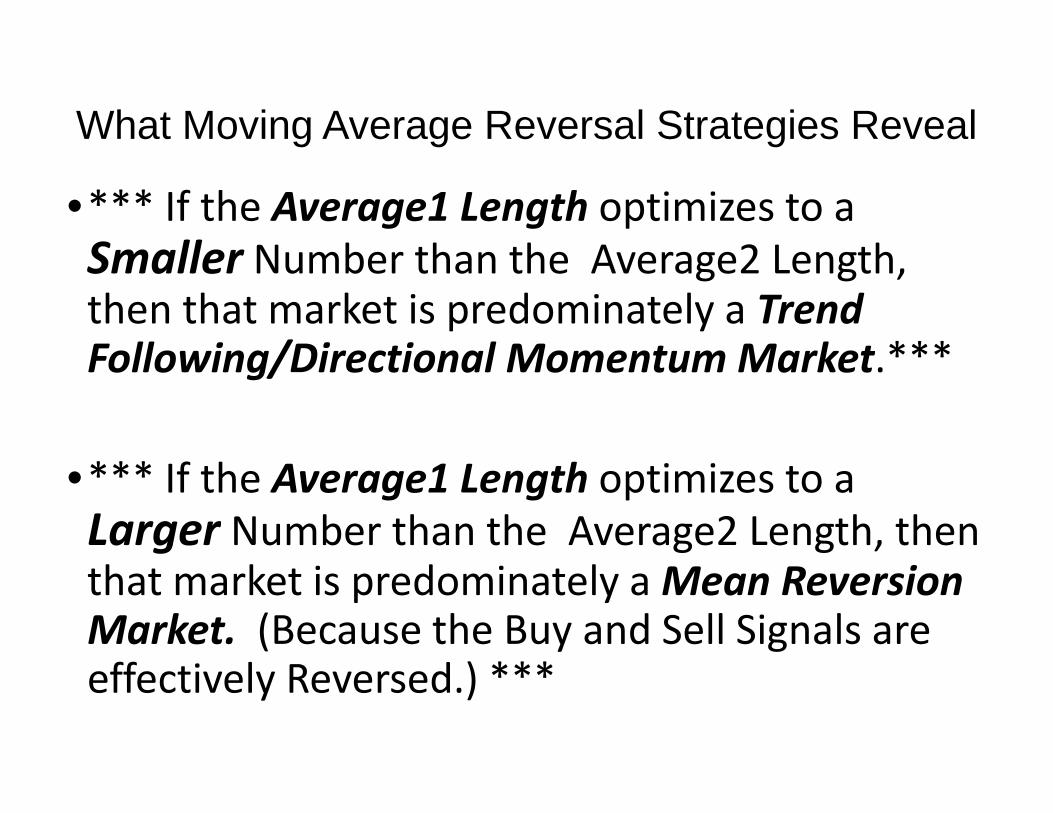
•*** If the Average1 Leng•*** If the Average1 LengSmaller Number than tthen that market is predthen that market is predFollowing/Directional M
•*** If the Average1 LengLarger Number than ththat market is predominMarket. (Because the Beffectively Reversed.) **
eversal Strategies Reveal
gth optimizes to agth optimizes to a he Average2 Length, dominately a Trenddominately a Trend Momentum Market.***
gth optimizes to a e Average2 Length, then nately a Mean Reversion uy and Sell Signals are **
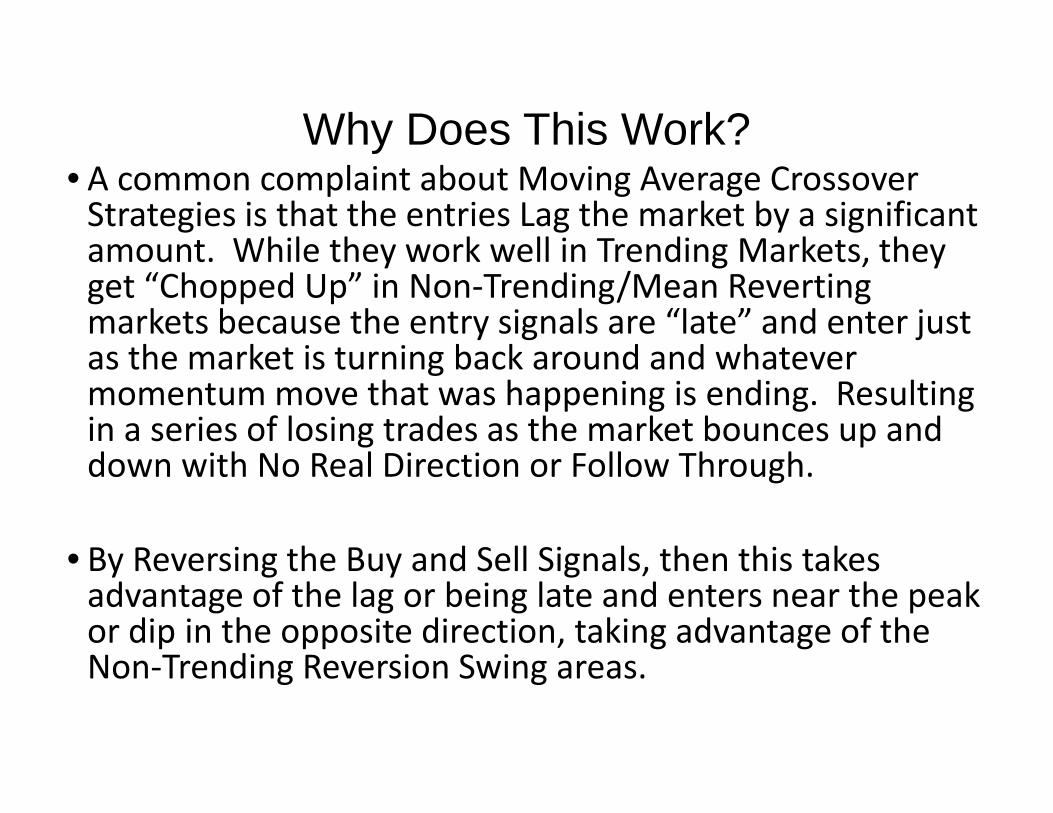
• A common complaint about MS i i h h i L
Why Does T
Strategies is that the entries Lamount. While they work weget “Chopped Up” in Non‐Tremarkets because the entry sigas the market is turning back momentum move that was hain a series of losing trades as down with No Real Direction
• By Reversing the Buy and Selladvantage of the lag or beingg g gor dip in the opposite directioNon‐Trending Reversion Swin
Moving Average Crossover L h k b i ifi
This Work?
Lag the market by a significant ell in Trending Markets, they ending/Mean Reverting gnals are “late” and enter just around and whatever appening is ending. Resulting pp g g gthe market bounces up and or Follow Through.
Signals, then this takes g late and enters near the peak g pon, taking advantage of the ng areas.

It Just WIt Just W•*** It appears that a M It appears that a MCrossover Reversal StrAlways have Positive EAlways have Positive Ean Optimization Test wthe Dominate Price Mthe Dominate Price MSymbol and Extract Sigfrom that style ***from that style.***
WorksWorks…..Moving AverageMoving Average rategy will virtually Expectancy becauseExpectancy, because will select whatever is ovement Style of thatovement Style of that gnificant Movement
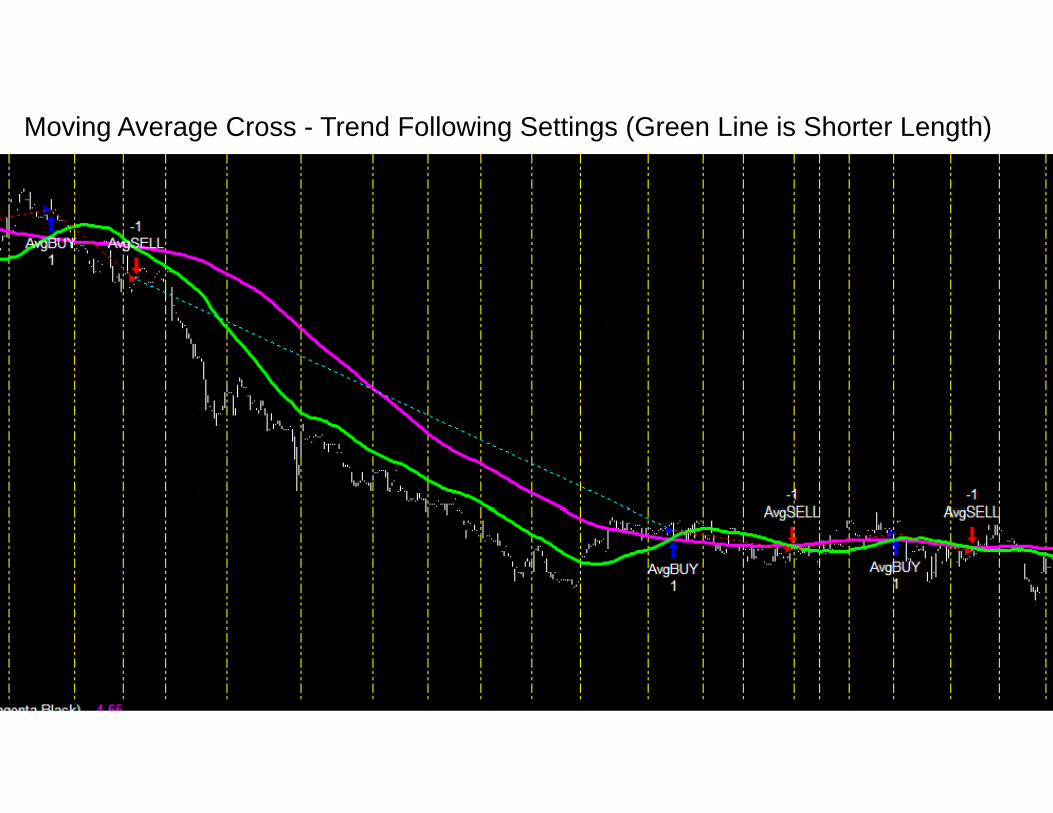
Moving Average Cross - Trend Following SSettings (Green Line is Shorter Length)
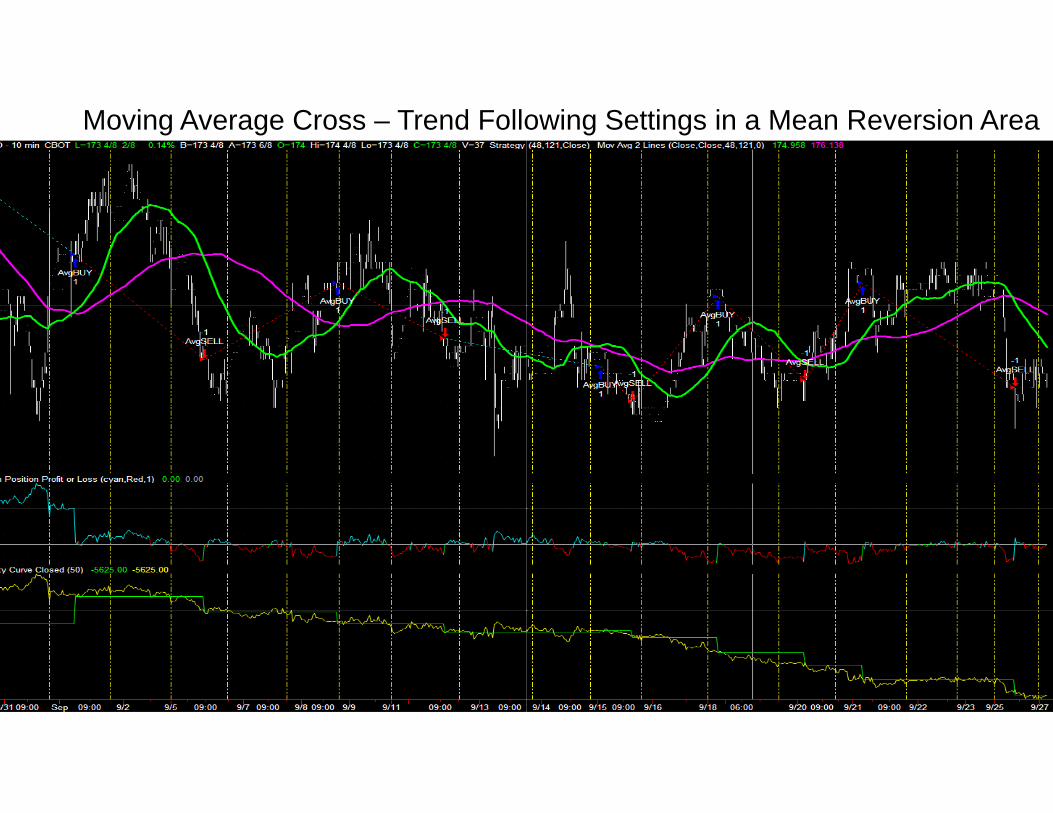
Moving Average Cross – Trend Folloowing Settings in a Mean Reversion Area

Moving Average Cross – Mean Reverssion Settings in a Mean Reversion Area
Something to KeepTestiTesti
• All of the Equity Curves and Perfwill be shown today are the prodthese are NOT REAL TRADES thethese are NOT REAL TRADES, theResults which we are going to usprevious Potentials and Tendenc
• A commission amount of $8 per entry and exit will be applied to
• We will be using about 1 year of• We will be using about 1 year ofSize of $100,000 because it will acompare any priced symbol withth th l l ti f P tthe math calculation for PercentExample: A test result of +15,00
p in Mind During the ngng…formance Report Statistics that duct of optimization tests and ey are only Historical Back Testedey are only Historical Back Tested se to analyze the Symbol’s cies for Comparison purposes.trade and Slippage of .01 on all of the tests.f back test data and a Positionf back test data and a Position allow us to pretend trade and h at least 100 shares and it makes t G i d P Y t dtage Gained Per Year easy to do. 00 would be a 15% gain.

Ok L t’ ChOk, Let’s CheSymSym
k O teck Out some bolsbols