trading diary manual - plum · pdf filetrading diary manual contents ... alexander elder in...
TRANSCRIPT
Trading Diary ManualContents
Introduction!1
Getting started!2
Planning a new trade!4
Managing open trades!8
Reviewing closed trades!10
Risk management!11
Sorting, filtering and searching trades!12
Viewing results!14
On-screen Help !16
Deposit management!16
Settings!16
.Support!17
IntroductionWelcome, and congratulations! You’ve made a wise choice by purchasing this software, and if you commit to using it regularly and consistently you will not be able but to see improvements in your trading. Learning from your own successes and failures is essential in becoming a better trader. We have
implemented the methods of Dr. Alexander Elder in creating this app, and the parameters of risk and money management used are based on his recommendations. This manual will give you the details you need to master the software quickly, so that you can start improving more quickly!
Plum Square Software Ltd.
WWW
www.plumsquare.com
Getting started
The first step in using the Trading Diary app is to set your parameters and reminders. Doing this first will allow for smoother use as you move forward. When you open the app, you will see five icons across the bottom of the screen. For your initial setup, you will want to tap on the “Settings” option, which is the fourth icon at the bottom right of the screen.
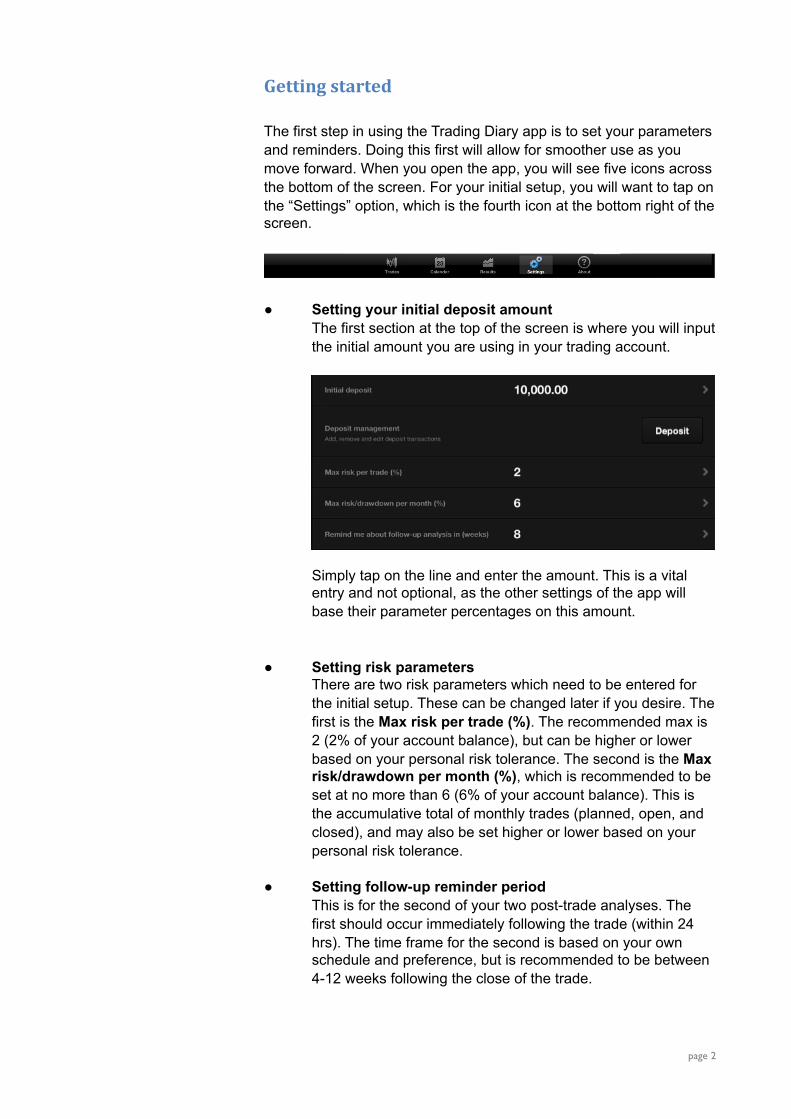
● Setting your initial deposit amountThe first section at the top of the screen is where you will input the initial amount you are using in your trading account.
Simply tap on the line and enter the amount. This is a vital entry and not optional, as the other settings of the app will base their parameter percentages on this amount.
● Setting risk parametersThere are two risk parameters which need to be entered for the initial setup. These can be changed later if you desire. The first is the Max risk per trade (%). The recommended max is 2 (2% of your account balance), but can be higher or lower based on your personal risk tolerance. The second is the Max risk/drawdown per month (%), which is recommended to be set at no more than 6 (6% of your account balance). This is the accumulative total of monthly trades (planned, open, and closed), and may also be set higher or lower based on your personal risk tolerance.
● Setting follow-up reminder periodThis is for the second of your two post-trade analyses. The first should occur immediately following the trade (within 24 hrs). The time frame for the second is based on your own schedule and preference, but is recommended to be between 4-12 weeks following the close of the trade.
page 2
● Linking with Dropbox accountDropbox is an app that works across many platforms to synchronize and backup data and files. If you do not currently have a Dropbox account, you should sign up for one at www.dropbox.com. The service is free for up to 5GB of data,which is more than sufficient for even the most intensive Trading Diary user. After signing up for an account, you should link it to your Trading Diary app so that you can backup your data. This will also allow for an easy exchange of screenshots with charts between your desktop and your Trading Diary iPad app.
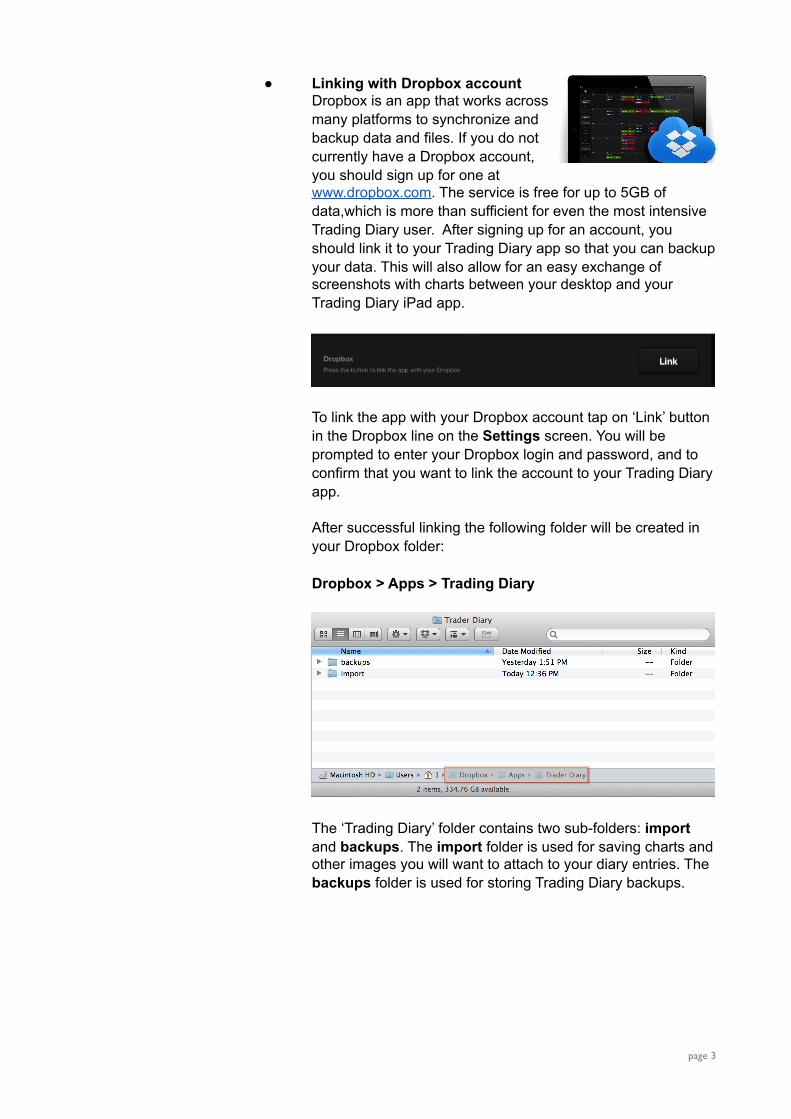
To link the app with your Dropbox account tap on ‘Link’ button in the Dropbox line on the Settings screen. You will be prompted to enter your Dropbox login and password, and to confirm that you want to link the account to your Trading Diary app.
After successful linking the following folder will be created in your Dropbox folder:
Dropbox > Apps > Trading Diary
The ‘Trading Diary’ folder contains two sub-folders: import and backups. The import folder is used for saving charts and other images you will want to attach to your diary entries. The backups folder is used for storing Trading Diary backups.
page 3

Planning a new tradeTo begin planning a trade, tap on the Trades icon at the bottom left side of the screen.
You will see three titles at the top - Plan, Trade, and Review. Tap on Plan to begin planning a trade.
● Adding a new planBegin by tapping where you see +New or enter the ticker symbol in the Quick Plan field.
or
The fields will appear for you to populate. First you will tap on the Symbol field and enter the ticker symbol for the stock you wish to trade.
● Entering trade directionNext you will move one field to the right and choose the direction of your trade by tapping either Long or Short.
● Selecting type of entry orderIn the section below the Symbol field, you will choose the type of entry order by tapping on Stop, Limit, Stop/Limit, or Market.
● Entering entry, target and stop pricesBelow the type of entry order, input your entry price, your target price, and your protective stop price.
page 4

● Using risk management and position sizing blockThe block for risk management and position sizing is automatically populated for you initially, based on the max risk per trade threshold you set initially.
The risk level may be adjusted up or down in any of three ways: dollar risk, risk percentage, or number of shares. When one of these is adjusted, the other two will automatically adjust proportionately. If your pre-set max risk threshold is exceeded, a pop-up warning will appear and the entire block will become red until adjusted back down. This will also calculate the Max risk/drawdown per month in the background and warn you if the trade you are planning will take you over your pre-set monthly threshold.
The Risk to Reward ratio is used to keep you from entering trades with limited potential.
● Entering volume
The average daily volume should be entered here. Although you may trade stocks with any volume levels you prefer, the recommended average daily volume for stocks to trade is above 500,000 shares. This is to avoid trading stocks with low liquidity, as there is a high risk of slippage in the entry and exit points
● Entering channel parametersFor swing trades a channel is a pair of lines drawn on a stock chart in parallel to the longer moving average on the daily chart so that approximately 95% of the price bars are within the channel.
page 5
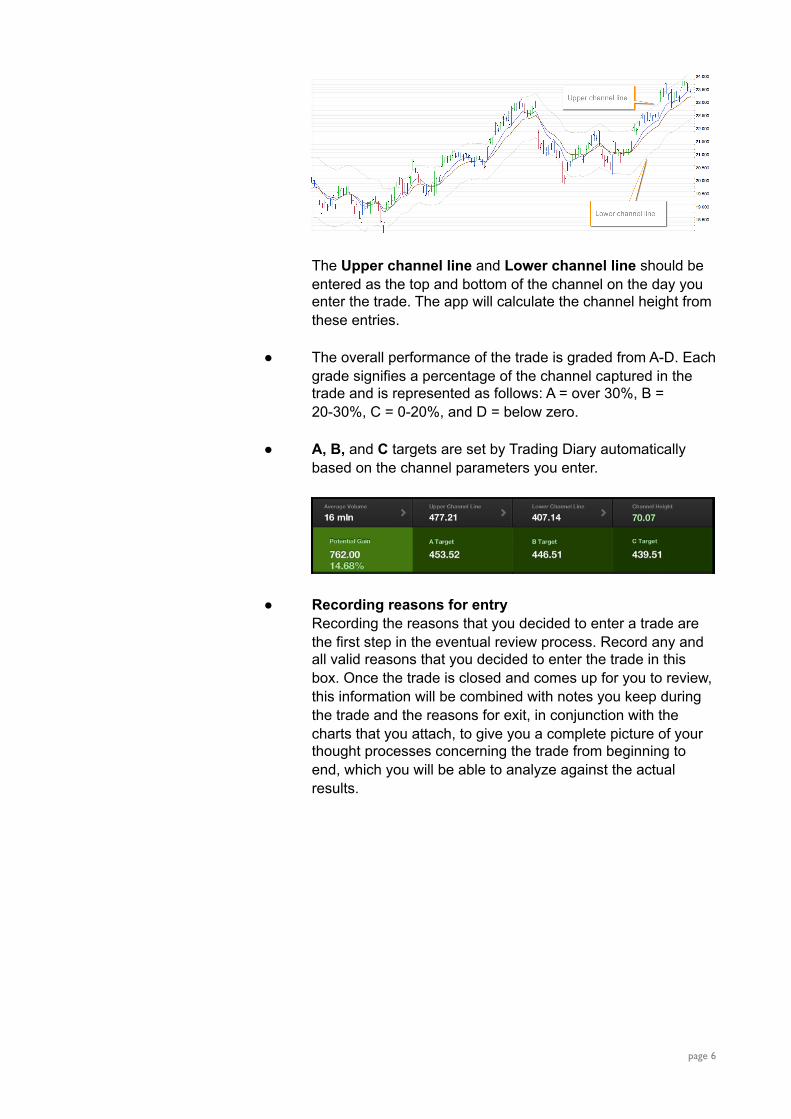
The Upper channel line and Lower channel line should be entered as the top and bottom of the channel on the day you enter the trade. The app will calculate the channel height from these entries.
● The overall performance of the trade is graded from A-D. Each grade signifies a percentage of the channel captured in the trade and is represented as follows: A = over 30%, B = 20-30%, C = 0-20%, and D = below zero.
● A, B, and C targets are set by Trading Diary automatically based on the channel parameters you enter.
● Recording reasons for entryRecording the reasons that you decided to enter a trade are the first step in the eventual review process. Record any and all valid reasons that you decided to enter the trade in this box. Once the trade is closed and comes up for you to review, this information will be combined with notes you keep during the trade and the reasons for exit, in conjunction with the charts that you attach, to give you a complete picture of your thought processes concerning the trade from beginning to end, which you will be able to analyze against the actual results.
page 6

● Attaching chartsCharts are a great visual tool both for decision-making and for review. There are three ways to attach your annotated screenshots of charts into your Trading Diary.
○ Using Dropbox is the easiest method, as you can use whatever desktop software you choose or currently are using.
Once your Dropbox account is connected to your Trading Diary app, you simply move your chart into the Dropbox folder (Dropbox > Apps > Trading Diary > import), and the app automatically checks to see if there is anything new in the import folder.
Then you can attach it to the appropriate trade for reference in your review process.
page 7

○ If you use your iPad for charting (for example, using stockcharts.com in the browser), you can copy and paste the chart using the clipboard on your iPad.
○ If you take screenshots of your charts directly on your iPad, they are saved to your Photos and can be pasted from there.
Managing open trades
Once the trade has been planned in the Plan tab, the next step is using the Trade tab to record the execution, duration, and exit of the trade.
page 8

● Entry point○ Record the date of the entry. The entry type and order price
are by default copied from the Plan tab.
○ Enter the fill price of the trade. This price will not necessarily be the same as the entry price due to slippage. The slippage block will calculate automatically based on the entry price and the fill price.
○ Enter the number of shares that were filled in your order.
○ Enter the high and the low for the day you enter the trade. Your entries and exits are graded in order to give you a simple percentage that illustrates how good your entry and exit points were in relation to the high and low prices for the day of each, which you enter into the appropriate spaces. The grade is presented as a percentage ranging from 1-100, showing the relation of your entry/exit price to the high and low. For example, if your entry point on a trade was 51.00 with a daily high of 54.00 and low of 50.00, your entry grade would be 75%. The goal is always to buy as close to the day's low and sell as close to the day's high as possible when you are trading long, and the reverse is true when you are trading short.
● Tracking adjustments in actual price target and protective stopTrading Diary allows for adjustments to your protective stop levels and your actual price target. Your actual price target may be different than the A, B, or C targets which are automatically calculated by the app, and is not used in risk calculations. Adjustments may be recorded in the 'in-trade comments' section for future reference.
• Calculation of actual risk When your protective stop is adjusted, the actual risk calculation will adjust as well. For instance, if your trade is moving in your direction and you raise your stop level, the risk level will automatically adjust downward since the raised stop will prevent losses at the level they were originally calculated. Adjustments to stop levels will also be assessed in the background to adjust the max risk per month.
page 9

• The in-trade comments section allows you to record thought from the trading day as to why you remained in the trade. You can also attach charts in the attach images section for future reference as to your decision making process.
● Exit point
○ The input for the exit point will be similar to the input for the entry point.
○ Enter the exit date, order price, and filled price
○ The slippage is automatically calculated
○ Enter the day’s high and low prices
○ The exit grade will be automatically calculated
○ Enter the reasons for exiting the trade
Reviewing closed trades
Reviewing your trades will give you the opportunity to see what you did well and what you didn’t do well. The information that you record in planning the trade, during the trade, and upon exit of the trade - price and slippage, charts, comments, etc - give you a complete picture of the trade from beginning to end. This will be invaluable to you in examining your performance, and will ultimately help you to become a better trader.
● Post-trade analysisThe first review should be done immediately following the trade, no more than 24 hours afterward. The activity of the
page 10

market and the decisions you made will still be fresh on your mind and will allow you to discover if your decisions were based on good information. It is a good idea to attach the chart of your exit day.
● Follow-up analysisThe second review should be done at a later date, once any emotions about the trade or the current situation have had time to pass. This will give you a more objective view of the trade and of your decisions concerning it. The default time period is 8 weeks, but this can be adjusted in the settings. The follow-up review setting is also set to remind you of this by default, but can also be turned off if you wish.
Risk management
One of the primary functions of the Trading Diary app is to help you manage the risk levels in your trades. This will help to both prevent major losses due to zealousness and to keep your confidence high. Two of the major psychological factors in poor trading are the emotional highs resulting from a successful trade which can lead to over-trading, and the emotional lows from unsuccessful trades which
page 11
can lead to ‘paralyzation’, or a fear of committing to a future trade because of a past major failure.
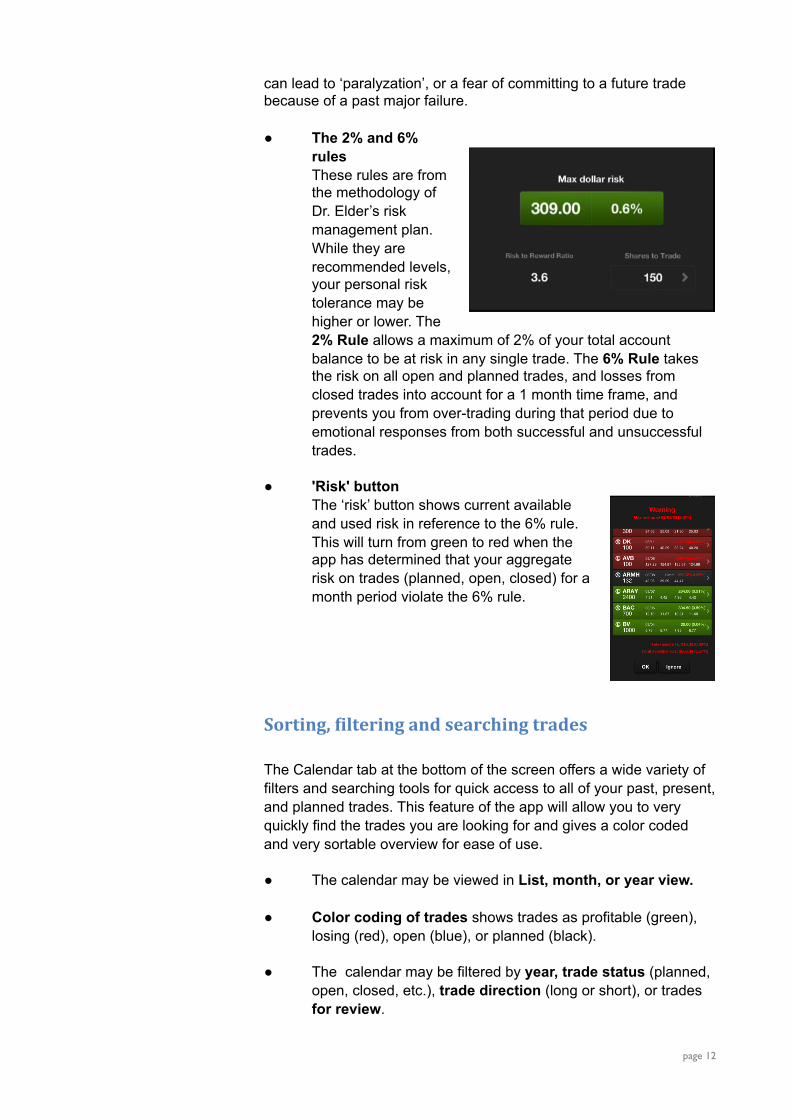
● The 2% and 6% rulesThese rules are from the methodology of Dr. Elder’s risk management plan. While they are recommended levels, your personal risk tolerance may be higher or lower. The 2% Rule allows a maximum of 2% of your total account balance to be at risk in any single trade. The 6% Rule takes the risk on all open and planned trades, and losses from closed trades into account for a 1 month time frame, and prevents you from over-trading during that period due to emotional responses from both successful and unsuccessful trades.
● 'Risk' buttonThe ‘risk’ button shows current available and used risk in reference to the 6% rule. This will turn from green to red when the app has determined that your aggregate risk on trades (planned, open, closed) for a month period violate the 6% rule.
Sorting, <iltering and searching trades
The Calendar tab at the bottom of the screen offers a wide variety of filters and searching tools for quick access to all of your past, present, and planned trades. This feature of the app will allow you to very quickly find the trades you are looking for and gives a color coded and very sortable overview for ease of use.
● The calendar may be viewed in List, month, or year view.
● Color coding of trades shows trades as profitable (green), losing (red), open (blue), or planned (black).
● The calendar may be filtered by year, trade status (planned, open, closed, etc.), trade direction (long or short), or trades for review.
page 12
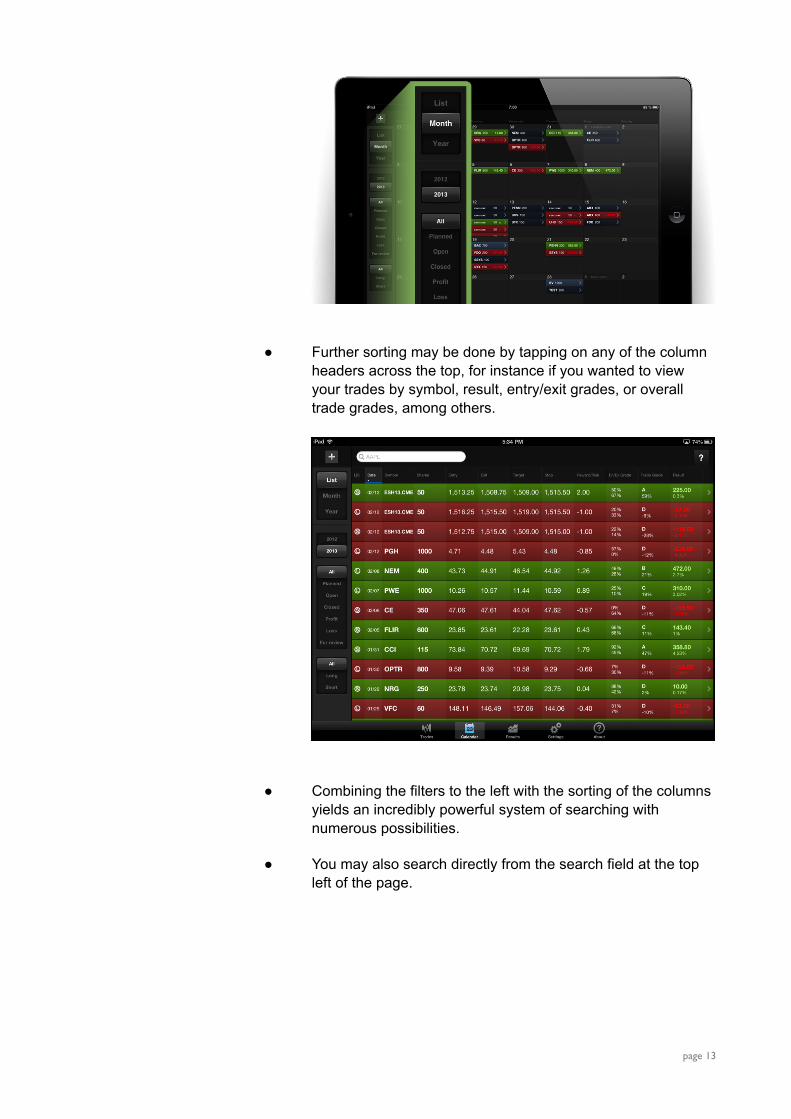
● Further sorting may be done by tapping on any of the column headers across the top, for instance if you wanted to view your trades by symbol, result, entry/exit grades, or overall trade grades, among others.
● Combining the filters to the left with the sorting of the columns yields an incredibly powerful system of searching with numerous possibilities.
● You may also search directly from the search field at the top left of the page.
page 13
Viewing results
Another powerful feature of the Trading Diary app is the Results tab at the bottom, which shows the results of your trading history in visual graphs as well as with detailed statistics. This is yet another way to quickly analyze your performance in order to make you a better trader.
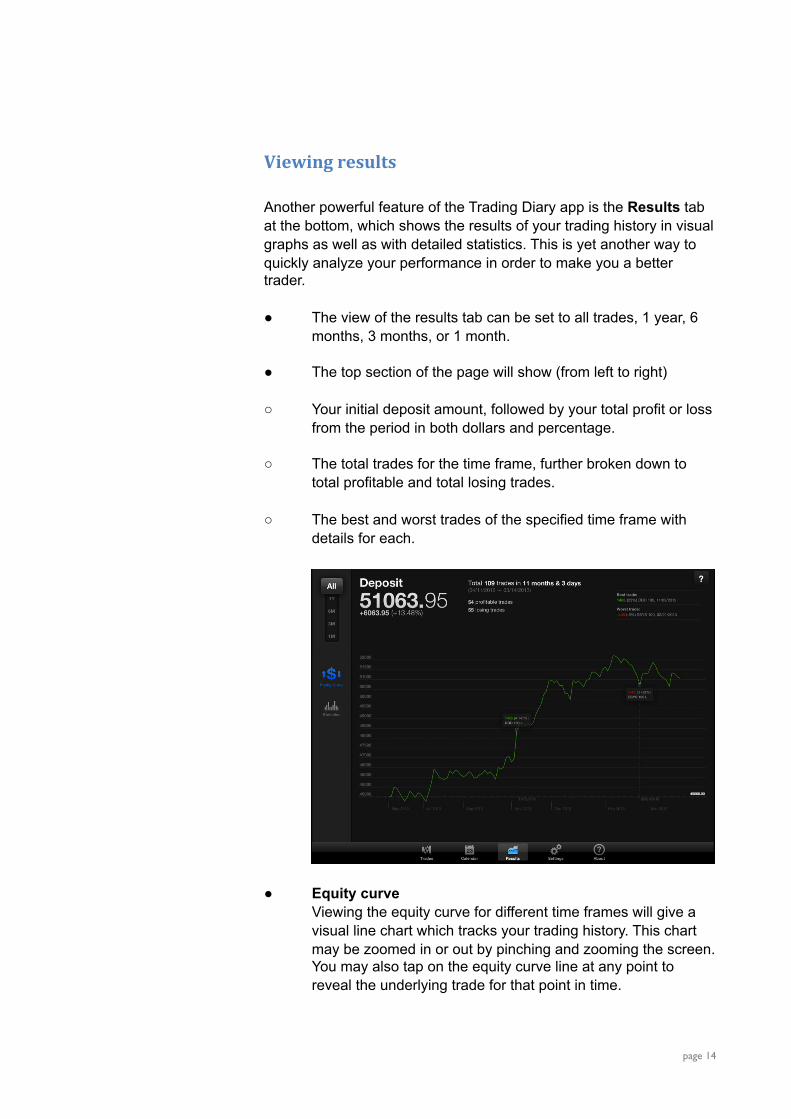
● The view of the results tab can be set to all trades, 1 year, 6 months, 3 months, or 1 month.
● The top section of the page will show (from left to right)
○ Your initial deposit amount, followed by your total profit or loss from the period in both dollars and percentage.
○ The total trades for the time frame, further broken down to total profitable and total losing trades.
○ The best and worst trades of the specified time frame with details for each.
● Equity curveViewing the equity curve for different time frames will give a visual line chart which tracks your trading history. This chart may be zoomed in or out by pinching and zooming the screen. You may also tap on the equity curve line at any point to reveal the underlying trade for that point in time.
page 14
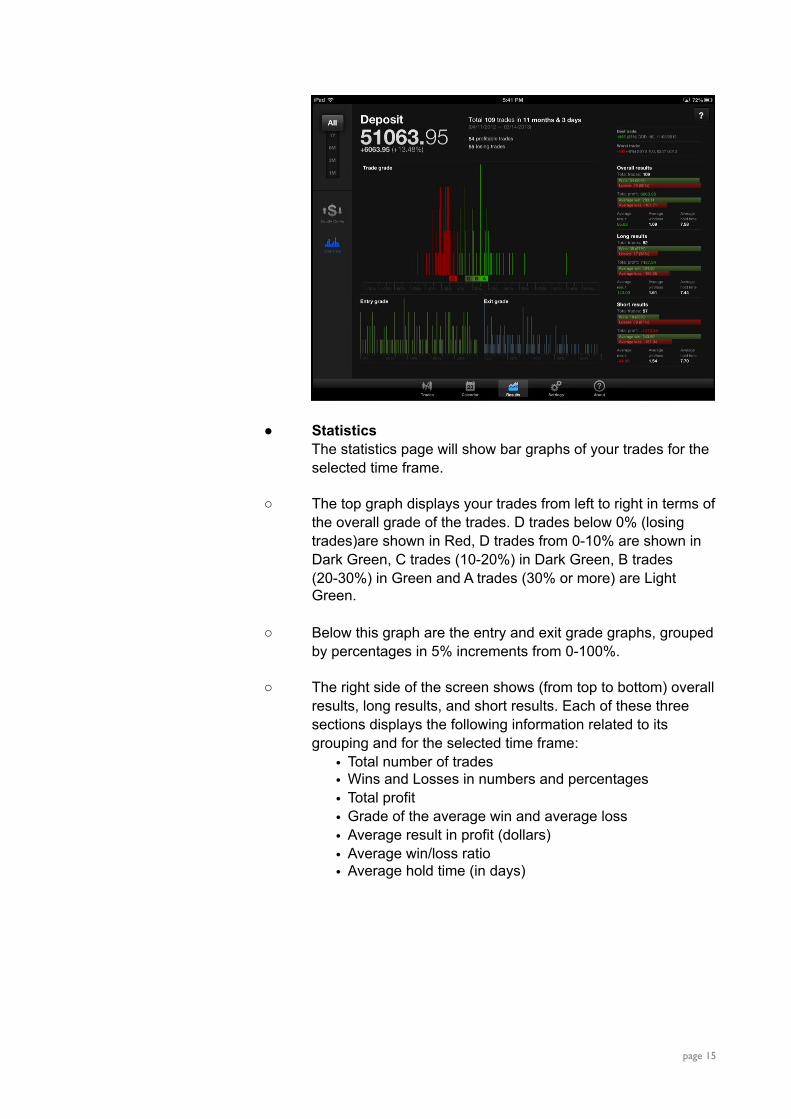
● Statistics The statistics page will show bar graphs of your trades for the selected time frame.
○ The top graph displays your trades from left to right in terms of the overall grade of the trades. D trades below 0% (losing trades)are shown in Red, D trades from 0-10% are shown in Dark Green, C trades (10-20%) in Dark Green, B trades (20-30%) in Green and A trades (30% or more) are Light Green.
○ Below this graph are the entry and exit grade graphs, grouped by percentages in 5% increments from 0-100%.
○ The right side of the screen shows (from top to bottom) overall results, long results, and short results. Each of these three sections displays the following information related to its grouping and for the selected time frame:
• Total number of trades• Wins and Losses in numbers and percentages• Total profit• Grade of the average win and average loss• Average result in profit (dollars)• Average win/loss ratio• Average hold time (in days)
page 15

On-‐screen Help
Most screens will have on-screen help available for your reference. This is accessed by tapping the “?“ that is located in the top right corner of the screen.
Deposit management
The Settings tab includes a Deposit Management section. On this screen you can add, remove, and edit transactions to reflect the actual transactions from your deposit account. Doing this will give your app accurate information for developing your equity curve.
Settings
In addition to the initial setup of your app, the settings tab offers several helpful options to maximize the use of Trading Diary and the ease of use for you. ● Backup and restore
The data from your app can be backed up and restored several ways so that you can make sure you don’t lose it.
page 16
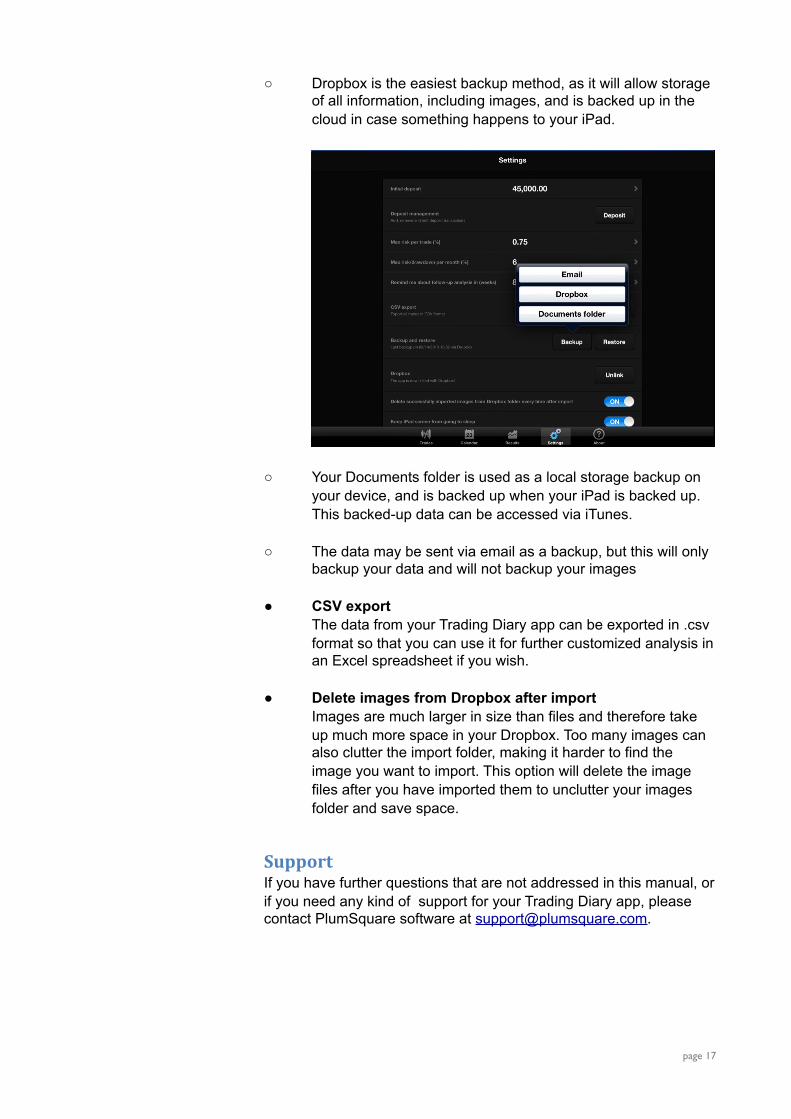
○ Dropbox is the easiest backup method, as it will allow storage of all information, including images, and is backed up in the cloud in case something happens to your iPad.
○ Your Documents folder is used as a local storage backup on your device, and is backed up when your iPad is backed up. This backed-up data can be accessed via iTunes.
○ The data may be sent via email as a backup, but this will only backup your data and will not backup your images
● CSV exportThe data from your Trading Diary app can be exported in .csv format so that you can use it for further customized analysis in an Excel spreadsheet if you wish.
● Delete images from Dropbox after import Images are much larger in size than files and therefore take up much more space in your Dropbox. Too many images can also clutter the import folder, making it harder to find the image you want to import. This option will delete the image files after you have imported them to unclutter your images folder and save space.
SupportIf you have further questions that are not addressed in this manual, or if you need any kind of support for your Trading Diary app, please contact PlumSquare software at [email protected].
page 17