trade through global value chains: can wto rules have a rolewtocentre.iift.ac.in/cbp/gvc.pdf ·...
TRANSCRIPT

Trade Through Global Value Chains: Can WTO Rules Have a Role
Abhijit Das
Professor and Head
Centre for WTO Studies, IIFT, New Delhi

Why GVCs relevant?
• During the Eight WTO Ministerial Conference held in Geneva in 2011, some Ministers said that the WTO needed to pay more attention to global value chains.
• Considerable work being done on GVCs in various international organisations
• OECD WTO TIVA
• Specific reference to GVCs in G20 Los CabosDeclaration

Los Cabos Declaration
• We value the discussion held by our Trade Ministers in Puerto Vallarta on the relevance of regional and global value chains to world trade, recognizing their role in fostering economic growth, employment and development and emphasizing the need to enhance the participation of developing countries in such value chains. We encourage a deepening of these discussions in the WTO, UNCTAD and OECD within their respective mandates, and we call on them to accelerate their work on analyzing the functioning of global value chains and their relationship with trade and investment flows, development and jobs, as well as on how to measure trade flows, to better understand how our actions affect our countries and others, and to report on progress under Russia's Presidency

Structure of presentation
• What are GVCs, why are they important
• Drivers of GVC integration
• How are gains distributed in GVCs
• Implications of GVCs for trade policy and trade negotiations

What are GVCs, why are they important ?

What is a GVC
• A global value chain (GVC) is a chain of separate but inter-linked and coordinatedactivities, which can be undertaken within a single firm or be divided among multiple firms in different geographical locations to bring out a product or a service from conception to complete production and delivery to final consumers.

Structure of GVCs
• Structured around a lead firm and network of contract manufacturers, suppliers, logistics providers etc.
• Lead firms take key decisions in the GVC and exercise control over other players, even in absence of ownership.
• Lead firm – supplier relationship determined by perceived risk to the buyer arising on account of failure of the producer to supply quality products on a reliable and timely basis

Buyer/ supplier driven GVCs
• Buyer- driven GVC: Lead firms are large retailers marketers and brand owners (Walmart, Nike etc.)
Product specification prescribed by leadfirm, manufacturing done by decentralized developingcountry manufacturers.
Lead firms retain close control on the suppliers• Producer driven chains: Lead firms are manufacturers
making advance products Exert control over backward linkages for raw materials and
component suppliers; forward linkage in distribution and retailing
Automobile manufactures, PC manufacturers are good examples of producer driven GVCs
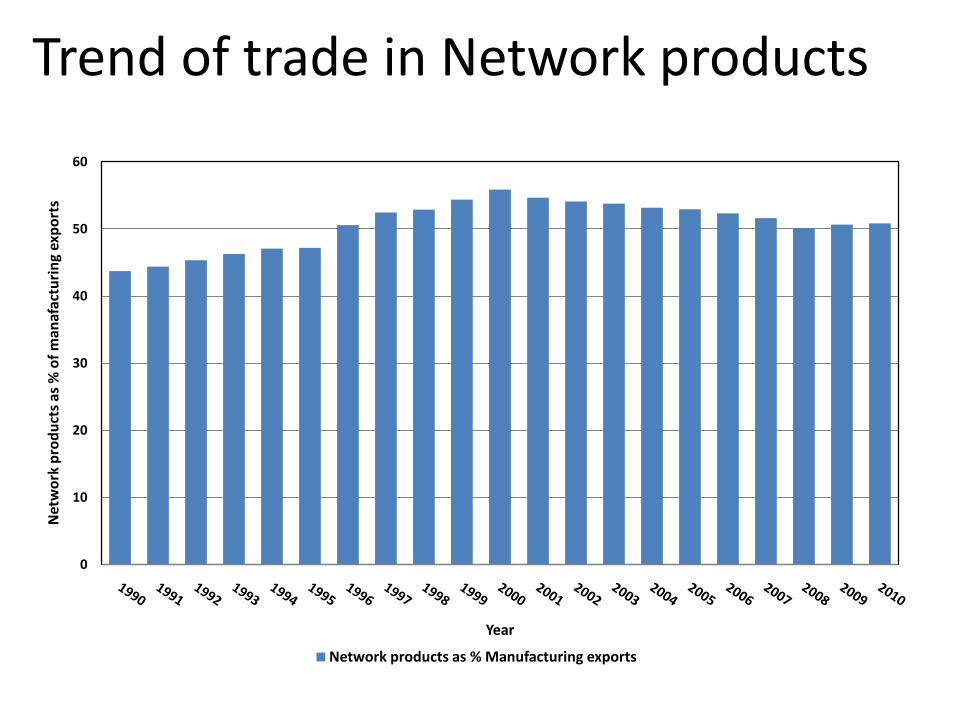
Trend of trade in Network products
0
10
20
30
40
50
60
Net
wo
rk p
rod
uct
s as
% o
f m
anaf
actu
rin
g ex
po
rts
Year
Network products as % Manufacturing exports
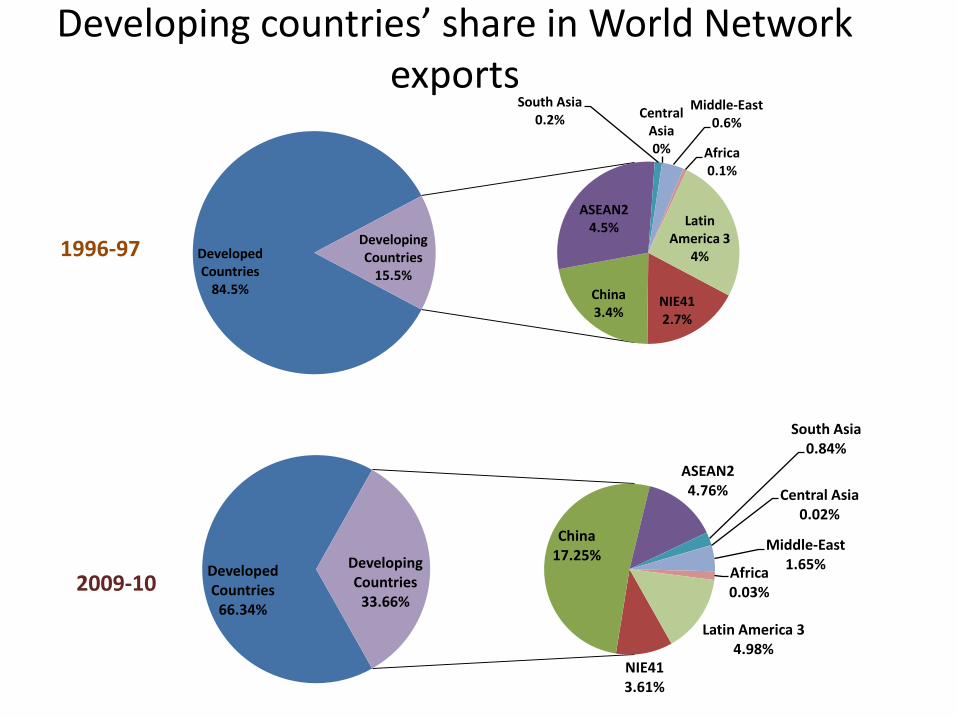
Developing countries’ share in World Network exports
Developed Countries
84.5%NIE412.7%
China3.4%
ASEAN24.5%
South Asia0.2% Central
Asia0%
Middle-East0.6%
Africa0.1%
Latin America 3
4%Developing Countries
15.5%
1996-97
Developed Countries
66.34%
NIE413.61%
China17.25%
ASEAN24.76%
South Asia0.84%
Central Asia0.02%
Middle-East1.65%
Africa0.03%
Latin America 34.98%
Developing Countries
33.66%2009-10

0
500,000
1,000,000
1,500,000
2,000,000
2,500,000
Icel
and
Esto
nia
Ne
w Z
eala
nd
Slo
ven
ia
Luxe
mb
ou
rg
Slo
vak
Re
pu
blic
Po
rtu
gal
Isra
el
Gre
ece
Hu
nga
ry
Fin
lan
d
Ch
ile
Sou
th A
fric
a
Cze
ch R
ep
ub
lic
Turk
ey
De
nm
ark
Me
xico
Ire
lan
d
Po
lan
d
Au
stri
a
Swed
en
Ind
on
esia
Bra
zil
Swit
zerl
and
Ind
ia
Bel
giu
m
Spai
n
Can
ada
Au
stra
lia
No
rway
Net
her
lan
ds
Ital
y
Fran
ce
Ko
rea
UK
Ru
ssia
n F
eder
atio
n
Jap
an
Ch
ina
Ger
man
y
Un
ite
d S
tate
s
Re
st o
f th
e W
orl
d
Value Added Exports in GVC (2009)
Value- Added exports (FDDVA) VA exports of a country embodied in gross exports of other countries (based on EXGR_FVA)

Drivers of GVC integration
Technology as important driver of GVCs
• Reduction in global transportation costs
Containerisation revolutionised maritime transport
Decline in air cargo freight costs $ 3.87 in 1955 to $0.30 per ton-km
• Product modularity led to ease in standardisationand codification resulting in fragmentation
• IT revolution made communications easier andcheaper

What factors determine decision of lead firms to link with suppliers?
• Labour cost arbitrage• Skilled labour and managers• Availability of trade-related physical
infrastructure• Trade logistics and support services• Ease of doing business• Proximity to markets• Role of tariffs• Duty free access to markets• Ability to comply with standards

How are gains distributed in GVCs
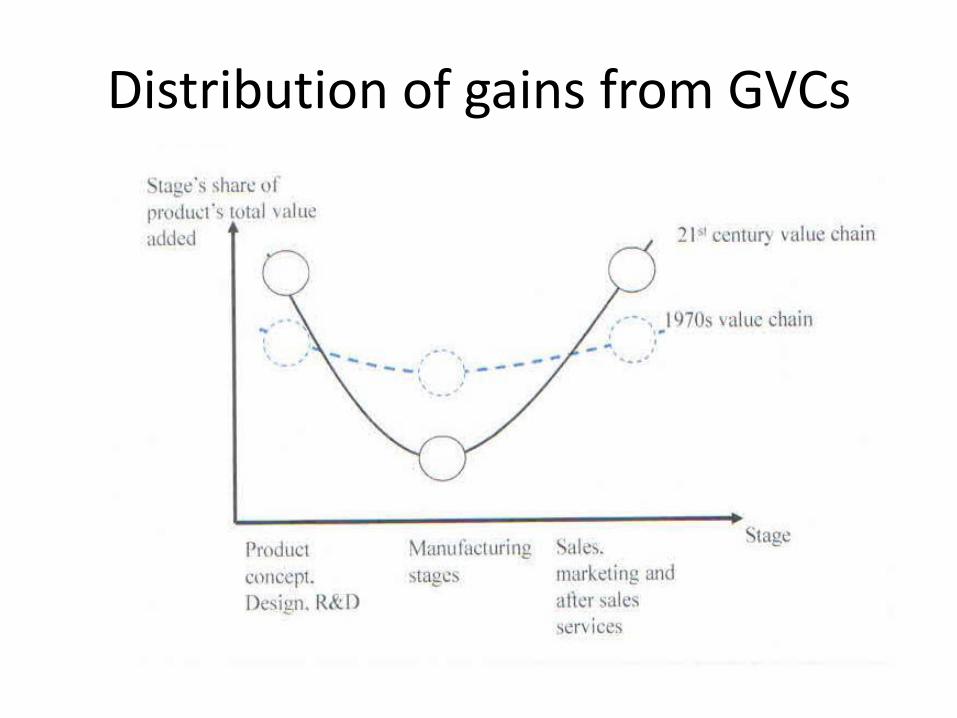
Distribution of gains from GVCs

Case studies on distribution of gains in GVCs
• i-Pod: value added in China $ 4 out of retail price of $ 299
• Nokia N-95: assembled in China but 68 % va in Europe
• i-Pad: Apple’s gross margin 54%
• Dell PCs: 50% profit to IBM, 20% to Dell but less than 5% to Quanta (Taiwan manufacturer)
• Home furnishing: Indian producer’s unit price $ 20/m, retailed at 5 – 6 times price in US/EC

Case studies on distribution of gains in GVCs
• Coffee: 40% of gains to traders, 45% gains to roasters and remaining 15% to 25 mn farmers
• Fresh vegetables from Kenya: producers account for 15% income, super markets for 45% income
• Canned deciduous fruits: 12.4% income to producers, 26.7% to retailers

Participation Rate (in %) of top 20 countries and economies: 2000 and 2009
0.00 2.00 4.00 6.00 8.00 10.00 12.00 14.00
Russian …
Sweden
Ireland
Singapore
Malaysia
Mexico
Spain
Chinese …
Belgium
China
Korea
Netherlands
Canada
Italy
Rest of …
France
United …
Japan
Germany
United …
50 % Backward Linkage (in perecentage)
50 % Forward Linkage(in percentage)
0.00 2.00 4.00 6.00 8.00 10.00
Sweden
India
Malaysia
Ireland
Canada
Switzerland
Spain
Belgium
Singapore
Chinese Taipei
Russian Federation
Netherlands
Italy
United Kingdom
Korea
France
Japan
Rest of the World
Germany
United States
China

Distribution of Forward Linkage in GVCs
0
50
100
150
200
250
300
350
400
450
Valu
e in
US
D B
illi
on
Forward Linkage 1995 Forward Linkage 2005 Forward Linkage 2009
Poly. (Forward Linkage 1995) Poly. (Forward Linkage 2005) Poly. (Forward Linkage 2009)

GVCs: Continue to remain a developed country story
• Italy, Japan, Spain, UK and USA are the only countries which are major players in backward and forward linkage, who also add more value to other countries exports than the value added by others in their exports.
• China’s participation high, but gains low.
China adding low value to imported inputs
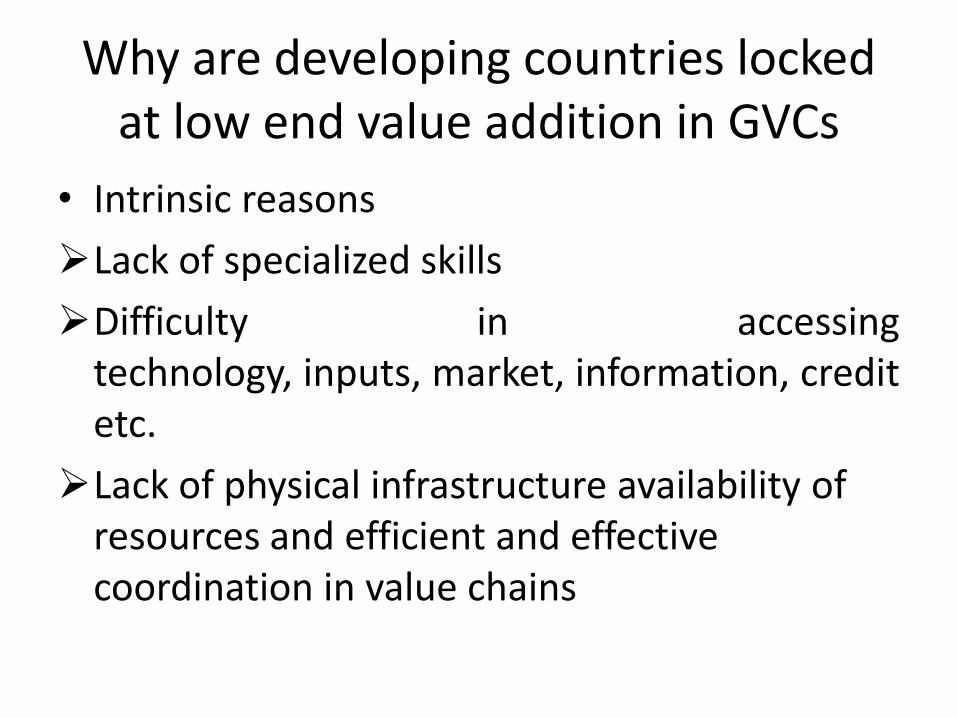
Why are developing countries locked at low end value addition in GVCs
• Intrinsic reasons
Lack of specialized skills
Difficulty in accessingtechnology, inputs, market, information, creditetc.
Lack of physical infrastructure availability of resources and efficient and effective coordination in value chains
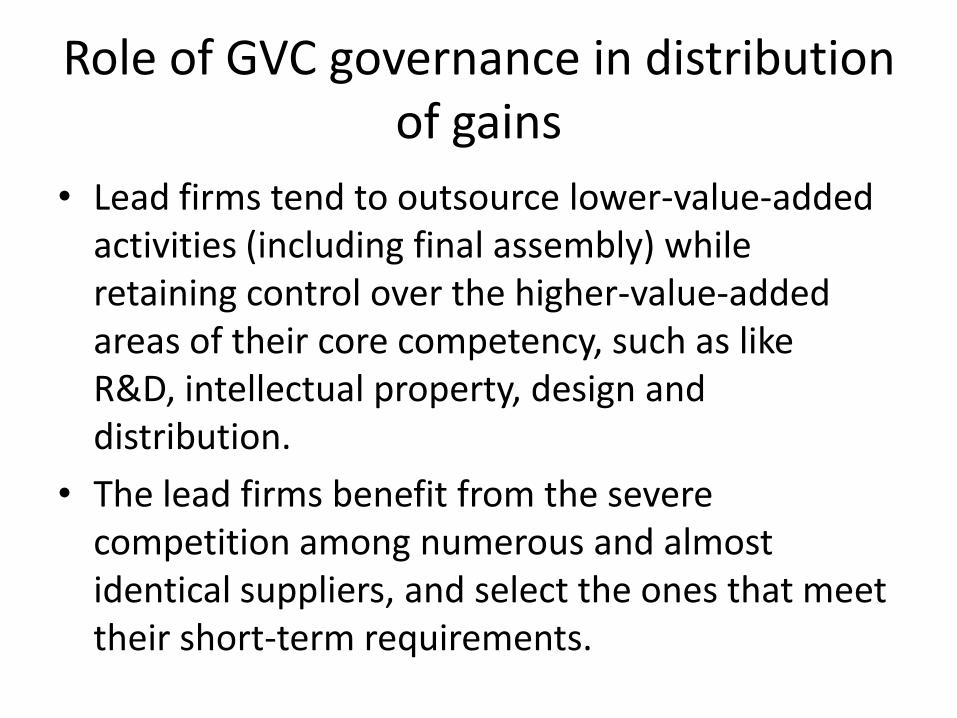
Role of GVC governance in distribution of gains
• Lead firms tend to outsource lower-value-added activities (including final assembly) while retaining control over the higher-value-added areas of their core competency, such as like R&D, intellectual property, design and distribution.
• The lead firms benefit from the severe competition among numerous and almost identical suppliers, and select the ones that meet their short-term requirements.

Role of GVC governance in distribution of gains
• Differences in market power and dependency relationships have a clear impact on the choice of governance regime in trade relationships. A powerful party can dictate governance mechanisms and distribution of gains.
• Local producers face obstacles to functional upgradation because such upgrading encroaches on their buyers' core competence: Brazil footwear, Taiwan AsusTek

Low entry barriers for manufacturing but high barriers for non-tangible
activities
• Manufacturing has low barrier to entry, resulting in high competition. Given the competitive nature of the market at the lower ends of manufacturing increases the substitution possibilities and thus reduces the bargaining power of any one firm.
• In a world in which shifting competitive advantage leads to producers being forced out of the market, it is not surprising that manufacturing tasks generate the least valued added in a GVC.
• Thus just as barriers to entry in manufacturing are falling, so barriers to entry in branded marketing are increasing.
Implications of GVCs for trade policy and trade
negotiations

Trade policy challenges of GVCs
• Asymmetrical impact of trade policy measures on firms integrated in GVCs and those outside it.
• Tariffs
• Antidumping / countervailing / safeguard duties
• Rules of origin: value addition norms and cumulation

Issues relevant in GVC negotiations
• Like product (conceptual clarification)
• Tariff reduction / elimination (sectoralinitiative through the backdoor)
• Trade facilitation (Bali decision using GVC)
• Harmonisation of standard
• Trade remedies (conceptual clarity required)
• Rules of origin (conceptual clarity required)
• Services (higher liberlisation in some sectors)

Issues relevant in GVC negotiations
• Investments and competition (re-emergence of some of Singapore issues)
• Labour standards (Lamy panel recommendations)
• IPRs
• Agriculture subsidies (developed countries farm subsidies have squeezed efficient producers from GVCs

Thank You