trade policy review - world trade organization · trade policy review body trade policy review...
TRANSCRIPT

RESTRICTED
WT/TPR/S/314
27 April 2015
(15-2221) Page: 1/181
Trade Policy Review Body
TRADE POLICY REVIEW
REPORT BY THE SECRETARIAT
CANADA
This report, prepared for the tenth Trade Policy Review of Canada, has been drawn up by the WTO Secretariat on its own responsibility. The Secretariat has, as required by the Agreement establishing the Trade Policy Review Mechanism (Annex 3 of the Marrakesh Agreement Establishing the World Trade Organization), sought clarification from Canada on its trade policies and practices. Any technical questions arising from this report may be addressed to Angelo Silvy (tel: 022/739 5249), Denby Probst (tel: 022/739 5847), and Nelnan Koumtingue (tel: 022/739 6252). Document WT/TPR/G/314 contains the policy statement submitted by Canada.
Note: This report is subject to restricted circulation and press embargo until the end of the first session of the meeting of the Trade Policy Review Body on Canada. This report was drafted in English.

WT/TPR/S/314 • Canada
- 2 -
CONTENTS
SUMMARY ........................................................................................................................ 8 1 ECONOMIC ENVIRONMENT ........................................................................................ 12 1.1 Real Sector and structural reform ............................................................................... 12 1.2 Fiscal Policy ............................................................................................................. 17 1.3 Monetary and Exchange Rate Policy ............................................................................ 19 1.4 Balance of Payments ................................................................................................. 20 1.5 Developments in Trade .............................................................................................. 22 1.5.1 Merchandise Trade ................................................................................................. 22 1.5.1.1 Composition of Trade ........................................................................................... 22 1.5.1.2 Direction of trade ................................................................................................ 24 1.5.2 Trade in Services ................................................................................................... 26 1.6 Foreign Direct Investment ......................................................................................... 29 1.7 Outlook ................................................................................................................... 30 2 TRADE AND INVESTMENT REGIME ............................................................................ 32 2.1 General Framework .................................................................................................. 32 2.1.1 New Developments ................................................................................................ 33 2.2 Trade Policy Objectives ............................................................................................. 34 2.3 Trade Agreements and Arrangements .......................................................................... 37 2.3.1 Participation in the WTO ......................................................................................... 37 2.3.2 Regional and preferential agreements ....................................................................... 37 2.3.2.1 Reciprocal trade agreements ................................................................................. 38 2.3.2.2 Unilateral preferential regimes .............................................................................. 40 2.3.3 Other agreements and arrangements ........................................................................ 41 2.3.3.1 Trade with Australia and New Zealand .................................................................... 41 2.3.3.2 Anti-counterfeiting Trade Agreement ..................................................................... 41 2.4 Investment Regime .................................................................................................. 41 2.4.1 Investment Framework and Agreements ................................................................... 41 2.4.2 Investment Canada Act .......................................................................................... 41 2.4.3 Other Investment Restrictions ................................................................................. 43 2.4.4 Investment Promotion ............................................................................................ 44 3 TRADE POLICIES AND PRACTICES BY MEASURE ........................................................ 46 3.1 Measures Directly Affecting Imports ............................................................................ 46 3.1.1 Customs procedures and requirements ..................................................................... 46 3.1.2 Customs valuation ................................................................................................. 49 3.1.3 Rules of origin ....................................................................................................... 50 3.1.4 Tariffs .................................................................................................................. 51 3.1.4.1 Applied MFN rate ................................................................................................ 51 3.1.4.2 WTO bindings ..................................................................................................... 55 3.1.4.3 Preferential tariffs ............................................................................................... 55

WT/TPR/S/314 • Canada
- 3 -
3.1.4.4 Tariff remission ................................................................................................... 57 3.1.5 Other charges affecting imports ............................................................................... 58 3.1.5.1 The GST/HST and provincial sales taxes ................................................................. 58 3.1.5.2 Excise taxes and duties ........................................................................................ 59 3.1.5.3 Other provincial taxes .......................................................................................... 60 3.1.6 Import prohibitions, restrictions, and licensing ........................................................... 61 3.1.7 Anti-dumping, countervailing, and safeguard measures ............................................... 63 3.1.7.1 Anti-dumping and countervailing measures ............................................................. 63 3.1.7.2 Safeguards ........................................................................................................ 68 3.1.8 Standards and other technical requirements .............................................................. 69 3.1.9 Sanitary and phytosanitary requirements .................................................................. 71 3.2 Measures Directly Affecting Exports ............................................................................. 73 3.2.1 Export procedures and requirements ........................................................................ 73 3.2.2 Export taxes, charges, and levies ............................................................................. 74 3.2.3 Export prohibitions, restrictions, and licensing ............................................................ 75 3.2.4 Export support and promotion ................................................................................. 76 3.2.5 Export finance, insurance, guarantees ...................................................................... 77 3.3 Measures Affecting Production and Trade ..................................................................... 79 3.3.1 Business framework and Incentives .......................................................................... 79 3.3.1.1 Business framework ............................................................................................ 79 3.3.2 Incentives and subsidies ......................................................................................... 80 3.3.3 Competition policy and price controls ........................................................................ 82 3.3.3.1 Main regulatory and institutional framework ............................................................ 82 3.3.3.2 International Cooperation ..................................................................................... 84 3.3.3.3 Price Controls ..................................................................................................... 85 3.3.4 State trading, state-owned enterprises, and privatization ............................................. 86 3.3.4.1 Stated trading enterprises .................................................................................... 86 3.3.4.2 Federal Crown Corporations .................................................................................. 87 3.3.4.3 Other entities that operate with federal government participation ............................... 91 3.3.4.4 Provincial Crown corporations and government enterprises ....................................... 91 3.3.5 Government procurement ....................................................................................... 92 3.3.5.1 Overview ........................................................................................................... 92 3.3.5.2 Developments .................................................................................................... 93 3.3.5.3 Legal framework and process ................................................................................ 94 3.3.5.4 WTO GPA and other agreements ........................................................................... 96 3.3.6 Intellectual property rights ...................................................................................... 96 3.3.6.1 Overview ........................................................................................................... 96 3.3.6.2 Economic Policy Context ...................................................................................... 97 3.3.6.3 Use of the IP System ........................................................................................... 99 3.3.6.4 International Initiatives and WTO participation ...................................................... 100

WT/TPR/S/314 • Canada
- 4 -
3.3.6.5 The Patent System ............................................................................................ 103 3.3.6.6 Copyright ......................................................................................................... 104 3.3.6.7 The Trademark System ...................................................................................... 106 3.3.6.8 Geographical Indications .................................................................................... 106 3.3.6.9 IP Enforcement ................................................................................................. 107 4 TRADE POLICIES BY SECTOR ................................................................................... 109 4.1 Agriculture and fisheries .......................................................................................... 109 4.1.1 Overview ............................................................................................................ 109 4.1.2 Border measures ................................................................................................. 110 4.1.3 Domestic programmes .......................................................................................... 111 4.1.3.1 Business Risk Management (BRM) programmes ..................................................... 113 4.1.3.2 Other programmes ............................................................................................ 115 4.1.4 Export measures ................................................................................................. 116 4.1.5 Evolution of support and protection ........................................................................ 116 4.1.6 Selected sub-sectors ............................................................................................ 118 4.1.6.1 Wheat and barley .............................................................................................. 118 4.1.6.2 Milk and dairy products ...................................................................................... 119 4.1.6.3 Red meat and livestock industry .......................................................................... 121 4.1.7 Fisheries ............................................................................................................. 122 4.2 Mining and Energy .................................................................................................. 125 4.2.1 Policy developments ............................................................................................. 125 4.2.2 Energy ............................................................................................................... 127 4.2.2.1 Crude Petroleum ............................................................................................... 127 4.2.2.2 Natural Gas ...................................................................................................... 129 4.2.2.3 Electricity ......................................................................................................... 130 4.2.3 Minerals and Mining ............................................................................................. 131 4.2.3.1 Overview ......................................................................................................... 131 4.2.3.2 Trade .............................................................................................................. 131 4.2.3.3 Policy .............................................................................................................. 132 4.2.3.4 Sub-sectors ...................................................................................................... 133 4.3 Services ................................................................................................................ 134 4.3.1 Financial services ................................................................................................. 134 4.3.1.1 Overview ......................................................................................................... 134 4.3.1.2 Regulatory framework ....................................................................................... 136 4.3.1.3 Banking services ............................................................................................... 137 4.3.1.3.1 Commercial banks .......................................................................................... 137 4.3.1.3.2 Cooperative financial institutions ...................................................................... 139 4.3.1.4 Insurance services ............................................................................................ 140 4.3.1.5 Securities ........................................................................................................ 142 4.3.2 Postal and courier services .................................................................................... 144

WT/TPR/S/314 • Canada
- 5 -
4.3.3 Tourism .............................................................................................................. 145 4.3.3.1 Overview and developments ............................................................................... 145 4.3.3.2 Legal and Regulatory Framework ......................................................................... 147 4.3.3.3 Policy actions ................................................................................................... 149 4.3.3.4 GATS and FTA commitments ............................................................................... 150 4.3.4 Environmental services ......................................................................................... 150 4.3.4.1 Regulatory Aspects ............................................................................................ 151 4.3.4.2 Industry Structure ............................................................................................. 152 4.3.4.3 Sustainable Technologies ................................................................................... 154 REFERENCES ................................................................................................................ 156 5 APPENDIX TABLES .................................................................................................. 160
CHARTS Chart 1.1 Contribution to percent change in real GDP, 2009-14 .............................................. 13 Chart 1.2 Canadian dollar exchange rate and effective exchange rate (CERI), 2009-14 .............. 20 Chart 1.3 Canada current account and net financial flows, 2007-14 ......................................... 21 Chart 1.4 Merchandise trade by main HS sections, 2011 and 2014 .......................................... 24 Chart 1.5 Merchandise trade by main origin and destination, 2011 and 2014 ............................ 26 Chart 2.1 Imports by type of import regime, 2013 ................................................................ 37 Chart 3.1 Frequency distribution of MFN tariff rates, 2014...................................................... 53 Chart 3.2 Remission of taxes and duties, 2004-13 ................................................................ 58 Chart 3.3 GST/HST and provincial sales tax rates, December 2014 ......................................... 59 Chart 3.4 Anti-dumping investigations initiated by region, 2011-14 ......................................... 65 Chart 3.5 Countervailing duty investigations initiated by region, 2011-14 ................................. 65 Chart 3.6 Trade in technology-intensive services, 2009-13 ..................................................... 98 Chart 3.7 Charges for the use of intellectual property rights, 2005-13 ..................................... 99 Chart 4.1 Agriculture and agri-food system's contribution to GDP and employment, 2009 and 2012 ...................................................................................................................... 109 Chart 4.2 Trade of fish and fish products, 2011-14 ............................................................. 123 Chart 4.3 Oil production and trade, 2010-14 ...................................................................... 129 Chart 4.4 Gas production and trade, 2010-14 .................................................................... 130 Chart 4.5 Canada's mineral production by value, 2014 ........................................................ 131
TABLES Table 1.1 Main economic indicators, 2010-14 ....................................................................... 13 Table 1.2 Canada's Balance of Payments, 2011-14 ............................................................... 21 Table 1.3 Canada's international transactions in services by sector, 2011-14 ............................ 27 Table 1.4 Canada's international transactions in services by main partners, 2010-13 ................. 28 Table 1.5 International investment position by country, 2009-13 ............................................ 29
WT/TPR/S/314 • Canada
- 6 -
Table 1.6 International investment position by sector (North American Industry Classification System (NAICS)), 2009-13 ............................................................................. 30 Table 2.1 Government jurisdiction in Canada ....................................................................... 32 Table 2.2 Overview of Canada's FTAs, January 2015 ............................................................. 38 Table 2.3 Overview of new FTAs, 2011-15 ........................................................................... 39 Table 2.4 Investment Canada Act, 2011-14 ......................................................................... 42 Table 2.5 Investment Canada Act Statistics, 2011-14 ............................................................ 43 Table 2.6 Foreign Investment Restrictions, 2014 .................................................................. 44 Table 3.1 Timeframes for submission of pre arrival information by mode .................................. 46 Table 3.2 CBSA trade facilitation and border security programmes .......................................... 47 Table 3.3 Overview of preferential rules of origin criteria, 2014............................................... 50 Table 3.4 Structure of the MFN tariff schedule, selected yearsa ............................................... 51 Table 3.5 Summary analysis of MFN tariff, 2014 ................................................................... 53 Table 3.6 Tariff lines where applied rates exceed bound rates, 2014 ........................................ 55 Table 3.7 Canada's preferential tariffs, 2007 and 2014 .......................................................... 56 Table 3.8 Excise duty rates, December 2014 ........................................................................ 60 Table 3.9 Overview of some selected provincial taxes and mark ups, December 2014 ................ 61 Table 3.10 Main import restrictions and licensing requirements, 2014 ...................................... 62 Table 3.11 Main export prohibitions, restrictions and licensing, 2014 ....................................... 75 Table 3.12 Main TCS funding programmes and amount disbursed, 2010-14 .............................. 76 Table 3.13 EDC finance, insurance, and guarantee programmes (as of 30 September 2014) ....... 78 Table 3.14 Overview of corporations in Canada by type of control, 2009-12 ............................. 79 Table 3.15 Government Financing Programmes Listed by Canada Business Network, December 2014 ............................................................................................................... 80 Table 3.16 Activities of the Business Development Bank of Canada, by net income, 2011-14 ......................................................................................................................... 81 Table 3.17 Overview of subsidies notified to the WTO, 2013 ................................................... 82 Table 3.18 Overview of the Competition Act provisions .......................................................... 83 Table 3.19 Competition statistics, 2010/14 .......................................................................... 83 Table 3.20 International Agreements and Arrangements, December 2014 ................................ 85 Table 3.21 State-trading enterprises, 2014 .......................................................................... 86 Table 3.22 Crown Corporations, 2014 ................................................................................. 87 Table 3.23 Ten largest provincial crown corporations, 2012 Report .......................................... 92 Table 3.24 Federal and provincial government business enterprises, 2009-12 ........................... 92 Table 3.25 Overview of procurement by type, 2010-13.......................................................... 93 Table 3.26 Changes to procurement framework and notices, 2011-14 ..................................... 94 Table 3.27 Procurement by type of procedure, all contracts above Can$25,000, 2010-13 ........... 95 Table 3.28 National IP legislation and international agreements, December 2014 .................... 101 Table 4.1 Tariff rate quota levels and fill rates, 2008 and 2012 ............................................. 110 Table 4.2 Export subsidies: commitment levels and annual outlays, 2009-13 .......................... 116 Table 4.3 Canada's domestic support, 2009-11 .................................................................. 117

WT/TPR/S/314 • Canada
- 7 -
Table 4.4 Evolution of support and protection, 2008-13 ....................................................... 117 Table 4.5 Indicators for selected agricultural commodities, 2000-14 ...................................... 118 Table 4.6 Selected indicators of the Canadian dairy sector, 2008-13 ...................................... 119 Table 4.7 Overview of Canada's Crude Oil Industry, 2013 .................................................... 128 Table 4.8 Overview of Canada's Natural Gas Industry, 2013 ................................................. 129 Table 4.9 Overview of Canada's Electricity Industry, 2013.................................................... 130 Table 4.10 Trade of minerals and mineral products, by selected countries, 2011-14 ................ 132 Table 4.11 Financial institutions operating in Canada, 2010 and 2014 .................................... 135 Table 4.12 Main regulatory bodies of the banking sector ...................................................... 136 Table 4.13 Requirements upon incorporation or establishment of a branch or representative office ....................................................................................................... 137 Table 4.14 Provincial taxes on insurance premium, 2014 ..................................................... 142 Table 4.15 Provincial and territorial securities regulators...................................................... 143 Table 4.16 Tourism indicators, 2011-13 ............................................................................ 146 Table 4.17 Selected Tourism Related Legislation of the Provinces and Territoriesa .................... 148 Table 4.18 Market structure of environmental services, 2014 ............................................... 151 Table 4.19 Overview of Sustainable Technology Sub-sectors ................................................ 154
BOXES Box 2.1 Priority trade sectors ............................................................................................ 35
APPENDIX TABLES Table A1. 1 Canada's Balance of Payments, 2011-14 ........................................................... 160 Table A1. 2 Merchandise exports and re-exports by HS sections, 2011-14 .............................. 161 Table A1. 3 Merchandise imports by HS sections, 2011-14 ................................................... 162 Table A1. 4 Merchandise exports and re-exports by trading partner, 2011-14 ......................... 163 Table A1. 5 Merchandise imports by trading partner, 2011-14 .............................................. 165 Table A2. 1 Canada's Involvement in Dispute Settlement Cases, 1 January 2011-1 January 2015 ....................................................................................... 167 Table A2. 2 Selected Notifications to the WTO, 1 January 2011-1 January 2015 ...................... 169 Table A2. 3 List of beneficiaries of Canada's unilateral preference programmes as provided by Canada .................................................................................................................... 173 Table A3. 1 Canadian participation in conformity assessment agreements, 2014 ..................... 176 Table A4. 1 Main federal agricultural programmes............................................................... 178 Table A4. 2 Information sharing agreements concluded by OSFI with foreign supervisors (as of January 2015) ...................................................................................................... 180

WT/TPR/S/314 • Canada
- 8 -
SUMMARY
1. Canada has recovered well from the financial crisis and GDP growth has averaged 2.4% annually during the review period, 2011-14. Growth proceeded at a rate of 3% in 2011 but slowed to 2% and less during 2012-14, mainly due to weaker export growth and investment. Although growth during the period has not been comparable to pre-crisis levels, and is still below its potential rate, Canada's economy has generally shown resilience to external shocks. Growth in employment has lagged GDP growth, and the unemployment rate remains higher than pre-crisis levels, at approximately 6.9%. This also reflects an improvement in labour productivity, which in the past has lagged behind. While rich in natural resources, the Canadian economy is diversified with services and manufacturing also being significant contributors. The mining and energy sectors declined the most in the post-crisis period but gradually rebounded and showed strong growth, particularly since 2013.
2. Canada has been implementing Economic Action Plans (EAP) since 2009. These plans identify policy actions to be undertaken to overcome possible shortcomings, and aim to help spur the economy and create jobs, and promote prosperity. The 2014 EAP focused on balancing the budget, supporting jobs and growth, developing resources responsibly and supporting families and communities.
3. As a result of a prudent fiscal policy, Canada posted federal operational surpluses until the global financial crisis. During the crisis, Canada implemented a temporary stimulus plan aimed at fostering growth. After the stimulus was no longer necessary, efforts have been made to rebalance and eliminate the deficit by 2015-16. The main points of the rebalacing strategy have been: to control program spending, introduce measures to enhance the fairness of the tax systems, and set the right conditions to allow for economic growth. The gross operating balance deficit declined as a share of GDP to around 0.2% of GDP in 2013.
4. Canada has traditionally maintained a surplus in the current account of the balance of payments. However, since the financial crisis, the surplus has turned into a deficit, which has remained at around 3% of GDP during the review period. The contribution of net exports of goods and services to GDP growth was negative in 2011 and 2012, as imports expanded more rapidly than exports. This was reversed in 2013 and 2014, when import growth weakened, which led to a narrowing of the current account deficit in 2014.
5. During the review period, Canada's trade performance was marked by steady increases in imports and exports, both goods and services, with a significant increase in merchandise exports in 2014, turning the merchandise trade balance positive after it remained negative during the previous two years. Canada's merchandise trade is about five times the size of services trade, both for imports and exports. Canada has certain vulnerabilities with respect to trade, as it is heavily reliant on the United States as its major market and has a narrow export product base, mainly energy and mineral products, and transportation and vehicles. Despite attempts to diversify exports away from the United States, the share of exports actually increased during the period under review from 74% to 77% of total merchandise exports, and the share of imports from the United States also increased from 50% to 54% of total imports.
6. Canada's economy has long relied on its natural resource and mineral wealth. The mining and energy sectors are not only important to the Canadian economy in terms of GDP and employment, but also contribute significantly to exports and have a positive impact on its balance of payments. During the review period, the natural resource sector had a significant impact on trade and the economy mainly due to fluctuations in energy prices. The production and export of energy products generally rose steadily during the period, partially compensating for lower prices, but export volumes of natural gas declined slightly reflecting market situations in the United States, its sole export destination. In order to diversify exports of gas, Canada has launched several proposals, pending regulatory approval, for the development of LNG export facilities. Policy developments in the sector during the period include increased intergovernmental collaboration, enhanced efforts to consult with Aboriginal communities, and new legislation on transparency and reporting requirements.
7. Building upon the success of its 2007 Global Commerce Strategy, Canada launched its Global Markets Action Plan (GMAP) in 2013 as a strategic plan to prioritize markets and support

WT/TPR/S/314 • Canada
- 9 -
commercial success in trade. In particular, the GMAP sets priorities and objectives for trade initiatives and trade promotion activities, and contains a pro-trade and investment plan. Further, it prioritizes 22 sectors where Canada has a strong competitive advantage and plans to develop strategies to help these sectors grow.
8. In the trade area, Canada has focused its policies on expanding markets for its businesses mainly through the negotiation of reciprocal free trade agreements, including prioritising FTAs with a major economic impact and modernising existing FTAs. During the review period, five new FTAs have entered into force; with the Republic of Korea, Colombia, Honduras, Jordan, and Panama. Another agreement, with the EU, was completed in mid-2014 but has not entered into force yet. Most of Canada's trade is conducted under a preferential scheme: approximately 61% of Canada's annual imports receive preferential treatment pursuant to a free trade agreement. NAFTA partners account for the vast majority of FTA imports, with the other 10 agreements together accounting for less than 2% of FTA imports.
9. Canada's framework for foreign direct investment has remained broadly unchanged during the review period and its 1985 Investment Canada Act is still the main legislation governing investment. The Act requires notification or review of foreign investments to assess if they bring benefits to Canada and are not likely to injure national security. Changes to the Act introduced during the period under review focused on provisions related to state-owned enterprises (SOEs), in particular a definition for SOEs and guidelines on how SOEs are assessed under the Act. Certain investment restrictions remain in place in some sectors, including fishing, mining, oil sands, air transport, publishing, broadcasting, film distribution, and telecommunications. During the review period some of these restrictions were relaxed. For instance amendments to the Telecommunications Act partially liberalized foreign investment restrictions for telecom companies with a market share of 10% or less. Through GMAP, Canada has placed emphasis on pursuing more foreign investment promotion and protection agreements where there is potential for economic growth and interest to Canadian investors. Despite efforts to improve the framework to encourage more direct investment, FDI inflows grew but remained modest, and were outpaced by FDI outflows during the review period.
10. In terms of customs procedures, the laws and the system in place for the clearance of goods has not undergone any major changes since 2011 except with respect to some provisions on the seizure of goods and the further development of the Advance Commercial Information (ACI) program. Canada has, however, taken steps to further facilitate trade through its Release Prior to Payment program for a quicker release of goods, and through other programs that allow qualified importers to benefit from more efficient border processes, such as the Partners in Protection (PIP), the Customs Self-Assessment (CSA), and the Free and Secure Trade (FAST) programs.
11. Canada's import tariff regime remained nearly unchanged since the last review, as the average applied tariff for agriculture products stayed at 22.5% during the period, while the average tariff for non-agricultural products declined slightly from 2.5% to 2.4%. Over two-thirds of Canadian tariff lines have zero duties; the application of non-zero rates is concentrated in a few areas, including agriculture, in particular dairy products, as well as clothing, and footwear. During the review period, Canada has undergone a tariff simplification process, harmonizing many duties within three ranges of tariffs, including the elimination of nuisance tariffs of less than 5%. Furthermore, a number of autonomous liberalization initiatives were undertaken in certain sectors such as machinery and equipment, baby clothes, sports equipment, and offshore drilling units.
12. Canada continued to use anti-dumping and countervailing duty measures at an accelerated pace during the review period, as there were 43 initiations of anti-dumping investigations during the period, with a peak of 17 in 2013, and 21 initiations of countervailing duty investigations, during the period, with a peak of 12 in 2014. The majority of investigations involved countries from Asia. During the period under review, there have been no major changes to Canadian legislation for anti-dumping or contingency measures' investigations. While Canada maintains safeguard legislation, there were no changes to its legal framework and no investigations launched during the review period.
13. There have been several key changes in the area of sanitary and phytosanitary measures (SPS) including amendments to the Food and Drugs Act (FDA) and the new Safe Food for Canadians Act (SFCA). FDA amendments give authorizations for the use of specific substances in foods (e.g. food additives) and health/nutrition claims for foods under certain conditions, and also

WT/TPR/S/314 • Canada
- 10 -
provide for an expanded authority to incorporate technical and non-technical standards, methods, guidelines or other documents, into marketing authorizations or into the Food and Drug Regulations. The 2012 Safe Food for Canadians Act (SFCA) aims at stronger food safety rules and more consistent and effective inspection, and provides for increased penalties for non-compliance. It consolidates and replaces existing food legislation, except the FDA; its full entry into force remains pending pursuant to the issuance of implementing regulations.
14. Canada's government procurement includes federal and provincial procurement, with provincial purchases slightly larger than federal purchases at approximately Can$20 billion per year compared to Can$15 billion per year for the federal government. There have been a few changes to Canada's federal government procurement framework during the review period, including new contracting limits for certain federal agencies, new reporting measures, and updates to threshold limits pursuant to FTA provisions. In April 2014, the revised GPA came into force for Canada. At the federal level, there have been no substantial changes in Canada's schedule, however significant changes occurred at the sub-federal level whereby all provinces and territories and 10 federal crown corporations are now included.
15. Canada has a well-developed intellectual property protection (IP) regime. During the review period, a number of IP developments have occurred in its domestic legislative activity as well as in its international trade policy. Since 2011, Canada has ratified two, and initiated accession to five international IP treaties, and has adopted or introduced a number of legislative changes to its IP regime, in particular the Copyright Modernization Act in 2012. In addition, there were a number of court cases related to IP matters, including a number of Supreme Court of Canada decisions on copyright. Use of the Canadian IP system by nationals and foreigners has remained stable over the review period.
16. Canada maintains an overall open economy but does provide support in the form of subsides and incentives at the federal, provincial and local levels. Some 755 support programs provide assistance to businesses in the form of grants, loan guarantees, tax refunds and credits, and wage subsidies. Special financing programs are offered by the Business Development Bank of Canada and by Industry Canada for certain sectors including aerospace and defence and small businesses. Canada has notified 58 subsidy programs in its latest subsidy notification to the WTO. The State is also involved in SOEs in Canada, known as Crown corporations, owned by federal or provincial governments; their operations are significant, with federal crown corporations accounting for approximately 0.7% of GDP and provincial crown corporations accounting for 2.7% of GDP. Furthermore, Canada maintains 3 federal and 13 provincial state trading enterprises.
17. Canada maintains export duties on softwood lumber and unstamped domestically-manufactured tobacco products, as well as export controls or licensing on a specific list of controlled goods, mostly military and strategic goods. In addition, certain products exported to certain markets may be restricted or require a licence, such as certain forestry products in unprocessed form are limited to promote further processing in Canada.
18. Canada's agriculture and agri-food sector remains a key sector of the economy, and accounted for 6.2% of GDP in 2012. Canada's large agricultural production exceeds domestic demand, thus international trade is critical and Canada is an important trader of agricultural products, in particular field crops such as wheat, barley, and oilseeds. Canada continues to use tariff rate quotas on 22 product groups, mainly in the dairy, grains, and meat sub-sectors. The use and administration of TRQs has been relatively constant during the review period. Domestic policy and programmes are guided by the current policy framework, Growing Forward Framework Agreement 2 covering 2013-18, including a Can$3 billion investment by federal, provincial, and territorial governments with an emphasis on programs that promote innovation, competitiveness, and market developments. Canada's WTO export subsidy reduction commitments apply to 11 product groups and for the marketing year running from August 2011 to July 2012 they declined by 2.3% to Can$88.3 million, representing approximately 0.14% of agricultural exports.
19. Canada's financial sector remains strong and has been credited with helping Canada emerge rapidly from the global economic crisis. The banking industry is relatively concentrated with the six largest banks accounting for approximately 90% of total assets among Canada's federally-regulated institutions. Foreign financial services providers must establish a commercial presence in Canada in order to carry out business. Canada revised its Capital Adequacy Requirements Guidelines in 2012 to implement the Basel III framework, and as of early 2014 it

WT/TPR/S/314 • Canada
- 11 -
fully implemented the Basel III capital rules on an accelerated basis and implemented the leverage ratio in advance of international timelines. Further, Canadian banks remain above the supervisory target capital ratios.
20. Services in general remain the backbone of the Canadian economy accounting for 70% of GDP during the period 2011-14. The tourism industry is an important services sector, accounting for approximately 2% of GDP and 1.4% of total investment in Canada; it also contributes significantly to employment, especially for small and medium sized enterprises. Tourism is also Canada's most important services export with tourism revenue from foreign travellers amounting to Can$16.4 billion in 2013. In 2011, Canada created a Federal Tourism Strategy to provide a government-wide approach for the tourism sector, positioning it for long-term growth and competitiveness. Environmental services is another important services sector for Canada with 2012 sales of environmental services amounting to Can$2.3 billion of which environmental consulting services was the largest. Canada has recognised the importance of the environmental and sustainable technologies sector, having prioritized it under GMAP, and also seeking to further liberalize trade in this area pursuant to negotiations on environmental goods.

WT/TPR/S/314 • Canada
- 12 -
1 ECONOMIC ENVIRONMENT
1.1 Real Sector and structural reform
1.1. Canada emerged rapidly from the global economic crisis in part due to timely macroeconomic policies, including monetary and fiscal stimulus, and its strong banking sector.1 Since emerging from the global economic crisis, the Canadian economy has fared relatively well, with positive economic growth, and growing imports and exports. Canada was the world's 11th largest economy in 2013.2 In 2014, nominal GDP reached Can$1.98 trillion and real GDP growth rates averaged 2.4% during the review period, 2011-14. Growth has not been comparable to pre-crisis levels, Canada's performance has outpaced many other developed countries post crisis, and the economy has been resilient to external shocks. Canada ranks as the world's 13th largest merchandise exporter and the 11th largest importer. Trade has increased post-crisis, but it remains subdued, in part due to weaknesses in Canada's main export markets.
1.2. Rich in natural resources, the Canadian economy is diversified with services, manufacturing, and the extraction3 industries being dominant. In terms of trade, Canada's exports, both in terms of destination and products, are heavily concentrated on one market, the United States, and a few products, mainly oil and gas, automotive products, and agriculture.
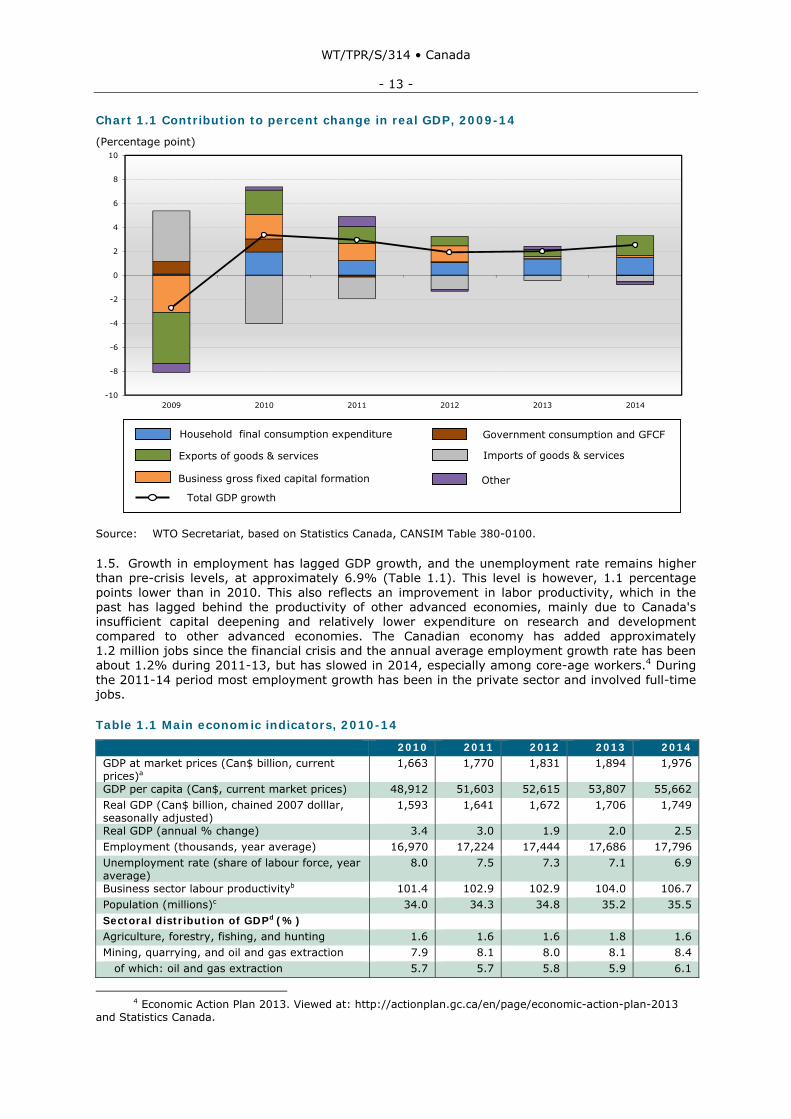
1.3. The growth of the Canadian economy during 2011-14 has been positive in each year, fluctuating between 1.9% and 3%, as a result of the varying performance of in its main contributors over the period (Chart 1.1 and Table 1.1). There has been uneven growth in some GDP components, exports and business investment in particular. Business investment growth was strong in the early part of the review period (2011-12), expanding at annual rates above 7% in both years, but it has tapered off since 2013, to growth rates below 1%. Private consumption growth was slower than GDP growth in 2011 and 2012, but accelerated in 2013 and 2014, when it was the main supporter of growth; however, this has led to an increase in household debt. The contribution of net exports of goods and services to growth was negative in 2011 and 2012, as imports expanded more rapidly than exports. This, however, was reversed in 2013 and 2014, when import growth weakened, particularly on account of a decline in imports of services.
1.4. With respect to the growth performance of the different economic sectors, the share of GDP of the different sectors has remained relatively stable over the period. The main exceptions to this have been the manufacturing and mining sectors. Manufacturing lost some share of GDP between 2011 and 2013, but has picked up slightly in 2014. The mining, oil, and gas sectors declined the most in the post-crisis period but gradually rebounded and showed strong growth, particularly since 2013 (Table 1.1).
1 OECD (2012). 2 World Bank, Gross Domestic Product ranking 2013, online information. Viewed at:
http://databank.worldbank.org/data/download/GDP.pdf. 3 Mining, quarrying, oil and gas extraction.
WT/TPR/S/314 • Canada
- 13 -
Chart 1.1 Contribution to percent change in real GDP, 2009-14
(Percentage point)
-10
-8
-6
-4
-2
0
2
4
6
8
10
2009 2010 2011 2012 2013 2014
Household final consumption expenditure Government consumption and GFCF
Exports of goods & services Imports of goods & services
Business gross fixed capital formation
Total GDP growth
Other
Source: WTO Secretariat, based on Statistics Canada, CANSIM Table 380-0100.
1.5. Growth in employment has lagged GDP growth, and the unemployment rate remains higher than pre-crisis levels, at approximately 6.9% (Table 1.1). This level is however, 1.1 percentage points lower than in 2010. This also reflects an improvement in labor productivity, which in the past has lagged behind the productivity of other advanced economies, mainly due to Canada's insufficient capital deepening and relatively lower expenditure on research and development compared to other advanced economies. The Canadian economy has added approximately 1.2 million jobs since the financial crisis and the annual average employment growth rate has been about 1.2% during 2011-13, but has slowed in 2014, especially among core-age workers.4 During the 2011-14 period most employment growth has been in the private sector and involved full-time jobs.
Table 1.1 Main economic indicators, 2010-14
2010 2011 2012 2013 2014GDP at market prices (Can$ billion, current prices)a
1,663 1,770 1,831 1,894 1,976
GDP per capita (Can$, current market prices) 48,912 51,603 52,615 53,807 55,662 Real GDP (Can$ billion, chained 2007 dolllar, seasonally adjusted)
1,593 1,641 1,672 1,706 1,749
Real GDP (annual % change) 3.4 3.0 1.9 2.0 2.5 Employment (thousands, year average) 16,970 17,224 17,444 17,686 17,796 Unemployment rate (share of labour force, year average)
8.0 7.5 7.3 7.1 6.9
Business sector labour productivityb 101.4 102.9 102.9 104.0 106.7 Population (millions)c 34.0 34.3 34.8 35.2 35.5 Sectoral distribution of GDPd (%) Agriculture, forestry, fishing, and hunting 1.6 1.6 1.6 1.8 1.6 Mining, quarrying, and oil and gas extraction 7.9 8.1 8.0 8.1 8.4 of which: oil and gas extraction 5.7 5.7 5.8 5.9 6.1
4 Economic Action Plan 2013. Viewed at: http://actionplan.gc.ca/en/page/economic-action-plan-2013
and Statistics Canada.

WT/TPR/S/314 • Canada
- 14 -
2010 2011 2012 2013 2014Utilities 2.5 2.5 2.4 2.5 2.4 Construction 7.0 7.0 7.3 7.3 7.2 Manufacturing 10.8 10.8 10.8 10.5 10.6 Services 70.3 70.0 69.9 69.8 69.8 Wholesale and retail trade 10.7 10.9 10.8 10.9 11.0 Transport and warehousing 4.2 4.2 4.1 4.1 4.2 Finance and insurance 6.6 6.6 6.6 6.7 6.8 Real estate, renting and leasing and management of companies
12.3 12.4 12.4 12.5 12.6
Health care and social assistance 6.9 6.9 6.8 6.8 6.8 Public administration 7.2 7.1 7.0 6.8 6.7 Other services 22.4 21.9 22.2 22.0 21.7 Federal Government operations (Can$ million)
Gross operating balance -30,752 -22,352 -8,124 -3,203 -708e Revenue 231,913 244,185 253,912 263,206 202,881e Taxes 196,396 207,122 214,701 221,683 169,628e Taxes on income, profits and capital gains 150,684 160,165 166,388 171,601 130,299e Taxes on goods and services 42,285 43,274 44,425 46,016 36,003e Taxes on international trade and transactions
3,427 3,683 3,888 4,066 3,326e
Social contributions 17,366 18,619 20,142 21,674 19,234e Grants, revenue 1,069 1,210 1,279 1,300 956e Other revenue 17,082 17,234 17,790 18,549 13,063e Expense 270,961 275,323 271,303 275,886 210,824e Compensation of employees 37,705 39,618 39,064 40,429 29,557e Use of goods and services 21,789 21,853 21,431 21,278 16,206e Interest expense 27,572 28,225 26,547 25,601 18,213e Subsidies 5,563 5,621 5,100 4,750 3,234e Grants, expense 84,088 84,709 81,186 84,328 66,772e Social benefits 71,012 71,924 74,204 75,625 58,174e Other expense 14,936 14,587 14,504 14,398 11,433e GDP by expenditures (% change) Final consumption expenditure 3.2 1.9 1.7 1.9 2.0 Household final consumption expenditure 3.5 2.2 1.9 2.5 2.8 Goods 3.1 1.5 1.4 2.8 3.4 Services 3.7 2.8 2.3 2.3 2.2 Non-profit institutions serving households' final consumption expenditure
-0.8 6.5 2.3 1.6 1.3
General governments final consumption expenditure
2.7 0.8 1.2 0.4 0.3
Gross fixed capital formation 11.5 4.8 4.8 0.4 0.4 Business gross fixed capital formation 11.7 7.9 7.0 0.8 0.9 Non-profit institutions serving households' gross fixed capital formation
6.9 0.2 4.8 0.4 0.2
General governments gross fixed capital formation
10.5 -7.1 -4.8 -1.6 -2.3
Investment in inventories 91.1 2,513.9 -31.8 66.3 -39.9 Of which: business investment in inventories 91.1 2,513.9 -31.8 66.4 -39.9 Exports of goods and services 6.9 4.6 2.6 2.0 5.4 Exports of goods 8.4 5.0 2.3 2.1 6.0 Exports of services -0.3 2.8 4.6 1.7 2.3 Less: imports of goods and services 13.6 5.7 3.7 1.3 1.7 Imports of goods 14.0 5.9 3.1 1.9 2.4 Imports of services 12.1 4.7 6.2 -1.3 -1.3 Statistical discrepancy 120.5 -58.4 93.7 -131.4 -117.3 Gross domestic product at market prices 3.4 3.0 1.9 2.0 2.5

WT/TPR/S/314 • Canada
- 15 -
2010 2011 2012 2013 2014Monetary aggregatesf (Average % change) M1+ 11.2 7.7 9.7 8.1 7.5 M1++ 13.3 8.7 9.7 8.4 7.4 Prices and interest rates CPI (average % change) 1.8 2.9 1.5 0.9 1.9 Core CPI (average % change)g 1.7 1.7 1.7 1.2 1.8 Overnight rate (policy instrument) (%) 0.6 1.0 1.0 1.0 1.0 90-day commercial paper (%) 0.8 1.2 1.2 1.2 1.2 Canadian dollar effective exchange rate index (CERI)h
116.9 120.3 120.0 117.2 109.8
Real effective exchange rate (consumer prices, 2010=100)
100.0 102.0 101.7 98.4 92.1
Real effective exchange rate (unit labor cost, 2010=100)
100.0 102.5 101.3 98.5 92.8
Can$ per US$ (period average) 1.0299 0.9891 0.9996 1.0299 1.097 a Current account balance (percentage of GDP) -3.5 -2.7 -3.3 -3.0 -2.2 Trade in goods and services (percentage of GDP)
60.0 62.3 62.3 62.0 64.0
a Seasonally adjusted at annual rates. b Labour productivity is a measure of real gross domestic product (GDP) per hour worked. c Population estimate for the whole year 2014. d According to the North American Industry Classification System (NAICS), 2002; the shares are
based on seasonally adjusted GDP at basic prices, in chained 2007 dollars. e January - September 2014. f Gross M1 is currency outside banks plus personal checking accounts plus current accounts plus some
adjustments to M1; M1++ is M1+ plus non-chequable notice deposits held at chartered banks, trust and mortgage loan companies, and credit unions/caisses populaires less interbank non-chequable notice deposits plus continuity adjustments.
g Excludes eight most volatile items and indirect taxes. h The Canadian-dollar effective exchange rate index (CERI) is a weighted average of bilateral
exchange rates for the Canadian dollar against the U.S. dollar, the European Union euro, the Japanese yen, the U.K. pound, the Chinese yuan, and the Mexican peso.
Source: Statistics Canada, CANSIM Tables 380-0064, 282-0087, 383-0008, 051-0001, 379-0031, 385-0032; IMF, World Economic Outlook (WEO) October 2010; Bank of Canada, Banking and Financial Statistics, December 2010, and other online information. Viewed at: http://www.bankof canada.ca/en/graphs/a1-table.htm and http://www.bank-banque-canada.ca/pdf/wfs.pdf. Department of Finance (2006), Fiscal Reference Tables. Viewed at: http://www.fin.gc.ca/frt-trf/2010/frt-trf-10-eng.asp.
1.6. Canada has been implementing Economic Action Plans (EAP) since the global recession in 2009. The authorities consider that the implementation of these plans, which identify policy actions to be undertaken to make up for possible shortcomings, has allowed Canada to achieve a solid job creation record, strong income growth, and a good economic performance.5 During the review period, Canada continued to adopt EAP in order to help spur the economy, create jobs, and promote prosperity. In 2012, the Plan focused on strengthening the immigration system to fill gaps in the labor market and improve needed skills. The 2013 EAP focused on creating a new infrastructure plan, investing in research and innovation, helping manufacturers and businesses succeed in the global economy, and connecting Canadians with available jobs. The particular subcomponents that have important trade and economic aspects include tax relief and cuts, the permanent elimination of tariffs on machinery and equipment and on industrial manufacturing inputs6, support to the forestry sector, enhancement of the Free Trade Zone policies and
5 Canada's Economic Action Plan online information. Viewed at:
http://actionplan.gc.ca/en/blog/economic-action-plan-2014. 6 Most of these tariffs were eliminated immediately in 2010, with the rest subject to a phase-out by
2015. The Government has continued to work with Canadians to identify additional such machinery and equipment and industrial inputs, with an additional package of 70 tariffs eliminated in 2011, and several additional tariffs in 2012 and 2014. House of Commons (2009 and 2010). Canada Gazette online information. Viewed at: http://www.gazette.gc.ca/rp-pr/p2/2011/2011-12-07/html/sor-dors260-eng.htmlf, 2011-3; and http://www.gazette.gc.ca/rp-pr/p2/2012/2012-10-10/html/sor-dors197-eng.html, http://www.gazette.gc.ca/rp-pr/p2/2013/2013-03-27/html/sor-dors43-eng.html; and http://www.gazette.gc.ca/rp-pr/p2/2014/2014-07-02/html/sor-dors156-eng.php.

WT/TPR/S/314 • Canada
- 16 -
programs, modernizing Canada's General Preferential Tariff regime7, and expansion of Export Development Canada's role in the credit market.
1.7. The 2014 Economic Action Plan focused on: (i) balancing the budget (see below); (ii) supporting jobs and growth; (iii) developing resources responsibly, conserving Canada's natural heritage and investing in infrastructure and transportation by supporting the mining, forestry and agriculture sectors; investing in national parks and conservation initiatives; expanding tax support for clean energy; and making strategic investments in public infrastructure and transportation services; and (iv) supporting families and communities. With respect to the goal of promoting employment, the EAP suggests different policies to achieve this, including connecting Canadians with available jobs and helping them to acquire the skills needed to get them hired or help them get better jobs; ensuring training reflects labor market needs8; launching new Labor Market Agreements for Persons With Disabilities9; fostering innovation, job creation and trade, and improving productivity10; measures to improve competitiveness including through training and monitoring of enterprises.11 Regarding the objective of developing resources responsibly, and investing in infrastructure and transportation by supporting the mining, forestry and agriculture sectors, the Government committed to: provide Can$28 million over two years to the National Energy Board for comprehensive reviews of project applications and to support the Participant Funding Program; eliminate tariffs on mobile offshore drilling units used in offshore oil and gas exploration and development; provide Can$66.1 million over two years to renew the Atlantic Integrated Commercial Fisheries Initiative and the Pacific Integrated Commercial Fisheries Initiative; support mineral exploration by junior companies by extending the 15% Mineral Exploration Tax Credit for flow-through share investors for an additional year; provide Can$90.4 million over four years to continue to support the Investments in Forest Industry Transformation program; provide Can$18 million over four years for early intervention to prevent the spread of spruce budworm in Atlantic Canada and Quebec; and expand the types of farming livestock that qualify for tax deferral on sale by farmers dealing with extreme weather conditions.12
1.8. With respect to the goal of investing in infrastructure and transportation, the EAP 2014 committed: Can$165 million over two years on a cash basis to advance the construction of a new bridge for the St. Lawrence; Can$378 million over two years on a cash basis to advance the repair and maintenance of federal bridges in the Greater Montreal Area; Can$58 million over two years to support the continued operation of the Digby, Nova Scotia–Saint John, New Brunswick, Wood Islands, Prince Edward Island–Caribou, Nova Scotia, and Îles de la Madeleine, Quebec–Souris, Prince Edward Island ferry services; Can$40 million over two years on a cash basis to accelerate repair and maintenance work at small craft harbours across Canada; and Can$33 million over two years to support the divestiture of regional ports.13
7 The General Preferential Tariff (GPT) changes announced in Economic Action Plan 2013 went into
effect on 1 January 2015. 8 To this end, it was decided to launch the Canada Job Grant, to be implemented between the federal
Government of Canada and the provinces and territories. The Government also decided to renegotiate the Can$1.95-billion-per year Labor Market Development Agreements to reorient training toward labor market demand. See. Economic Action Plan 2014 online information. Viewed at: http://actionplan.gc.ca/en/blog/economic-action-plan-2014.
9 As announced in EAP 2013, the Government will provide, as of 2014 Can$222 million annually, matched by the provinces and territories, over the next four years, through a new generation of Labour Market Agreements for Persons with Disabilities. The new agreements will engage employers and disability community organizations to better meet the needs of persons with disabilities and employers.
10 To this end, the Government announced and implemented a number of targeted measures that support advanced research and innovation, reduce red tape and help Canadian businesses become more competitive. These include: creating the new Canada First Research Excellence Fund with Can$1.5 billion in new funding over the next decade to help Canadian post-secondary institutions excel globally in research areas that create long-term economic advantages for Canada; providing an additional Can$500 million over two years to the Automotive Innovation Fund, to support significant new strategic research and development projects and long-term investments in the Canadian automotive sector; and continuing to reduce the tax compliance and regulatory burden for small and medium-sized businesses and other tax filers.
11 Budget Canada online information. Viewed at: http://www.budget.gc.ca/2014/docs/bb/brief-bref-eng.html.
12 Budget Canada online information. Viewed at: http://www.budget.gc.ca/2014/docs/bb/pdf/brief-bref-eng.pdf.
13 Budget Canada online information. Viewed at: http://www.budget.gc.ca/2014/docs/bb/pdf/brief-bref-eng.pdf.
WT/TPR/S/314 • Canada
- 17 -
1.9. Regarding the goal of supporting families and communities, some of the measures contemplated in the EAP 2014 include taking action to support and protect Canadian consumers by reducing taxes and tariffs, ensuring marketplace fairness, promoting competition in a number of industries (including financial services, telecommunications and air services), and improving product and food safety. With respect to measures to improve competition in the telecommunications market, EAP 2014 proposes capping wholesale domestic wireless roaming rates; providing telecommunications regulators with the power to impose administrative monetary penalties on companies that violate rules such as the Wireless Code; improving access to broadband in Rural and Northern Communities; investing Can$305 million over five years to extend and enhance broadband Internet service in rural and Northern communities; and legislating against unjustified cross-border price discrimination. Regarding the goal of strengthening food safety, EAP 2014 invests Can$390 million to this end. With respect to financial products and services, EAP 2014 advances the Government’s commitment to protect consumers by: engaging on developing a comprehensive financial consumer code that will better protect consumers; ensuring banks offer low-cost basic banking services that meet consumers’ banking needs; helping lower the costs that merchants pay to accept credit cards, while encouraging merchants to lower prices for consumers.
1.10. Furthermore, EAP 2014 announced the permanent elimination of tariffs on Mobile Offshore Drilling Units (MODUs).14 The Government enacted a moratorium on customs duties on temporarily imported MODUs, a moratorium that was extended in 2009.
1.11. In 2014, significant reforms to the Temporary Foreign Worker Program, and the Canada Job Bank supported the Government's work to connect Canadians with available jobs and strengthen the labor market.
1.2 Fiscal Policy
1.12. As a result of a prudent fiscal policy, Canada posted federal operational surpluses until the global financial crisis. After the onset of the global economic and financial crisis, Canada implemented a temporary stimulus plan with a medium term plan aimed at eliminating the federal deficit as the economy recovered, by 2015-16.15 The gross operating balance posted a deficit of 1.8% of GDP in 2010; this deficit has been declining as a share of GDP in each of the following years, to some 0.17% of GDP in 2013. The medium-run strategy relies on controlling government spending, including federal wage costs, and not raising taxes. As of 2014, the path towards reaching a balanced budget was underway and on target, thus no further changes in fiscal policy were envisioned.16
1.13. The main points of the strategy have been: controlling program spending; introducing measure to enhance the fairness of the tax systems, and setting the right conditions to allow for growth. Since EAP 2010, the Government has controlled direct program spending through targeted savings actions and broad-based reviews focused on reducing spending without compromising the delivery of priority services to Canadians. Taking into account the new measures in EAP 2014, direct program spending is projected to remain broadly in line with the 2010–11 level through to 2018–19. The authorities note that, in fact, direct program spending has declined for three consecutive years, a trend that had not been observed in decades.17 The exception to this are federal transfers to individuals that provide income support, and transfers to other levels of government, including those for social programs and health care, which are expected to continue to grow through to 2018–19.
1.14. The Government of Canada expects to return to balanced budgets in 2015-16. The authorities estimate a surplus of Can$6.4 billion in 2015–16, after taking into account a Can$3.0 billion annual adjustment for risk. Economic Action Plan 2014 announced a number of measures to further reduce spending and make adjustment to tax collection. These include: a transition from the current situation where the Government pays 75% of benefit costs to equal
14 House of Commons (2014a); and House of Commons (2014b). 15 IMF (2011). 16 IMF (2013) and Economic Action Plan 2013. Viewed at: http://actionplan.gc.ca/en/page/economic-
action-plan-2013 and Statistics Canada. 17 Budget Canada online information. Viewed at: http://www.budget.gc.ca/2014/docs/bb/pdf/brief-bref-
eng.pdf.

WT/TPR/S/314 • Canada
- 18 -
cost sharing for retired federal employees who choose to participate in the Public Service Health Care Plan, as well as an increase in the minimum years of service required to be eligible for the plan; and entering into negotiations with collective bargaining agents to reform the disability and sick leave management system. It was expected that these savings measures, together with the adjustment of National Defence funding for major capital procurements would result in direct program spending in EAP 2014 remaining broadly in line with its 2010–11 level through 2018-19. In contrast, federal transfers to individuals that provide important income support and major transfers to other levels of government for social programs and health care would continue to grow over that horizon. These savings build on the previous actions taken to return to budgetary balance. The authorities have noted that, in total and since Budget 2010, the Government has announced savings that will reduce the deficit by more than Can$19 billion in 2015-16 and beyond, for a total of more than Can$117 billion in savings over the 2010–11 to 2018–19 period.18
1.15. The Government has also undertaken a number of measures to improve the fairness and integrity of the tax system. In this respect, since 2006, and including measures proposed in EAP 2014, the Government has introduced more than 85 measures to improve the integrity of the tax system. Measures taken in the framework of EAP 2014 to address international aggressive tax avoidance, improve tax integrity, strengthen tax compliance and enhance the fairness of the tax system are estimated to provide annual savings rising to Can$454 million in 2018–19, for a total of Can$1.8 billion from 2013–14 to 2018–19.19
1.16. The Government has undertaken a number of studies and considered how tariffs affect consumers, and as of 1 April 2013 through its budget legislation, permanently eliminated MFN applied customs duties on baby clothing and certain sports and athletic equipment.20 This represented Can$79 million in annual tariff relief, with the expectation that these savings would be passed on to consumers in the form of lower retail prices. Similar 2011 budget legislation introduced new tariff items to facilitate the processing of low value non-commercial imports arriving by post or courier, and simplified and consolidated the customs tariff to reduce customs processing burdens for importers.21
1.17. The federal debt-to-GDP (gross domestic product) ratio increased during the global financial crisis, from 28.2% of GDP in 2008/2009 to 33.2% in 2011-12, before starting to decline. In 2014/15, it is estimated at some 32% of GDP. The ratio is expected to continue declining in the next few years, to reach 27.0% in 2017–18, below its pre-recession low, putting the Government on its way towards achieving its target of 25% of GDP by 2021.
1.18. The authorities consider that balancing the budget and reducing debt are not an end to themselves, but a means to increase Canada's economic potential, to improve employment opportunities and increase the standard of living of Canadians. The authorities deem that the Government’s plan to return to balanced budgets ensures that tax revenue is used to support important social services rather than paying interest costs, preserves Canada’s low-tax plan and allows for further tax reductions, fostering growth and the creation of jobs. It also helps to keep interest rates low, and strengthens Canada's ability to respond to longer-term challenges, such as population aging and global economic shocks.22
1.19. As at March 2015, the 2015 Budget had not yet been approved. Its approval was delayed to April, at the earliest. The Government seems intent on delivering a balanced budget, even with the recent decline in crude oil prices. However, some of the projections made in EAP 2014, considering higher oil prices, could need to be revised.
18 Budget Canada online information. Viewed at: http://www.budget.gc.ca/2014/docs/bb/pdf/brief-bref-
eng.pdf. 19 Budget Canada online information. Viewed at: http://www.budget.gc.ca/2014/docs/bb/pdf/brief-bref-
eng.pdf. 20 House of Commons (2013c). 21 House of Commons (2011). 22 Ministry of Finance (2014), The Road to Balance: Creating Jobs and Opportunities. Economic Action
Plan 2014, the Budget in Brief, 11 February 2014. Viewed at: http://www.budget.gc.ca/2014/docs/bb/pdf/brief-bref-eng.pdf .

WT/TPR/S/314 • Canada
- 19 -
1.3 Monetary and Exchange Rate Policy
1.20. Canada's monetary policy is aimed at keeping a low and stable inflation rate. To this end, and to increase public accountability, the Federal Government and the Bank of Canada jointly announce an inflation-control target range. The inflation target is 2%, as measured by the consumer price index with a control range of 1% to 3% around this target. Inflation targeting has been in place in Canada since 1991. The Bank considers that by focusing on inflation the output gap between the potential and actual performance of the economy is kept as narrow as possible. The Bank of Canada carries out monetary policy by influencing short-term interest rates. It does this by raising and lowering the target for the overnight rate, which is the policy rate.23
1.21. Since the crisis, and following its mandate, the Bank of Canada has maintained an accommodative monetary policy. To this end, the Bank of Canada kept the policy interest rate stable at 1% throughout 2011-2014. In January 2015, the Bank of Canada lowered the target for the overnight rate to 0.75%.
1.22. Inflation remained low during the period, within the inflation target of 1-3% set by the Bank of Canada. Although there were concerns about inflation, it remained near the lower end of the control range during most of the period due to excess supply in the economy and competitiveness pressures in the retail sector.24
1.23. Canada maintains a freely floating exchange rate system with no restrictions on currency conversion and transfers for current international transactions. During the review period the Canadian dollar initially appreciated during 2010-12 as a consequence of strong demand for resource commodities, in particular energy commodities, and then continued to generally decline since 2013 as a result of that demand moderating and prices softening or even declining (Table A1.1 and Chart 1.2). According to the authorities, the Canadian dollar is expected to appreciate slightly in the medium term.
23 The overnight rate is the interest rate at which major financial institutions borrow and lend one-day
(or "overnight") funds among themselves; the Bank sets a target level for that rate. This target for the overnight rate is often referred to as the Bank's key interest rate or key policy rate. Changes in the target for the overnight rate influence other interest rates, such as those for consumer loans and mortgages. They can also affect the exchange rate of the Canadian dollar. Bank of Canada's online information. Viewed at: http://www.bankofcanada.ca/core-functions/monetary-policy/key-interest-rate/.
24 Bank of Canada, Annual Report 2013.

WT/TPR/S/314 • Canada
- 20 -
Chart 1.2 Canadian dollar exchange rate and effective exchange rate (CERI), 2009-14
80
90
100
110
120
130
140
0.8
1.0
1.2
1.4
1.6
Jan. 09 Jan. 10 Jan. 11 Jan. 12 Jan. 13 Jan. 14
Exchange noon spot rate average CERI
Can$ / US$ Index (1992=100)
Source: WTO Secretariat, based on Statistics Canada, CANSIM Table 176-0064.
1.4 Balance of Payments
1.24. Canada has traditionally maintained a surplus in the current account of the balance of payments. However, since the financial crisis, the surplus has turned into a deficit, which has remained at around 3% of GDP during the review period. While exports and imports have both grown, import growth has slightly outpaced export growth, contributing to the negative balance. The capital account and the trade balance has generally remained steady or unchanged. but the increased merchandise trade deficit , particularly related to consumer goods, as well as a slight increase in the services' trade deficit contributed to the deterioration of the current account in the early part of the period, which then improved at the end of the period when the merchandise trade balance turned positive in 2014 (Chart 1.3 and Table 1.2).

WT/TPR/S/314 • Canada
- 21 -
Chart 1.3 Canada current account and net financial flows, 2007-14
(Can$ billion)
-70
-60
-50
-40
-30
-20
-10
0
10
20
30
40
50
2007 2008 2009 2010 2011 2012 2013 2014
Balance on current account Balance on goods Balance on services
Balance on primary income Balance on capital account
Source: WTO Secretariat, based on Statistics Canada.
1.25. Canada's current account remained in deficit in 2014, despite the improvement in the merchandise trade balance. Non-energy exports have led the rebound, benefiting from the U.S. recovery and a weaker Canadian dollar.25
Table 1.2 Canada's Balance of Payments, 2011-14
(Can$ billion) Current account and capital account 2011 2012 2013 2014Current account balance -47.2 -59.9 -56.3 -43.5 Goods and services balance -21.2 -33.8 -30.2 -17.9 Exports of goods 456.6 463.1 479.3 528.6 Exports of services 84.4 90.0 92.5 95.2 Travel 16.6 17.4 18.2 19.3 Transportation 13.6 14.0 14.2 14.7 Other servicesa 54.1 58.6 60.1 61.2 Imports of goods 456.0 474.3 486.5 523.7 Imports of services 106.2 112.7 115.5 117.9 Travel 33.0 35.0 36.2 37.2 Transportation 23.7 23.7 24.0 24.7 Other servicesa 49.5 53.9 55.3 56.0 Primary income balance -23.1 -22.8 -24.2 -24.2 Primary income credit 69.3 73.6 75.2 81.4 Compensation of employees 1.2 1.2 1.2 1.3 Investment income 68.2 72.4 74.0 80.1 Primary income debit 92.4 96.4 99.4 105.7 Compensation of employees 3.1 3.2 3.3 3.4 Investment income 89.3 93.2 96.1 102.3 Secondary income balance -2.9 -3.3 -1.9 -1.4 Credits 9.8 9.7 11.5 11.9 Private transfersb 3.3 2.8 3.6 4.2 Government transfers 6.5 6.8 7.9 7.7
25 IMF (2014a).

WT/TPR/S/314 • Canada
- 22 -
Current account and capital account 2011 2012 2013 2014 Debits 12.7 13.0 13.4 13.3 Private transfersb 7.2 7.5 7.7 8.1 Government transfers 5.5 5.4 5.7 5.3 Balance on capital account 0.0 -0.1 -0.1 0.0 Credit 0.3 0.3 0.3 0.3 Debit 0.3 0.4 0.4 0.3 Net lending / net borrowing, from current and capital accounts -47.2 -60.1 -56.3 -43.5 Financial account balancec 54.0 59.2 55.7 36.6Net acquisition of financial assets 109.2 122.1 76.8 135.6 Canadian direct investment abroad 51.6 53.9 52.0 58.2 Canadian portfolio investment 18.3 35.1 29.3 56.4 Official international reserves 8.1 1.7 4.9 5.9 Other Canadian investment 31.2 31.3 -9.4 15.1 Net incurrence of liabilities 163.2 181.2 132.5 172.2 Foreign direct investment in Canada 39.3 39.2 72.7 59.6 Foreign portfolio investment 100.5 83.5 43.1 59.8 Other foreign investment 23.4 58.5 16.8 52.8 Net lending / net borrowing, from financial accountd -54.0 -59.2 -55.7 -36.6 Net errors and omissions -6.8 0.9 0.6 6.9
a Other services include both commercial services and government services. b Private transfers and other private transfers include the counterpart of adjustments for insurance
claims volatility made in the insurance services. c In the financial account, a plus sign denotes an increase in investment and a minus sign denotes a
decrease in investment. d A net lending is shown as a plus sign whereas a net borrowing is shown as a minus sign.
Source: Statistics Canada, Cansim Tables 376-0101 and 376-0102.
1.5 Developments in Trade
1.26. Canada has long relied on exports as a driving force of its economy. Reportedly, one in five jobs are either directly or indirectly dependent on exports.26 Canada is also heavily reliant on one major market and a narrow product base for its exports. Other vulnerabilities include fluctuations of world commodity prices, in particular the energy sector, whereby low crude oil prices in recent years have had a significant impact on the Canadian economy.27
1.27. According to the IMF, Canada has recognized the need to diversify exports away from the U.S. market. As such, Canada was encouraged to enter into new free trade agreements with a view to creating new market access opportunities to diversify exports.28
1.5.1 Merchandise Trade
1.5.1.1 Composition of Trade
1.28. During the period 2011-14, Canadian exports grew an average of 7% per year, with the largest gain of 12% in 2011, and significant growth of 11% in 2014. Export growth was relatively flat in 2012 and 2013 due to weak global trade and weak energy prices; in 2012, the value of energy exports actually declined slightly. The major exported products are mineral products (mainly energy), constituting 29% of exports in 2014, followed by vehicles and transport equipment (mainly automotive) with 15%, agriculture, 11%, and machinery and mechanical appliances, 10% (Chart 1.4 and Table A1.1). Mineral products, vehicles and transport equipment, and agricultural exports had gradual increases over the period, while machinery and mechanical appliance exports declined slightly. Regarding agricultural products, vegetable based food commodity products dominate, in particular wheat and rape seeds and oil, followed by animal
26 Global Markets Action Plan. Viewed at: http://www.international.gc.ca/global-markets-marches-mondiaux/index.aspx?lang=eng.
27 Economic Action Plan 2013. Viewed at: http://actionplan.gc.ca/en/page/economic-action-plan-2013 and Statistics Canada.
28 IMF (2013).

WT/TPR/S/314 • Canada
- 23 -
products and prepared foodstuffs. Most product categories exhibited small gains over the period 2011-14, in parallel with the overall export growth.
1.29. The performance of Canadian imports, with an overall growth of 15% during 2011-14, slightly under paced export growth thus contributing to a small narrowing of the trade deficit, in particular due to trade developments in 2014. Initially import growth outpaced export growth in the early part of the period 2011-14 which was however reversed in 2014. Imports are generally more concentrated than exports with four main HS categories dominating, in particular, machinery and mechanical appliances, and vehicles and transport equipment with 24% and 17% respectively, followed by mineral products (mainly energy), 11%, and chemicals, 8%. Despite being a major exporter of oil and gas, Canada's geography contributes to it being a significant importer as well. Production is concentrated in the western provinces of Alberta and Saskatchewan, which is nearly all exported to the United States. However, east coast domestic demand is generally met by imports. Vehicle and transport equipment is concentrated in the trade of automotive products. Agricultural imports are also significant, growing to over 8% of imports in 2014 (Chart 1.4 and Table A1.2).

WT/TPR/S/314 • Canada
- 24 -
Chart 1.4 Merchandise trade by main HS sections, 2011 and 2014
2011 2014
(a) Exports and re-exports
Total: Can$446,707 millions
(b) Imports
Total: Can$446,666 millions Total: Can$511,409 millions
Total: Can$524,495 millions
Precious metals5.9%
Base metals8.2%
Transport equipment
14.0%
Other18.7%
Vegetable products
4.4%
Chemical products
6.7%Plastics3.6%
Machinery10.4%
Plastics4.8%
Mineral products28.0%
Mineral products12.9%
Chemical products
8.4%
Base metals6.8%
Machinery24.3%
Other26.7%
Mineral products11.2%
Chemical products
8.4%
Plastics4.9%
Base metals7.0%
Machinery24.1%
Other27.0%
Vegetable products
4.9%
Mineral products29.2%
Chemical products
6.0%Plastics3.6%Precious
metals4.6%
Base metals7.1%
Machinery9.7%
Transport equipment
15.4%
Other19.5%
Transport equipment
16.1%Transport equipment
17.4%
Source: WTO Secretariat estimates, based on data from Statistics Canada.
1.5.1.2 Direction of trade
1.30. Despite attempts to diversify exports away from its major market, the United States, the share of exports to the United States actually increased during the period from 74% to 77% of total merchandise exports (Chart 1.5 and Table A1.3). The next largest markets are China (4%),
WT/TPR/S/314 • Canada
- 25 -
the United Kingdom (3%), and Japan (2%). Since 2011, exports to developed economies, notably Europe, declined, whereas exports to non-OECD countries have accelerated.29
1.31. As with exports, Canada's import trade is dominated by the United States, which increased its share from 50% of total imports in 2011 to 54% of total imports in 2014 (Chart 1.5 and Table A1.4). Other significant import sources are China (12%), Mexico (6%), and Germany (3%). Imports from most regions declined slightly (Europe, CIS, Africa, Middle East) while slight gains were achieved from the Americas, due to the United States, and Asia (Chart 1.5 and Table A1.4).
29 OECD (2012).

WT/TPR/S/314 • Canada
- 26 -
Chart 1.5 Merchandise trade by main origin and destination, 2011 and 2014
2011 2014
(a) Exports and re-exports
Total: Can$446,707 million
(b) Imports
Total: Can$446,666 million Total: Can$511,409 million
China3.8%
Total: Can$524,495 million
Mexico1.2%
Others2.1%
United States73.6%
Mexico1.0%
Other America1.9%
Other Asia4.8%
America79.5%
United States76.8%
Other America1.6%
EU(28)7.4%
Other Europe0.9%
Other Asia4.4%
Others2.1%
America76.8%
United States49.6%
Other America4.1%
EU(28)11.7%
Other Europe2.0%
Japan2.9%
China10.8%
Other Asia6.5%
Others6.9%
United States54.3%
Other America3.4%
EU(28)11.3%
Other Europe1.5%
Japan2.6%
China11.5%
Other Asia6.4%
Others3.5%
America59.2% America
63.3%
EU(28)9.0%
China3.7%
Mexico5.5%
Mexico5.6%
Europe8.3%
Europe10.2%
Europe13.6%
Asia20.2%
Asia20.4%
Europe12.8%
Other Europe1.2%
Japan2.4%
Asia10.9%
Asia10.1%
Japan2.0%
Source: WTO Secretariat estimates, based on data from Statistics Canada.
1.5.2 Trade in Services
1.32. The services sector is the largest contributor to Canada's economy, accounting for 70% of GDP during the period 2011-14. However, Canada's services trade is relatively small, about one-fifth the size of its merchandise trade. Canada remains a net services importer and the services trade deficit slightly increased during the review period from Can$22 billion to Can$23 billion.

WT/TPR/S/314 • Canada
- 27 -
1.33. In terms of trade of services sectors, travel, transportation, and charges for the use of intellectual property are the main transactions for imports; travel, transportation, and professional and management consulting services are the principal sectors for exports (Table 1.3).
Table 1.3 Canada's international transactions in services by sector, 2011-14
(Can$ billion) 2011 2012 2013 2014Services exports 84.4 90.0 92.5 95.2Travel 16.6 17.4 18.2 19.3 Business travel 2.9 2.9 3.0 3.1 Personal travel 13.8 14.5 15.2 16.2 Transportation 13.6 14.0 14.2 14.7 Water transport 2.7 3.0 2.9 3.1 Air transporta 6.3 6.3 6.5 6.6 Land and other transportb 4.6 4.7 4.8 5.0 Maintenance and repair services 1.4 1.5 1.4 1.7 Construction services 0.5 0.7 0.6 0.5 Insurance services 2.2 1.9 1.9 1.8 Financial services 7.0 7.5 7.9 8.3 Telecommunications, computer, and information servicesc 9.9 10.4 10.4 10.2 Charges for the use of intellectual property 3.3 4.0 4.2 4.5 Professional and management consulting servicesd 11.4 12.0 12.6 13.2 Research and development services 4.3 4.3 4.5 4.7 Technical, trade-related and other business servicese 10.2 12.0 12.2 12.2 Audio-Visual services 2.1 2.4 2.5 .. Other personal, cultural, and recreational servicesf 0.3 0.5 0.5 .. Government services 1.6 1.5 1.5 1.5 Services imports 106.2 112.7 115.5 117.9Travel 33.0 35.0 36.2 37.2 Business travel 4.1 4.3 4.4 4.5 Personal travel 28.9 30.8 31.8 32.7 Transportation 23.7 23.7 24.0 24.7 Water transport 10.1 10.2 10.4 11.2 Air transporta 10.2 10.3 10.4 10.2 Land and other transportb 3.4 3.3 3.3 3.3 Maintenance and repair services 0.3 0.6 0.7 0.9 Construction services 0.4 0.3 0.3 0.3 Insurance services 4.7 5.7 5.5 5.1 Financial services 5.3 5.0 5.0 5.2 Telecommunications, computer, and information servicesc 5.4 5.9 6.0 6.5 Charges for the use of intellectual property 10.3 10.9 11.2 11.3 Professional and management consulting servicesd 10.1 10.6 11.0 10.9 Research and development services 1.1 1.4 1.5 1.5 Technical, trade-related and other business servicese 8.3 9.7 10.2 10.4 Audio-Visual services 2.1 2.3 2.4 .. Other personal, cultural, and recreational servicesf 0.2 0.3 0.3 .. Government services 1.3 1.3 1.2 1.2
.. Not available.
a International passenger fares by water are included under air transport. b From 2004, postal and courier services are included under land and other transport. c Includes telecommunications services, and computer and information services. d Includes management services and advertising and related services. e Includes architecture, engineering and other technical services, non-financial commissions, and
equipment rentals. f The coverage of this category is limited to data on international activity of trade unions.
Source: WTO Secretariat, based on Statistics Canada, CANSIM Tables 376-0108 and 376-0033.

WT/TPR/S/314 • Canada
- 28 -
1.34. As with merchandise trade, services trade is heavily concentrated on one market, the United States, which accounted for 57% of services imports and 56% of services exports in 2013. The next largest import sources are the United Kingdom (5%) and Hong Kong, China (3%), and for exports, the United Kingdom (5%) and China (3%). Canada's services trade takes place principally with North America, Europe, and Central and East Asia, accounting for over 85% of Canada's services trade (Table 1.4).
Table 1.4 Canada's international transactions in services by main partners, 2010-13
(Can$ billion) 2010 2011 2012 2013a
Services exports 79.2 84.4 90.0 92.5United States 43.1 46.0 50.5 51.5 United Kingdom 4.6 5.0 4.7 4.7 China 1.5 1.7 2.1 2.3 France 2.3 2.4 2.2 2.3 Germany 2.0 2.0 2.0 2.0 Switzerland 1.4 1.7 1.6 1.7 Hong Kong, China 1.2 1.2 1.6 1.7 Bermuda 1.9 1.5 1.5 1.6 Australia 1.2 1.3 1.5 1.5 Japan 1.2 1.3 1.4 1.4 Mexico 0.8 0.8 1.0 1.0 Netherlands 1.0 1.2 1.0 1.0 Singapore 0.6 0.7 0.8 0.9 Ireland 0.6 0.7 0.9 0.8 Republic of Korea 0.8 0.7 0.8 0.8 Services imports 101.1 106.2 112.7 115.5United States 57.8 60.9 64.2 66.4 United Kingdom 5.5 5.5 5.8 5.6 Hong Kong, China 3.1 3.2 3.3 3.4 France 2.3 2.6 2.7 2.8 Mexico 2.1 2.1 2.3 2.4 Germany 2.1 2.3 2.1 2.2 China 1.8 2.0 2.1 2.1 Japan 1.6 1.5 1.8 1.7 Netherlands 1.3 1.3 1.6 1.7 Singapore 1.6 1.6 1.7 1.7 Switzerland 2.1 1.6 1.6 1.6 Barbados 1.1 1.1 1.6 1.5 Bermuda 1.2 1.0 1.4 1.4 Ireland 0.9 1.1 1.3 1.3 Australia 0.7 0.8 1.0 1.0
a Preliminary.
Source: Statistics Canada, CANSIM Table 376-0036.
1.35. The Government of Canada has been actively promoting trade in services in the WTO and through a number of trade policy tools such as free trade agreements, including the negotiation of a Trade in Services Agreement, foreign investment promotion and protection agreements, double taxation agreements, and air transport agreements. Furthermore in Canada's Global Markets Action Plan, services sectors are an important component, for which comprehensive strategies are being developed to strengthen Canada's trade and investment in priority markets. These include the launch of an international education strategy to attract international students to Canada and the development of an extractive sector strategy.

WT/TPR/S/314 • Canada
- 29 -
1.6 Foreign Direct Investment
1.36. In addition to its relatively open trade policy, Canada also promotes open foreign investment as it recognizes the importance of foreign direct investment to foster growth and efficiency in its economy.30 In terms of FDI inflows, Canada ranked 7th in the world in 2014 according to UNCTAD; up from 10th in 2012.31
1.37. During the review period, growth rates of inward FDI to Canada were modest, reflecting world trends of less FDI flows to developed countries and increased flows to emerging economies. However, while inward FDI growth was slow at the beginning of the period, it picked up in 2013 due in part to a significant increase in intra-company loans to foreign affiliates in Canada.32 According to UNCTAD, FDI inflows declined in 2014 as a result of a significant fall in intra-company loans.33
1.38. While foreign direct investment into Canada increased during the period from Can$604 billion in 2011 to Can$686 billion in 2013, Canadian direct investment abroad increased more, from Can$675 billion to Can$779 billion. As with trade, the investment linkages to the United States dominate and account for about half of all inward and outward investment; the investment position in the United States increased by Can$28 billion to Can$318 billion at the end of the year. Europe is also a significant source of Canadian FDI, accounting for 32% of inflows in 2013 (Table 1.5), with the United Kingdom accounting for the majority, as it remained the second top investment destination after the United States.
1.39. The stock of Canadian direct investment abroad grew by 9.4% in 2013, reflecting both increased investment activity as well as the upward revaluation effects of a weaker Canadian dollar. Aside from investment, generally stronger foreign currencies relative to the Canadian dollar also supported the growth of Canadian direct investment assets abroad during the year. This resulted in an upward revaluation of these foreign currency-denominated assets.
Table 1.5 International investment position by country, 2009-13
(Can$ billion) 2009 2010 2011 2012 2013Canadian direct investment abroad Total 630.8 637.3 675.0 712.6 779.3North America 368.9 362.4 403.8 431.6 464.9 South and Central America 34.6 36.2 34.0 41.8 44.6 Europe 178.1 176.3 174.9 178.3 208.0 Africa 3.2 4.2 4.3 1.3 2.2 Asia/Oceania 46.1 58.1 57.9 59.5 59.6 Foreign direct investment in Canada Total 573.9 592.4 603.5 626.8 686.3North America 304.5 323.4 313.9 324.4 356.5 South and Central America 13.3 17.4 17.6 16.8 18.4 Europe 186.1 181.5 197.2 205.8 219.0 Africa 2.4 2.9 2.2 2.4 2.3 Asia/Oceania 67.6 67.2 72.5 77.5 90.0
Source: Statistics Canada, CANSIM Table 376-0051.
1.40. In Canada, FDI is concentrated in manufacturing; mining, oil, and gas extraction; and management of companies and enterprises. Together, these accounted for over two-thirds of all Canadian FDI in 2013 (Table 1.6). Following several years of little or no growth, Canadian direct investment abroad in the manufacturing sector picked up in 2013, rising by 18% to Can$72.8 billion since 2011. The share of Canadian investment abroad going into the
30 Economic Action Plan 2013. Viewed at: http://actionplan.gc.ca/en/page/economic-action-plan-2013 and Statistics Canada.
31 UNCTAD (2015 and 2014). 32 UNCTAD (2014). 33 UNCTAD (2015).

WT/TPR/S/314 • Canada
- 30 -
manufacturing sector has fallen from a peak of 31.9% in 2000 to 9.3% in 2013. Some 44% of the increase in the stock of Canadian direct investment abroad was channeled into the finance and insurance sector, up by Can$48.3 billion to Can$312.9 billion during 2011-13. The sector maintained its position as the primary destination for investment with a 40% share of overall Canadian direct investment abroad.
Table 1.6 International investment position by sector (North American Industry Classification System (NAICS)), 2009-13
(Can$ billion) 2009 2010 2011 2012 2013Canadian direct investment abroad Total, all industries 630.8 637.3 675.0 712.6 779.3Agriculture, forestry, fishing and hunting 3.8 6.0 4.1 3.6 3.5 Mining and oil and gas extraction 107.0 122.0 129.7 139.4 138.5 Utilities 15.8 16.1 13.5 16.7 18.8 Construction 1.9 1.8 0.6 0.5 0.6 Manufacturing 96.2 64.6 67.0 61.9 72.8 Wholesale trade 7.0 9.1 10.6 9.3 11.1 Retail trade 6.1 7.2 6.8 5.3 7.8 Transportation and warehousing 22.2 20.8 25.9 22.2 27.6 Information and cultural industries 23.0 27.7 28.9 34.1 37.2 Finance and insurance 231.7 236.4 264.6 283.5 312.9 Real estate and rental and leasing 8.5 13.2 20.3 23.0 25.2 Professional, scientific and technical services 7.1 7.7 7.5 8.6 10.2 Management of companies and enterprises 92.5 96.7 87.5 93.1 101.5 Accommodation and food services 2.6 2.7 2.8 2.0 1.9 All other industries 5.2 5.4 5.4 9.4 9.9 Foreign direct investment in Canada Total, all industries 573.9 592.4 603.5 626.8 686.3Agriculture, forestry, fishing and hunting 1.4 1.3 n.d. 0.3 0.3 Mining and oil and gas extraction 93.6 112.0 118.2 121.3 139.4 Utilities 5.1 5.4 n.d. 5.1 5.7 Construction 4.1 3.4 5.0 2.3 2.4 Manufacturing 185.5 176.8 173.0 186.2 209.3 Wholesale trade 45.9 39.6 42.8 49.1 49.9 Retail trade 15.5 18.7 29.3 29.2 31.7 Transportation and warehousing 4.0 3.5 7.2 6.2 7.7 Information and cultural industries 9.7 8.7 1.7 3.1 4.1 Finance and insurance 82.6 78.1 79.3 88.6 94.5 Real estate and rental and leasing 5.7 5.0 4.7 4.6 4.6 Professional, scientific and technical services 9.4 11.0 8.7 8.7 9.3 Management of companies and enterprises 99.3 117.9 117.3 111.4 116.1 Accommodation and food services 4.5 4.2 4.3 3.9 4.1 All other industries 7.4 6.9 6.9 6.8 7.1
Source: Statistics Canada, CANSIM Table 376-0052.
1.7 Outlook
1.41. In its 2014 Article IV assessment of Canada's economy, the IMF noted that solid growth is envisaged to continue while becoming more balanced, yet some imbalances remain. In particular, the rebalancing of growth remains incomplete with weak business non-residential investment slowing in recent years after a strong rebound post crisis and the rebalancing towards exports and investment remains incomplete. Growth is expected to be supported by stronger exports and business investment, spurred by the U.S. recovery. Rising long-term interest rates and weaker terms-of-trade mostly due to lower energy prices are expected to moderate private consumption and residential investment. The main risks to grow would stem from a faster-than-expected
WT/TPR/S/314 • Canada
- 31 -
tightening of global financial conditions, household balance sheet vulnerabilities and a further decline in global energy prices, while it is expected that continued U.S. growth and a depreciating Canadian dollar would help dampen the adverse impact of these shocks.34 According to the IMF, real GDP growth is expected to accelerate to 2.3% in 2015 and then slow to 2.1% in 2016 while inflation is expected to remain at around the Bank of Canada's target rate of 2%.35
34 IMF (2014b). 35 IMF (2015).

WT/TPR/S/314 • Canada
- 32 -
2 TRADE AND INVESTMENT REGIME
2.1 General Framework
2.1. As noted in the previous Report1, Canada's framework for trade and investment policy has shared competences between the federal government and the provinces as outlined in Part VI of the Constitution Act, 1867, as amended (Table 2.1). The federal government has jurisdiction on trade, but some matters like agriculture, fishing, labour, public works and the environment have shared jurisdiction with the provinces. As part of the Government of Canada's Northern Strategy2, devolving province-like powers to the Northern Territories has been key to political and economic development of the North. Territorial land and resource responsibilities were devolved to the Government of the Yukon on 1 April 2003, to the Government of the Northwest Territories on 1 April 2014, and a similar agreement is being negotiated with the Government of Nunavut.
Table 2.1 Government jurisdiction in Canada
Federal jurisdiction Provincial jurisdiction Shared jurisdiction Trade and international relations Public lands and forests Agriculture Taxes Health system Companies and economic development Postal service Municipal institutions Prisons and justice Defense Property and civil rights Fishing Fiscal and monetary policy Education Public works (health and safety) Aboriginal affairs Business licenses Transportation and communication Criminal law Resource ownership and
management Immigration
Residual powers Environmental protection Right of disallowance over the provinces
Energy, mining, forest management
Science and technology
Source: The Constitution of Canada and information provided by the Canadian authorities.
2.2. The Agreement on Internal Trade (AIT) is an intergovernmental trade agreement for domestic trade to reduce or eliminate barriers to the free movement of persons, goods, services, and investment within Canada. It has six general rules such as non-discrimination and transparency, and it focuses on reducing trade barriers in eleven specific sectors. During the review period, the AIT was amended two times. The changes included revisions to procurement, labour mobility, and dispute resolution sections.3
2.3. At the federal level, the Department of Foreign Affairs, Trade and Development Canada (DFATD) is responsible for international trade and investment policies. As part of its mandate to encourage the country's international trade, it has specific provisions to strengthen rules-based trading arrangements and achieve fair market access at bilateral, regional, and global levels.4
2.4. In terms of public-private sector consultation processes, DFATD maintains a number of consultative bodies that engage the private sector which contribute to government policy and, more specifically, operations of the Trade Commissioner Service, the international trade promotion arm of the federal government. The Small and Medium-sized Enterprises Advisory Board (SMEAB) is comprised of 18 private sector leaders from small and medium-sized enterprises; it meets biannually. DFATD also maintains a limited number of sector-oriented consultation bodies that annually bring together government and industry representatives. Collectively, these consultation bodies provide the Minister of International Trade with advice on emerging opportunities, challenges and threats in the industry and on international marketplace issues as well as to make recommendations on the commerce-related priorities, policies, and programmes of the Department. DFATD also chairs the Tariff Quota Advisory Committees (TQACs) that serve as consultation bodies to specifically discuss Canada's trade control regime.
1 WTO document WT/TPR/S/246/Rev.1, 26 July 2011. 2 Viewed at: http://www.northernstrategy.gc.ca/index-eng.asp. 3 For further information: http://www.ait-aci.ca/index_en.htm. 4 Foreign Affairs, Trade and Development Canada, online information. Viewed at:
http://www.international.gc.ca/department-ministere/index.aspx?lang=eng.

WT/TPR/S/314 • Canada
- 33 -
2.5. The Global Markets Action Plan Advisory Council, announced as part of the Global Markets Action Plan launch in November 2013, is another mechanism through which the private sector is consulted on trade. The Advisory Council will comprise business and industry leaders, experts in international business, and key representatives from the SME community to bring together the voices of all businesses, large and small, and provides strategic insight, advice, and real-world perspectives. As of January 2015, the Advisory Council was in the process of being established.
2.6. In the context of Canada's FTA negotiations, the Government of Canada is committed to engaging in broad-based consultations with the private sector, civil society groups, and individual Canadians to help inform Canada's negotiating objectives and priorities. Among the consultation mechanisms used to afford Canadians the opportunity to shape the trade agenda, the Government of Canada publishes a notice in the Canada Gazette soliciting comments from Canadians prior to Canada's participation in negotiations. Throughout the negotiating process, the Government of Canada also undertakes a variety of targeted consultations with relevant stakeholders, including through in-person meetings, conference calls, information briefings (including webinars) and stakeholder events. Information is also shared on the Department of Foreign Affairs, Trade and Development website, and interested Canadians are invited to share their views via dedicated consultation mailboxes.
2.1.1 New Developments
2.7. In 2011, the United States and Canada jointly launched the Beyond the Border Action Plan to improve and speed up legitimate trade and travel between the two countries. The Plan is being implemented in phases and includes improvements to infrastructure at the border, implementing the single window, enhancing benefits of the trusted trade and traveller programmes5, improving cargo security, sharing immigration information, and supporting cross-border law enforcement activities.
2.8. Three years after being launched, significant achievements have been realized across all areas of the Beyond the Border Action Plan. Canada and the Unites States have moved towards a common approach to screening travellers through the ongoing implementation of automated sharing of biographic visa, immigration and biometric asylum information on third country nationals, as well as the first two phases of an Entry/Exit system for all foreign nationals; and, in Canada, work has progressed on a pre-departure screening system for visa-exempt travellers flying to Canada from abroad. Investments in border infrastructure are also underway, new benefits have been introduced to the trusted traveller (NEXUS) programme, and trusted trader programmes have been further harmonized and enhanced. The participants are committed to the ongoing implementation of remaining Action Plan initiatives, and are considering ways to build upon the Beyond the Border successes, including seeking the views of stakeholders on their priorities.
2.9. In 2011 Canada passed the Freezing Assets of Corrupt Foreign Officials Act to allow Canada to freeze assets of former foreign leaders that have been placed in Canada in order to fight corruption and misappropriation. This law would mainly impact financial assets and services, allowing Canada to take possession and repatriate the funds.
2.10. In November 2014, Foreign Affairs, Trade, and Development Canada announced a new enhanced Corporate Social Responsibility (CSR) Strategy in Canada's extractive sector abroad.6 As a leading player in the world mining industry, Canada expects the companies to promote Canadian values and operate with high ethical standards abroad. Further, Canada continues to promote CSR by incorporating the provisions of CSR in all its Foreign Investment Promotion and Protection Agreements and Free Trade Agreements since 2010.7 The CSR Strategy is part of an overarching Canadian Extractive Sector Strategy, also announced in November 2014, which sets out a framework to ensure greater coherence and more effective implementation of efforts to advance the interests and opportunities for Canada's extractive sector abroad. The four pillars of the
5 For the movement of goods and persons. 6 The Strategy is voluntary but does make reference to two mandatory policies, namely the Corruption
of Foreign Public Officials Act and the Extractive Sector Transparency Measures Act, and the provision of economic diplomatic services are related to participation.
7 Foreign Affairs, Trade and Development Canada online information. Viewed at: http://www.international.gc.ca/trade-agreements-accords-commerciaux/topics-domain.

WT/TPR/S/314 • Canada
- 34 -
Strategy are: securing and preserving access to international markets for Canadian business; transforming business opportunities into business successes; sustaining the business environment and local communities and; producing economic benefits for Canadians.
2.2 Trade Policy Objectives
2.11. Building upon the success of the 2007 Global Commerce Strategy, Canada launched its Global Markets Action Plan (GMAP) in 2013 as a strategic plan to prioritize markets and support commercial success in trade. In particular it sets priorities and objectives for trade initiatives and trade promotion activities. Canada's trade agenda is currently focused on achieving new free trade agreements.
2.12. The Global Markets Action Plan contains a pro-trade and investment plan to pursue ambitious growth in trade, job creation, and economic growth. It plans to use many vehicles, including the WTO, FTAs, investment, and other agreements as the tools to achieving its goals. In particular, the following specific goals have been identified:
• "advance and conclude FTAs with major economic impact;
• modernize existing FTAs to maximize the benefits to Canadian workers, exporters, businesses and investors;
• improve "international connectivity" for Canadians (that is, the ability to reach international destinations from various points in Canada) and enhance market access for passenger and cargo services through targeted, higher-quality air transport agreements;
• pursue foreign investment promotion and protection agreements (FIPAs) in markets where Canadian investors have economic interest; where there is a strong potential for economic growth; and where there is likelihood of reaching a high standard agreement;
• reinforce the multilateral system through various next-generation agreements (within and outside the WTO), including the Trade in Services Agreement; and modernize and expand product coverage under the Information Technology Agreement;
• address barriers to trade and investment through targeted advocacy, troubleshooting and dispute settlement, especially in established markets and priority emerging markets;
• connect Canadian businesses with the extensive international networks in Canadian embassies and offices abroad to help address market access issues and concerns; and
• leverage development programming to advance Canada's trade interests."8
2.13. In addition to prioritizing certain markets depending upon Canadian interests and advantages, the Global Markets Action Plan prioritises sectors where it has a strong competitive advantage and plans to develop strategies to help these sectors flourish (Box 2.1).
8 Global Markets Action Plan. Viewed at: http://www.international.gc.ca/global-markets-marches-
mondiaux/index.aspx?lang=eng.

WT/TPR/S/314 • Canada
- 35 -
Box 2.1 Priority trade sectors
Aerospace Agriculture and processed foods Automotive Chemicals Consumer products Defence and security Education Financial services Fish and seafood Forestry and wood products Industrial machinery Information and communications technologies Infrastructure Life sciences Mining Ocean technologies Oil and gas Professional services Sustainable technologies Tourism Transportation Wine, beer and spirits
Source: Global Markets Action Plan.
2.14. The GMAP sets out to promote further improvements in trade promotion and support services, promote its foreign trade zone advantage, support its innovation advantage, and set goals for increasing exports by SMEs.
2.15. The following priorities and achievements have been reached under the GMAP as of January 2015:
• Trade Missions to several countries, including Burkina Faso, Madagascar, South Africa, Tanzania, Ukraine, Australia, the Philippines, Colombia, Peru, Laos, Burma, United Kingdom, India and China.
• "Go Global" workshops for Canadian companies have been held in cities such as Richmond (BC), Montreal (QC), Mississauga (ON) and Halifax (NS).
• Launch of the International Education Strategy, the Defence Procurement Strategy and associated Export Strategy, and the Strategy for the Extractive Sector.
o International Education Strategy: The comprehensive plan sets targets to attract
more international researchers and students to Canada, deepen the research links between Canadian and foreign educational institutions, and establish a pan-Canadian partnership with provinces and territories and all key education stakeholders, including the private sector.
o Defence Procurement Strategy: The three key objectives of the Defence Procurement Strategy are to deliver the right equipment to the Canadian Armed Forces (CAF) and the Canadian Coast Guard in a timely manner; leverage purchases of defence equipment to create jobs and economic growth in Canada; and streamline defence procurement processes.
o Strategy for the Extractive Sector: Building on Canada's plan for Responsible Resource Development, the Strategy ensures that mining and energy will continue to represent an engine of economic growth and prosperity for Canadians.9
• Launch of a pilot Canadian Technology Accelerator in India to facilitate business between
high potential technology-based Canadian and Indian start-ups.
9 The Extractive Sector Strategy supports the export of both equipment and services in the extractive
sectors.

WT/TPR/S/314 • Canada
- 36 -
• Establishment of more than 20 partnerships between the TCS and private sector associations to embed a Trade Commissioner within the association, generating increased cooperation and mutual benefit in the interest of Canadian companies.
• Announcement of the opening of four new trade offices in China. • Announcement of the organizations chosen to advance in the selection process for the
Canadian Accelerator and Incubator Program (CAIP), which is designed to help outstanding Canadian SMEs to grow, prosper and create jobs.
• Opening of applications for the Foreign Trade Zone (FTZ) - Marketing Program, designed to market Canada's FTZ advantage and attract foreign direct investment.
• Announcement of the ecoENERGY innovation initiative, to invest in new clean technologies that will create jobs, opportunities and help protect the environment, including a Can$268 million investment over five years to support the research, development and demonstration of innovative clean technologies.
• The following SME export goal was announced: "Grow Canada's SME export presence in emerging markets from 29 percent to 50 percent by 2018. This would grow Canada's SME footprint in emerging markets from 11,000 to 21,000 companies. This growth would create more than 40,000 net new jobs."
2.16. Canada's Department of Trade, as part of Foreign Affairs, Trade and Development Canada, also sets priorities for its work. For 2014-15, the priorities are as follows:
• "Contribute to economic prosperity with an emphasis on expanding and diversifying commercial relationships with emerging and high-growth markets;
• Expand Canada's engagement in the hemisphere and reinforce the Canada-U.S. relationship;
• Increase Canada's economic and political engagement in Asia;
• Promote democracy and respect for human rights and contribute to effective international security and global governance; and
• Lead Canada's international efforts to reduce global poverty and provide humanitarian assistance."10
2.17. Canada also places an emphasis on the development aspects of trade as trade and investment are considered as key drivers of job creation and prosperity in Canada and play essential roles in promoting economic growth and poverty reduction in partner countries in development. Canada recognises that many developing countries cannot effectively participate in trade, often because they lack necessary human, institutional and infrastructural capacities to implement the necessary legal, regulatory and structural reforms to facilitate trade.
2.18. To help developing country partners access the economic benefits that contribute to growth, sustainable development and employment generation, Canada has focused its existing multilateral and bilateral development programme to address these challenges. This approach reaffirms Canada's commitment to the Doha Development Agenda and is fully aligned with the GMAP's strategy to leverage development programming to advance Canada's trade interest while adhering to the principles of development effectiveness and Canada's priorities for development assistance.
2.19. Bilaterally, Canada works with developing country governments to help them create a domestic environment conducive to trade and investment. The Canadian Trade and Development Facility (CTDF) is an example of a Canadian trade-related assistance tool designed to support developing countries or groups of developing countries with which Canada is or will be negotiating Free Trade Agreements (FTA) or Foreign Investment Promotion and Protection Agreements (FIPAs). The CTDF assists negotiating partners to effectively negotiate, implement, adapt to and take advantage of concluded agreements. DFATD continues to identify innovative ways to deploy resources and new programming opportunities in support of its international assistance and trade priorities.
10 Foreign Affairs, Trade and Development Canada online information. Viewed at:
http://www.international.gc.ca/department-ministere/priorities-priorites.aspx?lang=eng.
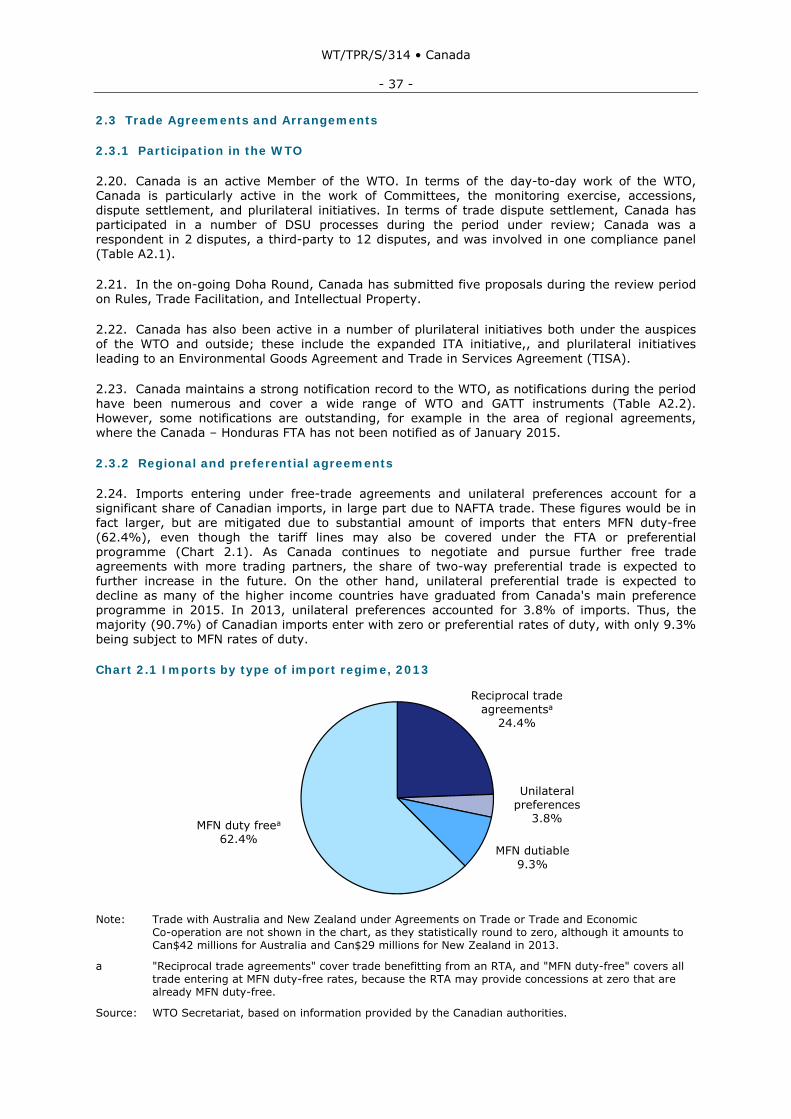
WT/TPR/S/314 • Canada
- 37 -
2.3 Trade Agreements and Arrangements
2.3.1 Participation in the WTO
2.20. Canada is an active Member of the WTO. In terms of the day-to-day work of the WTO, Canada is particularly active in the work of Committees, the monitoring exercise, accessions, dispute settlement, and plurilateral initiatives. In terms of trade dispute settlement, Canada has participated in a number of DSU processes during the period under review; Canada was a respondent in 2 disputes, a third-party to 12 disputes, and was involved in one compliance panel (Table A2.1).
2.21. In the on-going Doha Round, Canada has submitted five proposals during the review period on Rules, Trade Facilitation, and Intellectual Property.
2.22. Canada has also been active in a number of plurilateral initiatives both under the auspices of the WTO and outside; these include the expanded ITA initiative,, and plurilateral initiatives leading to an Environmental Goods Agreement and Trade in Services Agreement (TISA).
2.23. Canada maintains a strong notification record to the WTO, as notifications during the period have been numerous and cover a wide range of WTO and GATT instruments (Table A2.2). However, some notifications are outstanding, for example in the area of regional agreements, where the Canada – Honduras FTA has not been notified as of January 2015.
2.3.2 Regional and preferential agreements
2.24. Imports entering under free-trade agreements and unilateral preferences account for a significant share of Canadian imports, in large part due to NAFTA trade. These figures would be in fact larger, but are mitigated due to substantial amount of imports that enters MFN duty-free (62.4%), even though the tariff lines may also be covered under the FTA or preferential programme (Chart 2.1). As Canada continues to negotiate and pursue further free trade agreements with more trading partners, the share of two-way preferential trade is expected to further increase in the future. On the other hand, unilateral preferential trade is expected to decline as many of the higher income countries have graduated from Canada's main preference programme in 2015. In 2013, unilateral preferences accounted for 3.8% of imports. Thus, the majority (90.7%) of Canadian imports enter with zero or preferential rates of duty, with only 9.3% being subject to MFN rates of duty.
Chart 2.1 Imports by type of import regime, 2013
Reciprocal trade agreementsa
24.4%
Unilateral preferences
3.8%
MFN dutiable9.3%
MFN duty freea
62.4%
Note: Trade with Australia and New Zealand under Agreements on Trade or Trade and Economic
Co-operation are not shown in the chart, as they statistically round to zero, although it amounts to Can$42 millions for Australia and Can$29 millions for New Zealand in 2013.
a "Reciprocal trade agreements" cover trade benefitting from an RTA, and "MFN duty-free" covers all trade entering at MFN duty-free rates, because the RTA may provide concessions at zero that are already MFN duty-free.
Source: WTO Secretariat, based on information provided by the Canadian authorities.

WT/TPR/S/314 • Canada
- 38 -
2.3.2.1 Reciprocal trade agreements
2.25. In order to improve its market access opportunities, Canada has pursued bilateral and regional Free Trade Agreements (FTAs) as an important part of its trade policy and has gradually increased the number of FTAs in recent years. As of January 2015 there were 11 agreements in force covering trade with 15 countries (Table 2.2). Canada's trade under FTAs is significant, accounting for approximately 61% of Canadian imports in 2013.11 FTA partners are also important to Canadian exports, as 78% of Canadian 2013 exports were to countries where an FTA was in place.12 Canada retained a negative trade balance with 7 of its 11 FTA partners (Table 2.2). But due to the significant trade surplus generated with NAFTA partners, there is an overall positive trade balance for Canada with FTA partners.
2.26. Since the last review, five new FTAs have entered into force; these are with the Republic of Korea, Colombia, Honduras, Jordan, and Panama (Table 2.3). The agreements with Colombia, Honduras, Panama and the Republic of Korea cover goods and services, while the one with Jordan covers only goods. With the exception of the Republic of Korea, merchandise trade between Canada and these new FTA partners is small, as they ranked 45th, 75th, 103rd, and 89th, respectively, among Canada's import partners in 2013.13 Canada continues to pursue bilateral FTAs as part of its trade policy and has one other agreement concluded with the EU, but not yet entered into force, and ten others that are under negotiation.
2.27. On 1 January 2015, the Canada-Korea Free Trade Agreement (CKFTA) entered into force. The Republic of Korea represents Canada's 7th-largest trading partner, and 3rd-largest in Asia. Overall, the Agreement is projected to boost Canada's economy by Can$1.7 billion and increase Canadian exports to the Republic of Korea by 32%. The CKFTA is an ambitious and comprehensive agreement, covering trade in goods and services, investment, government procurement, non-tariff barriers, environment and labour cooperation, and other areas of economic activity.
2.28. Canada and the European Union (EU) announced on 5 August 2014 that negotiations on the Canada-EU Comprehensive Economic and Trade Agreement (CETA) had been completed, and on 26 September 2014 the parties formally recognized the end of CETA negotiations with the publishing of the final negotiated text.14 A joint Canada-EU study that supported the launch of negotiations estimated that the Agreement would increase bilateral trade by 20%, raising Canada's GDP by Can$12 billion and the EU's collective GDP by €11.6 billion annually. Pending a legal review and translation, final ratification of the Agreement is expected to take place in approximately two years.
Table 2.2 Overview of Canada's FTAs, January 2015
(Can$ million)
FTA partner
Entry into force
FTA imports 2013
Total imports
2013
FTA imports
(%)
Total exports
2013
Trade Balance
Republic of Korea
1 January 2015 n.a. 7,337.7 n.a. 3,500.6 -3,837.1
Honduras 1 October 2014 n.a. 234.9 n.a. 43.7 -191.2 Panama 1 April 2013 0.099 73.6 0.1 94.7 21.1 Jordan 1 October 2012 23.7 46.1 51.4 65.8 19.6 Colombia 15 August 2011 107.5 691.4 15.5 711.5 20.1 Peru 1 August 2009 70.9 3,075.8 2.3 606.1 -2,469.7 EFTA 1 July 2009 546.3 7,802.5 7.0 3,861.2 -3,941.3
11 This figure is somewhat overestimated as it takes into account total imports from FTA partners, as it
was not possible to identify trade benefitting from the FTA exclusively. It excludes trade with the Republic of Korea and Honduras, as the agreements were not in force in 2013.
12 The share excludes trade with the Republic of Korea and Honduras, as the agreements were not in force in 2013.
13 Viewed at: http://www.international.gc.ca/economist-economiste/assets/pdfs/Data/facts-fiches/PFACT_Annual_Merchandise_Trade_by_Country-ENG.pdf.
14 Viewed at: www.international.gc.ca/CETA.
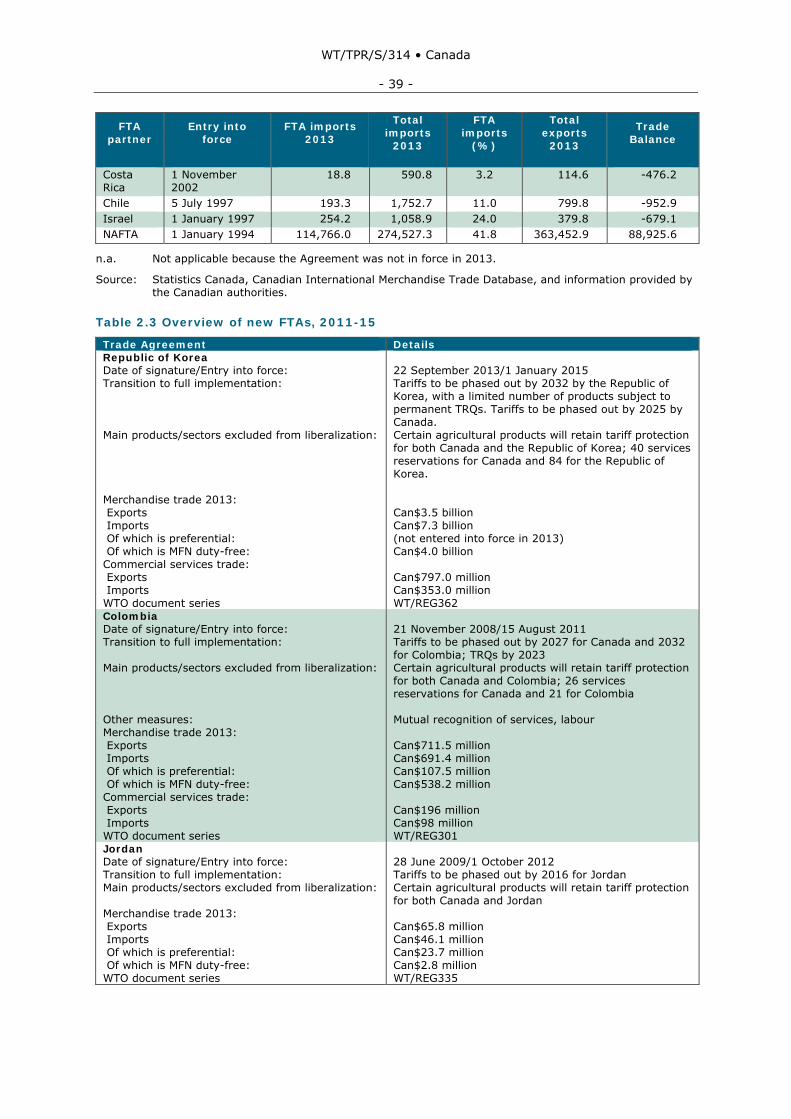
WT/TPR/S/314 • Canada
- 39 -
FTA partner
Entry into force
FTA imports 2013
Total imports
2013
FTA imports
(%)
Total exports
2013
Trade Balance
Costa Rica
1 November 2002
18.8 590.8 3.2 114.6 -476.2
Chile 5 July 1997 193.3 1,752.7 11.0 799.8 -952.9 Israel 1 January 1997 254.2 1,058.9 24.0 379.8 -679.1 NAFTA 1 January 1994 114,766.0 274,527.3 41.8 363,452.9 88,925.6
n.a. Not applicable because the Agreement was not in force in 2013.
Source: Statistics Canada, Canadian International Merchandise Trade Database, and information provided by the Canadian authorities.
Table 2.3 Overview of new FTAs, 2011-15
Trade Agreement Details Republic of Korea Date of signature/Entry into force: Transition to full implementation: Main products/sectors excluded from liberalization: Merchandise trade 2013: Exports Imports Of which is preferential: Of which is MFN duty-free: Commercial services trade: Exports Imports WTO document series
22 September 2013/1 January 2015 Tariffs to be phased out by 2032 by the Republic of Korea, with a limited number of products subject to permanent TRQs. Tariffs to be phased out by 2025 by Canada. Certain agricultural products will retain tariff protection for both Canada and the Republic of Korea; 40 services reservations for Canada and 84 for the Republic of Korea. Can$3.5 billion Can$7.3 billion (not entered into force in 2013) Can$4.0 billion Can$797.0 million Can$353.0 million WT/REG362
Colombia Date of signature/Entry into force: Transition to full implementation: Main products/sectors excluded from liberalization: Other measures: Merchandise trade 2013: Exports Imports Of which is preferential: Of which is MFN duty-free: Commercial services trade: Exports Imports WTO document series
21 November 2008/15 August 2011 Tariffs to be phased out by 2027 for Canada and 2032 for Colombia; TRQs by 2023 Certain agricultural products will retain tariff protection for both Canada and Colombia; 26 services reservations for Canada and 21 for Colombia Mutual recognition of services, labour Can$711.5 million Can$691.4 million Can$107.5 million Can$538.2 million Can$196 million Can$98 million WT/REG301
Jordan Date of signature/Entry into force: Transition to full implementation: Main products/sectors excluded from liberalization: Merchandise trade 2013: Exports Imports Of which is preferential: Of which is MFN duty-free: WTO document series
28 June 2009/1 October 2012 Tariffs to be phased out by 2016 for Jordan Certain agricultural products will retain tariff protection for both Canada and Jordan Can$65.8 million Can$46.1 million Can$23.7 million Can$2.8 million WT/REG335

WT/TPR/S/314 • Canada
- 40 -
Trade Agreement Details Panama Date of signature/Entry into force: Transition to full implementation: Main products/sectors excluded from liberalization: Other measures: Merchandise trade 2013: Exports Imports Of which is preferential: Of which is MFN duty-free: Commercial services trade: Exports Imports WTO document series
14 May 2010/1 April 2013 Tariffs to be phased out by 2027 for Canada and 2031 for Panama; TRQs by 2031 Certain agricultural products will retain tariff protection for both Canada and Panama; 44 services reservations for Canada and 47 for Panama Competition, Labour Can$94.7 million Can$73.6 million Can$99.2 thousand Can$72.2 million .. .. WT/REG334
Honduras Date of signature/Entry into force: Transition to full implementation: Main products/sectors excluded from liberalization: Other measures: Merchandise trade 2013: Exports Imports Of which is preferential: Of which is MFN duty-free: Commercial services trade: Exports Imports WTO document series
5 November 2013/1 October 2014 Tariffs and TRQs to be phased out by 2028 Certain agricultural products will retain tariff protection for both Canada and Honduras; 41 services reservations for Canada and 62 for Honduras Competition, Labour Can$43.7 million Can$234.9 million (not entered into force in 2013) .. Can$23 million Can$11 million No notification received to date
.. Not available.
Source: WTO Secretariat based on Statistics Canada, Canadian International Merchandise Trade Database, and information provided by Canadian authorities.
2.3.2.2 Unilateral preferential regimes
2.29. Canada has three unilateral preference regimes, providing duty-free or preferential treatment to many products from developing and/or least-developed countries. These are the General Preferential Tariff (GPT) modelled on UNCTAD's Generalized System of Preferences scheme, a Least Developed Country Tariff, and a Commonwealth Caribbean Country Tariff. Eligibility criteria differ by programme, thus some countries may benefit from more than one scheme (Table A2.3).
2.30. As part of its 2013 Economic Action Plan, Canada has committed to modernizing its GPT regime for developing countries. After a comprehensive review and consultations undertaken during 2012-13, Canada launched the process of modernizing the programme by graduating 72 higher-income, trade-competitive countries as of 1 January 2015, and renewing the programme for another 10-year period. Furthermore, beneficiaries will be reviewed every two years based on objective criteria to determine whether they remain eligible for the programme.15
2.31. As part of the 2013 Economic Action Plan's GPT Review, the Least Developed Country Tariff scheme also graduated two trade-competitive countries as of 1 January 2015, Equatorial Guinea and the Maldives.16 The Commonwealth Caribbean Country Tariff schemes are part of the Customs Tariff and have not undergone any changes during the review period.
15 Economic Action Plan 2013. Viewed at: http://actionplan.gc.ca/en/page/economic-action-plan-2013. 16 Canada Border Service Agency online information. Viewed at: http://www.cbsa-
asfc.gc.ca/publications/cn-ad/cn14-020-eng.html.

WT/TPR/S/314 • Canada
- 41 -
2.3.3 Other agreements and arrangements
2.3.3.1 Trade with Australia and New Zealand
2.32. Pursuant to long-standing Agreements on Trade or Trade and Economic Cooperation, Canada has special trading relations with Australia and New Zealand. The agreement with Australia gives preferential tariff treatment to a specified list of products in the annex for both countries; whereas the agreement with New Zealand contains tariff and non-tariff measures provisions. With respect to New Zealand, special tariffs were given through exchanges of letters, and a special status of preferred supplier was granted between the parties for agricultural, horticultural, and fisheries products. Canada implements these preferential tariffs through the Customs Tariff. There is no waiver or other instrument in place under the WTO for these Agreements.
2.3.3.2 Anti-counterfeiting Trade Agreement
2.33. Canada is a signatory to the Anti-Counterfeiting Trade Agreement (ACTA) that is a plurilateral agreement negotiated among eleven trading partners.17 The ACTA aims to combat infringement of intellectual property rights, in particular piracy and counterfeiting. It provides for enhanced international cooperation, promotion of enforcement practices, and a legal framework for IPR enforcement. Although the Agreement was finalised in 2011, it has not yet entered into force.
2.4 Investment Regime
2.4.1 Investment Framework and Agreements
2.34. Canada has a number of policy instruments for its investment regime. In addition to its main law on investment, the Investment Canada Act, Canada has bilateral investment agreements and investment chapters or provisions in FTAs to facilitate and promote investment. In order to protect or facilitate investment, Canada promotes the principles of transparency, national and MFN treatment, and fair and equitable treatment for investments.
2.35. Canada has 28 bilateral agreements on investment, known as Foreign Investment Promotion and Protection Agreements (FIPAs), whose purpose is to protect and promote foreign investments through legally-binding rights and obligations. During the review period Canada has been actively negotiating new FIPAs, and 8 new FIPAs entered into force. FIPAs are negotiated based on a model which includes key principles such as a broad definition of investment, obligations for national treatment and MFN both pre- and post-establishment, protection against expropriation, free transfers of funds, disciplines against performance requirements, and access to arbritration or dispute settlement mechanisms. Furthermore, nearly all of its 11 FTAs have some provision on investment, which are modelled after the NAFTA investment chapter.
2.36. The Settlement of International Disputes Act (SIDA) was passed in 2008 and came into force on 1 November 2013, thus Canada became a party to the United Nations Convention on the Settlement of Investment Disputes (ICSID). Canadian investors, and foreign investors in Canada, now have benefits under the Convention as well as access to dispute settlement.
2.4.2 Investment Canada Act
2.37. Canada's 1985 Investment Canada Act (ICA) provides the main legal framework for reviewing foreign investment in Canada. The review of foreign investment has two main purposes: to assess if they are likely to benefit Canada and to see if they are likely to injure national security. All foreign investment to establish a new Canadian business and to acquire control of a Canadian business, must be notified unless the investment is reviewable (see below), in accordance with the ICA (Art. 11). The ICA provides for a review of foreign investments to acquire a Canadian business if the asset value of the Canadian business is above a certain threshold (see Table 2.4); in this case an application for review must be filed. For investments below this threshold a notification
17 Signatories include Australia, Canada, the Republic of Korea, Japan, New Zealand, Morocco,
Singapore, and the United States. Other parties to the negotiations include the European Union, Mexico, and Switzerland.

WT/TPR/S/314 • Canada
- 42 -
must be presented.18 Indirect acquisitions by WTO member investors are not reviewable, but are nonetheless subject to notification. Lower review thresholds apply for acquisitions of cultural businesses. The thresholds for review for cultural transactions are Can$5 million and Can$50 million for direct and indirect acquisitions respectively and are based on total assets. A number of legal amendments and other changes to the ICA were introduced during the review period (Table 2.4).
2.38. New provisions in the ICA were introduced in 2009, through amendment, to provide for the review of investments on national security grounds. Accompanying regulations, known as the National Security Review of Investments Regulations, prescribe periods of time and investigative bodies for the reviews. The Governor in Council (GIC) can order a national security review of new businesses, investments below the net benefit threshold, and minority investments. The Minister of Industry makes a recommendation following consultation with the Minister of Public Safety, who in turn consults the domestic security & intelligence (S&I) community. The decision to permit, block, or allow with conditions, rests with the GIC. Investments are considered on a case-by-case basis. In 2013, the first rejection of a foreign investment on national security grounds was taken.19
Table 2.4 Investment Canada Act, 2011-14
Major developments
Thresholds The amount was Can$354 million for 2014, Can$344 million for 2013, Can$330 million for 2012, and Can$312 million for 2011, for WTO member investors. Legal amendments 2012 Jobs, Growth and Long-term Prosperity Act These amendments gave the Minister: greater ability to publicly communicate information on the review process while preserving commercial confidences; authority to accept security, when offered by an investor, for payment of any penalties ordered by a court for a contravention of the Act, promoting investor compliance with undertakings; the ability to publicly disclose the fact that he has sent a preliminary notice to an investor stating that he is not satisfied that the investment is likely to be of net benefit to Canada; and the ability to explain publicly his reasons for sending the notice as long as it would not cause harm to the Canadian business or the investor. 2013: Economic Action Plan 2013 Act, No. 1 These amendments included the following: introducing a definition for "state-owned enterprise"; creating a distinct net benefit threshold for private sector WTO Member investors based on enterprise value while maintaining the asset value based threshold for SOE investors; permitting the extension of timelines for national security reviews; and permitting the Minister of Industry to determine or declare that an entity is controlled in fact by an SOE. 2014: Budget Implementation Act The Act requires foreign investors to file a notification whenever they acquire a Canadian business through the realization of security for a loan or other financial assistance, unless the transaction is subject to approval under another statute. 2014: Budget Implementation Act The Act provides the Minister with discretion to disclose certain information related to notices sent to the parties at each stage of national security review, including a notice of a Governor In Council order allowing or disallowing the investment. Regulation changes 2012: The threshold for net benefit reviews was raised to Can$1 billion over a four-year period; established the methodology for calculating the enterprise value of a Canadian business; removed references to the transportation, financial services and uranium production sectors because lower thresholds for these sectors have been eliminated; and formalized the process for collecting additional information relevant to the net benefit and national security processes.
18 Investment Canada Act (R.S.C. 1985, c. 28 (1st Supp.)), current version of 11 November 2014.
Viewed at: http://laws-lois.justice.gc.ca/PDF/I-21.8.pdf. 19Viewed at: http://www.mondaq.com/canada/x/270072/Inward+Foreign+Investment/Canadas+first+
rejection+of+an+investment+on+national+security+grounds+See+more+at+httpwwwmcmillancaCanadasfirstrejectionofaninvestmentonnationalsecuritygroundssthashE62R7bz8dpuf.

WT/TPR/S/314 • Canada
- 43 -
Major developments
Review process changes 2012: The Government revised the guidelines for foreign SOEs; clarified how proposed investments by SOEs are assessed under the Act; and announced it would proceed with legislative amendments to exclude SOE investors from the Can$1 billion enterprise value net benefit threshold increase and to give the Minister the flexibility to extend the timelines for national security reviews, as necessary. Guideline changes 2012: A new guideline was issued to make formal mediation procedures available under the Act. The guideline, establishing an alternative to potentially costly and time-consuming litigation that may be initiated under the Act, provides a voluntary means of resolving disputes when the Minister believes an investor has failed to comply with an undertaking.
Source: Viewed at: http://www.ic.gc.ca/eic/site/ica-lic.nsf/eng/home and information provided by the Canadian authorities.
2.39. Investments under the Investment Act are highly concentrated and originate mainly in the major developed countries, with the United States, averaging 52% of all investments during 2011-13, followed by the EU with 29%. The sectors receiving the most investments, by asset value, are natural resources, followed by manufacturing, and wholesale and retail trade. Direct acquisitions are the main source of investments, followed by new businesses (Table 2.5).
Table 2.5 Investment Canada Act Statistics, 2011-14 2011 2012 2013 2014 No. Amount
(Can$1,000) No. Amount
(Can$1,000) No. Amount
(Can$1,000) No. Amount
(Can$1,000) Acquisitions 470 30,350 525 55,998 471 49,776 554 45,371 Direct 390 24,434 460 50,945 406 27,353 467 38,257 Indirect 80 5,916 65 5,053 65 22,423 87 7,115New Businesses
179 1,536 195 351 178 1,666 186 2,032
Total 649 31,886 720 56,349 649 51,441 740 47,403
Source: Viewed at: http://www.ic.gc.ca/eic/site/ica-lic.nsf/eng/h_lk00015.html.
2.4.3 Other Investment Restrictions
2.40. Canada's objective is to attract FDI in order to promote economic growth and competition. However, through the Investment Canada Act or other statutes, there are provisions that restrict or otherwise prohibit investment in certain sectors (Table 2.6). Provincial and territorial Acts and statutes may also contain provisions that restrict or prohibit investment in some sectors.
2.41. In 2013, pursuant to the Jobs, Growth and Long-term Prosperity Act, changes to the Telecommunications Act were introduced to liberalise foreign investment in the telecommunications industry. In particular, foreign investment restrictions were lifted in June 2012 for telecom companies with a market share of 10% or less, as measured by revenue.20 Companies that grow their market shares in excess of 10% other than by way of merger or acquisitions will continue to be exempt from the restrictions. The Telecommunications Act requires that carriers with more than a 10% market share must be Canadian owned and controlled. Pursuant to section 16 of the Act, Canadian carriers with more than a 10% market share must have at least 80% of their voting shares owned by Canadians, and not less than 80% of the members of their board of directors must be Canadian. In addition, the carrier must not be otherwise controlled by persons that are not Canadians. Further, the Canadian Telecommunications Common Carrier Ownership and Control Regulations establish that investors or holding companies of Canadian carriers will be treated as Canadians if at least 66.66% of their voting shares are held by Canadians. Resellers are not subject to Canadian ownership and control requirements, nor do they apply to satellites, satellite earth stations and international submarine cables.
20 Jobs, Growth and Long-term Prosperity Act, Bill C-38, Part 4, Division 41 and WTO document
S/C/N/679, 26 February 2013.

WT/TPR/S/314 • Canada
- 44 -
Table 2.6 Foreign Investment Restrictions, 2014
Industry sector Provision Reference Fishing Only Canadians or Canadian-controlled
corporations are permitted to obtain fishing licenses. However the regulations specify that the Minister may issue a license to a foreign fishing vessel for certain purposes.
Coastal Fisheries Protection Act
Mining Foreign ownership of uranium mining properties is limited to 49% with the possibility of being exempted from the Policy.
Non-Resident Ownership Policy in the Uranium Mining Sector
Air transport Foreign ownership of airlines is limited to 25%. Notwithstanding the 25% limit on foreign voting interests in Canadian air carriers, many Canadian airlines have adopted variable voting shares. These enable foreign equity investment in an air enterprise beyond the 25% limit, but ensure that at least 75% of the voting interests rest with Canadians. This has allowed these companies to access a larger pool of investors.
"Best practice" as adopted by Canadian carriers to the extent it does not violate the Canada Transportation Act or other legislation
Oil sands Minister of Industry will find the acquisition or control of a Canadian oil sands business by a foreign State-Owned Enterprise to be of net benefit to Canada on an exceptional basis only.
Investment Canada Act
Book publishing and distribution
Foreign investment in new businesses is limited to Canadian-controlled joint ventures, and foreign acquisition of existing businesses is allowed under certain conditions.
Investment Canada Act
Periodical publishing Foreign acquisitions of Canadian-owned and Canadian-controlled periodical publishing businesses are not permitted. Foreign investment in the periodical publishing sector is allowed under certain conditions.
Investment Canada Act
Broadcasting Foreign ownership of broadcasting programming and distribution is limited to 20% of the voting shares.
Broadcasting Act
Film distribution Foreign acquisition of a Canadian-controlled distributor is not allowed. Foreign investment in new distribution businesses is allowed under certain conditions.
Investment Canada Act
Telecommunications Restricts foreign ownership to 20% shares of a telecommunication carrier.
Telecommunication Act
Source: WTO Secretariat, based on information provided by the Canadian authorities.
2.4.4 Investment Promotion
2.42. The Canadian Trade Commission Service (TCS) under the Department of Foreign Affairs, Trade and Development Canada is responsible for foreign direct investment promotion activities on behalf of the government. In fulfilling this role, the TCS promotes Canada's competitive advantages in foreign markets or companies that have a higher propensity to invest in high value sectors, and where Canada offers clear advantages. Trade Commissioners in Canada and abroad serve as advocates and provide advice to potential investors in areas such as establishing a business in Canada, on the various strengths and assets of particular sectors, and on the overall business environment in Canada (e.g., corporate tax rates, business costs, fiscal strength, etc). Trade Commissioners also facilitate introductions to provincial and municipal investment promotion agencies, and direct investors to various mechanisms available from all orders of government to help facilitate the investment. DFATD manages two key funding programmes designed to support Canadian communities in their foreign investment attraction efforts. The Invest Canada-Community Initiatives (ICCI) program provides funding and financial support to communities seeking to improve their capacity to attract, retain and expand FDI in order to create jobs and growth in their jurisdictions. ICCI distributes over Can$3 million annually among 85-90 communities. The Foreign Trade Zones – Marketing Program (FTZ-MP) is a five year pilot programme, with a Can$1 million annual budget, designed to provide funding to regional or community organizations in order to promote investment in Canada's Foreign Trade Zones. No funds have been disbursed as of January 2015.

WT/TPR/S/314 • Canada
- 45 -
2.43. There are five basic funding programmes applicable to all business sectors; these programmes offer incentives such as tax credits, lower taxes, direct funding, and financing support.21 The details of the five programmes are as follows:
• The Scientific Research and Experimental Development (SR&ED) program gives claimants benefits in the form of a refundable investment tax credit, a reduction of taxes payable, or both for their expenditures on eligible research and development (R&D) work done in Canada.
• The Advanced Manufacturing Fund (AMF) promotes continued growth of Ontario's advanced manufacturing sector by supporting efforts to develop cutting-edge technologies and large-scale activities that will improve processes and increase productivity, establish clusters or global supply chains and collaborate with private sector, and research and post-secondary institutions. The programme was launched in December 2013, with a budget of Can$200 million that is being administered by the Federal Economic Development Agency of Southern Ontario over five years, starting in 2014-15.
• The Industrial Research Assistance Program (IRAP) assists firms to develop, adopt and adapt technologies and incorporate them into competitive products and services to be commercialized in the global marketplace. IRAP provides advisory services and funding to help SMEs undertake innovation projects. The programme was launched in 2013, with a budget of Can$20 million that is being administered over three years by the National Research Council.
• Export Development Canada (EDC) provides flexible inbound foreign direct investment financing programmes to support greenfield and brownfield direct investments in Canada. In addition to providing financing support for an investor's initial investment in Canada, EDC also offers highly flexible support to foreign direct investors once they are operating and exporting from Canada through loans, guarantees and lines of credit.
• Business Development Bank of Canada (BDC) offers financing solutions for foreign direct investors specifically tailored to protect cash flow and promote growth. BDC provides financing terms between 4 and 30 years to support investments in land and buildings, equipment or working capital. BDC is also a leader in subordinate financing to help finance fast-growing companies.
21 The Canadian Trade Commissioner Service online information. Viewed at: http://www.trade
commissioner.gc.ca/eng/funding/home.jsp.

WT/TPR/S/314 • Canada
- 46 -
3 TRADE POLICIES AND PRACTICES BY MEASURE
3.1 Measures Directly Affecting Imports
3.1.1 Customs procedures and requirements
3.1. Customs services and other border services (border enforcement, immigration and food safety services) are under the responsibility of the Canadian Border Service Agency (CBSA).1 The Customs Act2 and its implementing regulations are the main legislation governing customs procedures and requirements in Canada. They have not undergone any major change since 2011, except an amendment in 2014 with regards to, inter alia, some provisions concerning the seizure of goods or conveyance, and other provisions for the legal support for the further development of the Advance Commercial Information (ACI) programme. The latter provisions were to be implemented in 2015.
3.2. The objective of the ACI programme is to provide CBSA officers with electronic pre-arrival information, in order to allow them to undertake risk assessments in advance of the arrival of commercial imports into Canada. During the period under review, the CBSA has pursued the implementation of the ACI programme with the rolling out, in 2011, of eManifest, its third and last phase. Under the first two phases, air and marine carriers were required to submit cargo and conveyance information electronically before their arrival. The eManifest programme extended this requirement to carriers for all highway and rail shipments. In addition, freight forwarders and importers are required to submit advance secondary data. The deployment of electronic systems was completed in 2011 for highway carriers and in May 2012 for rail carriers. The eManifest programme is expected to become fully operational in 2016. Timeframes for pre-arrival information are as set out in Table 3.1.
Table 3.1 Timeframes for submission of pre arrival information by mode
Client/type of information Marine Air Rail Highway
Carriers: electronic cargo, conveyance and crew/passenger information
Cargo: 24 hours prior to loading or arrival depending on type and origin of goods. Crew/conveyance: 24 or 96 hours prior to arrival
4 hours prior to arrival or at time of departure
2 hours prior to arrival
1 hour prior to arrival
Freight forwarders: secondary information
24 hours prior to loading or arrival depending on type and origin of goods
4 hours prior to arrival or at time of departure if flight is less than 4 hours in length
2 hours prior to arrival
1 hour prior to arrival (not yet mandatory)
Importers/brokers: advance electronic trade data
24 hours prior to loading or arrival depending on type and origin of goods
4 hours prior to arrival or at time of departure if flight is less than 4 hours in length
2 hours prior to arrival
not required
Source: WTO Secretariat, based on information provided by the Canadian authorities.
3.3. CBSA's risk management approach relies on the National Targeting Center (NTC) and its regional targeting units. At the earliest point in the importation process, the NTC identifies suspected high-risk people, goods and conveyances in order to alert the appropriate CBSA officers of an impending suspected risk or threat to national security and/or public safety priorities. CBSA queries ACI data against an automated risk assessment tool using risk rules for commercial goods. Cargo identified as being high risk is then reviewed by NTC Targeting Officers using various methods such as checks in law enforcement databases to confirm or negate the risk. Goods that are more systematically subject to inspection include food, plant and animal products; goods suspected of contraband; and, goods that may not be in compliance with commercial regulations.
1 Canada Border Services Agency Act, last amended on 10 February 2007. Viewed at: http://laws-
lois.justice.gc.ca/eng/acts/c-1.4/. 2 Customs Act, last amended on 1 January 2015. Viewed at: http://laws-lois.justice.gc.ca/eng/acts/C-
52.6/.

WT/TPR/S/314 • Canada
- 47 -
According to the authorities, between 0.75% and 2% of shipments are subject to physical examination.
3.4. All importers of commercial goods are required to obtain a business number by creating an import/export account with the Canada Revenue Agency (CRA). The business number is generally issued within minutes. Import documentation requirements are broadly the same as at the time of Canada's previous review. These include copies of the cargo control document, the invoice, a Customs Coding Form (Form B3)3, and any other relevant documentation (permit, health certificate, certificate of origin or statement of origin when necessary). The documents can be presented in paper copies, or for authorized users, transmitted using the G7 Electronic Data Interchange (EDI) application. Canada does not have any law or regulation relating to pre-shipment inspection.4
3.5. Importers may use the services of an authorized agent (including customs brokers) to transact with the CBSA. However, they remain responsible for the accuracy and completeness of their transactions. Under the Customs Act, only the owner of a shipment (or a licensed customs broker) can account for goods and pay duties. In particular, separately incorporated divisions of a single company may not transact business on behalf of one another. Customs brokers are licensed by the CBSA.5 Most importers and custom brokers have registered with the CBSA for the Release Prior to Payment (RPP) privilege, and therefore, can obtain the release of their goods prior to the payment of duties and taxes. To be granted this privilege, they have to post a security, the amount of which is based on the average monthly duties and taxes owing (including the goods and services taxes in the case of brokers and non-resident importers), and up to a maximum of Can$10 million.6 About 72% of commercial goods are released using the RPP privilege.
3.6. In addition to the RPP, CBSA is running a number of programmes aiming at facilitating trade and enhancing border security (Table 3.2). Through its Trusted Traders Strategy, qualified companies can benefit from streamlined and more efficient border processes. The Strategy includes the Partners in Protection (PIP), the Customs Self-Assessment (CSA), and the Free and Secure Trade (FAST) programmes.
Table 3.2 CBSA trade facilitation and border security programmes
Programme Description/benefits Eligibility Membership (as of 1 April 2014)
Commercial Driver Registration Program (CDRP)
Provides commercial drivers with access to an expedited border crossing and an extended participation in other programmes.
Citizen or permanent residents of Canada or the United States
..
Release Prior to Payment (RPP) Privilege
Allows importers or customs brokers to obtain release of goods before duties and taxes are paid.
Any importer or customs broker. All goods are eligible (including controlled and regulated goods).
..
Customs Self-Assessment (CSA)
Expedited customs clearance and streamlined accounting and payment process for imported commercial goods from the United States and Mexico by pre-approved importers, carriers and registered drivers. Goods must be shipped directly from the United States or Mexico.
Importers and carriers must undergo a risk-assessment and upgrade their systems to the programme requirements. The programme is available to CDRP-registered drivers only. Prohibited, controlled or regulated imports are not eligible.
96 importers and 901 carriers
3 Two copies of form B3 are required if these documents are presented at a non-automated CBSA office. 4 WTO document G/PSI/N/1/Rev.2, 9 October 2014. 5 A list of licensed brokers is available on the CBSA website. Viewed at: http://www.cbsa-asfc.gc.ca/
services/cb-cd/cb-cd-eng.html. 6 Canada Border Services Agency, Release Prior to Payment Privilege, Memorandum D17-1-8,
11 July 2014. Viewed at: http://www.cbsa-asfc.gc.ca/publications/dm-md/d17/d17-1-8-eng.pdf.
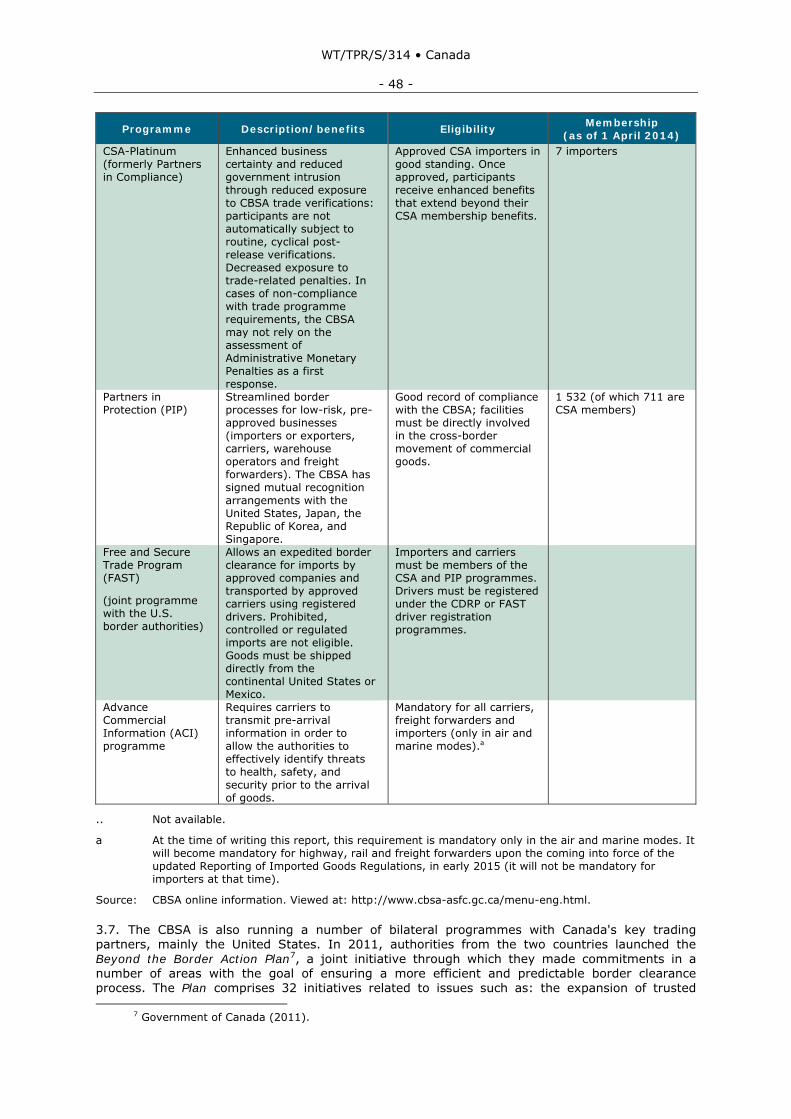
WT/TPR/S/314 • Canada
- 48 -
Programme Description/benefits Eligibility Membership (as of 1 April 2014)
CSA-Platinum (formerly Partners in Compliance)
Enhanced business certainty and reduced government intrusion through reduced exposure to CBSA trade verifications: participants are not automatically subject to routine, cyclical post-release verifications. Decreased exposure to trade-related penalties. In cases of non-compliance with trade programme requirements, the CBSA may not rely on the assessment of Administrative Monetary Penalties as a first response.
Approved CSA importers in good standing. Once approved, participants receive enhanced benefits that extend beyond their CSA membership benefits.
7 importers
Partners in Protection (PIP)
Streamlined border processes for low-risk, pre-approved businesses (importers or exporters, carriers, warehouse operators and freight forwarders). The CBSA has signed mutual recognition arrangements with the United States, Japan, the Republic of Korea, and Singapore.
Good record of compliance with the CBSA; facilities must be directly involved in the cross-border movement of commercial goods.
1 532 (of which 711 are CSA members)
Free and Secure Trade Program (FAST)
(joint programme with the U.S. border authorities)
Allows an expedited border clearance for imports by approved companies and transported by approved carriers using registered drivers. Prohibited, controlled or regulated imports are not eligible. Goods must be shipped directly from the continental United States or Mexico.
Importers and carriers must be members of the CSA and PIP programmes. Drivers must be registered under the CDRP or FAST driver registration programmes.
Advance Commercial Information (ACI) programme
Requires carriers to transmit pre-arrival information in order to allow the authorities to effectively identify threats to health, safety, and security prior to the arrival of goods.
Mandatory for all carriers, freight forwarders and importers (only in air and marine modes).a
.. Not available.
a At the time of writing this report, this requirement is mandatory only in the air and marine modes. It will become mandatory for highway, rail and freight forwarders upon the coming into force of the updated Reporting of Imported Goods Regulations, in early 2015 (it will not be mandatory for importers at that time).
Source: CBSA online information. Viewed at: http://www.cbsa-asfc.gc.ca/menu-eng.html.
3.7. The CBSA is also running a number of bilateral programmes with Canada's key trading partners, mainly the United States. In 2011, authorities from the two countries launched the Beyond the Border Action Plan7, a joint initiative through which they made commitments in a number of areas with the goal of ensuring a more efficient and predictable border clearance process. The Plan comprises 32 initiatives related to issues such as: the expansion of trusted
7 Government of Canada (2011).

WT/TPR/S/314 • Canada
- 49 -
trader and traveller programmes; coordinated investments in infrastructure and technology; the simplification of business reporting requirements; the enhancement of travellers and cargo screening; better information sharing; and the elimination of the duplication of inspections. These initiatives are to be implemented by 2016.
3.8. The authorities noted that progress has been achieved in areas such as the implementation of a common approach to screening travellers through the ongoing implementation of automated sharing of biographic visa, immigration and biometric asylum information on third country nationals, and work on a pre-departure screening system for visa-exempt travellers flying to Canada (largely mirroring existing U.S. systems). Investments in border infrastructure are underway, new benefits have been introduced to the trusted traveller (NEXUS) programme, and trusted trader programmes have been further harmonized and enhanced. CBSA is expected to launch its single window in 2015 with seven of the nine participating departments, with the window becoming fully integrated by mid-2016.
3.9. The Administrative Monetary Penalty System (AMPS) grants the CBSA the mandate to impose monetary penalties to commercial clients, for non-compliance with customs legislation and related regulations. The penalty structure is generally graduated, with higher penalties being assessed for repetition of same infractions. However, the penalty for a single contravention cannot exceed Can$25,000. In assessing penalties, the CBSA takes into consideration factors such as the type, the frequency and the severity of the infraction, and the compliance history of the client. Upon receipt of the CBSA's notice of penalty assessment, the client has 90 days to request a correction or a review (appeal). In such case, the payment of the penalty is deferred until a decision is rendered. A recourse programme is in place to provide clients with a fair and impartial review of decisions and actions taken by CBSA. In January 2011, an Enhanced Complaint Mechanism (ECM) was added to the programme to track and report on complaints, compliments, comments or suggestions from clients. Clients that are unsatisfied with the decision may appeal to the Federal Court. There has been no major review to the AMPS since 2011.
3.1.2 Customs valuation
3.10. The main pieces of legislation governing customs valuation are provided for in the Customs Act (Part III), the Valuation for Duty Regulations8, and the D-13 series memoranda.9
3.11. For all imported goods, importers are required to declare a value in local currency at the Bank of Canada's exchange rate prevailing on the date of direct shipment of the goods.10 Customs duties are assessed on an f.o.b. basis using primarily the transaction value. Where this method cannot be used, other methods are resorted to, in the order of hierarchy set out in the WTO Customs Valuation Agreement. CBSA's valuation officers review the declared value, generally through a risk-based post-importation verification and based on the client's records. The CBSA may re-determine or further re-determine the origin, tariff classification, and/or value for duty on its own initiative or in response to a self-adjustment. Re-determinations (or further redeterminations) must be made within four years after the date of the initial determination.11 Customs officers must notify importers of their decisions and the rationale for them. In most cases, importers may request a re-determination or a further re-determination (as an administrative appeal), of the customs value within 90 days of the notification of a decision by the CBSA.
3.12. Importers may appeal the CBSA's decisions to the Canadian International Trade Tribunal (CITT) within 90 days. CITT decisions may be appealed to the Federal Court of Appeal and, beyond that, the Supreme Court of Canada. The most frequent court challenges on valuation issues have been cases relating to: post-importation payments, distribution fees, sales for export, and the application of Article 5 of the WTO Customs Valuation Agreement. Between 2011 and 2014, nine
8 Valuation for Duty Regulations, SOR/86-792. 9 The series of D-13 Memoranda contain regulations, policies and procedures used by the borders
agency in the valuation of goods. Viewed at: http://www.cbsa-asfc.gc.ca/publications/dm-md/d13/d13-1-3-eng.html.
10 Exchange Rate for the Calculation of the Value for Duty Under the Customs Act. Memorandum D13-2-3.
11 Canada Border Services Agency, Memorandum D11-6-6, 12 April 2013. Viewed at: http://www.cbsa-asfc.gc.ca/publications/dm-md/d11/d11-6-6-eng.pdf.

WT/TPR/S/314 • Canada
- 50 -
appeals related to valuation issues have been filed at the CITT. Of the decisions rendered by CITT, two were further appealed at the Federal Court of Appeal. All appeals but three dealt with the application of the transaction value method. No appeals have been filed at the Supreme Court of Canada in regards to valuation issues.
3.1.3 Rules of origin
3.13. Canada's non-preferential rules of origin are in place to, inter alia, distinguish MFN imports from those under the General Tariff. There have been no changes in the MFN rules of origin since the previous review. For goods to qualify for MFN tariff treatment, at least 50% of their production cost must be incurred by the industry of one or more MFN beneficiaries (including Canada). In addition, goods must be finished in a country receiving MFN treatment in the form in which they are to be imported in Canada.12 Preferential rules of origin vary across preferential agreements (Table 3.3). FTA rules of origin are largely based on a tariff-shift methodology. In some cases, they contain a process, value, weight or volume requirement.
Table 3.3 Overview of preferential rules of origin criteria, 2014
Preferential programme or partner
Brief overview
General Preferential Tariff (GPT)
The value of non-originating materials must not exceed 40% of the ex-factory price (SOR/2013-165).
Least Developed Country Tariff (LDCT)
The value of non-originating materials must not exceed 60% of the ex-factory price (75% threshold for some apparel and made-up textile articles) (SOR/2013-165).
Commonwealth Caribbean Countries Tariff (CCCT)
The value of non-originating materials must not exceed 40% of the ex-factory price (SOR/98-36).
Australia Tariff (AUT) and New Zealand Tariff (NZT)
No less than 50% of the cost of production of the goods must be incurred by domestic industries (SOR/98-35).
NAFTA
Product-specific rules of origin based on tariff shift, and in some cases contain a process, value, weight or volume requirement.
Chile
Colombia
Costa Rica
Panama
Peru
Israel
EFTA (Iceland, Liechtenstein, Norway and Switzerland)
Jordan
Honduras
Republic of Korea
Source: Based on DFAIT online information. Viewed at: http://www.international.gc.ca/apec/tariffs-tarifs.aspx?lang=eng.
3.14. Goods eligible for MFN treatment, the Australia tariff or the New Zealand tariff are not required to present a certificate of origin. Their importation is not subject to any particular requirement besides indicating the beneficiary country on the invoice or on any documentation submitted for the clearance of the goods. Imports under the other agreements require certificates of origin. These certificates are agreement-specific and must be provided by the importer in the case of free trade agreements. A statement of origin from the exporter or producer may be acceptable for low value shipments. For most FTAs, shipments with a value of Can$1,600 or less are considered as low value shipments. The thresholds for NAFTA and Republic of Korea are respectively Can$2,500 and US$1,000 (or an equivalent value in domestic currency). For other
12 The official version of the MFN tariff rules of origin Regulations may be found on the Department of Justice website. Viewed at: http://laws-lois.justice.gc.ca/eng/regulations/SOR-98-33/page-1.html.

WT/TPR/S/314 • Canada
- 51 -
tariff treatment (GPT, CCCT, and LDCT), the certificate of origin (or a statement of origin) must be issued by the exporter. There is no requirement to have the certificate of origin stamped or signed by an authority in the country of origin.
3.1.4 Tariffs
3.15. Customs import duties accounted for less than 2% of Canada's total tax revenues.13 Canada regularly submits its customs tariff and trade data to the WTO Integrated Data Base.14
3.16. The customs tariff comprises the General Tariff, the MFN tariff, and several preferential tariff treatments granted under bilateral or plurilateral agreements, or unilateral concession schemes. The General Tariff has a flat rate of 35% (or the MFN rate, whichever is higher), and is in principle, applicable to non-WTO Members. In practice, Canada grants at least the MFN tariff treatment to all its trading partners, except the Democratic Republic of Korea, so this country would be the only one subject to the General Tariff.
3.1.4.1 Applied MFN rate
3.17. Canada's 2014 tariff is based on the 2012 Edition of the Harmonized System nomenclature (HS 2012). The eight-digit level tariff has 7,251 lines, 941 lines less than the tariff at the time of the previous review, which was based on HS 2007 (Table 3.4).
Table 3.4 Structure of the MFN tariff schedule, selected yearsa
(%) 2006 2010 2014 1. Total number of tariff lines 8,455 8,192 7,251 2. Non-ad valorem tariffs (% of all tariff lines) 3.8 3.4 3.9 3. Non-ad valorem with no AVEs (% of all tariff lines) 0.5 2.1 0.9 4. Lines subject to tariff quotas (% of all tariff lines) 2.1 2.2 2.6 5. Duty free tariff lines (% of all tariff lines) 52.7 68.6 67.0 6. Dutiable lines tariff average rate (%) 13.7 17.5 18.3 7. Simple average tariff (%) 6.5 5.4 6.0 8. WTO agriculture 22.4 22.5 22.5 9. WTO non-agriculture (including petroleum) 3.8 2.5 2.4 10. Agriculture, hunting, forestry and fishing (ISIC 1) 7.4 7.1 7.9 11. Mining and quarrying (ISIC 2) 0.7 0.2 0.2 12. Manufacturing (ISIC 3) 6.5 5.4 6.0 13. First stage of processing 4.8 4.5 5.4 14. Semi-processed products 3.2 1.2 0.8 15. Fully processed products 8.7 8.3 9.0 16. Domestic tariff "peaks" (% of all tariff lines)b 1.8 5.7 2.2 17. International tariff "peaks" (% of all tariff lines)c 6.5 6.4 7.1 18. Overall standard deviation 25.3 25.7 28.6 19. Nuisance applied rates (% of tariff lines)d 1.0 0.6 4.0
20. Bound tariff lines (% of all tariff lines) 99.7 99.5 99.7
a The tariff is provided at the eight-digit level. Averages exclude in-quota rates and lines. Calculations include ad valorem equivalents (AVEs) for non-ad valorem duties where it was possible to estimate them.
b Domestic tariff peaks are defined as whose exceeding three times the overall average applied rate. c International tariff peaks are defined as those exceeding 15%. d Nuisance rates are greater than 0% but inferior or equal to 2%.
Source: WTO Secretariat calculations, based on data provided by the Canadian authorities.
3.18. The lower number of tariff lines in HS 2012 was the result of a tariff simplification process undertaken by Canada in 2012 as part of an effort to streamline Canadian import processes, and coincided with the introduction of new tariff items for non-commercial courier and postal imports valued at Can$500 or less, effective 1 January 2012. The grouping of products into these new
13 Department of Finance (2014). 14 WTO document G/MA/IDB/2/Rev.40, 16 October 2014.

WT/TPR/S/314 • Canada
- 52 -
generic tariff items (tariff codes 9825.10, 9825.20, and 98.2530) responded to the desire to ease the duty calculation and administrative processes of importing goods by Canada-based consumers from foreign mail-order and e-commerce retailers. The rules for the application are detailed in Chapter 98 of the 2012 Customs Tariff. The use of these codes is optional.15 Thousands of HS codes were simplified under these three generic tariff items and tariffs of 5% or less were eliminated:
a. Goods classified under Chapters 1 to 97 which were assessed customs duty under the MFN rate within 5 percentage points above or below 20%, are now subject to a generic MFN rate of 20%. Goods that fall into this category include bedding, clothing, and footwear.
b. Goods classified under Chapters 1 to 97 which were assessed customs duty under the MFN rate within 5 percentage points above or below 8%, are subject to a generic MFN rate of 8%. Goods that fall into this category include automotive parts, beauty products, foodstuffs, jewelry, musical instruments, sporting equipment, and tableware.
c. Goods classified under Chapters 1 to 97 which were assessed customs duty under the MFN rate within 5 percentage points more or less of 5%, are subject to a generic MFN rate of 0%. Goods that fall into this category include automotive engine components and bicycle parts.
3.19. In general, the rate of customs duty applied under this tariff initiative cannot be less than or greater than 5 percentage points than the rate provided under the provisions of Chapters 1 - 97 of the Customs Tariff, although some exceptions are allowed where the rule cannot apply (i.e. a tariff rate of 14% would drop to 8%). The generic classifications parallel existing generic classifications under heading 98.26 used for goods imported by travellers. Alcoholic beverages, tobacco products and other goods subjected to additional customs duty and taxes are not eligible for the new tariff initiative, nor are goods that are restricted, controlled or regulated.
3.20. The process of tariff simplification adds to previous unilateral liberalization efforts. As a result of the 2009 Budget and its implementing legislation, MFN duty rates were reduced to zero on 214 tariff lines relating to machinery and equipment. In the 2010 Budget, the Federal Government announced that an additional 1,541 tariff lines relating to manufacturing inputs and machinery and equipment would be set equal to zero: 1,160 of these were reduced to zero in March 2010, and the remaining 381 were fully liberalized as of January 2015.
15 Chapter 98 of the Customs Tariff is a Special Classification Provision used only for non-commercial
goods; it is a relief provision and it is optional.

WT/TPR/S/314 • Canada
- 53 -
Chart 3.1 Frequency distribution of MFN tariff rates, 2014
(67.0%)
(8.7%)
(13.9%)
(3.1%)(5.1%)
(0.3%) (1.7%) (0.1%) (0.1%)0
10
20
30
40
50
60
70
80
90
100
0
1,000
2,000
3,000
4,000
5,000
6,000
Duty free >0 - 5 >5 - 10 >10 - 15 >15 - 20 >20 - 25 >25 Specific dutywith no AVE
No rate
Number of tariff linesa Per cent
Cumulative %
Number of lines (% of total)
a The total number of lines is 7,251 with 6,968 ad valorem lines, 283 non-ad valorem lines, and
6 empty lines applying to preferential quota from Peru only.
Source: WTO Secretariat calculations, based on data provided by the Canadian authorities.
3.21. The 2014 applied MFN tariff (including AVEs) has rates ranging from 0 to 532.2%16, with a simple average tariff rate estimated at 6% (Table 3.5).17 The average applied tariff for agricultural products (WTO definition) stood at 22.5%.
Table 3.5 Summary analysis of MFN tariff, 2014
Description
MFNa Final bounda
No. of lines
Average(%)
Range (%)
Coefficient of
variation
Average
(%)
Total 7,251 6.0 0 - 532.2 4.8 8.1 HS 01-24 1,482 19.3 0 - 391.6 3.0 22.3 HS 25-97 5,769 2.6 0 - 532.2 3.6 5.6 By WTO category WTO Agriculture 1,302 22.5 0 - 532.2 2.9 23.7 - Animals and products thereof 178 47.0 0 - 391.6 1.9 52.9 - Dairy products 38 238.7 0.8 - 313.5 0.3 237.4 - Fruit, vegetables and plants 368 4.3 0 - 19 1.2 4.7 - Coffee and tea 31 18.5 0 - 265 3.5 19.6 - Cereals and preparations 223 28.2 0 - 388.3 2.3 31.4 - Oil seeds, fats and oils and their products
102 6.0 0 - 218 3.8 7.4
- Sugars and confectionary 48 4.1 0 - 12.5 0.9 5.4 - Beverages, spirits and tobacco 140 5.1 0 - 256 4.3 7.7 - Cotton 5 0.0 0 - 0 n.a. 1.3 - Other agricultural products n.e.s. 169 9.8 0 - 532.2 5.3 8.2 WTO Non-agriculture (including petroleum)
5,949 2.4 0 - 25 2.0 5.4
16 The highest rate of 532.2% is the AVE of the over access commitment duty rate of Can$6.12/kg,
applicable to dried egg albumin (3202.11.20). Within access commitment rate of duty is 8.5% (ad valorem). 17 Ad valorem equivalents (AVEs) of non-ad valorem tariffs have been estimated using 2013 import
price data when available. However, it was not possible to estimate the ad valorem equivalents of 64 tariff lines due to the absence of imports.

WT/TPR/S/314 • Canada
- 54 -
Description
MFNa Final bounda
No. of lines
Average(%)
Range (%)
Coefficient of
variation
Average
(%)
- WTO Non-agriculture (excluding petroleum)
5,936 2.4 0 - 25 2.0 5.4
- - Fish and fishery products 256 1.2 0 - 11 1.9 1.5 - - Minerals and metals 1,040 1.2 0 - 15.5 2.2 2.8 - - Chemicals and photographic supplies
965 1.0 0 - 15.5 2.3 4.7
- - Wood, pulp, paper and furniture 291 1.2 0 - 15.5 2.3 1.9 - - Textiles 1,028 2.4 0 - 18 2.1 10.7 - - Clothing 260 15.9 0 - 18 0.3 16.8 - - Leather, rubber, footwear and travel goods
255 4.6 0 - 20 1.5 7.3
- - Non-electric machinery 644 0.6 0 - 9 3.2 3.6 - - Electric machinery 403 1.3 0 - 9 2.0 4.7 - - Transport equipment 222 5.6 0 - 25 1.2 5.8 - - Non-agriculture articles n.e.s. 572 2.9 0 - 18 1.4 4.4 - Petroleum 13 1.2 0 - 5 1.8 6.8 By ISIC sectorb Agriculture and fisheries 498 7.9 0 - 292.5 4.3 7.2 Mining 98 0.2 0 - 12.5 6.5 1.6 Manufacturing 6,654 6.0 0 - 532.2 4.8 8.3 By HS section 01 Live animals & products 408 39.8 0 - 391.6 2.2 55.0 02 Vegetable products 467 5.8 0 - 388.3 3.7 6.0 03 Fats & oils 68 8.9 0 - 218 3.0 10.4 04 Prepared food etc. 539 16.6 0 - 281.1 3.1 19.6 05 Minerals 158 0.4 0 - 12.5 4.8 2.2 06 Chemical products 876 2.1 0 - 532.2 10.0 4.9 07 Plastics and rubber 302 1.6 0 - 15.5 1.9 6.1 08 Hides and skins 98 3.1 0 - 15.5 1.5 5.5 09 Wood and articles 133 2.2 0 - 11 1.4 4.0 10 Pulp, paper etc. 141 0.0 0 - 0 .. 0.0 11 Textile and articles 1,246 5.0 0 - 18 1.5 11.9 12 Footwear, headgear 100 9.7 0 - 20 0.8 12.1 13 Articles of stone 168 2.1 0 - 15.5 1.5 4.3 14 Precious stones, etc. 60 1.7 0 - 8.5 1.8 3.2 15 Base metals and products 669 1.3 0 - 11 2.1 2.9 16 Machinery 1,056 0.8 0 - 9 2.6 4.0 17 Transport equipment 238 5.4 0 - 25 1.2 5.6 18 Precision equipment 289 1.7 0 - 14 1.8 3.2 19 Arms and ammunition 29 3.8 0 - 7.5 0.7 4.9 20 Miscellaneous manufactures 197 4.4 0 - 18 1.1 6.6 21 Works of art, etc. 9 1.4 0 - 7 1.9 1.6 By stage of processing First stage of processing 883 5.4 0 - 292.5 5.5 5.3 Semi-processed products 2,221 0.8 0 - 270 8.7 5.4 Fully-processed products 4,147 9.0 0 - 532.2 3.9 10.2
n.a. Not applicable.
a Bound rates are provided in HS07 classification and applied rates in HS2012; therefore there may be a difference between the number of lines included in the calculation.
b ISIC (Rev.2) classification, excluding electricity (1 line).
Source: WTO Secretariat estimates, based on data provided by the Canadian authorities.

WT/TPR/S/314 • Canada
- 55 -
3.1.4.2 WTO bindings
3.22. Following the Uruguay Round, Canada bound all tariff lines in HS Chapters 1-97, except 24 tariff lines.18 Transposed to the 2014 tariff schedule, the average bound rate is 8.1% (Table 3.5). For one tariff line where the bound rate is specific, the applied MFN rate appears to exceed the bound rate once the AVE of the bound rate is calculated (Table 3.6).19 There are also five further tariff lines for which applied rates are marginally higher than bound rates, due to rounding.
Table 3.6 Tariff lines where applied rates exceed bound rates, 2014
HS code MFN description MFN duty MFN AVE
MFN quota Bound duty Bound
AVE A. Apparently above binding (AVE calculation) 16023991 Other prepared or preserved
meat, meat offal or blood. - Of poultry of heading 01.05: - Other - Other: - Of ducks, geese or guinea fowls, in cans or glass jars
9.5 8% but not <7.05¢/kg or >14.11¢/kg
3.8
B. Apparently due to rounding 02071422 (Spent fowl) Livers: Over access
commitment 238% but not less than Can$6.45/kg
391.6 O 238.3% but not <644.7¢/kg
391.4
02071493 (Spent fowl) Other: Over access commitment, boneless
249% but not less than Can$6.74/kg
346.9 O 249.0% but not <673.5¢/kg
346.7
04081920 (Hatching for broilers) Over access commitment
Can$1.52/kg 53.7 O 151.7¢/kg 53.6
04089920 (Hatching for broilers) Over access commitment
Can$1.52/kg 47.7 O 151.7¢/kg 47.6
35021920 Over access commitment Can$1.52/kg 168.9 O 151.7¢/kg 168.6
O Out-of-quota.
Source: WTO Secretariat estimates, based on data provided by the Canadian authorities.
3.1.4.3 Preferential tariffs
3.23. About two-thirds of Canada's MFN lines are duty free. With some exceptions, Canada's FTAs generally led to a substantial liberalization of its tariff regime with duty free treatment covering above 90% of tariff lines in most cases (Table 3.7). Exceptions to this are the agreements with Australia and New Zealand, where about 68.7% of tariff lines covered are granted duty free treatment. The simple average tariff rate for preferential tariff partners range from 3.1% (United States) to 5.7% (Australia and New Zealand). If the average preferential tariff remains relatively high on agricultural products (WTO definition), it is close to zero for non-agricultural products, except in the trade agreements with Australia and New Zealand.
18 The unbound lines cover mineral oils and fuels and electrical energy (12 lines); cruise ships, tankers,
tugs, and drilling and platform ships (11 lines); and postage stamps. 19 At the time of the previous Review, MFN rates appeared to exceed bound rates for the following
products (HS07 codes in brackets): canner pack of turkeys (0207.2512); other egg yolks (0408.1920); other eggs (0408.9920); other prepared meals (1602.3214); reconstituted apple juice (2009.7110); and other egg albumin (3502.1920). Source: WTO (2011).

WT/TPR/S/314 • Canada
- 56 -
Table 3.7 Canada's preferential tariffs, 2007 and 2014
Average tariff (%)
Preferential regime
Duty free tariff
lines (in % of total
Total WTO agriculture
WTO non-agriculture
Year 2014 2007 2014 2007 2014 2007 2014 NAFTA - United States 98.5 2.6 3.1 17.7 17.6 0.0 0.0 - Mexico 97.9 2.6 3.2 17.9 17.7 0.0 0.0 Other reciprocal treatments - Chile 98.5 2.6 3.1 17.5 17.4 0.0 0.0 - Israel 91.6 3.2 3.9 21.3 21.5 0.0 0.0 - Costa Rica 96.4 2.9 3.3 18.0 17.7 0.3 0.2 - Australia 68.7 5.2 5.7 22.3 22.3 2.2 2.1 - New Zealand 68.8 5.2 5.7 22.2 22.3 2.2 2.1 - Iceland 95.3 3.0 3.7 20.1 20.4 0.0 0.0 - Norway 92.3 3.2 3.9 21.7 21.7 0.0 0.0 - Switzerland and Liechtenstein 92.1 3.2 3.9 21.8 21.8 0.0 0.0 - Peru 97.9 2.7 3.2 17.9 17.8 0.1 0.0 - Colombia 97.3 n.a. 3.3 n.a. 17.9 n.a. 0.1 - Jordan 98.5 n.a. 3.2 n.a. 17.7 n.a. 0.0 - Panama 97.7 n.a. 3.2 n.a. 18.1 n.a. 0.0 Non-reciprocal treatments - GPT 73.7 4.8 5.3 21.7 21.7 1.8 1.7 - LDCT 98.6 2.6 3.1 17.7 17.6 0.0 0.0 - Commonwealth Caribbean countries
89.1 4.0 4.4 19.0 19.3 1.3 1.2
MFN average (memorandum item)
67.0 5.4 6.0 22.5 22.5 2.5 2.4
Source: WTO Secretariat estimates, based on data provided by the Canadian authorities.
3.24. Between 2011 and 2014, free trade agreements with Colombia, Jordan and Panama came into force. Upon entry into force of the FTA with Colombia in April 2011, Canada extended its duty-free treatment to an additional 28.8% of its tariff lines.20 Combined with MFN-based liberalization, whereby 67% of lines are duty-free, 97.3% of imports from Colombia benefited from duty free treatment in 2011. Most of the remaining tariff elimination is to take place until 2017. Upon full implementation of the agreement by Canada in 2027, it is expected that only 117 tariff lines (mostly supply-managed products) will remain dutiable.
3.25. Under the Canada-Jordan FTA, Canada provided duty-free treatment to all imports from Jordan, except products that are subject to WTO tariff rate quotas.21 As of 2014, 98.5% of tariff lines were subject to a duty-free treatment by Canada. Similarly, 97.7% of Canada's tariff lines are duty free under the FTA with Panama.
3.26. Non-reciprocal tariff preferences are granted under the General Preferential Tariff (GPT), the Commonwealth Caribbean Country Tariff (CARIBCAN), and the Least-Developed Country Tariff (LDCT). Canada has completed a review of its GPT regime in 201322, leading to the withdrawal of the GPT treatment from 72 trading partners considered as higher income or trade-competitive countries.23 Equatorial Guinea and the Maldives, which are respectively classified as high and
20 WTO document WT/REG301/1, 26 June 2012. 21 WTO document WT/REG335/1/Rev.1, 22 April 2014. 22 General Preferential Tariff Withdrawal Order (2013 GPT Review), SOR/2013-161. Viewed at:
http://laws-lois.justice.gc.ca/PDF/SOR-2013-161.pdf. 23 For the purpose of GPT benefits, higher income countries are those that have been classified for two
consecutive years as high income or upper-middle income economies according to the latest World Bank
WT/TPR/S/314 • Canada
- 57 -
upper-middle income countries by the World Bank, were removed from the LDCT because of their graduation from the LDC status.24 Starting in 2015, 104 countries are eligible to the GPT, of which 48 are eligible to the LDCT.
3.1.4.4 Tariff remission
3.27. Two pieces of legislation provide for the remission of customs duties: the Customs Tariff and the Financial Administration Act (FAA). Remissions can also be granted on the basis of administrative circumstances, for instance, when incorrect information has been supplied by a CBSA official to a client. Tariff remissions are generally proposed in situations where it is not appropriate to provide relief by other means, such as statutory tariff amendments or through another Order.
3.28. Requests for tariff remission are generally handled on a case-by-case basis. However, a sectorial approach has been taken recently in the case of some imported cargo vessels, tankers and ferries.25 Applications based on administrative circumstances are handled by the CBSA's Tariff Policy Division while applications based on the provisions of the Customs Tariff or the FAA are to be submitted to the Department of Finance. For the fiscal year 2012-13, the total value of tariff remissions granted under the FAA increased by 72.8% to Can$681 million (Chart 3.2). This surge reflects remission provided for the repair abroad of aircraft, aircraft engines and flight simulators.26 Tariff remissions granted under the Customs Tariff declined for two consecutive years to Can$58 million in 2012-13.
3.29. Under the Duty Deferral Program (DDP), the CBSA runs a subset of programmes that offer businesses relief from the payment of most import duties and taxes on goods that are ultimately exported. Canada's DDP includes: the Duties Relief Program; the Duty Drawback Program; and the Customs Bonded Warehouse Program. Canada's Duties Relief Program covers a wide range of processing functions, including full-fledged manufacturing. The Duty Drawback Program is restricted to products re-exported either in the same state or after a limited manufacturing process. Through the Customs Bonded Warehouse Program, importers may qualify for a complete deferral of customs, anti-dumping and countervailing duties and excise duties and taxes, including the goods and services tax and the harmonized sales tax. While the goods are in the warehouse, they may undergo certain minor manipulations such as marking, labelling, testing, inspection, packaging, display, dilution, normal servicing and maintenance, grading, shorting, trimming, slitting or cutting and repackaging.27 Non-residents can apply to operate a bonded warehouse in Canada. Under these programmes, the export operation generally has to take place within four years from the date the goods enter Canada.
income classifications. Trade-competitive countries are those that account for 1% or more of world exports for two consecutive years according to the latest WTO statistics.
24 Least Developed Country Tariff Withdrawal Order (2013 GPT Review), SOR/2013-162. Viewed at: http://laws-lois.justice.gc.ca/PDF/SOR-2013-162.pdf.
25 Prior to 2010, duty remission requests on imported vessels were considered on a case-by-case basis. In 2010, the Federal Government issued the Ferry-Boats, Tankers and Cargo Vessels Remission Order, systematically granting remission of the 25% import duties to any cargo vessel, tanker, and ferry of a length of 129 meters or more.
26 Repair Abroad of Canadian Civil Aircraft, Canadian Aircraft Engines and Flight Simulators Remission Order. SI/82-131. Viewed at: http://laws-lois.justice.gc.ca/eng/regulations/SI-82-131/FullText.html.
27 CBSA online information. Viewed at: http://www.cbsa-asfc.gc.ca/import/ddr-red/tab8-eng.html.

WT/TPR/S/314 • Canada
- 58 -
Chart 3.2 Remission of taxes and duties, 2004-13
(Can$ million)
201
450 436352
499
405 406 394
681232
132 158
135
32
89145
91
58
0
100
200
300
400
500
600
700
800
2004-05 2005-06 2006-07 2007-08 2008-09 2009-10 2010-11 2011-12 2012-13
under the Financial Administration Act (Section 23) under the Customs Tariff (Section 115)
Source: Public Accounts of Canada online information. Viewed at: http://tpsgc-pwgsc.gc.ca/recgen/cpc-
pac/index-eng.html.
3.1.5 Other charges affecting imports
3.1.5.1 The GST/HST and provincial sales taxes
3.30. The Goods and Services Tax (GST) is Canada's largest indirect tax by revenue. It generated nearly Can$31 billion during the 2013/14 fiscal year, representing about two-thirds of indirect tax revenue and 14.1% of total tax revenues.28 The GST is a value-added tax levied on most goods and services at a rate of 5%.29 For imported goods, the tax is calculated on the same basis as imports duties, and is generally levied at the time of importation. GST relief is granted for some imported goods such as prescription drugs, medical and assistive devices, basic groceries, agriculture, and fishing goods.30
3.31. Some provinces and territories levy a sales tax in addition to the GST, at rates that vary between 5% and 10% (Chart 3.3). Some provinces have consolidated their sales tax with the GST into a Harmonized Sales Tax (HST) that generally shares the same tax base as the GST.31 The resulting HST comprises the 5% GST and a provincial component. Most imported commercial goods are relieved of the provincial component of the HST. Different exemption regimes apply under each of the provincial sales tax regimes. There is no provincial sales tax in Alberta, the Northwest Territories, Nunavut, and Yukon.
28 Department of Finance (2014), Fiscal Reference Tables, October. Viewed at: http://www.fin.gc.ca/frt-
trf/2014/frt-trf-14-eng.asp. 29 The GST also applies to supplies of real property and intangible property such as trademarks, rights
to use a patent, and Internet downloads. 30 A detailed list of exempted goods is provided under the Schedules VI and VII of the Excise Tax Act. 31 These are: New Brunswick, Newfoundland and Labrador, Nova Scotia, Ontario, and Prince Edward
Island (since April 2013). British Columbia adopted the HST in 2010, but returned to the GST in April 2013.

WT/TPR/S/314 • Canada
- 59 -
Chart 3.3 GST/HST and provincial sales tax rates, December 2014
8%
8%
10%
8%
9%
7%
8%
9.975%
5%
0% 2% 4% 6% 8% 10% 12% 14% 16%
Alberta
British Columbia
Manitoba
New Brunswick
Newfoundland and Labrador
Northwest Territories
Nova Scotia
Nunavut
Ontario
Prince Edward Island
Quebec
Saskatchewan
Yukon
GST Provincial component (if HST) Provincial Sales Tax
Source: Canada Revenue Agency online information. Viewed at: http://www.cra-arc.gc.ca/tx/bsnss/tpcs/gst-tps/rts-eng.html.
3.32. Some provinces have increased their sales taxes over the past three years. In Quebec, the tax was raised by one percentage point in 2012 to 9.5%, and then to 9.975% effective January 2013. Manitoba also increased its sales taxes by 1 percentage point to 8% as of 1st July 2013.
3.33. GST/HST exemption is available to some businesses, under a number of programmes such as the Export Distribution Centre Program (EDCP) or the Exporters of Processing Services Program (EOPS). Both programmes are provided for under the Excise Tax Act, and administered by the Canada Revenue Agency (CRA).
3.34. Under the EDCP, authorized businesses may use their authorization number to obtain relief from the GST/HST on their imports and their domestic purchases of goods (worth Can$1,000 or more), provided that they process them to add "limited value" and export them. The processing should not substantially alter the goods; it may encompass activities such as distributing, disassembling, reassembling, displaying, inspecting, labelling, packing, storing, testing, cleaning, diluting, maintaining and servicing, preserving, sorting, grading, trimming, filing, slitting or cutting. The value added through these services should generally not exceed 20% of the final value of the goods. The programme is restricted to businesses operating substantially in commercial activities that derive at least 90% of their revenues from export sales.
3.35. Under the EOPS programme authorized operators may use their EOPS authorization number to obtain relief from the payment of the GST/HST on non-residents' goods imported for the purpose of supplying a range of services to a foreign customer. Eligible services include storage, distribution, processing, manufacturing or production. The goods must remain the property of a non-resident, and be exported within four years of their entry into Canada. Contrary to the EDCP, the EOPS programme does not impose any requirement in terms of export sales or value-added. Applications for both programmes are reviewed by the CRA. Authorizations must be renewed every three years.
3.1.5.2 Excise taxes and duties
3.36. The Excise Act, 2001 provides for the imposition of an excise duty on domestic and imported spirits, wine, beer, and tobacco products (Table 3.8). Reduced rates (or exemptions)
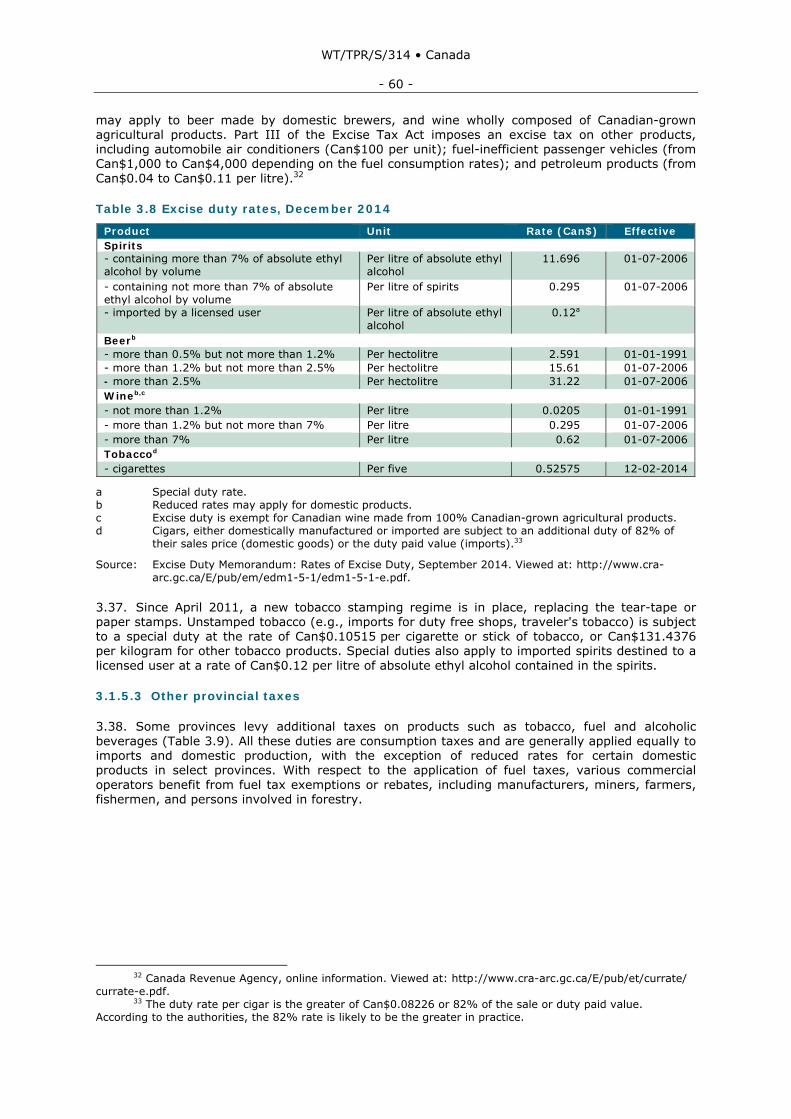
WT/TPR/S/314 • Canada
- 60 -
may apply to beer made by domestic brewers, and wine wholly composed of Canadian-grown agricultural products. Part III of the Excise Tax Act imposes an excise tax on other products, including automobile air conditioners (Can$100 per unit); fuel-inefficient passenger vehicles (from Can$1,000 to Can$4,000 depending on the fuel consumption rates); and petroleum products (from Can$0.04 to Can$0.11 per litre).32
Table 3.8 Excise duty rates, December 2014
Product Unit Rate (Can$) Effective Spirits - containing more than 7% of absolute ethyl alcohol by volume
Per litre of absolute ethyl alcohol
11.696 01-07-2006
- containing not more than 7% of absolute ethyl alcohol by volume
Per litre of spirits 0.295 01-07-2006
- imported by a licensed user Per litre of absolute ethyl alcohol
0.12a
Beerb - more than 0.5% but not more than 1.2% Per hectolitre 2.591 01-01-1991- more than 1.2% but not more than 2.5% Per hectolitre 15.61 01-07-2006- more than 2.5% Per hectolitre 31.22 01-07-2006Wineb,c - not more than 1.2% Per litre 0.0205 01-01-1991 - more than 1.2% but not more than 7% Per litre 0.295 01-07-2006 - more than 7% Per litre 0.62 01-07-2006 Tobaccod - cigarettes Per five 0.52575 12-02-2014
a Special duty rate. b Reduced rates may apply for domestic products. c Excise duty is exempt for Canadian wine made from 100% Canadian-grown agricultural products. d Cigars, either domestically manufactured or imported are subject to an additional duty of 82% of
their sales price (domestic goods) or the duty paid value (imports).33
Source: Excise Duty Memorandum: Rates of Excise Duty, September 2014. Viewed at: http://www.cra-arc.gc.ca/E/pub/em/edm1-5-1/edm1-5-1-e.pdf.
3.37. Since April 2011, a new tobacco stamping regime is in place, replacing the tear-tape or paper stamps. Unstamped tobacco (e.g., imports for duty free shops, traveler's tobacco) is subject to a special duty at the rate of Can$0.10515 per cigarette or stick of tobacco, or Can$131.4376 per kilogram for other tobacco products. Special duties also apply to imported spirits destined to a licensed user at a rate of Can$0.12 per litre of absolute ethyl alcohol contained in the spirits.
3.1.5.3 Other provincial taxes
3.38. Some provinces levy additional taxes on products such as tobacco, fuel and alcoholic beverages (Table 3.9). All these duties are consumption taxes and are generally applied equally to imports and domestic production, with the exception of reduced rates for certain domestic products in select provinces. With respect to the application of fuel taxes, various commercial operators benefit from fuel tax exemptions or rebates, including manufacturers, miners, farmers, fishermen, and persons involved in forestry.
32 Canada Revenue Agency, online information. Viewed at: http://www.cra-arc.gc.ca/E/pub/et/currate/
currate-e.pdf. 33 The duty rate per cigar is the greater of Can$0.08226 or 82% of the sale or duty paid value.
According to the authorities, the 82% rate is likely to be the greater in practice.

WT/TPR/S/314 • Canada
- 61 -
Table 3.9 Overview of some selected provincial taxes and mark ups, December 2014
(Can$)
Cigarette (Can$/ unit)
Cigars (rate)
Other tobacco (Can$/ gram)
Fuel tax
Carbon tax Spirits Wine Sparkling
wine Beer
Alberta 0.20 103% 0.20-0.30 0.09 0.09 15¢/oz 10¢/oz 15¢/oz 1¢/ozBritish Columbia
0.24 (↑) 90.5% (↑)
0.24 (↑) 0.21 0.23 150%, of value for GST; mark up: $13.19/l to $40.00/l
85% of value for GST; mark up: $2.44/l to $17/l
85% of value for GST; mark up: $2.44/l to $17/l
55% of value for GST, min. mark up $1.13/l
Manitoba 0.29 (↑) 75% 0.28 (↑) 0.14 (↑)
0.14 (↑) 124% of value for GST and $1.12/l
66% of value for GST and $1.12/l
72% of value for GST and $1.12/l
50¢/l
New Brunswick
0.19 (↑) 75% (↑)
0.19 (↑) 0.14 (↑)
0.19 (↑) 137% of value for HST
70% of value for HST
70% of value for HST
82% of value for HST
Newfound-land
0.24 (↑) 125% 0.38 (↑) 0.17 0.17 15¢/oz 10¢/oz 15¢/oz 1¢/oz
Nova Scotia
0.24 (↑) 56% 0.15-0.22 (↑)
0.16 0.15 15¢/oz 10¢/oz 15¢/oz 1¢/oz
Ontario 0.14 (↑) 56.6% 0.14 (↑) 0.15-0.18
0.14 59.9% of value for HST
39.6% of value for HST
39.6% of value for HST
67.6¢/l
Prince Edward Island
0.23 (↑) 71.6% 0.18 (↑) 0.13 0.20 15¢/oz 10¢/oz 15¢/oz 1¢/oz
Quebec 0.15 (↑) 80% 0.15-0.23 (↑)
0.19a
(↑) 0.20a (↑) 124% of
value for GST and $1.40/l
66% of value for GST and $1.40/l
72% of value for GST and $1.40/l
63¢/l
Note: Amounts have been rounded to the nearest cent. Taxes on spirits are in excess of the provincial duty free limit. In the Northwest Territories and Nunavut, all liquor importations larger than the duty-free entitlement will be referred to territorial authorities.
.. Not available. a Regular rates. The actual rate depends on the type of fuel and the region.
↑ Denotes an increase in the tax rate between 2011 and 2014.
Source: Various Canadian websites.
3.39. The provinces of Quebec and Prince Edward Island also levy a specific duty on new tyres. In Quebec, the tax rate of Can$3 per tyre has remained unchanged since the previous review. Prince Edward Island levies the environment tax at the rate of Can$4 per new tyre. However, since April 2012, the tax rate on tyres with a rim size greater than 43.18 centimetres (17 inches) has been raised to Can$11.25 per tyre.34
3.40. Various ad-valorem and flat-rate mark-ups/levies apply at the provincial level to non-commercial imports of tobacco products and intoxicating liquors.35
3.1.6 Import prohibitions, restrictions, and licensing
3.41. Import prohibitions in Canada are imposed on: obscene material; hate propaganda and materials of a treasonable or seditious character36; base or counterfeit coins; prison labor goods; certain copyrighted works; certain used or second-hand motor vehicles and aircraft; certain used and second-hand mattresses; white phosphorus matches; and, certain endangered species or those that could pose a threat to the environment. The CBSA's D9 Memoranda series provide
34 Environment tax notice, revised April 2012. Viewed at:
http://www.gov.pe.ca/photos/original/pt_etn101.pdf. 35 Memorandum D2-3-6 Non-Commercial Provincial Tax Collection Programs. 36 These include books, printed paper, drawings, paintings, prints, photographs or representations of
any kind that constitute hate propaganda or are of a treasonable or seditious character within the meaning of the Canadian criminal code.

WT/TPR/S/314 • Canada
- 62 -
further clarifications on these measures.37 The system has remained broadly the same since the previous TPR.
3.42. Canada regularly notifies its import licensing regime to the WTO. Import licences are in place for various reasons, including the administration of tariff quotas (Section 4.1.2), trade remedies, or international commitments (Table 3.10). Import licences are also used on grounds of public interest or for monitoring purposes. The regime has remained largely unchanged since 2011. Imports controls are prescribed for a number of products under various legislative instruments. The Export and Import Permits Act provides for the establishment by regulation of a list, called the Import Control List (ICL), of goods that are subject to import controls.
Table 3.10 Main import restrictions and licensing requirements, 2014
Product Main legal basis/Rationale
Food of animal and plant origin Food and Drugs Act and other statutes/to ensure that the imported food meets Canadian standards for safety, quality, and labelling
Regulated animals, animal products and by-products, germplasm
Health of Animals Act/to protect against the introduction and spread of diseases in Canada
Plant pests, plants and plant products
Plant Protection Act/to protect against the introduction and spread of pests injurious to plants in Canada
Cheese Canadian Agricultural Products Act/to ensure that imported cheese meets Canadian standards for safety, quality, composition, packaging, and labelling
Fresh fruit and vegetables Canada Agricultural Products Act/to ensure that imported products meet Canadian standards for safety, quality, packaging, and labelling
Fish and fish products (for human consumption)
Fish Inspection Act/to provide reasonable assurance that imported products meet Canadian standards for safety, quality, composition, packaging, and labelling
Unregistered pest-control products for the purpose of manufacturing, own use or research
Pest Control Products Act/to ensure that the importation of the unregistered pest-control product is used for the specific purpose and to ensure that it does not pose any unacceptable health or environmental risks.
Controlled substances, industrial hemp and precursor chemicals (Schedules I to VI to the Controlled Drugs and Substances Act).
Controlled Drugs and Substances Act (UN Drug Control Conventions)
Explosives Explosives Act
Chemicals controlled under the Chemical Weapons Convention, Munitions Items (weapons, ammunition and war supplies)
Export and Import Permits Act/to restrict their importation and/or implement an intergovernmental arrangement or commitment
Prescribed nuclear equipment and information, radiation devices, and nuclear substances
Nuclear Safety and Control Act/to ensure that products subject to regulatory control are destined to authorized persons or organizations and that their use will not pose undue risk to health, safety, security, and the environment (implements international obligations).
Carbon steel products and specialty steel products
Export and Import Permits Act/to monitor the volume and the origin of carbon and specialty steel products
37 CBSA, Memoranda Series D9, Prohibited Importations. Viewed at: http://www.cbsa-
asfc.gc.ca/publications/dm-md/d9-eng.html.

WT/TPR/S/314 • Canada
- 63 -
Product Main legal basis/Rationale
Species regulated under the Convention on International Trade in Endangered Species of Wild Fauna and Flora
Wild Animal and Plant Protection and Regulation of International and Interprovincial Trade Act (WAPPRIITA)/to allow the importation of certain species and their by-products in internationally agreed circumstances. For species in Schedule II, to ensure that there are sufficient safeguards and security to prevent escapes to the wild.
Health products Food and Drugs Act/to ensure that imported natural health products meet Canadian requirements for safety, efficacy, and quality
Rough diamonds Export and Import of Rough Diamond Act
Textile and clothing products Export and Import Permits Act/to implement FTAs with the U.S., Mexico, Chile, Costa Rica and Honduras.
Natural gas National Energy Board Act
Firearms, prohibited weapons, prohibited devices
Customs Act, Firearms Act, and EIPA
Hazardous waste and hazardous recyclable material
Canadian Environmental Protection Act/to implement international and bilateral obligations
Ozone-depleting substances Canadian Environmental Protection Act/to implement international obligations
Source: WTO documents G/LIC/N/3/CAN/12, 4 April 2014.
3.43. Canada maintains some permit requirements with regards to textiles and clothing products that are eligible for tariff preferences. This applies to products imported under the NAFTA and under the FTAs with Costa Rica, Chile, and Honduras. Permits are not required for imports that do not seek any of these tariff preferences. Permits are granted on a first-come-first-served basis.
3.44. Fees for import permits depend on the nature of goods, and increase with the value of goods. Permits under the EIPA are issued by the DFATD. Fees are provided in the Export and Import Permits and Certificates Fees Order.38 Permits to import explosives are issued by Natural Resources Canada's Explosives Regulatory Division. There is a fee of Can$160 for a single use permit or an annual permit. Holders of annual permits face an additional fee of Can$20 for each tonne of Net Explosive Quantity imported, with a maximum fee of Can$1,300. For controlled drugs and substances, there is no fee associated with the application for an import or export permit. However, licensed dealers must pay an annual fee to obtain a licence from Health Canada.
3.1.7 Anti-dumping, countervailing, and safeguard measures
3.1.7.1 Anti-dumping and countervailing measures
3.45. The Special Import Measures Act39 and related regulations set out the rules and procedures for the imposition of trade remedies in Canada. There have been no major changes to the legislation during the period under review.40
3.46. Although the CBSA can self-initiate anti-dumping and countervailing investigations, it generally initiates those following complaints from the domestic industry. The process is two thronged, and conducted by the CBSA and the CITT. Upon a complaint, the CBSA determines whether there is sufficient evidence of injury for initiation purposes. The CITT initiates its preliminary injury inquiry after the CBSA's initiation of investigation. The preliminary injury inquiry investigates into whether the dumping and/or subsidizing have caused or threatened to cause material injury to a domestic industry, or have caused material retardation of the establishment of a domestic industry. In the preliminary inquiry phase, the CITT determines whether the evidence
38 Export and Import Permits and Certificates Fees Order (SOR/95-245). Viewed at: http://laws-lois.justice.gc.ca/eng/regulations/SOR-95-245/page-1.html.
39 Import Measures Act (R.S.C., 1985, c. S-15), latest amendment in 2010. 40 The Special Import Measures Regulations has been amended in 2013 to remove the expiration date
on the status of China and Viet Nam as "prescribed countries".
WT/TPR/S/314 • Canada
- 64 -
discloses a reasonable indication of injury or retardation, or threat of injury. The CITT makes its preliminary injury determination 60 days after initiation of the preliminary injury inquiry. If the CITT finds that there is no reasonable indication, it issues a motivated decision to that effect, and the proceedings, including the CBSA's investigation, are terminated. If the CITT finds that there is a reasonable indication of injury, retardation, or threat of injury, it issues a motivated decision to that effect. The CBSA then determines the dumping margin or the amount of subsidy. The CITT initiates its final injury inquiry the day after the CBSA's positive preliminary dumping and/or subsidizing determination. Within 90 days of the commencement of the CITT's final injury inquiry, the CBSA must complete its dumping and/or subsidizing investigation and make its final determination. If it finds no dumping and no subsidizing, the proceedings are terminated, including the CITT's injury inquiry. Otherwise, the CITT's final injury inquiry continues. Provisional duties may be levied in the meantime and until the issuance of a final injury determination by the CITT. They are refunded if the CITT determines that there was no injury (or threat of injury) to the domestic industry.
3.47. The CITT is to make its final determination of injury within 120 days of the initiation of the final injury inquiry. Definitive anti-dumping or countervailing duties are imposed only after the CITT has issued an injury or threat of injury finding. Under the SIMA, a finding of injury or threat of injury or an order continuing a finding of injury or threat of injury and the associated special protection in the form of anti-dumping or countervailing duties expire five years from the date of the finding or the order, unless an expiry review has been initiated. In practice, expiry reviews are completed before the expiry date of the finding or order duty.
3.48. Between 2011 and 2014, the CBSA initiated 43 anti-dumping (AD) investigations, with a peak of 17 investigations in 2013 (Chart 3.4). In 2014, 13 new investigations were initiated. In general, there has been a steep increase in the number of AD investigations in 2012-14, as compared with the previous three years. The number of measures adopted was respectively 10 in 2012, 7 in 2013, and 6 in 2014. CBSA initiated 21 countervailing duties (CVD) investigations between 2011 and 2014 (Chart 3.5)

WT/TPR/S/314 • Canada
- 65 -
Chart 3.4 Anti-dumping investigations initiated by region, 2011-14
(Number of investigations)
2
89
10
3
1
4
3
2
1
0
5
10
15
20
2011 2012 2013 2014
Asia Europe Americas Middle East
Source: WTO Secretariat, based on information provided by the Canadian authorities.
Chart 3.5 Countervailing duty investigations initiated by region, 2011-14
(Number of investigations)
2
43
9
3
2
0
5
10
15
2011 2012 2013 2014
Asia Europe Middle East
Source: WTO Secretariat, based on information provided by the Canadian authorities.
3.49. Most Canadian investigations in the period under review involve several countries' exports of the same products. Frequently, they are accompanied by countervailing measure investigations on the same products and countries. Of the 43 AD investigations initiated over the period 2011-14, 40 led to the imposition of preliminary duties and 24 to the imposition of final duties. Investigations were terminated at various stages for five of these AD investigations: Potassium

WT/TPR/S/314 • Canada
- 66 -
Silicate Solids from Pakistan case (initiated in 2012, terminated by CBSA at preliminary determination); Carbon Steel Welded Pipe from Turkey (initiated in 2012, terminated by CBSA at final determination); Unitized Wall Modules from China (initiated in 2012, terminated by CITT at preliminary injury inquiry); Galvanized steel wire from China, Israel, and Spain (initiated in 2013, terminated by CITT at final inquiry); and Certain hot-rolled carbon steel plate and high-strength low alloy steel plate from Chinese Taipei (initiated in 2013, terminated by CBSA at final determination). There were also some terminations with respect to CVD investigations.
3.50. In 2014, AD and CVD investigations were initiated on three products: Certain Concrete Reinforcing Bar; Certain Oil Country Tubular Goods; and Certain Photovoltaic Modules and Laminates. The first of these grouped investigations was initiated by the CBSA in June 2014, for products originating in or exported from China, the Republic of Korea, and Turkey.41 The second group of investigations was initiated in July 2014, with respect to the alleged injurious dumping of certain oil country tubular goods originating in or exported from Chinese Taipei, India, Indonesia, the Philippines, the Republic of Korea, Thailand, Turkey, Ukraine and Viet Nam, and the alleged injurious subsidizing of certain oil country tubular goods originating in or exported from India, Indonesia, the Philippines, the Republic of Korea, Thailand, Turkey, Ukraine and Viet Nam.42 The third investigation was initiated in December 2014 with respect to the alleged injurious dumping and subsidizing of certain photovoltaic modules and laminates originating in or exported from China.43 As of 31 December 2014, these three investigations were underway.
3.51. As at December 2014, there were 53 definitive antidumping measures in place. Some 60% of the measures were applied on steel products; another 20% were on other metal products; around 10% of the measures were on agricultural products, and the remaining on miscellaneous manufactured products.44 The measures were applied on 23 WTO Members: Brazil (3); Bulgaria, China (16), Czech Republic, Denmark (2), Germany (1), Greece, India (2), Indonesia, Italy, Japan, Republic of Korea (6), Mexico, the Netherlands (2), Oman, Romania, Chinese Taipei (3), Thailand, Turkey, Ukraine (2), United Arab Emirates, United Kingdom, and United States (3). The average duration of the AD measures in place in December 2014 was seven years. The longest lasting measure, on potatoes from the United States, has been in place for over 30 years (since mid-1984).
3.52. Also as at December 2014, there were 17 CVD measures in place: 14 of them on steel and metal products from China, one on imports of refined sugar from the EU, and two on steel products from India.45 The longest lasting CVD measure is applied on refined sugar from the EU: it has been in place since 1995. The average length of CVD measures as at end 2014 was of 5 years and 8 months.
3.53. The CITT is required by legislation to issue a notice of expiry of a finding or an order at least 10 months prior to its expiry. It receives submissions and decide whether an expiry review is warranted. If the CITT finds that an expiry review is not warranted, it issues a decision to that effect with reasons for its decision, and the finding or order expires five years from the date it was issued. If the CITT finds that an expiry review is warranted, it issues a notice of expiry review. Upon receipt of a notice of expiry review, the CBSA commences an investigation to determine
41 SIMA - Final Determinations Respecting Certain Concrete Reinforcing Bar, 10 December 2014. Viewed at: http://www.cbsa-asfc.gc.ca/sima-lmsi/i-e/ad1403/ad1403-i14-nf-eng.html.
42 The goods in question are classified under the tariff items related to tubes, pipes and hollow profiles, of iron or steel (7304 and 7306). Viewed at: CBSA Trade and Anti-Dumping Programs Directorate, Notice of Initiation of Investigations - Certain Oil Country Tubular Goods, 21 July 2014. Viewed at: http://www.cbsa-asfc.gc.ca/sima-lmsi/i-e/ad1404/ad1404-i14-ni-eng.html.
43 The goods in question are classified under HS heading 8541.40.00.22. See: CBSA Trade and Anti-Dumping Programs Directorate, Notice of Initiation of Investigations - Certain photovoltaic modules and laminates, 5 December 2014. Viewed at: http://www.cbsa-asfc.gc.ca/sima-lmsi/i-e/ad1405/ad1405-i14-ni-eng.html.
44 The products subject to AD duties were: certain hot rolled steel sheet (5); certain copper tube (5); certain steel plate (7); certain hot rolled steel plate (4); certain steel fasteners (2); certain copper pipe fittings (3); certain seamless steel casing; certain carbon steel welded pipe (7); certain thermoelectric coolers and warmers; certain aluminium extrusions; certain oil country tubular goods; certain steel grating; certain pup joints; certain stainless steel sinks; certain steel piling pipe; certain unitized wall modules; certain silicon metal; refined sugar (5); hollow structural sections (2); certain liquid dielectric transformers; greenhouse bell peppers; whole potatoes. WTO document G/ADP/N/259/CAN, 22 August 2014, and CBSA online information. Viewed at: http://www.cbsa-asfc.gc.ca/sima-lmsi/i-e/menu-eng.html.
45 WTO document G/SCM/N/274/CAN, 29 August 2014.

WT/TPR/S/314 • Canada
- 67 -
whether the expiry of the finding or order is likely to result in the continuation or resumption of dumping and/or subsidizing. If the CBSA determines that the expiry of the finding or order is likely to result in the continuation or resumption of dumping and/or subsidizing, the CITT then determines whether the expiry of the finding or order is likely to result in injury to the domestic industry or retardation of the establishment of a domestic industry. The expiry review, which is usually completed in 250 days, involves two distinct steps: the CBSA's investigation which is conducted in the first 120 days; and the CITT's expiry review, which is conducted in the final 130 days. This second step is contingent on CBSA finding that the removal of the measure is likely to lead to the continuation or resumption of dumping or subsidizing.
3.54. During the 2011-14 period, there were 12 expiry (sunset) review initiations: 1 in 2011, 4 in each 2012 and 2013, and 3 in 2014. In 2014 the CITT initiated expiry review investigations in respect of fasteners (dumping from China and Chinese Taipei and subsidizing from China), plate (dumping from Ukraine) and oil-country tubular goods (dumping from China and subsidizing from China). In the first two months of 2015, three expiry investigations were initiated on:
a. Refined sugar: dumping (United States, Denmark, Germany, Netherlands, United Kingdom) and countervailing (European Union);
b. Greenhouse bell peppers: dumping (Netherlands); and,
c. Whole potatoes: dumping (United States).
3.55. As at end-2014, 10 of the reviews had been concluded and in all cases the AD duties were continued, albeit in some cases the measures were rescinded in respect of those countries where the CITT found no likelihood of injury, or the CBSA found no likelihood of continuation of dumping/subsidizing. Six of these reviews involved also CVDs; in all six cases they were continued. In the two reviews initiated in 2014 where the CITT pronouncement had not yet been made, there was a CBSA finding that the removal of the measure was likely to result in the continuation or resumption of dumping.46 During 2011-14, two AD measures were allowed to expire without a review.
3.56. Also during 2011-14, there were 10 interim review requests to modify the results of investigations. In all but one case (except the one initiated in 2014, which was still pending when drafting this report), the findings were upheld or the cases rejected as not needing a review.47 In one case, the CITT rescinded its order.
3.57. Importers can contest the CBSA's duty assessment determinations and request a re-determination. The SIMA Act allows 90 days following a CBSA officer's decision or a designated officer's decision for an importer to request a re-determination. A request may be made only when all duties owing on the goods have been paid. Requests for re-determinations of anti-dumping duties can be made on three grounds: a) normal value of the imported goods; b) export price of the imported goods; c) whether the imported goods are goods of the same description as goods to which the order or finding applies. Memorandum D14-1-3 contains the detailed procedures to conduct the process of re-determination. If a re-determination results in a demand for additional duty, the amount of additional duty must be paid by the importer in Canada within 30 days after the day the re-determination was made. Failure to pay the additional duty within this deadline will result in the payment, in addition to the amount, of interest for the period beginning on the first day after the day the person became liable to pay the amount and ending on the day the amount has been paid in full. On the other hand, if a re-determination results in a refund, the CBSA returns the excess duty paid. The refund will include, in addition to the excess amount, interest at the prescribed rate for the period beginning on the first day after the day the amount was paid and ending on the day the decision.
3.58. Anti-dumping measures are prohibited under Canada's FTA with Chile.
46 CBSA online information. Viewed at: http://www.cbsa-asfc.gc.ca/sima-lmsi/er-rre/menu-eng.html. 47 CITT online information. Viewed at: http://www.citt.gc.ca/en/dumping-and-subsidizing/interim-
reviews-section-7601.

WT/TPR/S/314 • Canada
- 68 -
3.1.7.2 Safeguards
3.59. There have been no changes to Canada's legislation on safeguards during the review period. The CITT may conduct global safeguard inquiries, exclusion inquiries, mid-term reviews and extension inquiries pursuant to the CITT Act, the CITT Regulations, and the CITT Rules. The Government may apply safeguard measures in the form of an import surtax pursuant to the Customs Tariff or in the form of a restriction (import quota or tariff-rate quota) pursuant to the Export and Import Permits Act. Safeguard inquiries may be initiated by the CITT following a complaint from a domestic business, or at the request of the Governor in Council. The CITT then conducts a safeguard inquiry to determine if increased imports of goods into Canada are causing or are threatening to cause serious injury to domestic producers of like or directly competitive goods. The CITT has 180 days to conduct a standard safeguard inquiry. However, that statutory deadline can be extended to 270 days in complex cases where the scope of the safeguard inquiry is much larger than usual. At the end of this period, the CITT submits a report to the Government setting out its determination. The Federal Government retains the ultimate power to make the final decision on the application of a safeguard measure.
3.60. There is no statutory deadline for the application of safeguard measures in Canadian legislation. However, under the WTO Agreement on Safeguards, global safeguard measures may be applied for an initial period of up to four years, and are to be progressively liberalized during their period of application. They can be extended, if the CITT determines that they are still necessary to remedy serious injury or threat thereof, and that there is evidence that domestic producers are adjusting to the import competition. In line with WTO rules, their maximum period of application is eight years.
3.61. In a global safeguard inquiry, if the CITT determines that increased imports are causing or are threatening to cause serious injury, it must also determine if imports from a FTA partner are substantial and contributing to the serious injury. A global safeguard measure will apply to goods imported from a FTA only if the Government is satisfied that the quantity of those goods represents a substantial share of total imports of goods of the same kind48, and the quantity of these goods contributes importantly to serious injury (Customs Tariff Act, Section 59). In exceptional circumstances, imports from NAFTA countries may be considered jointly for the purpose of determining whether they contribute to serious injury.49
3.62. The CITT Act also contains provisions relating to bilateral safeguard inquiries, that is, safeguard inquiries under various bilateral free trade agreements to which Canada is a signatory. In a bilateral safeguard inquiry, the CITT must determine whether, as a result of the tariff reductions provided for in the bilateral FTA, imports from the partners are in such increased quantities and under such conditions as to cause or threaten to cause serious injury to domestic producers of like or directly competitive goods. In a bilateral safeguard inquiry, safeguard measures, if applied, are limited to the temporary suspension of tariff reductions or restoration of the MFN tariff rates. Measures may be applied for up to three years, followed, in some cases, by a one-year phasing-out period. Any person directly affected by the CITT's report in a safeguard inquiry may seek judicial review in the Federal Court. For measures that are to remain in effect for more than three years, the CITT is required to conduct a mid-term review to determine if they should remain in force, be revoked or amended. The CITT may also conduct extension inquiries for measures that are due to expire.
3.63. The CITT will not consider initiating a safeguard inquiry if it is of the opinion that the injury to domestic producers is caused by the dumping and/or subsidizing of imports. In such a case, the CITT suspends its proceedings and refers the matter to the CBSA.
3.64. During the period under review, Canada did not apply any safeguard measure, nor did it start any investigation. Canada's latest safeguard inquiry dates from 2005.
48 Typically, the trading partner must be among the top five suppliers, as measured in terms of import
share during the most recent three-year period. 49 Article 802 of the NAFTA (Global Actions) provides for the exclusion of one party's goods from another
party's global safeguard actions unless imports from that party account for a substantial share of total imports and contribute importantly to the serious injury (or threat thereof).

WT/TPR/S/314 • Canada
- 69 -
3.1.8 Standards and other technical requirements
3.65. Canada's standardization system is composed of over 350 organizations and 15,000 members involved in standards development, product or service certification, testing and management systems registration. Established under the Standards Council of Canada Act, the Standard Council of Canada is a federal Crown corporation with the mandate to promote an efficient and effective standardization in Canada. It assumes its mandate by prescribing policies and procedures for the development of national voluntary standards, coordinating Canada's participation in the international standards system, and accrediting the various bodies of the system.50 The Technical Barriers and Regulations Division of the DFATD is Canada's SPS and TBT notification authority and enquiry point. There has been no major change to the Canadian standardization system since the last Review.
3.66. Standards development is carried out by Standards Development Organizations (SDOs), accredited by the SCC. There are currently eight SDOs: the Canadian Standards Association (CSA); the Underwriters' Laboratories of Canada (ULC); the Canadian General Standards Board (CGSB); the Bureau de normalisation du Québec; Air-Conditioning, Heating & Refrigeration Institute; ASTM International; NSF International; and ULC Standards. Although these institutions may develop standards in any area, they generally operate in agreed areas of specialty reflecting the expertise of their technical committees. Once a SDO makes the decision to develop a standard, it establishes a technical committee that generally includes consumer representatives, general interest group representatives, government officials and producers. The committee typically reviews existing (international) standards first for possible adoption or adjustment. Standards are developed through a consensus-based decision making process. Once a draft standard is developed, the public is invited for review and comments. A minimum time-frame of 60 days is prescribed for the submission of comments by interested parties (including those outside Canada) before the publication of the standard.
3.67. A standard may be further submitted to the SCC for consideration as a National Standard of Canada. Key criteria in the SCC's decision include: the composition of the committee and the degree of consensus in the development of the standard; the consistency of the standard with existing international or relevant foreign standards; and, the extent to which the standard does not act as a barrier to trade. National standards are to be reviewed and updated every five years. They can be further submitted to international organisations for consideration and adoption as international standards. Over the past four years, the number of active standards has declined, from 3,482 in 2010-11 to 2,901 by mid-2014. As of mid-2013, there were 141 national standards and 98 adoptions of international standards.
3.68. The SCC also has the mandate to grant accreditation to organizations delivering services such as testing, certification, and management systems registration. Certification bodies are accredited on a fee-for-service basis. As of 2014, there were 37 certification bodies (including U.S.-based bodies), more than 350 testing organizations, and 27 management systems registrars accredited by the SCC.
3.69. Canada's participation in international standardization activities is generally governed by ISO/IEC statutes, rules of procedures and directives. Mutual recognition agreements are generally negotiated by the SCC. The SCC has agreements with a number of foreign standards bodies, including the American National Standards Institute (ANSI), the Korean Agency for Standards and Technology (KATS), the Mongolian Agency for Standardization and Metrology (MASM), The Standardization Administration of China (SAC), the European Committee for Standardization (CEN), and the European Committee for Electro-Technical Standardization (CENELEC). In addition, SCC is a signatory to a number of voluntary accreditation agreements, including the International Accreditation Forum (IAF), the Asia-Pacific Laboratory Accreditation Cooperation (APLAC), and the Inter-American Accreditation Cooperation (IAAC).
3.70. The process of preparing technical regulations is decentralized. Various federal and provincial authorities develop regulations, including technical regulations. When developing technical regulations, federal authorities must carry out consultations with interested parties as early as possible, and, in general, it is expected that the extent of the consultations be
50 More information may be obtained at the SCC's website. Viewed at: https://www.scc.ca/en/standards/committees/get-involved-standardization.

WT/TPR/S/314 • Canada
- 70 -
proportional to the regulation's impact. Federal authorities must publish proposals in the Canada Gazette Part I, to allow for a public comment period (pre-publication stage). In some cases, this requirement is explicitly specified in the enabling legislation. For all other regulations that do not have a fixed statutory comment period, the Treasury Board, which is the Cabinet Committee in charge of reviewing and approving regulations, may, upon request by a federal authority, waive the pre-publication requirement or shorten the comment period. However, the authorities have indicated that this is rare and may occur only in circumstances where the expected value from pre-publication is limited (for instance, proposals that are straightforward harmonization with international standards). In fact, in most instances of harmonization with international technical standards, pre-publication has been pursued to ensure that affected stakeholders are notified of the implementation timelines and requirements. The period for comments is typically 30 days. In accordance with Canada's obligations of notification under various trade agreements, a longer period for comments (at least 75 days) is observed for technical regulations that affect trade.
3.71. Draft regulations must be accompanied by a "regulatory impact analysis statement" describing their estimated benefits and costs, the results of the consultations with stakeholders, and the proposed regulations' monitoring and enforcement instruments. Upon approval by the Treasury Board, the Governor General signs the regulation, and the Registrar of Statutory Instruments registers it. Regulations enter into force immediately after registration or on a day specifically stipulated. The Regulation can only be enforced once published in the Canada Gazette Part II. Such publication must occur within 23 days of registration.
3.72. The development of technical regulations must follow, to the extent possible, the Cabinet Directive on Regulatory Management, which applies to all federal departments, agencies, and entities over which the Cabinet has either general authority or a specific authority relating to regulation making.51 Under the Directive, federal authorities are expected to make use of all or parts of relevant international standards, guidelines, and recommendations when seeking to fulfil the intended policy objectives sought by the country. The development of technical regulations (and other regulations) must be preceded by an identification of policy issues, their assessment and the determination of the need for government intervention. Once the public policy issues are identified, responsible departments and agencies must: set measurable objectives that address the public policy issue and its causes; establish linkages to enabling legislation and government priorities to ensure relevance and consistency; and develop and use performance indicators on an ongoing basis to monitor and report on progress against performance expectations, with a particular emphasis on high impact proposals. Departments and agencies are also responsible for assessing the benefits and costs of regulatory and non-regulatory measures, including government inaction.
3.73. To ensure compliance with international commitments, the Directive encourages agencies and departments preparing the technical regulations to seek the advice of the DFATD concerning the compatibility of the proposed regulations with Canada's trade obligations. Departments and agencies are to take advantage of opportunities for cooperation, either bilaterally or through multilateral fora, by reviewing and influencing international best practices, sharing knowledge, adopting or contributing to the development and updating of international standards and conformity assessment procedures, and developing and pursuing compatible approaches with international counterparts. Agencies are also instructed to limit the number of specific Canadian regulatory requirements or approaches to instances when they are warranted by specific Canadian circumstances and when they result over time in the greatest overall benefit to Canadians, and to minimize regulatory differences with key trading partners (e.g., the United States) including through regulatory alignment, mutual recognition, and the development of compatible approaches.
3.74. Canada does not maintain a catalogue of technical regulations. However, Canada Gazette's Consolidated Index of Federal Statutory Instruments includes (but does not specifically categorize or indicate) technical regulations.
51 The Directive, which came into effect in December 2012, updated and replaced the Cabinet Directive
on Streamlining Regulation (dated 1 April 2007) and the Government of Canada Regulatory Policy (dated November 1999). Treasury Board of Canada Secretariat online information. Viewed at: http://www.tbs-sct.gc.ca/rtrap-parfa/cdrm-dcgr/cdrm-dcgr01-eng.asp.

WT/TPR/S/314 • Canada
- 71 -
3.75. Canada relies on a variety of tools to ensure compliance with technical regulations, depending on a number of factors, including risks and the particular characteristics of the sector. Conformity assessment procedures are generally specified in Canadian technical regulations. In sectors subject to third-party conformity assessment, most Canadian regulatory authorities rely on conformity assessment bodies accredited by the SCC, whose criteria are based on ISO/IEC standards and include additional requirements to fulfil the needs of Canadian regulatory authorities. Third-party conformity assessment is used in a number of sectors, including electrical safety, some medical devices, and construction products. Canada uses suppliers' declaration of conformity for motor vehicles, electromagnetic compatibility, and some telecommunications products. Regulatory authorities are directly responsible for conformity assessment for certain products (pharmaceutical products and medical devices for instance).
3.76. Between 2011 and 2014, Canada raised 26 specific trade concerns (STC) in the TBT Committee.52 The concerns were related to measures maintained by a variety of partners, including Ecuador (5 STCs), China (3 STCs), European Union (3 STCs), and Viet Nam (3 STCs). The most frequent issues were related to discrimination and requests for clarification or further information.
3.77. Canada has regularly notified its draft technical regulations, ordinances, and conformity assessment procedures to the TBT Committee. During the 2011-14 period, Canada submitted 115 new technical regulation notifications (excluding corrections and appendices).53 Canada participates in a number of conformity assessment agreements (Table A3.1).
3.1.9 Sanitary and phytosanitary requirements
3.78. The Food and Drugs Act (FDA) and regulations remain the main federal statute applying to the safety of food sold in Canada (including those that are marketed exclusively within the provinces). The legislation is supplemented by the Fish Inspection Act, the Canada Agricultural Products Act, the Meat Inspection Act, and the food provisions of the Consumer Packaging and Labelling Act.
3.79. Health Canada and the Canadian Food Inspection Agency (CFIA) are the main regulators for food safety, animal health and plant health. In October 2013, the Federal Government announced the transfer of the reporting relationship of the CFIA from the Minister of Agriculture and Agri-Food to the Minister of Health, bringing under the same department the main federal food safety authorities. The Minister of Agriculture and Agri-Food retains its responsibility over non-food safety agricultural activities, including economic and trade issues, as well as animal health and plant protection work.
3.80. Health Canada is responsible for establishing standards and policies governing the safety and nutritional quality of all food sold in Canada.54 Its mandate also includes conducting food-related health risk assessment, approving and regulating pest control products and setting maximum residue limits (MRLs) for pesticides that may remain in or on food; and, evaluating the safety of veterinary drugs used in food-producing animals and establishing corresponding MRLs.
3.81. The enforcement of food safety-related standards and policies is within the purview of the CFIA. The CFIA is responsible for enforcing all federally mandated inspection, compliance, and quarantine requirements related to food, animal health and plant health. The CFIA is also the lead agency for risk assessments related to animal health and plant health.55 The CFIA is responsible for administering a number of acts and their regulations. These include: the Agriculture and Agri-Food Administrative Monetary Penalties Act, the Canada Agricultural Products Act, the Canadian Food Inspection Agency Act, the Feeds Act, the Fertilizers Act, the Fish Inspection Act, the Food and Drugs Act (as it relates to food), the Health of Animals Act, the Meat Inspection Act, the Plant Breeders' Rights Act, the Plant Protection Act, the Safe Food for Canadians Act, and the Seeds Act.
52 WTO TBT Information Management System. Viewed at:
http://tbtims.wto.org/web/pages/search/stc/Search.aspx. 53 WTO documents G/TBT/N/CAN/326, 7 January 2011 to G/TBT/N/CAN/435, 11 December 2014. 54 Health Canada online information. Viewed at: http://www.hc-sc.gc.ca/index-eng.php. 55 More information on the CFIA's activities can be found at: http://www.inspection.gc.ca/about-the-
cfia/eng/1299008020759/1299008778654.
WT/TPR/S/314 • Canada
- 72 -
3.82. SPS-related requirements for imports into Canada are the responsibility of the Federal Government given its constitutional jurisdiction over international trade. Provinces and territories have jurisdiction within their respective borders and have legislation for some food safety issues, including for food manufactured and sold within their borders.
3.83. In 2012, the Food and Drugs Act (FDA) was amended to include two new tools: Marketing Authorizations (MA) and Incorporation by Reference. The MA framework gives the Minister of Health the authority to issue authorizations for the use of specific substances in foods (e.g. food additives) and health/nutrition representations/claims for foods under certain conditions. The amendments also provided an expanded authority to incorporate by reference technical and non-technical standards, methods, guidelines or any other documents, into MAs, or directly into the Food and Drug Regulations. These amendments were intended to allow the Minister to act rapidly on certain science and safety decisions, and to improve efficiency in the food regulatory system, ultimately making it more responsive to emerging health and safety issues.
3.84. Canada is in the midst of important changes to its food safety system. On 22 November 2012, the Safe Food for Canadians Act (SFCA) received Royal Assent. The SFCA aims at stronger food safety rules and more consistent and effective inspection, and provides for increased penalties for non-compliance. The Act will consolidate and replace existing food legislation, other than the FDA56, and enhance inspection powers. It applies to all food commodities that are traded inter-provincially and internationally, but not to natural health products. The new legislative framework prohibits food tampering, deceptive practices and hoaxes. Parties may still have recourse to a judicial review by the Federal Court if they are unsatisfied with the appeal mechanism.
3.85. The SFCA will be brought into force through implementing regulations. Consultations on the proposed regulations were under way as of February 2015. The proposed regulations would apply international standards for preventive controls (such as the Hazard Analysis and Critical Control Points and Good Manufacturing Practices) to all food traded inter-provincially, exported and imported. New traceability requirements would allow for more timely removal of unsafe food from the supply chain. Like domestic manufacturers, food importers would need to be licensed and have preventive control plans that demonstrate that imported products meet Canadian requirements. The authorities indicated that the CFIA will be working with small and medium enterprises to explore approaches tailored to their operational needs and to assist them in achieving compliance.
3.86. In the transition period before the SFCA comes into force, the CFIA implemented some changes using existing authorities and administrative guidelines. For instance, in the quest of a more effective inspection, the CFIA embarked in a process to design a new and Improved Food Inspection Model to modernize its regulatory oversight under existing legislation. A final round of consultations on the Integrated Agency Inspection Model (iAIM) was concluded in August 201457 with a multi-year implementation underway.58
3.87. The iAIM is serving as the policy basis for the proposed regulatory framework under the SFCA, including requirements for licensing and preventive control plans. The Model also calls for a consistent and risk-based approach to inspection that will focus its activities on food commodities and establishments that pose the greatest risk for consumers. It has also established Inspection Verification Teams to oversee food inspection performance. The iAIM does not cover foreign facilities, but applies to them through domestic importers. It calls for extending licensing requirements to all businesses and individuals involved in the importation or preparation of food for export or interprovincial trade. The iAIM also proposes requirements for businesses to develop, implement and maintain preventive control plans based on the Codex Alimentarius, IPPC and OIE principles and standards.
56 These include: the Fish Inspection Act, the Canada Agricultural Products Act, the Meat Inspection Act,
and the food provisions of the Consumer Packaging and Labelling Act. 57 Comments were solicited from WTO Members on various occasions. See WTO document
G/SPS/N/CAN/613, 13 June 2012; and subsequent revisions. 58 CFIA (2014), Integrated Agency Inspection Model. Viewed at: http://www.inspection.gc.ca/about-the-
cfia/accountability/inspection-modernization/integrated-agency-inspection-model/iaim-consultation/eng/1390935174455/1390935603829.

WT/TPR/S/314 • Canada
- 73 -
3.88. Other SPS-related changes include the full implementation, by April 2013, of the aquatic animal health import programme. Under the programme, import permits are required for "susceptible species" of finfish, molluscs, and crustaceans.59 Import permits contain specific requirements based on the disease risks associated with the animal, the origin, and other relevant health information. A health certification from the country of origin may be required.
3.89. CFIA's has developed an automated import system to assist importers and Customs in the management of their imported agriculture, fish, health and food products. The system consists of several modules including the Automated Import Reference System (AIRS) and a database of import requirements.
3.90. Between 2011 and 2014, Canada submitted 394 notifications under the SPS Agreement (excluding addenda and corrections).60 This comprises 58 regular notifications of new or changed SPS regulations and five emergency notifications (compared to 208 regular and five emergency notifications over the 2007-10 period). Two STCs were raised about measures by Canada. In October 2012, Argentina expressed concerns regarding Canada's delay in opening its market to poultry and bovine meat from Argentina despite favourable risk assessments. Canada indicated that the delay was due to budgetary and staffing restrictions, but reaffirmed its intention to audit Argentina's beef and poultry meat inspection systems. In 2013, China raised, during a TBT Committee meeting, a STC regarding Canada's proposed food inspection model.61 The representative of China requested the Canadian authorities to base any changes in their measures on relevant international standards, such as Codex standards. Canada indicated that it has provided Members the opportunity to comment on its proposed food inspection model on two occasions.62 Furthermore, on 2 April 2013, Canada invited WTO Members to another round of consultation on the proposed draft.63
3.91. During the same period, Canada raised a STC about Mexico's imposition of bovine spongiform encephalopathy (BSE)-related restrictions on Canada's export of beef from cows, despite Canada being recognized by the OIE as a "controlled" BSE-risk country. The concern was supported by the European Union. Mexico expressed its willingness to work on the issue bilaterally with Canada.
3.2 Measures Directly Affecting Exports
3.2.1 Export procedures and requirements
3.92. Businesses and individuals are required to create an export or an import/export Business Number account with the Canada Revenue Agency before exporting commercial goods. The use of the services of a customs broker or freight forwarder is not mandatory.
3.93. In accordance with the Customs Act (Part V), exporters, carriers and customs service providers are, in general, required to report goods being exported from Canada. The main objectives of such reporting are statistical purposes and to control the export of strategic, dangerous, and other controlled and regulated goods. The minimum timeframe for export reporting depends on the mode of transportation and the nature of the goods to be exported. In general, the timeframe is two hours prior to loading for goods to be exported by air, rail or through the post office, and 48 hours for goods to be loaded onto a vessel in the marine mode. Goods exported through highways and time-sensitive goods may be reported immediately before they are exported. A variety of exemptions to the reporting requirement are in place and cover transactions such as exports to the United States, or transactions related to goods having a value of less than Can$2,000 (provided that they are non-restricted exports). There is a general exemption for items such as: personal and household effects; goods exported for repair or
59 A list of susceptible species of aquatic animals may be viewed at: http://inspection.gc.ca/animals/
aquatic-animals/diseases/susceptible-species/eng/1327162574928/ 1327162766981. 60 WTO - SPS Information Management System (SPS IMS). Viewed at: http://spsims.wto.org/.
61 WTO document G/TBT/M/59, 8 May 2013. 62 In June 2012, Canada sought comments from Members on a document called "The Case for Change"
- which outlined the proposed core components of an improved inspection model (WTO Document G/TBT/N/CAN/365, 18 June 2012). The second opportunity was in August 2012, when Canada sought feedback on its draft improved food inspection model (WTO document G/TBT/N/CAN/365/Rev.1, 24 August 2012).
63 WTO Document G/SPS/N/CAN/613/Rev.1/Add.2, 3 April 2013.

WT/TPR/S/314 • Canada
- 74 -
warranty repair; goods exported by diplomatic embassies; goods in transit; and goods removed from a bonded warehouse or sufferance warehouse.
3.94. Exporters may file their declaration manually using the B13A form, or electronically using either the Canadian Automated Export Declaration (CAED) or the G7 Electronic Data Interchange (EDI) Export Reporting systems. Registration is required prior to the use of the electronic reporting systems. There is no fee related to the CAED system. Over the past three years, CBSA has been taking steps to eliminate the manual reporting process and replace it with mandatory electronic reporting. Through the Export Summary Program, qualified businesses may be allowed to report their exportations on a monthly basis, provided that the goods are bulk and homogenous.
3.95. Goods reported in accordance with the Customs Act may be subject to physical inspection in order to ensure compliance with the legislation. In the case of goods that are not reported under the provisions of the legislation, CBSA must have reasonable grounds that a regulation is being contravened in order to target them for any physical examination. The inspection is free of charge, but the exporter is responsible for the costs related to the unloading and reloading of the cargo, and charged by third-parties. The exporter may be required to produce a proof of exports in some circumstances. It is the case for instance for goods imported temporarily and subsequently exported.64 Penalties for non-compliance are assessed through the AMPS (Section 3.1.1).
3.2.2 Export taxes, charges, and levies
3.96. The Export Act and Import Permits Act provides for the imposition of export duties by the Governor in Council on certain ores and metals, under certain circumstances.65 The Governor may also impose export duties on a number of logs and pulpwood products (pine, Douglas fir, spruce, fir balsam, cedar and hemlock logs and pulpwood) destined to trading partners that charge duties on their imports of timber, lumber or wood products from Canada. However, to date no export taxes, charges or levies are being collected under the Export Act.
3.97. Duties on softwood lumber are collected in accordance with the 2006 Canada-United States Softwood Lumber Agreement. In 2013, the Agreement was extended from its original seven years period up to October 2015. The measures apply to exports from the following Canadian provinces: Alberta, Saskatchewan, Manitoba, Ontario, Quebec, and British Columbia.66 Under the Agreement, these provinces may opt either for an export charge without any volume restraints or a combination of a lower export charge and a restriction on the export volume.67 Currently, Alberta and the British Columbia have opted for an export charge without volume restraints while the four other provinces have opted for the other option. Duties are levied when a trigger price is reached, that is, when the reference price of lumber reaches or falls below US$355 per thousand board feet. The revenues from the duty are redistributed to the provinces based on the origin of the softwood, but must not flow back to the industry. Between 2011 and 2013, an additional charge of 0.1% and 2.6% was imposed on exports from the provinces of Ontario and Quebec respectively.
3.98. A special duty applies to the exportation of unstamped domestically-manufactured tobacco products, with the objective of reducing the incentives to smuggle these products back into Canada. The duty rates depend on the manufacturer's production in the preceding calendar year. For export quantities of up to 1.5% of total production, the special duty is levied at the rate of: Can$21.03 per carton of 200 cigarettes; Can$21.03 per 200 tobacco sticks; and Can$26.25 per 200 grams for other tobacco products. Quantities over the 1.5% threshold must be stamped, and therefore, are subject to the domestic rates that apply to stamped tobacco. In addition, they are subject to a special duty of Can$19.1448 per carton of 200 cigarettes or per 200 sticks of tobacco,
64 Memorandum D20-1-4, December 2008. Viewed at: http://www.cbsa.gc.ca/publications/dm-md/d20/d20-1-4-eng.html.
65 Export Act, R.S.C., 1985, c. E-18. 66 British Columbia Coast and British Columbia interior as defined in the British Columbia Forest Regions
and Districts Regulations. 67 The export charge for Option A provinces varies with the price as follows: 15% if the reference price
is US$315 or less; 10% if the price is between US$316 and US$335; 5% if the price is above US$336 but less than US$355. The combination of export charge and volume restraint (in share of U.S. consumption) for Option B provinces is as follows: a charge of 5% and a regional share limit of 30% of U.S. consumption if the reference price is US$315 or less; a charge of 3% and a regional share limit of 32% if the price is between US$316 and US$335; and a charge of 2.5% and a regional share limit of 34% if the price is between US$336 and US$355.

WT/TPR/S/314 • Canada
- 75 -
and Can$23.931 per 200 grams of other tobacco products.68 A refund of the special duty may be provided if it is demonstrated that the products have entered into a foreign market for consumption and foreign duties have been paid. The refund is provided only for the quantity up to the 1.5% threshold.
3.2.3 Export prohibitions, restrictions, and licensing
3.99. Canada's export controls are mainly governed by the Export and Import Permits Act (EIPA).69 The Export Control List70 (ECL), a regulation made under the authority of the EIPA, establishes a listing of controlled goods and technologies. The ECL is supplemented by A Guide to Canada's Export Controls (Guide) providing greater detail on the goods and technologies controlled for export.71 Since Canada's previous review, the ECL and the Guide have been amended to incorporate updated controls from a number of multilateral regimes such as: the Wassenaar Arrangement, the Nuclear Suppliers Group, the Missile Technology Control Regime, and the Australia Group. Most items on the list are military and strategic goods or technology, including dual-use goods.72 Canada also issues Certificates of Eligibility to ensure orderly marketing of certain textiles and apparel exports to the U.S. under the NAFTA. These products are not listed on the ECL, as they are subject to certificates of eligibility, rather than export permits.
3.100. In general, an export permit is required for the export of items included on the ECL, irrespective of the destination, with some exceptions for exports to the United States.73 The issuance of export permits and certificates is under the authority of the DFATD. Exporters can submit their application by mail, fax, or online through Export Controls Online (EXCOL)74 or the Export Import Control System (EICS). Fees are set out in the Export and Import Permits and Certificates Fees Order.75 Enforcement is under the responsibility of the CBSA and the Royal Canadian Mounted Police. Canada's main export prohibitions, restrictions and licensing are listed in Table 3.11.
Table 3.11 Main export prohibitions, restrictions and licensing, 2014
Products/destinations Rationale Military and strategic goods and technology
Implementation of intergovernmental arrangements or commitments and/or national security
Agricultural and food products - Peanut butter U.S. quota regime - sugar-containing products U.S. quota regime - sugars, syrups and molasses U.S. quota regime Forest products: - Logs Promote the further processing - Pulpwood Promote the further processing - red cedars Promote the further processing - Softwood lumber products Softwood Lumber Agreement Textiles and apparel
Implementation of intergovernmental arrangements or commitments.
Source: EIPA (Section 3(1)(a) and (d)), and information provided by the Canadian authorities.
68 For more details regarding the legislation governing this tax, see Excise Act, 2001, sections 50 and 56
and Schedule 3. 69 Export and Import Permits Act. Viewed at: http://laws-lois.justice.gc.ca/eng/acts/e-19/. 70 Export Control List. Viewed at: http://laws-lois.justice.gc.ca/eng/regulations/SOR-89-202/index.html. 71 As of January 2015 the current version of the Guide is "A Guide to Canada's Export Controls –
December 2013". Viewed at: http://www.international.gc.ca/controls-controles/about-a_propos/expor/guide-2013.aspx?lang=eng.
72 DFATD (2013). 73 Export permits are not required for most controlled goods or technology destined to a final consignee
in the United States. Items that do require an export permit to the United States are defined in "A Guide to Canada's Export Controls" via a statement that the control applies to All Destinations.
74 The Export Controls On-Line (EXCOL). Viewed at: https://www.excol-ceed.gc.ca/Main-Principal/Home_Accueil.aspx?lang=eng.
75 Export and Import Permits and Certificates Fees Order (SOR/95-245). Viewed at: http://laws-lois.justice.gc.ca/eng/regulations/SOR-95-245/page-1.html.

WT/TPR/S/314 • Canada
- 76 -
3.101. Permit requirements may also depend on the origin or destination of the goods to be exported. An individual export permit is required for U.S.-origin goods if the goods are to be exported to destinations such as Iran, Cuba, Syria or the Democratic People's Republic of Korea. The export of any item to countries on the Area Control List76 also requires a permit.
3.2.4 Export support and promotion
3.102. Canada's commercial promotion activities are undertaken by a network of agencies and organisations, the Trade Commissioner Service (TCS) being the most prominent one.77 Through its extensive network of 161 offices around the world (up from 150 at the time of the previous Review), five regional hub offices, and a network of trade commissioner satellites co-located with public and private sector partners across the country, the TCS offers a wide range of services aimed at helping businesses prepare for international markets, assess their market potential, find qualified contacts, and resolve business-related problems. Since the last review, new offices have been opened in countries such as China, India and Brazil.
3.103. The TCS is under the responsibility of the DFATD from which it receives its funding. Its services are free of charge, and available to companies and organizations deemed having meaningful economic ties in Canada, a demonstrated capacity for internationalization, and contributing to Canada's economic growth.78 During the fiscal year 2012-13, the actual level of spending by the DFATD under the International Commerce Business line amounted to Can$160.6 million, a slight decline compared to the previous fiscal year. Most of these resources (78%) are spent under the International Business Development.79 It is estimated that the TCS has helped businesses to conclude about 950 commercial agreements and facilitated 147 FDI projects worth Can$2.7 billion of investment. Between 2010 and 2014, TCS disbursed an estimated amount of Can$53.2 million under its various programmes (Table 3.12).
Table 3.12 Main TCS funding programmes and amount disbursed, 2010-14
(Can$ million)
Program Description of the service provided Amount disbursed 2010-14
Global Opportunities for Associations (GOA)
Non-repayable support to associations starting or expanding international business development activities
6,8
Going Global Innovation (GGI)
Matching funds of up to 75% of eligible expenses incurred in pursuing international collaborative R&D opportunities, with a minimum request of Can$5,000. The programme is currently on hold
2,3
Invest Canada-Community Initiatives (ICCI)
Non-repayable support to communities seeking to attract FDI
12,6
Foreign Trade Zones – Marketing Program (FTZ-MP)
Non-repayable contributions to organizations for the promotion of Canada's Foreign Trade Zone
n.a.
International Science and Technology Partnership Program (ISTPP)
Support to R&D collaboration programmes with Brazil, China, India and Israel. Programme is currently undergoing renewal
15.0a
76 These are Belarus and the Democratic People's Republic of Korea. The Area Control List regulation is
made under section 4 of the Export and Import Permits Act. Viewed at: http://laws-lois.justice.gc.ca/eng/regulations/SOR-81-543/FullText.html.
77 Other agencies include: Agri-Food Trade Service (AAFC), Export Development Canada, Business Service Centers (Industry Canada), and industry organisations such as the Canada Pork International.
78 Meaningful economic ties include maintaining established offices, a subsidiary, a plant, a research and development establishment, or a joint venture in Canada. A capacity for internationalization is reflected in having researched foreign markets, dedicated human and financial resources, and having a business plan. Contribution to Canada's economic growth is measured as increased exports of Canadian-made products or services, technology transfer, new job creation, increased research and development activity or increased production in Canada. TCS online information. Viewed at: http://www.tradecommissioner.gc.ca/eng/how-tcs-can-help.jsp.
79 FDI in Canada and International Innovation, Science and Technology, the two other sub-components of this business line, accounted respectively for Can$22.5 and Can$12.8 million.

WT/TPR/S/314 • Canada
- 77 -
Program Description of the service provided Amount disbursed 2010-14
Investment Cooperation Program (INC)
Support to businesses engaged in developmentally beneficial investment in developing countries
16.5b
n.a. Not applicable. No application has been received at the time of writing this report (the programme was created in 2013-14).
a The figure is a combination of funding under ISTPP 1 (2006-13) and ISTPP 2 (2010-15). Unlike the ISTPP 1 funds which were available to all R&D institutions, ISTPP 2 funds are restricted to industry.
b Fiscal year amounts (1 April 2010 to 31 March 2014).
Source: Department of Foreign Affairs and International Trade (DFAIT).
3.104. TCS generally delivers its services to its clients in response to specific requests. Some of its activities (for instance, business-to-business events, trade missions, workshops, etc.) are however pro-actively planned, in line with priority sectors and priority markets identified by the authorities. TCS clients are predominantly SMEs, as they account for the essential of businesses engaged in exports.80 An empirical study of the support provided by the TCS between 1999 and 2006 reached a conclusive evidence of the impact of TCS assistance in terms of boosting exports and helping firms diversify into new markets.81 The study found that businesses who received TCS assistance exported, on average, 18% more than comparable exporters who did not receive the support. Furthermore, TCS clients exported on average to 36% more markets than non-TCS clients. Building on the success of the 2007 Global Commerce Strategy, the Federal Government announced, in 2013, a new trade plan: the Global Markets Action Plan (GMAP). Under the GMAP, the federal government aims at concentrating its efforts on sectors and markets that are deemed to hold the greatest potential for Canadians businesses.82 Foreign markets are classified depending on their potential for Canada's commercial interests. The Plan identified 50 priority markets further classified into three groups: 20 classified as emerging markets with the potential for broad commercial interests; 24 markets classified as emerging markets with specific opportunities; and 6 classified as established markets (counting the EU and EFTA as single markets). Specific targets include raising Canada's SME export presence in emerging markets from 29% to 50% by 2018, and their number, from 11,000 to 21,000 companies.
3.105. The Economic Action Plan 2013 announced a package of measures to reduce red tape, cut costs, improve access to existing programmes and promote Canada's foreign trade zone advantage. The measures include: the elimination of the annual registration fee for the Customs Bonded Warehouse Program (into effect on 22 March 2013); the simplification of the application process to access FTZ programmes; the streamlining of the audit process for duties relief programmes; and the launch of the Foreign Trade Zones - Marketing Program (FTZ-MP), a five-year Can$5 million programme designed to market FTZ advantage and attract foreign investment. The FTZ-MP is designed to support Canadian regional organizations and non-profit organizations in their promotion of local FTZ-type benefits linked to strategic locations across Canada. It provides non-repayable contributions ranging from Can$10,000 to Can$150,000 for activities spanning a 12 month period. FTZ-MP provides matching funds of up to 50% of eligible expenses.
3.106. Through Canada Business Network, a programme managed by Industry Canada, businesses also have access to a wide range of information on government services, programmes and regulatory requirements.
3.2.5 Export finance, insurance, guarantees
3.107. Export Development Canada (EDC) is a Crown corporation with the mandate to support and develop export trade and help businesses respond to international business opportunities.83 It provides insurance products, financing and bonding solutions to companies engaged in export-related activities, as well as to their foreign customers (Table 3.13). EDC is financially
80 According to the TCS, 95% of businesses engaged in goods exports are SMEs. In 2012, SMEs exports of goods were worth Can$144 billion, that is nearly one-third of total merchandise exports.
81 Van Biesebroeck, Yu, and Chen (2010). 82 Government of Canada (2014b). 83 Export Development Act, R.S.C., 1985, c. E-20. Last amended on 11 March 2014.

WT/TPR/S/314 • Canada
- 78 -
self-sustained. Its revenue is generated primary from fees charged on its services, and interest collected on its loans. The corporation may borrow money on capital markets or, if ever required, request loans from the Ministry of Finance.
Table 3.13 EDC finance, insurance, and guarantee programmes (as of 30 September 2014)
Products Purpose Businesses
financed in 2014 (Can$ billion)
Insurance 55.1 Accounts Receivable Insurance
Covers up to 90% of losses resulting from risk such as: insolvency, default, refusal to accept goods, hostilities in the market, cancellation of permits, cancellation of contract.
40.8
Single Buyer Insurance
Covers up to 90% of losses resulting from insolvency, default, hostilities in the market, cancellation of permits.
0.02
Contract Frustration Insurance
Covers up to 90% of losses resulting from: insolvency, default, refusal to accept goods, hostilities in the market, cancellation of permits, breach of contract, moratorium on debt.
0.04
Performance Security Insurance
Covers up to 95% of losses resulting from wrongful calls on guarantees for export contracts.
0.08
Political Risk Insurance
Covers up to 90% of losses resulting from political risks such as: hostilities in the market, cancellation of permits, breach of contract (public sector entities), moratorium on debt, expropriation, political violence, non-payment by Government, damage to goods, seizure, re-possession.
2.2
Financing 8.2 Export Guarantee Program
Provides up to 100% guarantee on loans used by businesses to increase their working capital, purchase new equipment or support foreign investments.
0.5
Foreign Buyer Financing
Provides loans, lines of credit or guarantees to foreign buyers of capital goods and services from domestic suppliers.
2.5
Foreign Investment Financing
Provides loans to mid-sized companies to help them grow their international sales or make investment in foreign operations.
3.6
Supplier Financing Buys promissory notes issued by foreign buyers of Canadian goods and services.
0.2
Structured and Project Finance
Provides financing solutions to companies engaged in large-scale global projects.
1.9
Bonding and guarantees
3.2
Account Performance Security Guarantee
Helps businesses issue international transactions-related bonds by offering collateral solutions (100% guarantee), protection against wrongful calls (up to 95% of the losses), and reinsurance (up to 85% of the value of the bonds).
2.6
Foreign Exchange Facility Guarantee
Helps businesses engage in foreign exchange contracts by replacing the collateral that may be required by financial institutions.
0.09
Surety Bond Insurance
Protects surety companies from losses resulting from bonds issued on behalf of businesses.
0.3
Source: Information provided by the Canadian authorities, and EDC online information. Viewed at: http://www.edc. ca/EN/Our-Solutions/Pages/default.aspx.
3.108. In 2013, EDC facilitated a total of approximately Can$95.4 billion in exports, investment and domestic support. Preliminary data indicated a value of approximately Can$70 billion of business facilitated as of 30 September 2014 (Table 3.13). Approximately 60% of these resources went to businesses related to infrastructure and equipment, natural resources and the extractive industries.

WT/TPR/S/314 • Canada
- 79 -
3.109. EDC may also fund non-export related transactions, subject to ministerial approval. At the time of the financial crisis in 2009, the Export Development Act was amended to include domestic financing, guarantee and insurance solutions in EDC's mandate. The amendment also provided for an increase in the limits of the corporation's paid-in capital, outstanding commitments, and contingent liabilities. These measures were extended until March 2014. Between 2009 and March 2014, EDC used these temporary powers to provide approximately Can$11 billion in domestic support, of which Can$7.8 billion was provided in direct domestic lending, and Can$2.7 billion in domestic contract insurance and bonding.84 In 2014, the Export Development Act was amended to, inter alia, refocus the EDC on its initial mandate of supporting exports. The Amendment re-established a 50% export transaction and/or foreign market business volume threshold for businesses to be financed by EDC.
3.3 Measures Affecting Production and Trade
3.3.1 Business framework and Incentives
3.3.1.1 Business framework
3.110. The regulation of businesses, including licences and permits, takes place mainly at the provincial level. However, there is involvement at the municipal and federal level for certain sectors or activities. Depending on the type of business and the sector it will operate, a number of forms and permissions are needed from the province and/or the municipal government. If the business is a Canadian entity, it will generally take the form of a sole proprietorship, partnership, or corporation. Foreign businesses may also operate in Canada as a branch of the foreign entity. The corporate structure is the most common legal entity used in Canada.
3.111. The main federal law governing corporate statute is the Canada Business Corporations Act (CBCA) from 1985. Businesses may also choose to incorporate under provincial corporate laws, which are often modelled after the CBCA but often with certain differences. Under the CBCA, 25% of the corporation's directors must be Canadian residents. Approximately 235,000 companies are incorporated under the CBCA. In late 2014, Industry Canada was holding consultations to review the CBCA.85
3.112. Pursuant to Canada's Corporation's Return Act, corporations in Canada must report annually financial and other data to Statistics Canada. The purpose of the reporting requirement under this Act is to determine the level of foreign control in the Canadian economy. Some provinces also have similar reporting requirements. According to the latest data, the percentage of foreign controlled corporations in Canada has declined slightly over the period and now accounts for approximately 18%86 of all enterprises (Table 3.14). The industry sector with the highest foreign control is manufacturing (50%), while the one with the highest Canadian control is agriculture, forestry and fishing (99%). In terms of foreign country involvement, the United States is the main investor accounting for approximately half of the foreign interests, followed by the United Kingdom, and the Netherlands. Government business enterprises account for approximately 8% of corporations (see Section 3.3.4.4).87
Table 3.14 Overview of corporations in Canada by type of control, 2009-12
(Can$ million) 2009 2010 2011 2012 Under Canadian Control Assets 5,891,299 6,417,794 7,284,596 7,738,349 Revenues 2,149,253 2,271,519 2,459,788 2,534,509 Operating profits 186,304 232,608 265,229 277,726 Under Foreign Control Assets 1,447,677 1,524,120 1,694,591 1,748,662 Revenues 867,944 933,284 1,003,394 1,053,328 Operating profits 47,276 66,621 78,875 71,892
84 The other components are: Can$651 million in domestic credit insurance and re-insurance, and
Can$105 million in domestic loan guarantees. 85 Industry Canada online information. Viewed at: http://www.ic.gc.ca/eic/site/cilp-
pdci.nsf/eng/h_cl00022.html. 86 This percentage is in terms of assets. 87 This share incudes both federal and provincial data.

WT/TPR/S/314 • Canada
- 80 -
2009 2010 2011 2012 Government Business Enterprises Assets 541,440 744,670 765,268 807,659 Revenues 112,637 118,307 118,886 120,195 Operating profits 31,298 40,898 36,760 36,082
Source: Statistics Canada, CANSIM Table 179-004.
3.113. In 2012, the Government launched its initiative to reduce the burden of regulations after consultations with businesses. Its "Red Tape Reduction Action Plan" objectives are to reduce the burden on businesses, make it easier to do business with regulators, and improve service and predictability.88 The regulatory reform initiative is one of the most ambitious and will streamline regulatory approval processes, reduce reporting requirements, and improve compliance and enforcement.
3.3.2 Incentives and subsidies
3.114. There is no overarching legal framework governing incentives and subsidies in Canada. The government generally aims to create a competitive investment climate through its broad economic policies (e.g. sound fiscal policy, stable financial sector, low corporate tax rates). There are a number of incentives offered to businesses, including government grants and financing, tax credits and incentives, and wage subsidies by federal or provincial governments. According to a study by the Fraser Institute, and based on data from Statistics Canada spanning from 1981 to 2009 (fiscal years), federal, provincial, and municipal subsidies to private sector business, government business enterprises, and consumers amounted to 1.5% of GDP in 2009, with a cost to each taxpayer who filed and paid taxes of Can$1,507. The Fraser Institute also looked at a second data set from the federal department of Industry Canada and noted that between 1961 and 2013, this department disbursed Can$22.4 billion to private sector business and the top 10 recipients (e.g. Pratt & Whitney Canada, Bombardier, CAE Inc., and General Motors of Canada) received Can$8.5 billion, or 38% of all money disbursed.89
3.115. According to Canada Business Network, a government information service for business, there are some 755 support programmes providing assistance to businesses in the form of grants, loan guarantees, tax refunds and credits, and wage subsidies. Many are at the provincial level and thus, restricted to recipients established in the province. Others are sector specific, such as agriculture and cultural industries. An overview of the programmes listed indicates that most are specifically targeted to a particular sector or location and that many programmes offered were with respect to grants or contributions. It was not possible to determine the total amount of aid provided under each programme or category (Table 3.15).90
Table 3.15 Government Financing Programmes Listed by Canada Business Network, December 2014
Financing type Number of programmes Grants, contributions, and financial assistance 238 Loans and cash advances 114 Loan guarantees 27 Tax refunds and credits 71 Wage subsidies 76 Equity investments 24 Financing for innovation 159
Source: Viewed at: http://www.canadabusiness.ca/eng/page/2848/.
3.116. Industry Canada maintains three special financing programmes: two for the Aerospace and Defence industry, known as the Strategic Aerospace and Defence Initiative (SADI) and the Technology Demonstration Program (TPD); and another one for small businesses, known as the Canada Small Business Financing Program (CSBFP). The SADI sets out to enhance the competitiveness of the Aerospace and Defence industry by providing repayable contributions to support research and development projects in the aerospace, space, defence and security
88 Government of Canada (2012b). 89 Milke (2014). 90 Canada Business Network online information. Viewed at:
http://www.canadabusiness.ca/eng/page/m2848/.
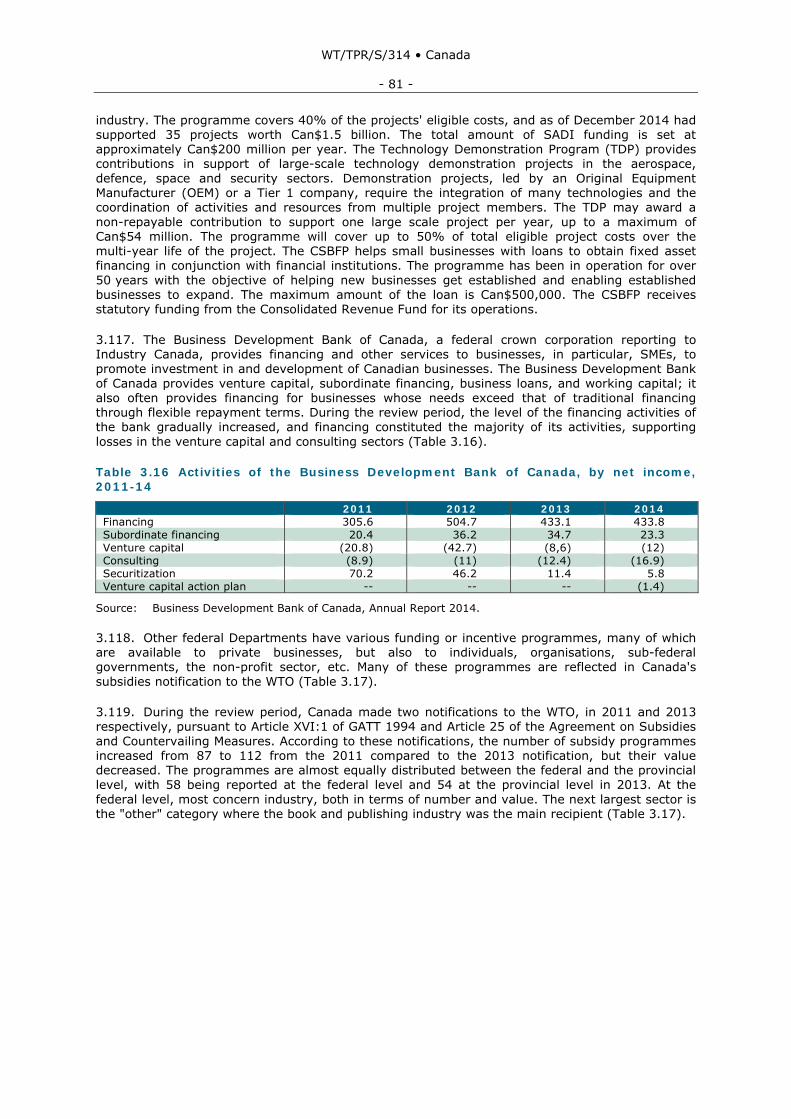
WT/TPR/S/314 • Canada
- 81 -
industry. The programme covers 40% of the projects' eligible costs, and as of December 2014 had supported 35 projects worth Can$1.5 billion. The total amount of SADI funding is set at approximately Can$200 million per year. The Technology Demonstration Program (TDP) provides contributions in support of large-scale technology demonstration projects in the aerospace, defence, space and security sectors. Demonstration projects, led by an Original Equipment Manufacturer (OEM) or a Tier 1 company, require the integration of many technologies and the coordination of activities and resources from multiple project members. The TDP may award a non-repayable contribution to support one large scale project per year, up to a maximum of Can$54 million. The programme will cover up to 50% of total eligible project costs over the multi-year life of the project. The CSBFP helps small businesses with loans to obtain fixed asset financing in conjunction with financial institutions. The programme has been in operation for over 50 years with the objective of helping new businesses get established and enabling established businesses to expand. The maximum amount of the loan is Can$500,000. The CSBFP receives statutory funding from the Consolidated Revenue Fund for its operations.
3.117. The Business Development Bank of Canada, a federal crown corporation reporting to Industry Canada, provides financing and other services to businesses, in particular, SMEs, to promote investment in and development of Canadian businesses. The Business Development Bank of Canada provides venture capital, subordinate financing, business loans, and working capital; it also often provides financing for businesses whose needs exceed that of traditional financing through flexible repayment terms. During the review period, the level of the financing activities of the bank gradually increased, and financing constituted the majority of its activities, supporting losses in the venture capital and consulting sectors (Table 3.16).
Table 3.16 Activities of the Business Development Bank of Canada, by net income, 2011-14
2011 2012 2013 2014 Financing 305.6 504.7 433.1 433.8 Subordinate financing 20.4 36.2 34.7 23.3 Venture capital (20.8) (42.7) (8,6) (12) Consulting (8.9) (11) (12.4) (16.9) Securitization 70.2 46.2 11.4 5.8 Venture capital action plan -- -- -- (1.4)
Source: Business Development Bank of Canada, Annual Report 2014.
3.118. Other federal Departments have various funding or incentive programmes, many of which are available to private businesses, but also to individuals, organisations, sub-federal governments, the non-profit sector, etc. Many of these programmes are reflected in Canada's subsidies notification to the WTO (Table 3.17).
3.119. During the review period, Canada made two notifications to the WTO, in 2011 and 2013 respectively, pursuant to Article XVI:1 of GATT 1994 and Article 25 of the Agreement on Subsidies and Countervailing Measures. According to these notifications, the number of subsidy programmes increased from 87 to 112 from the 2011 compared to the 2013 notification, but their value decreased. The programmes are almost equally distributed between the federal and the provincial level, with 58 being reported at the federal level and 54 at the provincial level in 2013. At the federal level, most concern industry, both in terms of number and value. The next largest sector is the "other" category where the book and publishing industry was the main recipient (Table 3.17).

WT/TPR/S/314 • Canada
- 82 -
Table 3.17 Overview of subsidies notified to the WTO, 2013
(Can$ million)
Programmea Number of programmes FY2010/11 FY2011/12
Federal Industry 43 2,164.6 1,619.5 Agriculture 3 66.8b 14.6b Fisheries 4 65.1 73.4 Forestry 4 39a 39a Other 4 124.1 124.6
a Totals for provincial programmes are not included but can be consulted in WTO document G/SCM/N/253/CAN, 19 July 2013.
b For one or more programmes a value could not be determined.
Source: WTO document G/SCM/N/253/CAN, 19 July 2013.
3.3.3 Competition policy and price controls
3.3.3.1 Main regulatory and institutional framework
3.120. Competition law in Canada is largely governed by the federal Competition Act. The purpose of the Competition Act is to maintain and encourage competition in Canada in order to promote the efficiency and adaptability of the Canadian economy, in order to expand opportunities for Canadian participation in world markets while at the same time recognizing the role of foreign competition in Canada, in order to ensure that small and medium-sized enterprises have an equitable opportunity to participate in the Canadian economy and in order to provide consumers with competitive prices and product choices. It addresses three categories of conduct: mergers, criminal matters and reviewable trade practices. In July 2014, Canada's Anti-Spam Legislation (CASL) came into effect. CASL amended the Competition Act in order to enable the Competition Bureau to more effectively address false or misleading representations and deceptive marketing practices in the electronic marketplace. The provisions of CASL are enforced by the Competition Bureau together with the Canada Radio-television and Telecommunications Commission (the "CRTC") and the Office of the Privacy Commissioner.
3.121. The Commissioner of the Competition Bureau (the "Commissioner") is responsible for the administration and enforcement of the Competition Act and three labelling statutes. Adjudication of non-criminal matters (i.e., "civil matters"), such as mergers and abuse of dominance, is initiated by the Commissioner filing an application with the Competition Tribunal, a quasi-judicial federal tribunal, for an interim or remedial order, or the courts in the case of deceptive marketing practices. Evidence in criminal investigations, such as cartel offences and false or misleading representations, is referred to the Public Prosecution Service of Canada, which then makes an independent evaluation of whether prosecution of the matter before the courts is in the public interest. Private parties can also seek leave to initiate proceedings before the Competition Tribunal for certain reviewable trade practices. The legislation provides the Commissioner, and to a lesser extent private parties, with the ability to settle civil violations by registering consent agreements with the Competition Tribunal. The Public Prosecution Service of Canada can also settle criminal matters through guilty plea and/or prohibition order arrangements subject to court approval.
3.122. According to its 2014-15 Annual Plan, the Competition Bureau has set out four priorities for 2014-15: applying effective and integrated enforcement and administration of the Competition Act and labelling statutes; increasing competition promotion efforts to advance a culture of compliance and competition advocacy; aligning with and delivering on Government of Canada priorities; and, increasing organizational synergies through its people, planning and systems.
3.123. A range of civil and criminal sanctions are available under the Competition Act depending on the provision in question; a number of potential penalties or outcomes are possible (Table 3.18).
3.124. Most businesses and sectors of the economy are subject to the Competition Act. The Competition Act also applies to Crown corporations engaged in commercial activities in actual or potential competition with other businesses. Notwithstanding the broad application of the Competition Act, exemptions to its application do exist under the Competition Act itself and other

WT/TPR/S/314 • Canada
- 83 -
federal statutes. These include, but are not limited to, exemptions for certain business activities (e.g. securities underwriting, amateur sport and collective bargaining), proposed merger transactions involving a federally-regulated financial institution where the Minister of Finance has certified the merger to be in the public interest, a similar exemption for mergers involving a transportation undertaking where the Minister of Transport has certified the merger to be in the public interest, exemptions to address temporary emergencies and commitments in international agreements as well as a variety of other Competition Act specific exemptions to address issues such as affiliation between businesses, efficiencies, the application of intellectual property laws as well as the regulated conduct defence. Also mergers of transportation undertakings that are approved by the Governor-in-Council upon recommendation of the Minister of Transport are not subject to certain provisions of the Competition Act.
Table 3.18 Overview of the Competition Act provisions
Provision Conduct Penalty/Outcome Mergers Notification and/or pre-notification
(Civil) Prohibition orders, divesture orders, dissolution and other remedial orders, consent agreements
Conspiracy Criminal Substantial fines, prison time, prohibition orders, and civil damages awards
Bid-rigging Criminal Substantial fines, prison time, prohibition orders, and civil damages awards
False or misleading representations
Criminal Substantial fines, prison time, prohibition orders, and civil damages awards
Competitor agreements Reviewable (Civil) Prohibition order, corrective notices, administrative monetary penalties, restitution, consent agreements
Misrepresentations to the public Reviewable (Civil) Prohibition orders, other remedial orders on consent, consent agreements
Abuse of dominance Reviewable (Civil) Prohibition and other remedial orders, administrative monetary penalties, consent agreements
Price maintenance Reviewable (Civil) Prohibition order, order to accept a person as a customer, consent agreements
Refusal to deal Reviewable (Civil) Orders to accept a person as a customer, consent agreements
Tied selling Reviewable (Civil) Prohibition order, orders to compensate, and administrative monetary penalties
Exclusive dealing Reviewable (Civil) Prohibition order, orders to compensate, and administrative monetary penalties
Vertical market restriction (Exclusive dealing, tied selling and market restriction)
Reviewable (Civil) Prohibition order and other remedial orders, consent agreements
Source: WTO Secretariat, based on the Competition Act, and information provided by the Canadian authorities.
3.125. During 2010-14, the number of merger examinations has remained steady at about 230 per year, whereas other examinations fluctuated, but slightly increased over the period. Actions with respect to mergers involved the most examinations (Table 3.19).
Table 3.19 Competition statistics, 2010/14
(Number of cases) 2010/11 2011/12 2012/13 2013/14 Merger Examinations Examinations commenced 236 228 226 230 Examinations concluded 228 221 232 233 Concluded with issues under the Act 5 2 4 8
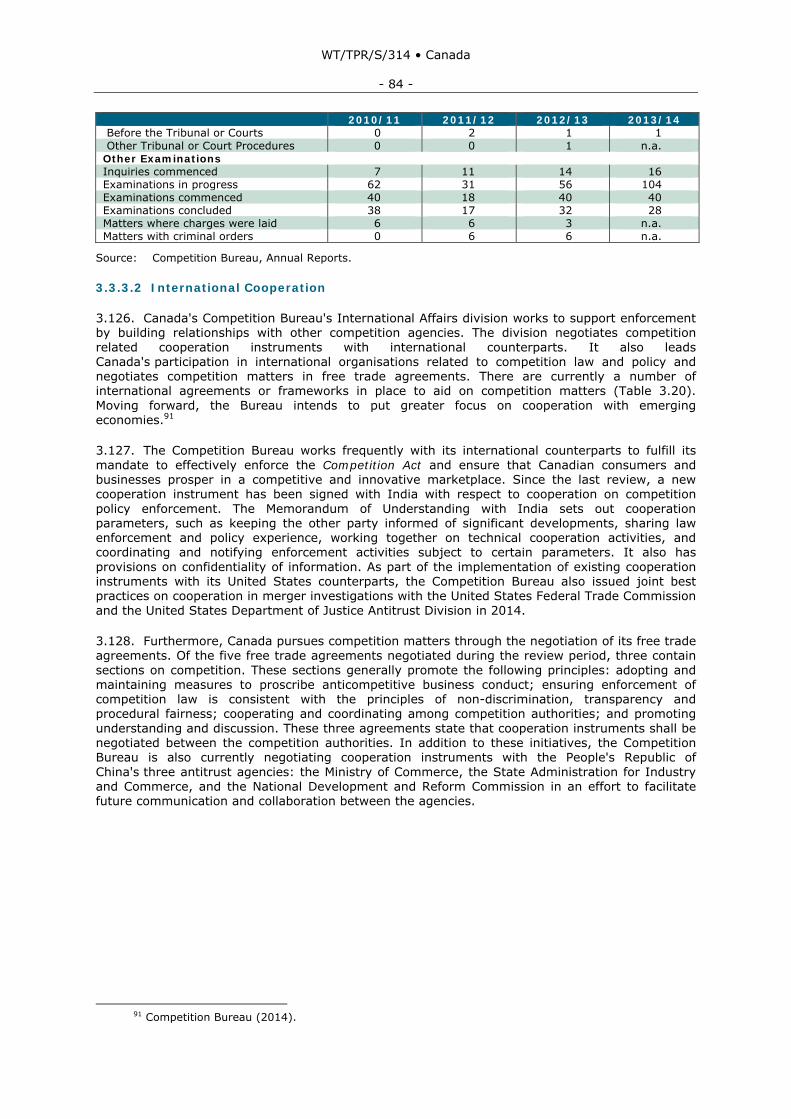
WT/TPR/S/314 • Canada
- 84 -
2010/11 2011/12 2012/13 2013/14 Before the Tribunal or Courts 0 2 1 1 Other Tribunal or Court Procedures 0 0 1 n.a. Other Examinations Inquiries commenced 7 11 14 16 Examinations in progress 62 31 56 104 Examinations commenced 40 18 40 40 Examinations concluded 38 17 32 28 Matters where charges were laid 6 6 3 n.a. Matters with criminal orders 0 6 6 n.a.
Source: Competition Bureau, Annual Reports.
3.3.3.2 International Cooperation
3.126. Canada's Competition Bureau's International Affairs division works to support enforcement by building relationships with other competition agencies. The division negotiates competition related cooperation instruments with international counterparts. It also leads Canada's participation in international organisations related to competition law and policy and negotiates competition matters in free trade agreements. There are currently a number of international agreements or frameworks in place to aid on competition matters (Table 3.20). Moving forward, the Bureau intends to put greater focus on cooperation with emerging economies.91
3.127. The Competition Bureau works frequently with its international counterparts to fulfill its mandate to effectively enforce the Competition Act and ensure that Canadian consumers and businesses prosper in a competitive and innovative marketplace. Since the last review, a new cooperation instrument has been signed with India with respect to cooperation on competition policy enforcement. The Memorandum of Understanding with India sets out cooperation parameters, such as keeping the other party informed of significant developments, sharing law enforcement and policy experience, working together on technical cooperation activities, and coordinating and notifying enforcement activities subject to certain parameters. It also has provisions on confidentiality of information. As part of the implementation of existing cooperation instruments with its United States counterparts, the Competition Bureau also issued joint best practices on cooperation in merger investigations with the United States Federal Trade Commission and the United States Department of Justice Antitrust Division in 2014.
3.128. Furthermore, Canada pursues competition matters through the negotiation of its free trade agreements. Of the five free trade agreements negotiated during the review period, three contain sections on competition. These sections generally promote the following principles: adopting and maintaining measures to proscribe anticompetitive business conduct; ensuring enforcement of competition law is consistent with the principles of non-discrimination, transparency and procedural fairness; cooperating and coordinating among competition authorities; and promoting understanding and discussion. These three agreements state that cooperation instruments shall be negotiated between the competition authorities. In addition to these initiatives, the Competition Bureau is also currently negotiating cooperation instruments with the People's Republic of China's three antitrust agencies: the Ministry of Commerce, the State Administration for Industry and Commerce, and the National Development and Reform Commission in an effort to facilitate future communication and collaboration between the agencies.
91 Competition Bureau (2014).
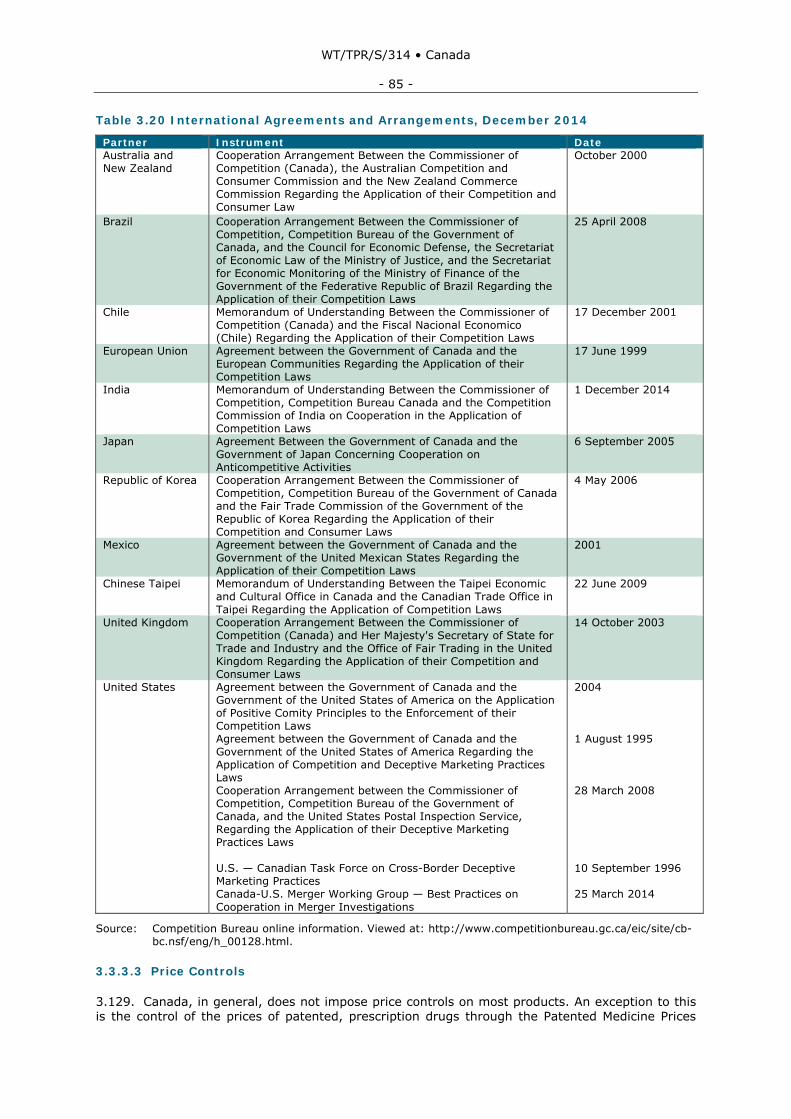
WT/TPR/S/314 • Canada
- 85 -
Table 3.20 International Agreements and Arrangements, December 2014
Partner Instrument Date Australia and New Zealand
Cooperation Arrangement Between the Commissioner of Competition (Canada), the Australian Competition and Consumer Commission and the New Zealand Commerce Commission Regarding the Application of their Competition and Consumer Law
October 2000
Brazil Cooperation Arrangement Between the Commissioner of Competition, Competition Bureau of the Government of Canada, and the Council for Economic Defense, the Secretariat of Economic Law of the Ministry of Justice, and the Secretariat for Economic Monitoring of the Ministry of Finance of the Government of the Federative Republic of Brazil Regarding the Application of their Competition Laws
25 April 2008
Chile Memorandum of Understanding Between the Commissioner of Competition (Canada) and the Fiscal Nacional Economico (Chile) Regarding the Application of their Competition Laws
17 December 2001
European Union Agreement between the Government of Canada and the European Communities Regarding the Application of their Competition Laws
17 June 1999
India Memorandum of Understanding Between the Commissioner of Competition, Competition Bureau Canada and the Competition Commission of India on Cooperation in the Application of Competition Laws
1 December 2014
Japan Agreement Between the Government of Canada and the Government of Japan Concerning Cooperation on Anticompetitive Activities
6 September 2005
Republic of Korea Cooperation Arrangement Between the Commissioner of Competition, Competition Bureau of the Government of Canada and the Fair Trade Commission of the Government of the Republic of Korea Regarding the Application of their Competition and Consumer Laws
4 May 2006
Mexico Agreement between the Government of Canada and the Government of the United Mexican States Regarding the Application of their Competition Laws
2001
Chinese Taipei Memorandum of Understanding Between the Taipei Economic and Cultural Office in Canada and the Canadian Trade Office in Taipei Regarding the Application of Competition Laws
22 June 2009
United Kingdom Cooperation Arrangement Between the Commissioner of Competition (Canada) and Her Majesty's Secretary of State for Trade and Industry and the Office of Fair Trading in the United Kingdom Regarding the Application of their Competition and Consumer Laws
14 October 2003
United States Agreement between the Government of Canada and the Government of the United States of America on the Application of Positive Comity Principles to the Enforcement of their Competition Laws Agreement between the Government of Canada and the Government of the United States of America Regarding the Application of Competition and Deceptive Marketing Practices Laws Cooperation Arrangement between the Commissioner of Competition, Competition Bureau of the Government of Canada, and the United States Postal Inspection Service, Regarding the Application of their Deceptive Marketing Practices Laws U.S. — Canadian Task Force on Cross-Border Deceptive Marketing Practices Canada-U.S. Merger Working Group — Best Practices on Cooperation in Merger Investigations
2004 1 August 1995 28 March 2008 10 September 1996 25 March 2014
Source: Competition Bureau online information. Viewed at: http://www.competitionbureau.gc.ca/eic/site/cb-bc.nsf/eng/h_00128.html.
3.3.3.3 Price Controls
3.129. Canada, in general, does not impose price controls on most products. An exception to this is the control of the prices of patented, prescription drugs through the Patented Medicine Prices

WT/TPR/S/314 • Canada
- 86 -
Review Board (PMPRB). In Canada, both the federal and provincial governments affect the prices of medicines. The federal government regulates prices of patented medicines by its use of the Patent Act whereas the provincial governments affect the prices of medicines through their drug reimbursement programmes. These roles are based on Canada's constitutional division of powers. The Patented Medicine Prices Review Board (PMPRB) is an independent quasi-judicial federal body established in 1987 that protects the interests of Canadian consumers by ensuring that the prices of patented medicines sold in Canada are not excessive. It does this by reviewing the prices that patentees charge for each individual patented drug product in Canadian markets. If a price is found to be excessive, the Board can hold public hearings and order price reductions and/or the offset of excess revenues. The PMPRB regulates the "factory gate" prices and does not have jurisdiction over prices charged by wholesalers or pharmacies, or over pharmacists' professional fees.
3.130. In 2013, there were 115 new patented drugs submitted to the PMPRB, of which 93 (81% of the total) were found to be within the guidelines, 7 (6%) appeared to exceed the guidelines but did not trigger investigation, and 15 (13%) appeared to exceed the guidelines and led to the commencement of investigations. The figures for 2013 are typical of historical trends; whereby approximately 82% of drugs fall within the guidelines and the remaining 18% result in a review, investigation, or voluntary compliance undertakings.92
3.131. On 9 December 2014, the Minister of Industry introduced the Price Transparency Act in the Parliament of Canada, however as of February 2015 the proposed legislation has not been approved.
3.3.4 State trading, state-owned enterprises, and privatization
3.3.4.1 Stated trading enterprises
3.132. In 2012 and 2014 Canada notified the WTO of three federal and 13 provincial entities which it considers as state-trading enterprises (STEs) pursuant to the provisions of Article XVII: 4(a) of GATT 1994 and paragraph 1 of the Understanding on the Interpretation of Article XVII. One federal and the 13 provincial entities have special privileges with respect to sales or marketing abroad of certain products and the other two with respect to importation. The estimated impact of these STEs on the overall trade of Canada appears to be minimal as they represent a small percentage of overall trade (Table 3.21).
Table 3.21 State-trading enterprises, 2014
Entity Function
Amount of trade 2013 (imports or exports as appropriate) impacted
(US$ million or Can$ million)
As a % of total trade 2013
Canadian Dairy Commission
Imports of butter are subject to control and the Commission has exclusive or special privileges for butter imports.
23.1 (US$) 0%
Canadian Wheat Board The Board had special authority with respect to marketing and sales of wheat and barley grown in certain provinces, however as of August 2012, the CWB no longer has an export monopoly, but retains a Government borrowing guarantee.
.. ..
Freshwater Fish Marketing Corporation
The Corporation is concerned with marketing, inter-provincial trade, and exportation of freshwater fish from certain provinces.
52.3 (Can$) 0%
92 Patented Medicine Price Review Board (2014).

WT/TPR/S/314 • Canada
- 87 -
Entity Function
Amount of trade 2013 (imports or exports as appropriate) impacted
(US$ million or Can$ million)
As a % of total trade 2013
Provincial and Territorial Liquor Control Authorities
The Liquor Control Authorities have control over the importation and inter-provincial trade of alcoholic beverages.
3,488 (US$) 0.8%
.. Not available. Since the monopoly changed in August 2012, the CWB's marketings have fallen and are no longer being publically reported.
Source: WTO documents G/STR/N/14/CAN, 6 July 2012; and G/STR/N/15/CAN, 8 July 2014. UNSD Comtrade database, and information provided by the Canadian authorities.
3.3.4.2 Federal Crown Corporations
3.133. State-owned enterprises in Canada are known as Crown corporations and are wholly owned by the federal or provincial governments although they are often structured like private companies. Crown corporations are still under government control but have more autonomy compared to government departments. Crown corporation operations in Canada are significant, with federal crown corporations accounting for approximately 0.7% of GDP and provincial crown corporations accounting for 2.7% of GDP (see Section 3.3.4.4 for the discussion on provincial crown corporations).93
3.134. Crown corporations are subject to the governance and accountability framework set out in the Financial Administration Act (FAA), and in some cases, their own constituent Acts. There are both self-financing Crown corporations, as well as those which receive government appropriations. Most Crown corporations are required to have their budgets approved annually by the Treasury Board (TB). The Governor in Council appoints their boards of directors and, for a number of Crown corporations, their President and Chief Executive Officers. In 2013, changes were made to the FAA pursuant to the budget bill giving the Governor in Council the authority to direct a Crown corporation to seek the TB's approval of collective bargaining mandates for Crown corporations, as well as the authority to direct a Crown corporation to seek the TB's approval before the corporation fixes the terms and conditions of employment of its non-unionized and management employees.
3.135. As of December 2014, Canada had 45 federal crown corporations operating in 13 market segments. Crown corporations operate in a number of sectors, but many are concentrated in the transportation, heritage, and finance sectors. A number of them have mandates relating to trade matters such as Export Development Canada, the Canadian Tourism Commission, and the Bank of Canada. In terms of assets, the largest crown corporations are the Canadian Mortgage and Housing Corporation, the Canada Pension Plan Investment Board, and the Bank of Canada (Table 3.22).
Table 3.22 Crown Corporations, 2014
Crown corporation and sector
Mandate Assets (Dec. 2012) Can$ million
Agriculture Canadian Dairy Commission
To provide efficient producers of milk and cream with the opportunity of obtaining a fair return for their labor and investment and to provide consumers of dairy products with a continuous and adequate supply of dairy products of high quality.
117.5
Farm Credit Canada
To enhance rural Canada by providing specialized and personalized business and financial services and products to farming operations, including family farms, and businesses in rural Canada, including small and medium-sized businesses, that are related to farming. The primary focus of the activities of the corporation shall be on farming operations, including family farms.
25,925.2
93 Crisan and McKenzie (2013).

WT/TPR/S/314 • Canada
- 88 -
Crown corporation and sector
Mandate Assets (Dec. 2012) Can$ million
Citizenship, Multiculturism Canadian Race Relations Foundation
To facilitate throughout Canada the development, sharing, and application of knowledge and expertise to contribute to the elimination of racism and all other forms of racial discrimination in Canadian society.
24.6
Employment and Social Development Canada Mortgage and Housing Corporation
CMHC's mandate is to promote the construction of new houses, the repair and modernization of existing houses, and the improvement of housing and living conditions.
292,040.0
Finance Bank of Canada The mandate of the Bank is to regulate credit and currency in
the best interests of the economic life of the nation, to control and protect the external value of the national monetary unit and to mitigate by its influence fluctuations in the general level of production, trade, prices and employment, so far as may be possible within the scope of monetary action, and generally to promote the economic and financial welfare of Canada. The Bank acts as fiscal agent of the Government of Canada. The Bank has the sole right to issue notes.
77,807.3
Canada Deposit Insurance Corporation
To provide insurance against the loss of part or all of deposits, to promote and otherwise contribute to the stability of the financial system in Canada, and to pursue the foregoing for the benefit of persons having deposits with member institutions and in such a manner as will minimize the exposure of the Corporation to loss.
2,578.1
Canada Development Investment Corporation
To assist in the creation or development of businesses, resources, properties and industries of Canada; to expand, widen and develop opportunities for Canadians to participate in the economic development of Canada through the application of their skills and capital in any activities carried on by the Corporation; to invest in the shares or securities of any corporation owning property or carrying on business related to the economic interests of Canada; to invest in ventures or enterprises, including the acquisition of property, likely to benefit Canada; and to carry out all activities in the best interests of Canada, operating in a commercial manner.
4,894.6
Canada Pension Plan Investment Board
To assist the Canada Pension Plan in meeting its obligations to contributors and beneficiaries under the Canada Pension Plan; to manage any amounts transferred to it under the Canada Pension Plan, and its right, title or interest in any designated securities, in the best interests of the contributors and beneficiaries under that Act; and to invest its assets with a view to achieving a maximum rate of return, without undue risk of loss, having regard to the factors that may affect the funding of the Canada Pension Plan and the ability of the Canada Pension Plan to meet its financial obligations on any given business day.
193,926.0
PPP Canada Inc. PPP Canada's mandate is to improve the delivery of public infrastructure by achieving better value, timeliness, and accountability to taxpayers through public private partnerships (P3s).
679.7
Royal Canadian Mint
To mint coins in anticipation of profit and to carry out other related activities.
370.7
Fisheries Freshwater Fish Marketing Corporation
To purchase all fish lawfully fished and offered for sale, to create an orderly market, to promote international markets, to increase the fish trade, and to increase returns to fishers.
48.3
Foreign Affairs, Trade, Development Canadian Commercial Corporation
To assist in the development of trade between Canada and other nations and to assist persons in Canada to obtain goods and commodities from outside Canada and to dispose of goods and commodities that are available for export from Canada.
1,220.9

WT/TPR/S/314 • Canada
- 89 -
Crown corporation and sector
Mandate Assets (Dec. 2012) Can$ million
Export Development Canada
EDC's mandate is to support and develop, directly or indirectly, Canada's export trade and Canadian capacity to engage in that trade, as well as respond to international business opportunities.
36,233.0
International Development Research Centre
The International Development Research Centre (IDRC) helps developing countries find solutions to problems. It encourages, supports, and conducts research in the world's developing regions and on developing world and global challenges more broadly. In doing so, IDRC seeks to apply new knowledge towards the economic and social improvement of developing regions. IDRC's programmes promote innovation to increase food security, stimulate economic growth, secure the future of children and youth, notably by improving health, ensure stability and security, and advance democracy.
134.5
National Capital Commission
To prepare plans for and assist in the development, conservation, and improvement of Canada's Capital Region in order that the nature and character of the seat of the Government of Canada may be in accordance with its national significance.
725.6
Industry Business Development Bank of Canada
The purpose of the Bank is to support Canadian entrepreneurship by providing financial and management services and by issuing securities or otherwise raising funds or capital in support of those services. In carrying out its activities, the Bank must give a particular consideration to the needs of small and medium-sized enterprises.
17,912.8
Canadian Tourism Commission
To sustain a vibrant and profitable tourism industry in Canada; to market Canada as a desirable tourist destination; to support a cooperative relationship between the private sector and the governments of Canada, the provinces, and the territories with respect to Canadian tourism; and to provide information about Canadian tourism to the private sector and to the federal, provincial, and territorial governments.
23.3
Standards Council of Canada
To oversee Canada's standardization system by promoting efficient and effective voluntary standardization in Canada, when standardization is not expressly provided for by law, in order to advance the national economy, support sustainable development, benefit the health, safety, and welfare of workers and the public, assist and protect consumers, facilitate domestic and international trade, and further international cooperation in relation to standardization.
8.4
Infrastructure The Jacques-Cartier and Champlain Bridges Inc.
Ensure a safe passage for users through the management, maintenance, and rehabilitation of our infrastructure by optimizing traffic flow and respecting the environment.
Natural Resources Atomic Energy of Canada Limited
AECL today has three key aspects of its Value Proposition that have a national impact: • As an advisor to, and agent of, the Government of Canada for public policy purposes; • As an enabler of business innovation and technology transfer; • As a generator of highly qualified people.
1,151.2
Public Works and Government Services Canada Lands Company Limited
Through its subsidiaries, to ensure the commercially oriented, orderly disposition of selected surplus federal real properties with optimal value to the Canadian taxpayer and the holding of certain properties.
490.4
Defence Construction (1951) Limited
To deliver and maintain infrastructure and environmental projects and services, and provide full lifecycle support for infrastructure and environmental assets, required for the defence of Canada.
62.3

WT/TPR/S/314 • Canada
- 90 -
Crown corporation and sector
Mandate Assets (Dec. 2012) Can$ million
Transport Pilotage Authorities: - Atlantic - Great Lakes - Laurentian - Pacific
To establish, operate, maintain, and administer, in the interest of safety, an efficient pilotage service within the designated waters set out in respect of each Authority.
14.9 (Atlantic) 7.1 (Great Lakes) 33.3 (Laurentian) 30.1 (Pacific)
Blue Water Bridge Authority
To operate, maintain, and repair the Canadian halves of the two bridges spanning the St. Clair River between Point Edward (Sarnia), Ontario, and Port Huron, Michigan, and the approaches and structures.
248.7
Canada Post Corporation
To establish and operate a postal service for the collection, transmission and delivery of messages, information, funds and goods both within Canada and between Canada and places outside Canada, and to conduct its operations on a self-sustaining financial basis while providing a standard of service that will meet the needs of the people of Canada and that is similar with respect to communities of the same size.
7,018.0
Canadian Air Transport Security Authority
The Canadian Air Transport Security Authority (CATSA) is responsible for the delivery of effective and efficient screening of persons who access aircraft or restricted areas through screening points, the property in their possession or control, and the belongings or baggage that they give to an air carrier for transport.
350.6
The Federal Bridge Corporation Limited
To provide users with safe and effective infrastructures through its two wholly-owned subsidiaries, The Seaways International Bridge Corporation, Ltd., and St. Mary's River Bridge Company, as well as the Canadian facilities of the Thousand Islands International Bridge.
417.7
Marine Atlantic Inc.
To provide a safe, environmentally responsible, and quality ferry service between the Island of Newfoundland and the Province of Nova Scotia in a reliable, courteous, and cost-effective manner.
325.7
Ridley Terminals Inc.
To provide continuous, high-quality, and high-performance rail car unloading, product storage, and loading services as a marine terminal and to operate in a commercial manner.
348.5
VIA Rail Canada Inc.
To offer a national passenger rail transportation service that is safe, secure, efficient, reliable, and environmentally sustainable, and that meets the needs of travelers in Canada.
1,316.8
Treasury Board Public Sector Pension Investment Board
To manage the amounts transferred under the Canadian Forces Superannuation Act, the Public Service Superannuation Act, and the Royal Canadian Mounted Police Superannuation Act (the "Acts") in the best interests of the contributors and beneficiaries under those Acts and to invest the assets with a view to achieving a maximum rate of return, without undue risk of loss, having regard to the funding, policies and requirements of the pension plans established under the Acts and the ability of those pension plans to meet their financial obligations.
n.a.
Canadian Heritage Canada Council for the Arts
To foster and promote the study, enjoyment, and production of works in the arts.
302.7
Canadian Broadcasting Corporation
To inform, enlighten, and entertain; to contribute to the development of a shared national consciousness and identity; to reflect the regional and cultural diversity of Canada; and to contribute to the development of Canadian talent and culture.
1,688.4
Canadian Museum for Human Rights
To explore the subject of human rights, with special but not exclusive reference to Canada, in order to enhance public understanding of human rights, to promote respect for others, and to encourage reflection and dialogue.
321.7
Canadian Museum of History
To enhance Canadians' knowledge, understanding and appreciation of events, experiences, people and objects that reflect and have shaped Canada's history and identity and also to enhance their awareness of world history and cultures.
321.0

WT/TPR/S/314 • Canada
- 91 -
Crown corporation and sector
Mandate Assets (Dec. 2012) Can$ million
Canadian Museum of Immigration at Pier 21
To explore the theme of immigration to Canada in order to enhance public understanding of the experiences of immigrants as they arrived in Canada, of the vital role immigration has played in the building of Canada and of the contributions of immigrants to Canada's culture, economy and way of life.
23.8
Canadian Museum of Nature
To increase, throughout Canada and internationally, interest in, knowledge of, and appreciation and respect for the natural world by establishing, maintaining, and developing for research and posterity a collection of natural history objects, with special but not exclusive reference to Canada, and by demonstrating the natural world, the knowledge derived from it, and the understanding it represents.
217.3
National Arts Centre Corporation
To operate and maintain the Centre, to develop the performing arts in the National Capital Region and to assist the Canada Council for the Arts in the development of the performing arts elsewhere in Canada.
87.0
National Gallery of Canada
To develop, maintain, and make known, throughout Canada and internationally, a collection of works of art, both historic and contemporary, with special but not exclusive reference to Canada and to further knowledge, understanding, and enjoyment of art in general among all Canadians.
117.7
National Museum of Science and Technology
To foster scientific and technological literacy throughout Canada by establishing, maintaining, and developing a collection of scientific and technological objects, with special but not exclusive reference to Canada, and by demonstrating the products and processes of science and technology, as well as their economic, social, and cultural relationships with society.
77.2
Telefilm Canada To foster and promote the development of the audiovisual industry in Canada.
57.3
n.a. Not applicable.
Sources: Treasury Board Canada online information. Viewed at: http://www.tbs-sct.gc.ca/reports-rapports/cc-se/corporate-societe/ccp-pse-eng.asp; Treasury Board Canada online information. Viewed at: http://www.tbs-sct.gc.ca/reports-rapports/cc-se/corporate-societe/ccp-pse-eng.asp; and Treasury Board Canada online information. Viewed at: https://tbs-sct.gc.ca/reports-rapports/cc-se/crown-etat/efp-esf-eng.asp?fiscalQuarter=2012-12-31.
3.3.4.3 Other entities that operate with federal government participation
3.136. Canada has other structures, known as mixed enterprises, joint enterprises, and shared-governance corporations, whereby the federal government maintains an interest or is involved in oversight. In the case of mixed enterprises, part of the shares is owned by the Federal Government and the rest by the private sector, whereas for joint enterprises, there is a part owned by the Federal Government and the rest by another level of government. Share-governance corporations are corporate entities where the government has the right to nominate members to the governing body.
3.137. Currently, there are two joint enterprises, the Lower Churchill Development Corporation Limited and North Portage Development Corporation. There are 85 shared-governance corporations, operating in most sectors of the economy, but mostly concentrated in the transport sector, involving port or airport authorities.94 There is also the Canadian Wheat Board and the Internal Trade Secretariat Corporation that have trade-related functions.
3.3.4.4 Provincial Crown corporations and government enterprises
3.138. In addition to federal crown corporations there are crown corporations at the provincial level. There is no comprehensive government source listing all provincial crown corporations, but it is estimated that there are approximately 200.95 Nonetheless, the provincial crown corporations
94 Viewed at: http://www.tbs-sct.gc.ca/reports-rapports/cc-se/corporate-societe/ocip-pasl-eng.asp for
the full listing of shared-governance corporations. 95 Crisan and McKenzie (2013).

WT/TPR/S/314 • Canada
- 92 -
are significant, accounting for approximately 2.7% of GDP, and they operate in many sectors of the economy, but in particular in the areas of energy and power generating. Many of the largest provincial crown corporations such as Hydro-Quebec, Ontario Power Generation, and B.C. Hydro and Power, have annual revenues exceeding those of most of the federal crown corporations, thus the provincial crown corporations play a larger role in the economy compared to the federal crown corporations96 (Table 3.23).
Table 3.23 Ten largest provincial crown corporations, 2012 Report
Crown corporation Industry Revenue (Can$ million) Hydro-Quebec Power generation 12,392 Caisse de dépôt et placement Finance 8,398 Ontario Power Generation Power generation 8,398 Hydro One Power generation 5,486 Insurance Corp. of B.C Insurance 4,165 B.C. Hydro & Power Power generation 4,078 Manitoba Hydro-Electric Board Power generation 2,037 Saskatchewan Power Corp Power generation 1,865 ATB Program Finance 1,357 Alberta heritages savings Banking 1,152
Source: Globe and Mail, 2012 Report online information. Viewed at: http://www.theglobeandmail.com/ report-on-business/rob-magazine/top-1000/2012-rankings-for-federal-and-provincial-crown-corporations/article4360532/.
3.139. A category of enterprises whereby the Government maintains control but operates in the market place with other private firms is categorised as a government business enterprise for statistical reporting purposes in Canada. At the provincial level, most of the provincial crown corporations are considered provincial government business enterprises. When comparing federal government enterprises with provincial government enterprises, both which approximate federal and provincial crown corporations respectively, the revenues of provincial government enterprises far exceeds the revenues of federal government enterprises, although the assets of federal government enterprises are larger than those of the provinces. Revenues of provincial government enterprises have gradually increased during 2009-12, while those of federal enterprises remained flat (Table 3.24).
3.140. There are currently no plans to privatize any federal crown corporation, provincial crown corporation, or government enterprise.
Table 3.24 Federal and provincial government business enterprises, 2009-12
(Can$ million) 2009 2010 2011 2012 Federal government business enterprises Revenues 37,826 36,169 38,491 37,556 Expenses 34,191 32,857 35,019 33,578 Assets 484,998 491,030 504,207 n.a. Provincial and territorial government business enterprises Revenues 77,372 78,105 79,960 81,319 Expenses 67,625 69,005 69,620 69,341 Assets 247,822 255,616 272,342 n.a.
Source: Statistics Canada, CANSIM Tables 385-0039, 385-0030, 385-0031.
3.3.5 Government procurement
3.3.5.1 Overview
3.141. Government procurement in Canada at the federal level amounts to approximately Can$15 billion, and approximately 350-400 thousand transactions annually. At the provincial and territorial level, government procurement is estimated at approximately Can$20 billion per year.97
96 Online information. Viewed at: http://www.theglobeandmail.com/report-on-business/rob-
magazine/top-1000/2012-rankings-for-federal-and-provincial-crown-corporations/article4360532/. 97 MARCAN online information. Viewed at: http://www.marcan.net/en/statistics.php.

WT/TPR/S/314 • Canada
- 93 -
3.142. Federal procurement policy is established by the Treasury Board of Canada98 pursuant to the Financial Administration Act (FAA), and actual procurement is conducted by individual government entities as well as two common service organizations, Public Works and Government Services Canada and Shared Services Canada. Departments award the vast majority of contracts as measured by the number of transactions; however, Public Works and Government Services Canada awards a far greater dollar value of contracts. The second common service organization Shared Services Canada, is specialized in information technology procurement. The policy objective for government procurement is to acquire goods and services and to carry out construction in a manner that enhances access, competition and fairness and results in best value or, if appropriate, the optimal balance of overall benefits to Canada and the Canadian people. It further provides that procurement should be carried out to ensure the pre-eminence of operational requirements, stand the test of public scrutiny, support long-term industrial and regional development, and comply with Canada's obligations under domestic and international trade agreements.
3.143. Treasury Board procurement policy is set out in the Contracting Policy. The Contracting Policy governs procurement for the majority of federal departments and agencies. Furthermore, it sets out limits as to when departments may contract without seeking TB approval, which is dependent upon the contract type, value and solicitation method.
3.144. "Procurement" includes the purchase of goods, services, and construction. Generally the federal government purchases about the same value of goods and services, whereas construction procurement is about one-sixth the value of goods and services purchases. During the review period, government procurement fluctuated for goods and services, with an overall slight total decline from Can$16.2 billion in 2010 to Can$14.6 billion in 2013 (Table 3.25).
Table 3.25 Overview of procurement by type, 2010-13
(Can$ thousand) 2010 2011 2012 2013 Goods Number 163,669 258,491 219,477 198,608 Value 5,465,732 7,182,258 6,982,484 5,872,511 Services Number 140,769 171,098 146,452 143,876 Value 9,441,613 6,929,622 7,064,684 7,652,770 Construction Number 16,241 15,208 20,672 20,740 Value 1,296,137 1,921,878 1,102,035 1,026,876 Total Number 320,679 444,797 386,601 363,224 Value 16,203,482 16,033,758 15,149,203 14,552,157
Sources: Treasury Board of Canada online information. Viewed at: http://www.tbs-sct.gc.ca/pubs_pol/dcgpubs/con_data/par-12-rpa-eng.asp; and http://www.tbs-sct.gc.ca/pubs_pol/dcgpubs/con_data/siglist-eng.asp.
3.3.5.2 Developments
3.145. The major developments for procurement during the period included changes to the Contracting Policy, changes to regulations, and the issuance of Contracting Policy Notices (Table 3.26).
98 The Treasury Board is a statutory Cabinet committee, responsible for the federal civil service and
empowered under the Federal Administration Act to establish government procurement policy. It is composed of Ministers of the Crown. The Treasury Board Secretariat is the administrative arm of the Treasury Board, with a mandate to support the Treasury Board.

WT/TPR/S/314 • Canada
- 94 -
Table 3.26 Changes to procurement framework and notices, 2011-14
Date Instrument Change 14 Nov. 2014 Contracting Policy Sets a new exceptional contracting limit for National Defence. 18 July 2014 Contracting Policy Sets a new, exceptional contracting limit for Public Works and
Government Services Canada; an exceptional contracting limit for Shared S0ervices Canada; and removal of time-limited/expired exceptional limits.
17 April 2014 WTO GPA Notified and advised stakeholders that the revised GPA had come into force.
20 Dec. 2013 Threshold updates Updated thresholds under the various trade agreements. 9 Sept. 2013 Guidelines on the
Proactive Disclosure of Contracts
Established new reporting measures.
19 Dec. 2011 Threshold updates Communicated updated thresholds under the various trade agreements.
31 Oct. 2011 Government Contracts Regulations (GCRs)
Amendment to retain the independence of the Agents of Parliament from the operations of the Government.
4 Oct. 2011 Government Contracts Regulations (GCRs)
Amendment to: Prohibit the payment of contingency fees to consultant lobbyists; impose an obligation to declare that bidders have not been convicted of certain criminal offenses; secure the contractor's consent to publicly disclose basic information about a procurement contract; and require a contractor to return any advance payments; and secure the contractor's consent that the Government may cancel the contract in the event of non-compliance with a deemed term.
18 Aug. 2011 Canada-Colombia FTA Advised stakeholders that the Canada-Colombia Free Trade Agreement had come into effect and highlighted some salient obligations.
Source: Treasury Board of Canada online information. Viewed at: http://www.tbs-sct.gc.ca/pubs_pol/dcgpubs/ContPolNotices/2014/14-05-eng.asp; and http://www.tbs-sct.gc.ca/pubs_pol/dcgpubs/con_data/siglist-eng.asp.
3.146. In 2011, a new common services organization was created for Information Technology procurement. Shared Services Canada (SSC) was established to standardize and consolidate certain administrative services, namely IT infrastructure services for email, data centers and network services. Later in 2013, SSC was also provided with the exclusive authority for the procurement of hardware and software, including security software for "work-place technology devices" (WPTDs) – also referred to as end-user devices.
3.147. In addition, the Department of Public Works and Government Services Act (DPWGS) has been amended to allow Public Works and Government Services Canada (PWGSC) to provide procurement and procurement services to other jurisdictions and organizations, such as provinces and territories, subject to receiving the approval of the Governor-in-Council, which can be requested either on a general or a specific basis.99
3.3.5.3 Legal framework and process
3.148. The FAA is the main law on government procurement in Canada. It authorizes the Treasury Board of Canada to set procurement policy government-wide and to issue regulations. The Government Contracts Regulations (GCRs) provide that all bids be publicly solicited except for a few limited circumstances, that include: a pressing emergency; where it is not in the public interest to solicit bids; where only one person is capable of performing the contract; and for contracts less than Can$25,000. The GCRs also ensure administrative transparency, oversight and accountability by deeming certain terms to be expressly stated in contracts.
3.149. The procurement process involves four basic stages:
• Pre-contractual phase—planning and definitional requirements; • Contractual phase—bid solicitation to contract award; • Contract administration phase—monitoring progress and payment; and • Post contractual phase—client satisfaction, audit, and file close-out.
99 Online information viewed at Justice Laws website. Department of Public Works and Government
Services Act, Section 16. Viewed at: http://laws-lois.justice.gc.ca/eng/acts/P-38.2/page-5.html.

WT/TPR/S/314 • Canada
- 95 -
3.150. Canada distinguishes two types of procurement processes. Processes under Can$25,000 are considered low-value procurement and may or may not follow competitive bidding. Suppliers are often selected through the Supplier Registration Information System when Standing Offers and Supply Arrangements are in place. For procurement above Can$25,000, there are three basic types of solicitation methods: electronic bidding through a public notice, traditional competitive bidding, and advance contract award notices (ACAN). The ACAN process can be used when the contracting authority believes that only one supplier is capable of performing the contract. When procurement is covered by a trade agreement, numerous procedural obligations apply, including restrictions on the use of limited tendering.
3.151. With respect to federal government procurement, in cases of disputes for procurements covered by trade agreements, bidders may challenge the procurement process through the Canadian International Trade Tribunal. If the Tribunal finds in favour of the complainant, there are a number of remedies possible, including issuing a new solicitation, re-evaluating the bids, awarding the contract to the complainant, or financially compensating the complainant for the loss. For contracts not subject to trade agreements, suppliers may turn to the Office of the Procurement Ombudsman to review complaints. The Procurement Ombudsman Regulations (POR)100 provide specifics on how the Procurement Ombudsman's authority is to be exercised. Provinces and Territories have established their own domestic review procedures for suppliers to challenge a procurement process in their respective jurisdictions.
3.152. Since 2006, Canada has a policy on Green Procurement in force. As part of its long-term goal to improve the environment and quality of life for Canadians, the policy aims to reduce environmental impacts by integrating environmental performance considerations in the procurement process. Thus, each department is responsible for implementing an effective approach that incorporates environmental performance.101
3.153. Since 1996 Canada has maintained a strategy known as the Procurement Strategy for Aboriginal Business (PSAB), to foster aboriginal business development through the use of federal procurement contracts. Under certain conditions, a federal government procurement contract is set-aside for aboriginal businesses. According to the most recent data available from 2011, government procurement set-asides under PSAB amounted to Can$85 million, approximately 0.5% of total federal procurement.102
3.154. The majority of procurements above Can$25,000 are competitive with electronic bidding utilised the most; non-competitive bids make up less than 20% of the total. ACANs account for a relatively small share of the procurements compared to electronic and traditional bidding (Table 3.27).
Table 3.27 Procurement by type of procedure, all contracts above Can$25,000, 2010-13
2010 No.
2010 value
2011No.
2011value
2012No.
2012value
2013 No.
2013 Value
Electronic bidding
7,014 5,804,495 6,944 5,340,530 9,018 4,442,583 8,311 4,207,974
Traditional competitive
7,078 1,479,155 20,176 2,398,184 15,249 2,229,283 14,823 2,593,938
ACANs 919 415,147 748 252,573 886 367,535 695 403,715Amendments .. 5,562,147 .. 2,542,461 .. 4,592,097 .. 3,661,055Total competitive
15,011 13,260,944 27,868 10,533,748 25,153 11,631,498 23,829 10,866,682
Non-competitive
3,851 1,550,977 7,185 3,355,759 4,791 1,403,919 4,910 1,817,063
Amendments .. 258,132 .. 449,460 .. 778,329 .. 610,476
100 Procurement Ombudsman Regulations online information. Viewed at: http://laws-
lois.justice.gc.ca/eng/regulations/SOR-2008-143/. 101 Public Works and Government Services Canada online information. Viewed at: http://www.tpsgc-
pwgsc.gc.ca/ecologisation-greening/achats-procurement/politique-policy-eng.html. 102 Information provided by the Canadian authorities.

WT/TPR/S/314 • Canada
- 96 -
2010 No.
2010 value
2011No.
2011value
2012No.
2012value
2013 No.
2013 Value
Total non-competitive
3,851 1,809,109 7,185 3,805,219 4,791 2,182,248 4,910 2,427,529
Total 18,862 15,070,053 35,053 14,338,967 29,944 13,813,747 28,739 13,294,211
.. Not available.
Source: Treasury Board of Canada online information. Viewed at: http://www.tbs-sct.gc.ca/pubs_pol/dcg pubs/con_data/par-12-rpa-eng.asp; and http://www.tbs-sct.gc.ca/pubs_pol/dcgpubs/con_data/ siglist-eng.asp.
3.3.5.4 WTO GPA and other agreements
3.155. Canada has been a member of the GPA since 1996 and also participated in the negotiations to revise the GPA. On 6 April 2014, the revised GPA came into force for Canada. At the federal level, there have been no substantial changes in Canada's schedule in the revised GPA. However, significant changes occurred at the sub-federal level whereby all provinces and territories and 10 federal crown corporations are now included in Canada's GPA schedule.
3.156. As a result of the financial crisis in 2009 and the U.S. implementation of the 2010 American Recovery and Reinvestment Act (ARRA), Canada and the United States signed a bilateral agreement mitigating the impact that ARRA had on sub-federal procurements. In that agreement, the United States exempted Canada from Buy America conditions imposed on certain federal funding programmes for infrastructure projects authorized under the ARRA. Canada and the United States also exchanged commitments in relation to sub-national procurement. Canada, for the first time, made commitments in relation to procurement by its 13 provinces and territories. In exchange, the United States extended commitments to Canada on behalf of 37 states listed in the United States' GPA schedule. These market access commitments have now been either incorporated into the revised WTO GPA or have expired. Canada's commitments in relation to sub-national procurement have been extended to all other GPA Parties, with the exception of Iceland and Lichtenstein.
3.157. In addition to the WTO GPA, has eight other domestic and international trade agreements that cover government procurement; these are the Agreement on Internal Trade (AIT), NAFTA, the Canada-Chile FTA, the Canada-Honduras FTA, the Canada-Korea FTA, (the government procurement chapter of the Canada-Korea FTA will only enter into force once the Republic of Korea ratifies the revised WTO GPA,) the Canada-Panama FTA, the Canada-Peru FTA, and the Canada-Colombia FTA. With the exception of the WTO GPA and AIT, these agreements only cover procurement at the federal level.
3.3.6 Intellectual property rights
3.3.6.1 Overview
3.158. Canada has a well-developed IP system that corresponds to its status as an OECD-economy with vibrant technology-intensive industries, such as aerospace and pharmaceuticals. During the review period, considerations on intellectual property (IP) have played an important role both in Canada's domestic legislative activity as well as in its international trade policy, and were driven by the motivation to further improve Canada's performance in the area of science, technology and innovation.103 Since 2011, Canada has ratified two, and initiated accession to five important international IP treaties, and has adopted or introduced a number of significant legislative changes to its IP regime. There were a number of court cases during the review period in relation to IP matters, including the release of a number of Supreme Court of Canada decisions on copyright. Moreover, a series of important judicial decisions in the area of patentability and disclosure of pharmaceutical inventions reflects the dynamism of a market place that contains both "brand-name" and generic pharmaceutical industry.
103 Science, Technology and Innovation Council Secretariat (2013).

WT/TPR/S/314 • Canada
- 97 -
3.3.6.2 Economic Policy Context
3.159. Given the diverse forms that IP takes in international trade, including IP embedded in manufactured goods, IP royalties recorded as services trade, and consumer downloads of IP content, it is difficult to establish a comprehensive tally of the full IP component of Canadian trade. However, several indicators permit an approximate estimation of Canada's IP trade and confirm its traditional situation as a net IP-importing country.
3.160. Rankings of the Canadian economy in global indices of innovation and competitiveness have remained relatively stable over the review period, with Canada ranked 12th place in the Global Innovation Index in 2014.104 While Canada's overall ranking in the Global Competitiveness Report fell slightly from 12th place in 2011-12 to 15th in the 2014-15 report, its IP protection ranking improved from 18th to 12th place over the same period.105 Canadian Business Expenditure on Research and Development (BERD), one of the main indicators for innovative activity, still remains below its pre-crisis 2007 peak, and its intensity (BERD per GDP in %) has continuously declined over the last decade.106 During the review period, BERD intensity continued to fall slightly, from 1.07% in 2011 to 0.93% in 2014107, illustrating that R&D investment by businesses is lagging behind GDP growth.
3.161. Despite this trend, Canada's overall trade balance in technology-intensive services remained relatively stable registering a slight surplus during the reporting period, with exports in this category totalling US$23.19 billion in 2013 (Chart 3.6). The categories "computer and information services" and "architectural, engineering and other technical services" are the largest components of exported technology-intensive services, together representing 62% in 2013.
104 Global Innovation Index Rankings 2011-2014. Viewed at: www.globalinnovationindex.org. Taking
account of the changes in the scope of the rankings, Canada's relative ranking remained stable over the review period.
105 WEF Global Competitiveness Report Rankings. Viewed at: www.weforum.org/reports. 106 Science, Technology and Innovation Council (STIC), (2013), State of the Nation 2012, p.62. 107 Statistics Canada, CANSIM Tables 358-0024 (BERD) and CANSIM Table 379-0031 (GDP at basic
prices by NAICS). 2014 GDP data from September 2014. Viewed at: www.statcan.gc.ca on 8 December 2014.

WT/TPR/S/314 • Canada
- 98 -
Chart 3.6 Trade in technology-intensive services, 2009-13
-3,000
-2,000
-1,000
0
1,000
2,000
3,000
-45
-35
-25
-15
-5
5
15
25
35
45
2009 2010 2011 2012 2013
Architectural, engineering, and other technical servicesResearch and developmentCharges for the use of intellectual propertyComputer and information servicesTrade balance technology-intensive services (right-hand axis)
(Percentage of commercial services receipts and payments)
Rec
eipt
sPa
ymen
ts
(Can$ million)
Source: Statistics Canada, CANSIM Table 376-0033 (International transactions in services, commercial
services by category).
3.162. In contrast, the largest category of imports of technology-intensive services – and the component with a historically negative trade balance – remains, by far, the "charges for use of intellectual property" item, which represented 51% of technology-intensive services imports, and 20.7% of all commercial services imports in 2013. Within the category of charges for IP use, the deficit is most pronounced with respect to "patents and industrial designs" and "software and other royalties", with payments in these categories exceeding receipts by a factor of two (Chart 3.7).
3.163. This apparent inconsistency between a positive record of innovation-generating services on the one hand, and a negative trade balance on IP charges on the other, suggests that Canadian companies and post-secondary institutions are strong at invention, but that commercialization of these inventions is done to a large extent by foreign firms.108
3.164. During the review period, the Canadian government has introduced a number of targeted measures to help innovative Canadian firms that develop IP overcome barriers to commercialization and become globally competitive. The Economic Action Plans 2012 and 2013, among other measures, increased the National Research Council's Industrial Research Assistance Program, introduced a Can$400 million Venture Capital Action Plan, and increased support for incubator and accelerator organizations to help entrepreneurs.109
108 House of Commons (2013a), p.22. 109 House of Commons (2013b).

WT/TPR/S/314 • Canada
- 99 -
Chart 3.7 Charges for the use of intellectual property rights, 2005-13
(Can$ million)
-12,000
-10,000
-8,000
-6,000
-4,000
-2,000
0
2,000
4,000
6,000
2005 2006 2007 2008 2009 2010 2011 2012 2013
Patents and industrial design Trademarks
Franchises Copyrights and related rights
Software and other royalties Charges for the use of intellectual property balance
Rec
eipt
sPa
ymen
ts
Source: Statistics Canada, CANSIM Table 376-0033 (International transactions in services, commercial
services by category).
3.3.6.3 Use of the IP System
3.165. Use of the Canadian IP system by nationals and foreigners has remained mostly stable over the review period until 2013 (latest data available). The Canadian Intellectual Property Office (CIPO) received on average just over 35,000 national patent applications per year during the period 2010-13, 13% of which came from Canadian residents, while the majority (87%) originated from foreign applicants. In the trademark area, applications by Canadian residents remained equally stable at just above 21,000 applications, while applications from abroad rose from 24,771 in 2010 to 28,370 in 2013, increasing their share to 56% of all Canadian trademark applications in 2013. Similarly, applications for industrial design protection in Canada, both by residents and foreign applicants, showed modest growth, with a stable share of 84% of all applications coming from non-resident applicants.110
3.166. Filings by Canadian residents for IP protection abroad grew over the review period in all areas of IP protection. While growth of Canadian foreign filings in the areas of patents and trademarks was mostly in step with the general global trend of increased foreign filings – Canada moved by one rank in both categories from 9th to 10th in patents and from 18th to 17th in trademarks – the growth in foreign filings by Canadian residents for industrial design protection was significantly above the global rate of increase. Filings by Canadian residents for industrial design protection in another jurisdiction grew from 6,407 in 2010 to 9,246 in 2013 which moved Canada's global ranking in this category from 19th to 18th place in 2013.111 This increased interest in design protection abroad provides the backdrop for the Canadian government's 2014 initiative
110 WIPO Statistical country profile. Viewed at:
http://www.wipo.int/ipstats/en/statistics/country_profile/profile.jsp?code=CA. 111 WIPO Statistical country profile. Viewed at:
www.wipo.int/ipstats/en/statistics/country_profile/profile.jsp?code=CA.

WT/TPR/S/314 • Canada
- 100 -
to join the Hague Agreement112 which would permit Canadian design holders to obtain protection for industrial designs in multiple contracting parties by means of a single international application.
3.167. During the review period, Canada initiated or concluded a number of legislative activities in relation to international IP treaties. In January 2014, the Government of Canada initiated procedures towards accession to, and domestic implementation of, the following five international treaties related to IP:
• Protocol Relating to the Madrid Agreement Concerning the International Registration of Marks ("Madrid Protocol");
• Singapore Treaty on the Law of Trademarks ("Singapore Treaty");
• Nice Agreement Concerning the International Classification of Goods and Services for the Purposes of the Registration of Marks ("Nice Agreement");
• Geneva Act of the Hague Agreement Concerning the International Registration of Industrial Designs ("Geneva Act"); and
• Patent Law Treaty.
3.168. On 13 May 2014, Canada also ratified the so-called WIPO Internet treaties, the WIPO Copyright Treaty (WCT) and the WIPO Performances and Phonograms Treaty (WPPT) which entered into force for Canada on 13 August 2014. Canada's ratification of the WPPT was accompanied by a ministerial statement to ensure that performers and producers of sound recordings from WPPT countries receive the same treatment in Canada as Canadians receive abroad when their music is played or performed in public. The statement affects copyright owners in 13 countries (i.e., Rome Convention and WPPT member countries that do not provide reciprocal treatment for Canadian copyright owners) by establishing limitations on when equitable remuneration for public performances and communications to the public of sound recordings may be claimed.113 Industry Canada announced that "without this statement in place prior to Canada's ratification of the WPPT, Canadian businesses will be required to pay a substantial increase in copyright royalties to foreign rights holders for certain uses of sound recordings. However, Canadian rights holders would not receive the similar benefit of collecting increased royalties abroad for those same uses of their sound recordings".114
3.169. A number of bills to amend domestic IP legislation to adapt to the above treaty requirements have been initiated or adopted in parliament, or have entered into force during the review period (see below). Table 3.28 lists Canada's main IP laws currently in force and summarizes the protection they provide.
3.3.6.4 International Initiatives and WTO participation
3.170. Canada advanced IP-related trade interests in a number of bilateral and regional trade agreement negotiations during the review period. Among the bilateral free trade agreements that were either signed, concluded or entered into force since 2011 (Section 2), the agreements with the Republic of Korea (CKFTA) and the European Union (CETA) stand out as establishing explicit new IP standards and cooperation mechanisms, in particular with respect to copyright, geographical indications, patents and counterfeit goods. CETA represents "by far Canada's most
112 Hague Agreement Concerning the International Registration of Industrial Designs (Geneva Act),
administered by WIPO. 113 The limits will apply to Barbados, the Plurinational State of Bolivia, Cabo Verde, Congo, Costa Rica,
Japan, Lebanon, Lesotho, Monaco, China, Singapore, the United States, and Viet Nam. 114 Bloomberg BNA News Report "Canada to limit Royalties for US Rights Holders Under WIPO
Performances Treaty", 31 July 2014; see also the "Statement Limiting the Right to Equitable Remuneration of Certain Rome Convention or WPPT Countries" pursuant to Section 20(2) of the Copyright Act. Viewed at: www.gazette.gc.ca/rp-pr/p2/2014/2014-07-30/html/sor-dors181-eng.php.
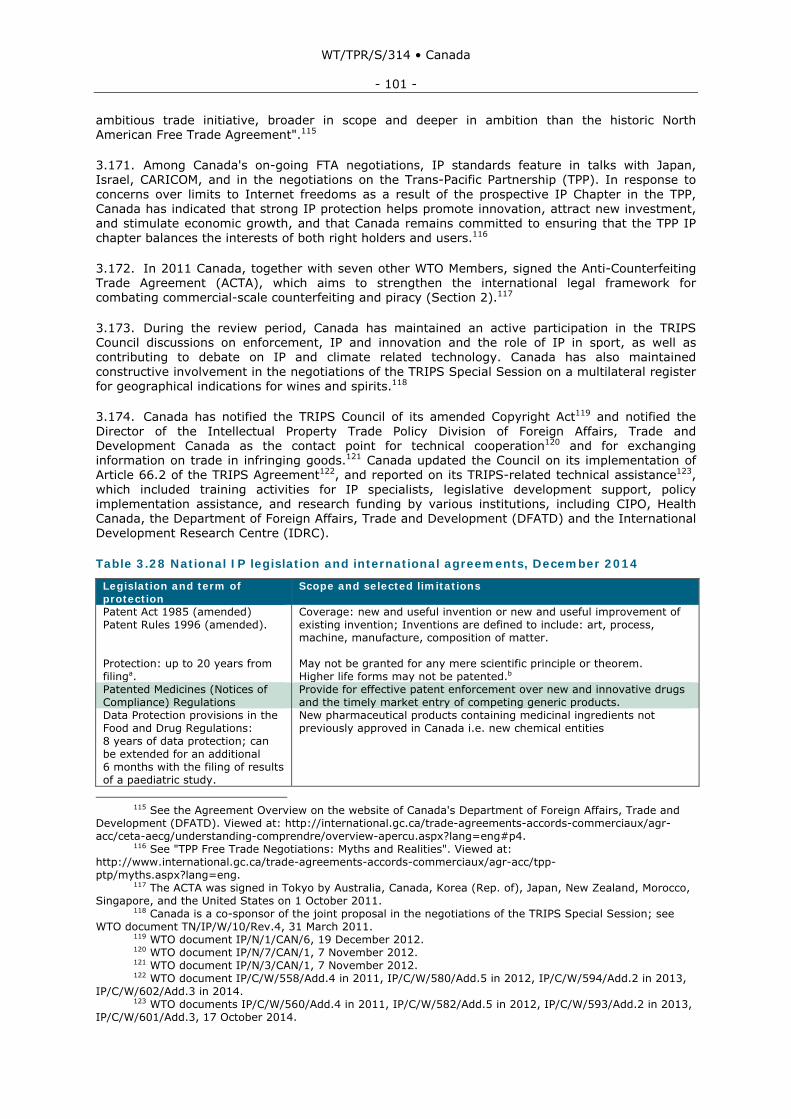
WT/TPR/S/314 • Canada
- 101 -
ambitious trade initiative, broader in scope and deeper in ambition than the historic North American Free Trade Agreement".115
3.171. Among Canada's on-going FTA negotiations, IP standards feature in talks with Japan, Israel, CARICOM, and in the negotiations on the Trans-Pacific Partnership (TPP). In response to concerns over limits to Internet freedoms as a result of the prospective IP Chapter in the TPP, Canada has indicated that strong IP protection helps promote innovation, attract new investment, and stimulate economic growth, and that Canada remains committed to ensuring that the TPP IP chapter balances the interests of both right holders and users.116
3.172. In 2011 Canada, together with seven other WTO Members, signed the Anti-Counterfeiting Trade Agreement (ACTA), which aims to strengthen the international legal framework for combating commercial-scale counterfeiting and piracy (Section 2).117
3.173. During the review period, Canada has maintained an active participation in the TRIPS Council discussions on enforcement, IP and innovation and the role of IP in sport, as well as contributing to debate on IP and climate related technology. Canada has also maintained constructive involvement in the negotiations of the TRIPS Special Session on a multilateral register for geographical indications for wines and spirits.118
3.174. Canada has notified the TRIPS Council of its amended Copyright Act119 and notified the Director of the Intellectual Property Trade Policy Division of Foreign Affairs, Trade and Development Canada as the contact point for technical cooperation120 and for exchanging information on trade in infringing goods.121 Canada updated the Council on its implementation of Article 66.2 of the TRIPS Agreement122, and reported on its TRIPS-related technical assistance123, which included training activities for IP specialists, legislative development support, policy implementation assistance, and research funding by various institutions, including CIPO, Health Canada, the Department of Foreign Affairs, Trade and Development (DFATD) and the International Development Research Centre (IDRC).
Table 3.28 National IP legislation and international agreements, December 2014
Legislation and term of protection
Scope and selected limitations
Patent Act 1985 (amended) Patent Rules 1996 (amended). Protection: up to 20 years from filinga.
Coverage: new and useful invention or new and useful improvement of existing invention; Inventions are defined to include: art, process, machine, manufacture, composition of matter. May not be granted for any mere scientific principle or theorem. Higher life forms may not be patented.b
Patented Medicines (Notices of Compliance) Regulations
Provide for effective patent enforcement over new and innovative drugs and the timely market entry of competing generic products.
Data Protection provisions in the Food and Drug Regulations: 8 years of data protection; can be extended for an additional 6 months with the filing of results of a paediatric study.
New pharmaceutical products containing medicinal ingredients not previously approved in Canada i.e. new chemical entities
115 See the Agreement Overview on the website of Canada's Department of Foreign Affairs, Trade and
Development (DFATD). Viewed at: http://international.gc.ca/trade-agreements-accords-commerciaux/agr-acc/ceta-aecg/understanding-comprendre/overview-apercu.aspx?lang=eng#p4.
116 See "TPP Free Trade Negotiations: Myths and Realities". Viewed at: http://www.international.gc.ca/trade-agreements-accords-commerciaux/agr-acc/tpp-ptp/myths.aspx?lang=eng.
117 The ACTA was signed in Tokyo by Australia, Canada, Korea (Rep. of), Japan, New Zealand, Morocco, Singapore, and the United States on 1 October 2011.
118 Canada is a co-sponsor of the joint proposal in the negotiations of the TRIPS Special Session; see WTO document TN/IP/W/10/Rev.4, 31 March 2011.
119 WTO document IP/N/1/CAN/6, 19 December 2012. 120 WTO document IP/N/7/CAN/1, 7 November 2012. 121 WTO document IP/N/3/CAN/1, 7 November 2012. 122 WTO document IP/C/W/558/Add.4 in 2011, IP/C/W/580/Add.5 in 2012, IP/C/W/594/Add.2 in 2013,
IP/C/W/602/Add.3 in 2014. 123 WTO documents IP/C/W/560/Add.4 in 2011, IP/C/W/582/Add.5 in 2012, IP/C/W/593/Add.2 in 2013,
IP/C/W/601/Add.3, 17 October 2014.
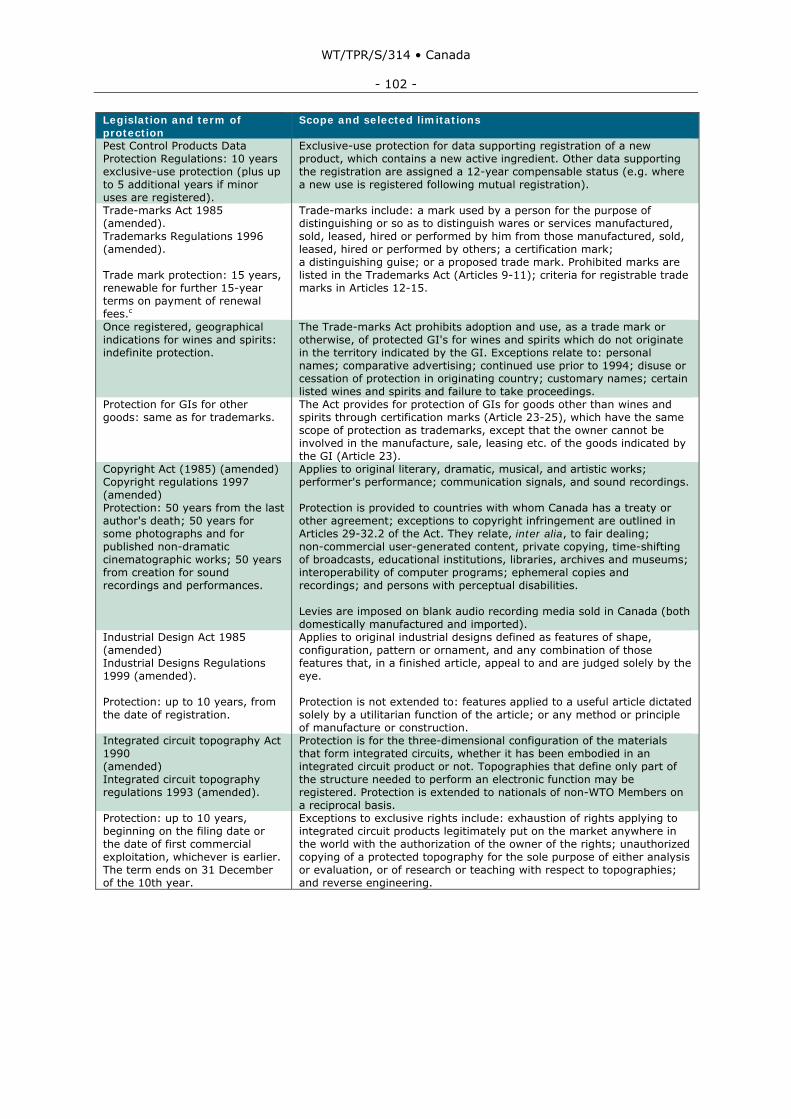
WT/TPR/S/314 • Canada
- 102 -
Legislation and term of protection
Scope and selected limitations
Pest Control Products Data Protection Regulations: 10 years exclusive-use protection (plus up to 5 additional years if minor uses are registered).
Exclusive-use protection for data supporting registration of a new product, which contains a new active ingredient. Other data supporting the registration are assigned a 12-year compensable status (e.g. where a new use is registered following mutual registration).
Trade-marks Act 1985 (amended). Trademarks Regulations 1996 (amended). Trade mark protection: 15 years, renewable for further 15-year terms on payment of renewal fees.c
Trade-marks include: a mark used by a person for the purpose of distinguishing or so as to distinguish wares or services manufactured, sold, leased, hired or performed by him from those manufactured, sold, leased, hired or performed by others; a certification mark; a distinguishing guise; or a proposed trade mark. Prohibited marks are listed in the Trademarks Act (Articles 9-11); criteria for registrable trade marks in Articles 12-15.
Once registered, geographical indications for wines and spirits: indefinite protection.
The Trade-marks Act prohibits adoption and use, as a trade mark or otherwise, of protected GI's for wines and spirits which do not originate in the territory indicated by the GI. Exceptions relate to: personal names; comparative advertising; continued use prior to 1994; disuse or cessation of protection in originating country; customary names; certain listed wines and spirits and failure to take proceedings.
Protection for GIs for other goods: same as for trademarks.
The Act provides for protection of GIs for goods other than wines and spirits through certification marks (Article 23-25), which have the same scope of protection as trademarks, except that the owner cannot be involved in the manufacture, sale, leasing etc. of the goods indicated by the GI (Article 23).
Copyright Act (1985) (amended) Copyright regulations 1997 (amended) Protection: 50 years from the last author's death; 50 years for some photographs and for published non-dramatic cinematographic works; 50 years from creation for sound recordings and performances.
Applies to original literary, dramatic, musical, and artistic works; performer's performance; communication signals, and sound recordings. Protection is provided to countries with whom Canada has a treaty or other agreement; exceptions to copyright infringement are outlined in Articles 29-32.2 of the Act. They relate, inter alia, to fair dealing; non-commercial user-generated content, private copying, time-shifting of broadcasts, educational institutions, libraries, archives and museums; interoperability of computer programs; ephemeral copies and recordings; and persons with perceptual disabilities. Levies are imposed on blank audio recording media sold in Canada (both domestically manufactured and imported).
Industrial Design Act 1985 (amended) Industrial Designs Regulations 1999 (amended). Protection: up to 10 years, from the date of registration.
Applies to original industrial designs defined as features of shape, configuration, pattern or ornament, and any combination of those features that, in a finished article, appeal to and are judged solely by the eye. Protection is not extended to: features applied to a useful article dictated solely by a utilitarian function of the article; or any method or principle of manufacture or construction.
Integrated circuit topography Act 1990 (amended) Integrated circuit topography regulations 1993 (amended).
Protection is for the three-dimensional configuration of the materials that form integrated circuits, whether it has been embodied in an integrated circuit product or not. Topographies that define only part of the structure needed to perform an electronic function may be registered. Protection is extended to nationals of non-WTO Members on a reciprocal basis.
Protection: up to 10 years, beginning on the filing date or the date of first commercial exploitation, whichever is earlier. The term ends on 31 December of the 10th year.
Exceptions to exclusive rights include: exhaustion of rights applying to integrated circuit products legitimately put on the market anywhere in the world with the authorization of the owner of the rights; unauthorized copying of a protected topography for the sole purpose of either analysis or evaluation, or of research or teaching with respect to topographies; and reverse engineering.

WT/TPR/S/314 • Canada
- 103 -
Legislation and term of protection
Scope and selected limitations
Plant Breeders' Rights Act (1990) (amended) Plant Breeders' Rights Regulations (1991) (amended). Protection is up to 18 years effective from the date of issue of the rights certificate.
Allows for protection of new varieties of plants; varieties must be new, distinct, uniform and stable. All plant species are eligible for protection. Algae, bacteria and fungi are not protected. Applicants may only be citizens of, residents of, or have a resident office in Canada or a UPOV member state. Restrictions to the holders' rights include: protected varieties may be used for breeding and developing new plant varieties; and farmers may save and use their harvested seed of a protected variety for replanting on their own land without infringing on the holder's rights (farmers' privilege).
a Under section 45 of the Patent Act, patents filed prior to 1 October 1989 (so-called "Old Act patents") and still existent as of July 2001, benefit from a term of protection of either 20 years from filing or 17 years from grant, whichever is greater.
b This was the subject of a Supreme Court ruling in December 2002. c Trademarks, if not registered, are still protected through common law if they have been used.
Source: WTO document WT/TPR/S/246/Rev.1, 26 July 2011 – updated by the WTO Secretariat.
3.3.6.5 The Patent System
3.175. While no substantial amendments to Canada's patent legislation have entered into force during the review period, Canadian patent law and practise, in particular with respect to pharmaceutical patents, nevertheless received much attention. Given the strong presence of both "brand-name" and generic pharmaceutical industry in Canada, conflicting demands of these industries with respect to certain aspects of the patent system have to be balanced. A parliamentary report on the "Intellectual Property Regime in Canada"124 prepared in March 2013, recommended that the Government:
• "should only consider expanding patentability to new subject matter when there is clear and demonstrable evidence of benefit to Canadians and competition"125; and
• "ensure the pharmaceutical IP regime strikes a balance between encouraging investments in the development of new innovative drugs while ensuring Canadians have access to affordable pharmaceuticals."126
3.176. In response, the Government of Canada confirmed that it seeks to balance protection for innovative drugs and market entry of lower priced generics through the "early working exception" permitting generics to seek drug approval prior to patent expiry. The patent linkage provisions contained in the Patented Medicines (Notice of Compliance) Regulations ensured that generics did not abuse this exception by bringing to market drugs which were effectively still under patent.127
3.177. Responding to the evolving demands for improved IP infrastructure, Industry Canada has launched a study on the determinants of patent quality and is modernizing its technology systems to improve disclosure of patent information.128 CIPO has also further expanded its network of partner institutions in a new Global Patent Prosecution Highway (PPH) programme which permits applicants to significantly speed up examination of their patent applications based on the results of examination from a corresponding application at one of the PPH partner IP offices.129
3.178. Clarifying substantive patent practise in response to Federal Court of Appeal decisions, CIPO has also issued guidelines on computer-related inventions130, and a practice notice regarding
124 House of Commons (2013a). 125 House of Commons (2013a), p. 51. 126 House of Commons (2013a). 127 House of Commons (2013b). 128 House of Commons (2013b). 129 Under the Global Patent Prosecution Highway (PPH) pilot programme that started 6 January 2014.
Canada now has PPH agreements with Australia, China, Denmark, Finland, Germany, Hungary, Iceland, Israel, Japan, Korea, Mexico, the Nordic Patent Institute, Norway, Portugal, Russia, Spain, Sweden, the United Kingdom and the United States.
130 PN2013-02 and PN2013-03 of 8 March 2013.

WT/TPR/S/314 • Canada
- 104 -
medical uses.131 These documents explain the office's shift, away from the past practise of assessing the nature of the "contribution" of a patent claim, towards "purposive" claim construction that focuses on essential elements of the proposed solution to a technical problem.
3.179. A dynamic patent litigation landscape132, in particular between generic and "brand name" pharmaceutical companies, has continued to generate jurisprudence on certain aspects of patent practise. In particular, in a number of cases over the review period, courts have continued to develop the Canadian legal doctrine that the "promise of the patent"133, i.e. its claimed utility, has to be demonstrated or soundly predicted on the basis of information disclosed in the patent application at the filing date. The requirement that an invention's utility must be established at the time the patent application is filed aims to ensure the granting of high-quality patents by seeking to prevent applicants from obtaining patents based on speculation.
3.180. A bill to amend and make the Patent Act consistent with the mostly procedural provisions of the Patent Law Treaty (Bill C-43)134 received Royal Assent on 16 December 2014.
3.181. The CETA Agreement contains new commitments on intellectual property and pharmaceutical patents that would require changes to existing Canadian law.
3.3.6.6 Copyright
3.182. The adoption of the Copyright Modernization Act in 2012135 updated the Canadian Copyright regime by introducing new rights and exceptions more adapted to the online environment, and by ensuring that the Copyright Act remains technologically neutral. The changes also implemented the WIPO Internet treaties, which entered into force for Canada in August 2014.
3.183. Under the new regime, authors, performers and makers of sound recordings now enjoy explicit "first distribution rights" for copyright material in tangible form, subject to international exhaustion (see sections 3(1)(j), 15(1.1)(e), and 18(1.1)(b) of the Copyright Act). Remedies are available for the parallel importation of copyright material, which includes a special regime for the parallel importation of books (see sections 27(2(e) and 27.1 of the Copyright Act). Authors, performers and makers of sound recordings also now explicitly have the exclusive right to control the release of their copyright material online, i.e. to make it available to the public by telecommunication, including over the Internet, in a way that allows a member of the public to have access to it from a place and time individually chosen by them (see sections 2.4(1.1), 15(1.1)(d), and 18(1.1)(a) of the Copyright Act). Furthermore, authors, performers and makers of sound recordings now benefit from legal protection for technological protection measures and rights management information (see sections 41 – 41.21, 41.22, and 42(3.1) of the Copyright Act).
3.184. The existing copyright exceptions framework was broadened and complemented with new provisions. The general "fair dealing" exception was expanded to expressly include three new purposes (i.e., education, parody, and satire). New specific exceptions for the benefit of educational institutions permit certain uses of internet content and telecommunication technologies in learning contexts, subject to safeguards. Statutory damages for copyright infringements with non-commercial purposes have been reduced from Can$500 - Can$20,000 per work infringed, to Can$100 - Can$5,000 for all infringements in a single proceeding for all works
131 PN 2013-04 of 10 June 2013. 132 Among the IP cases before the Federal Court of Canada – the main litigation forum for patent cases
– in 2012, 37% related to patents, 47% related to trademarks, and 12% related to copyright. "Intellectual Property Regime in Canada", Report of the Standing Committee on Industry, Science and Technology of the 41st Parliament, March 2013, p.9.
133 Gold and Shortt (2014); and Siebrasse (2012). 134 Bill C-43 "A second Act to implement certain provisions of the budget and other measures" includes
amendments to the Patent Act reducing the requirements for obtaining a filing date in relation to an application for a patent, requiring that an applicant be notified of a missed due date before an application is deemed to be abandoned, and providing that a patent may not be invalidated for non-compliance with certain requirements relating to the application on the basis of which the patent was granted.
135 Bill C-11, Copyright Modernization Act, received Royal assent on 29 June 2012 and most of the provision entered into force on 7 November 2012.

WT/TPR/S/314 • Canada
- 105 -
(not for each work infringed). The previous range continues to apply to cases of infringement for commercial purposes.136
3.185. New exceptions permit use of copyrighted works by individuals to produce non-commercial user-generated content (e.g., video "mash-ups"), to make certain private copies and to record broadcasts for later private viewing ("time-shifting"), subject to safeguards.137 New exceptions aimed at technology industries permit the development of interoperable computer programs, encryption research, security testing and other technological processes. New exceptions for persons with perceptual disabilities138 include an exception for non‑profit organizations acting for the benefit of persons with a print disability to make a copy of a work in a format specifically designed for persons with a print disability, and to send a copy of the work to similar organizations abroad, subject to safeguards.
3.186. The Copyright Modernization Act also established "safe-harbour" provisions for Internet Service Providers and search engines, and a new civil liability provision targeting those who enable copyright infringement online. The Act also formalized Canada's "Notice and Notice Regime", which entered into force on 2 January 2015. In contrast to "notice and takedown" procedures for ISPs in other jurisdictions, this Canadian system does not require ISPs to take down allegedly infringing content, but to forward notices, sent by copyright owners, to users whose Internet address has been identified as being the source of possible infringement. Notices may be sent to providers of Internet connectivity services (e.g. providing Internet access and email services to subscribers) and hosting services (e.g. allowing subscribers to upload files on the Internet). The ISP must inform the copyright owner once the notice has been sent and keep records for six months, or longer (i.e. up to one year) in instances where the copyright owner decides to pursue legal action. The ISP may be liable for statutory damages of Can$5,000 to Can$10,000 if it fails to comply with these provisions. A separate procedure exists for sending notices to search engine services.
3.187. There were a number of court cases during the review period in relation to copyright matters, including the release of a number of Supreme Court of Canada decisions on copyright.139 The Supreme Court decisions dealt with a range of copyright issues, such as the scope of the fair dealing exception, and the downloading and streaming of music. Many of these Supreme Court cases were heard before the modernization reforms came into force, and stem from judicial reviews of decisions of the Copyright Board of Canada, an economic regulatory body empowered to establish, either mandatorily or at the request of an interested party, the royalties to be paid for the use of copyrighted works, when the administration of such copyright is entrusted to a collective society.
3.188. In a noteworthy case of copyright litigation, applying the statutory damages provisions amended as discussed above, the Federal Court of Canada awarded an amount of Can$10million in statutory damages to Twentieth Century Fox Film Corporation for copyright infringement of its "The Simpsons and Family Guy" television programs, finding the uploading of over 700 episodes of these series for public viewing to be for commercial purposes, since the defendant derived revenue from these infringement through pay-per-click advertisements.140
136 Section 38.1(1)(a) and (b) of the Copyright Act. 137 Sections 29.21 to 29.24 of the Copyright Act. 138 Sections 32 of the Copyright Act. 139 Re:Sound v. Motion Picture Theatre Associations of Canada, [2012] 2 SCR 376, 2012 SCC 38;
Alberta (Education) v. Canadian Copyright Licensing Agency (Access Copyright), [2012] 2 SCR 345, 2012 SCC 37; Society of Composers, Authors and Music Publishers of Canada v. Bell Canada, [2012] 2 SCR 326, 2012 SCC 36; Rogers Communications Inc. v. Society of Composers, Authors and Music Publishers of Canada, [2012] 2 SCR 283, 2012 SCC 35; Entertainment Software Association v. Society of Composers, Authors and Music Publishers of Canada, [2012] 2 SCR 231, 2012 SCC 34. See also: Reference re Broadcasting Act, [2012] 1 SCR 142, 2012 SCC 4; Reference re Broadcasting Regulatory Policy CRTC 2010-167 and Broadcasting Order CRTC 2010-168, [2012] 3 SCR 489, 2012 SCC 68; and Cinar Corporation v. Robinson, [2013] 3 SCR 1168, 2013 SCC 73. These decisions are available at The Canadian Legal Information Institute website (CanLII - https://www.canlii.org/).
140 Twentieth Century Fox Film Corporation v. Nicholas Hernandez et al., 2013 FC, (case T-1618-13, 3 December 2013).

WT/TPR/S/314 • Canada
- 106 -
3.3.6.7 The Trademark System
3.189. Substantial changes to the Trademark System are envisaged by Bill C-31 and Bill C-8.141 These changes foresee adding several procedural provisions relating to the three international treaties that the Canadian government seeks to ratify: the Madrid Protocol, the Singapore Treaty and the Nice Agreement.
3.190. Other changes envisage reducing the term of registration and renewal period from 15 to ten years, and eliminating the requirement to supply a declaration of use of the trademark or certification mark as a condition of registration. This departure from previous practise will mean that applicants will no longer be required to specify grounds for filing, such as use in Canada, proposed use in Canada, or use and registration abroad. Instead, an applicant will be able to file an application and obtain a registration as long as he is using or proposing to use a mark and is entitled to use the mark in Canada. This change will be particularly significant. Although use continues to be an important element for trademark rights in Canada, the abolition of the requirement to provide a declaration of use prior to registration has raised concerns over the potential for bad faith registrations of unused marks.
3.191. The new provisions also envisage expanding the definition of trademarks to include so-called non-traditional trademarks such as sounds and smells. Anticipating these changes, CIPO began accepting the registration of sounds as trademarks as of 28 March 2012.142
3.192. A particular feature of Canadian trademark law is the availability of "official trademarks" which permit public authorities to prohibit the adoption as trademarks of badges, emblems, crests, or marks they are using for goods or services.143 Critics have argued that the use of official mark provisions have at times been abused by certain public authorities in ways that stifle innovation and distort markets, and have suggested abrogating or significantly restricting the scope of these provisions.144
3.193. The Drug regulatory authority Health Canada, which also approves drug brand names as part of the marketing approval process of pharmaceuticals, issued new guidelines on the submission of drug brand names in July 2014.145 This guideline provides the process to be followed and the information to be submitted by manufacturers to Health Canada regarding the potential for a proposed name to be misleading or confused with another product authorized for use in Canada. Examination of such similarity is intended to reduce the potential for miscommunication between patient and doctor and prevent medication errors.146
3.3.6.8 Geographical Indications
3.194. Further to the terms of the 2004 Canada-EU Wine and Spirits Agreement described in the last TPR Report147, Canada removed the wine names Chablis, Champagne, Port, Porto and Sherry from its generic classification list with effect of 31 December 2013.148
3.195. New commitments undertaken by Canada in the Canada-Korea FTA (CKFTA), which entered into force on 1 January 2015, and CETA, once signed, ratified and entered into force, will establish individual protections for Geographical Indications (GIs) covered therein that go beyond the level of protection required by the TRIPS Agreement.
3.196. Under Article 16 of CKFTA, Canada commits to protect four Korean GIs – three types of ginseng and one type of rice149 - against any use on such goods not originating in the place
141 Bill C-31, Economic Action Plan 2015 Act, No, 1 received Royal assent on 19 June 2014, while Bill C-8, Combating Counterfeit Products Act, came into force on 1 January 2015.
142 Canadian Intellectual Property Office, Trade-mark consisting of a sound, 28 March 2012. Viewed at: http://www.cipo.ic.gc.ca/eic/site/cipointernet-internetopic.nsf/eng/wr03439.html.
143 Section 9(1)(n)(iii) of the Trade-marks Act. 144 House of Commons (2013a), p. 36. 145 Guidance Document for Industry - Review of Drug Brand Names, 2 July 2014. Viewed at:
http://www.hc-sc.gc.ca/dhp-mps/pubs/medeff/_guide/2014-review-examen_drug-medicament_names-marques/index-eng.php.
146 Health Canada (2014). 147 WTO document WT/TPR/S/246/Rev.1 (Chapter III, para. 197), 26 July 2011. 148 See repealed Section 11.18(3)(a)-(e) of the Trade-marks Act.

WT/TPR/S/314 • Canada
- 107 -
indicated by the GI in question, even where true origin is indicated, if used in translation, or if accompanied by expressions such as "kind", "type", "style", "imitation" or the like. The Republic of Korea commits, in return, to provide the same level of protection for "Canadian Whisky" and "Canadian Rye Whisky".
3.197. Article 7 of CETA establishes similar protection for a list of food GIs contained in an Annex, and provides exceptions for certain GIs on that list in certain cases. Exceptions include, for example, maintenance of prior rights and permission to continue prior commercial use, transition periods, and the use of qualifiers such as "kind", "type", "style", "imitation" or the like and in combination with a legible and visible indication of the geographical origin of the product concerned.150 A CETA Committee on Geographical Indications can recommend amendments to the list of GIs in Annex I "by adding geographical indications or by removing geographical indications which have ceased to be protected or have fallen into disuse in their place of origin."151
3.3.6.9 IP Enforcement
3.198. The Royal Canadian Mounted Police (RCMP), acting together with the Canadian Border Services Agency (CBSA), has reported an upward trend in the number of documented cases of counterfeit and pirated goods between the years of 2005 and 2012, with incidents involving harmful goods increasing from 11.5% (2005) to 30.4% (2012). The retail value of seizures of IP infringing goods has risen from Can$24.3 million in 2010 to Can$38.1 million in 2012, with apparel and footwear representing 45% of seized commodities, followed by copyrighted works (20%), consumer electronics (9%), personal care products (9%) and pharmaceuticals (6%). Incidents are concentrated in the main cities which are also the key entry points to the Canadian market.152
3.199. The Standing Committee on Industry, Science and Technology, after hearing witnesses, identified a number of areas for Government attention to improve the enforcement regime coverage for trademarks and copyright. The Committee's report on the "Intellectual Property Regime in Canada" recommended that the Government introduce legislative measures to strengthen enforcement at the border, including by providing ex officio powers to customs officials, introducing civil and criminal remedies for trademark counterfeiting; and allowing customs officials to share information with rights holders regarding suspected goods.153
3.200. Addressing the challenges raised in the parliamentary report, the Government of Canada reintroduced in Parliament the Combating Counterfeit Products Act (Bill C-8) in 2014154, which came into force on 1 January 2015. This Act implements changes to the Copyright and Trade-marks Act to strengthen IP enforcement, and introduces new border enforcement measures. More specifically, the Act creates new criminal offences for trademark counterfeiting that are analogous to existing offences in the Copyright Act, as well as new criminal provisions prohibiting the possession or export of counterfeit trademarked goods, packaging or labels, or of products that infringe copyright. It further provides for new border enforcement measures enabling customs officers to detain goods that they suspect infringe copyright or trademark rights, and allowing the officers to share information relating to the detained goods with rights owners who have filed a request for assistance, in order to give the rights owners an opportunity to pursue a remedy in court. The importation and exportation of copies and goods by individuals for their personal use is exempt from the application of such border measures.
3.201. The Act faced criticism from parliamentary opposition155 and other commentators for giving excessive powers to border officials, and for succumbing to pressure to implement ACTA in Canada while the Agreement had been rejected in Europe and was widely unpopular with civil society groups around the world. However, during Committee hearings, other stakeholders criticized Bill
149 The Korean GIs covered are "GoryeoHongsam", "GoryeoBaeksam", "GoryeoSusam", and "IcheonSsal" and their translations, respectively, "Korean Red Ginseng", "Korean White Ginseng", "Korean Fresh Ginseng" and "Icheon Rice".
150 Article 7.6 CETA. 151 Article 7.7 CETA. Annex I currently contains a list of exclusively European GIs. 152 RCMP online information, "2012 Intellectual Property (IP) Crime Statistics". Viewed at:
http://www.rcmp-grc.gc.ca/fep-pelf/ipr-dpi/report-rapport-2012-eng.htm. 153 House of Commons (2013a), pp. 39-41. 154 The bill had originally been introduced in 2013 as Bill C-56. 155 See questions posed by NPD Members at question time on 4 March 2014. Viewed at: http://open
parliament.ca/debates/2013/3/4/christian-paradis-3/.

WT/TPR/S/314 • Canada
- 108 -
C-8 for not going far enough including by not providing for statutory damages for trademark counterfeiting and not asking rights holders to assume the costs of border measures.
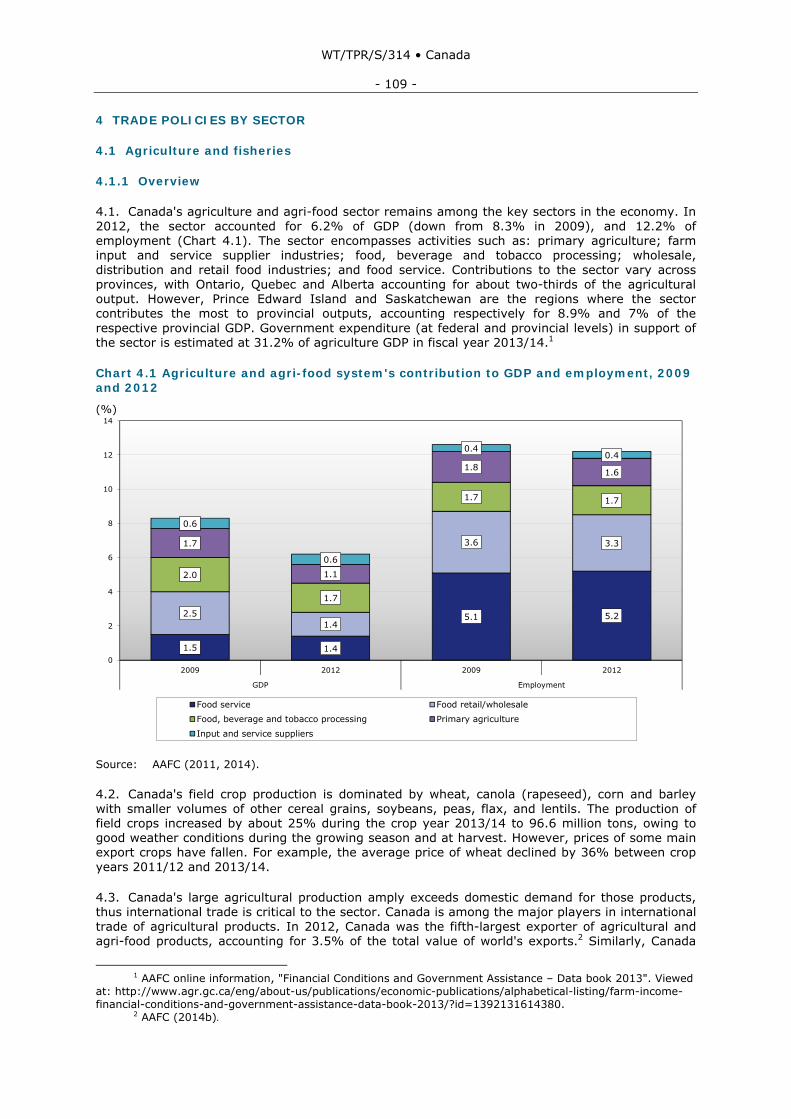
WT/TPR/S/314 • Canada
- 109 -
4 TRADE POLICIES BY SECTOR
4.1 Agriculture and fisheries
4.1.1 Overview
4.1. Canada's agriculture and agri-food sector remains among the key sectors in the economy. In 2012, the sector accounted for 6.2% of GDP (down from 8.3% in 2009), and 12.2% of employment (Chart 4.1). The sector encompasses activities such as: primary agriculture; farm input and service supplier industries; food, beverage and tobacco processing; wholesale, distribution and retail food industries; and food service. Contributions to the sector vary across provinces, with Ontario, Quebec and Alberta accounting for about two-thirds of the agricultural output. However, Prince Edward Island and Saskatchewan are the regions where the sector contributes the most to provincial outputs, accounting respectively for 8.9% and 7% of the respective provincial GDP. Government expenditure (at federal and provincial levels) in support of the sector is estimated at 31.2% of agriculture GDP in fiscal year 2013/14.1
Chart 4.1 Agriculture and agri-food system's contribution to GDP and employment, 2009 and 2012
(%)
1.5 1.4
5.1 5.22.51.4
3.6 3.3
2.0
1.7
1.7 1.7
1.7
1.1
1.8 1.6
0.6
0.6
0.40.4
0
2
4
6
8
10
12
14
2009 2012 2009 2012
GDP Employment
Food service Food retail/wholesale
Food, beverage and tobacco processing Primary agriculture
Input and service suppliers
Source: AAFC (2011, 2014).
4.2. Canada's field crop production is dominated by wheat, canola (rapeseed), corn and barley with smaller volumes of other cereal grains, soybeans, peas, flax, and lentils. The production of field crops increased by about 25% during the crop year 2013/14 to 96.6 million tons, owing to good weather conditions during the growing season and at harvest. However, prices of some main export crops have fallen. For example, the average price of wheat declined by 36% between crop years 2011/12 and 2013/14.
4.3. Canada's large agricultural production amply exceeds domestic demand for those products, thus international trade is critical to the sector. Canada is among the major players in international trade of agricultural products. In 2012, Canada was the fifth-largest exporter of agricultural and agri-food products, accounting for 3.5% of the total value of world's exports.2 Similarly, Canada
1 AAFC online information, "Financial Conditions and Government Assistance – Data book 2013". Viewed
at: http://www.agr.gc.ca/eng/about-us/publications/economic-publications/alphabetical-listing/farm-income-financial-conditions-and-government-assistance-data-book-2013/?id=1392131614380.
2 AAFC (2014b).

WT/TPR/S/314 • Canada
- 110 -
was the sixth-largest importer of agricultural products, accounting for 2.7% of the total value of world imports. The United States is by far Canada's major trading partner in agricultural products, being the source of 61.2% of Canada's imports and the destination market for 48.4% of exports.
4.4. Canada is a major player in international food assistance, providing it mainly through grants. Most food assistance is channelled either through the World Food Programme (WFP), of which Canada is one of the largest donor countries3; or the Canadian Foodgrains Bank, a non-profit charitable organization involved in humanitarian and development activities. In 2011-12, Canada provided a total of 306,422 tonnes of food aid to 40 LDCs and 14 Net Food-Importing Developing Countries (NFIDCs), valued at Can$258 million.4 This represented a volume increase of 36% compared to the previous period. Nearly half of this assistance was channelled through the WFP.
4.1.2 Border measures
4.5. Based on the 2014 MFN tariff, Canada's average level of applied tariff protection for the agricultural sector (WTO definition) remained at 22.5%, almost unchanged compared to the last review (Table 3.4). This relatively high level of protection is driven essentially by dairy products (with an average tariff rate of 238.7%), animal products (47%) and to a lesser extent, cereal products (28.2%).
4.6. Canada maintains a tariff rate quota (TRQ) regime for some agricultural products (Table 4.1). About 41% of the applied MFN in-quota tariffs for agricultural products (totalling 152 tariff lines) are non-ad valorem. The ad valorem equivalents of these in-quota rates range from 0.3% to 8.6% (for products where import data were available to calculate the AVEs). In-quota imports generally exceed quota levels for products such as chicken, eggs, wheat products and barley products, reflecting preferential imports under other bilateral commitments. In the case of dairy products the quota was generally filled (100% utilization). Fill rates for wheat and barley, as well as margarine were low in 2012 (and below those of 2008). According to the authorities, these low fill rates in the case of wheat and barley were due to market conditions, such as competitive market prices and market surpluses. They have also stated that there are no restrictive conditions on the issuance of import permits and that they are issued on a first-come first-served basis. In the case of margarine, the authorities have noted that the main reason for the underutilisation of the TRQ was a very competitive domestic industry. They do not consider that the 500 tonnes limit per importer restricts importers' ability to import.
Table 4.1 Tariff rate quota levels and fill rates, 2008 and 2012
Description of Products
WTO tariff rate quota level
Reservations 2008 fill rate (%)
2012 fill rate (%)
Creama 394 tonnes Limited to sterilized cream, minimum 24% butterfat, in cans of a volume not exceeding 200ml
100 100c
Dry wheya 3,198 tonnes 100 50.7c Buttera 3,274 tonnes 61% reserved for
New Zealand 99 100c
Wheata 226,883 tonnes 25 13.8c Barleya 399,000 tonnes 47 10.2c Wheat productsa 123,557 tonnes 124 125.3c Barley productsa 19,131 tonnes 147 109.1c Broiler hatching eggs and chicks
7,949,000 dozen egg equivalent
149 147
Chicken, live, meat and productsb
39,843.7 tonnes (eviscerated)
189 189.5
Turkey, live, meat and productsb
5,588 tonnes (eviscerated)
100 99.2
3 DFAIT online information. Viewed at: http://www.acdi-cida.gc.ca/acdi-cida/acdi-cida.nsf/en/JUD-
24133116-PQL. 4 WTO document G/AG/N/CAN/100, 22 September 2014.

WT/TPR/S/314 • Canada
- 111 -
Description of Products
WTO tariff rate quota level
Reservations 2008 fill rate (%)
2012 fill rate (%)
Beef and vealb 76,409 tonnes 45.8% reserved for Australia and 38.7% for New Zealand; the rest applies to imports from countries with which Canada does not have a bilateral trade agreement that covers these products
55 61.1
Fluid milkb,d 64,500 tonnes Filled by individual importers for personal consumption
n.a. n.a.
Concentrated and condensed milk/creamb
11.7 tonnes 100% reserved for Australia 0 92.3
Yogurtb 332 tonnes 100 100 Powdered buttermilkb 908 tonnes 100% reserved for
New Zealand 100 74.7
Other products of milk constituentsb
4,345 tonnes 91 97.4
Cheeseb 20,411.866 tonnes
66% reserved for the EU 100 100
Other Dairyb 70 tonnes 0 7.7 Ice Creamb 484 tonnes 74 89.2 Eggs and egg productsb 21,370,000 dozen
egg equivalent 95 89
Margarineb 7,558 tonnes 50 22.5 Milk Protein Substancesa 10,000 tonnes n.a. 56.3c
n.a. Not applicable.
a Administered on a marketing year basis. b Administered on a calendar year basis. c Marketing year 2011/12. d There is no data for fluid milk because its importation is left to individual importers (under the GIP
No.1, any resident may import dairy products for personal use).
Source: WTO (2011); Canada's WTO Goods Schedule; and WTO document G/AG/N/CAN/103, 18 November 2014.
4.7. There have been no major changes to the administration of the TRQ regime since the last Review. No new TRQs have been introduced. An import permit from DFAITD is required for each shipment of a product subject to a TRQ. Except for TRQs that are administered on a first-come first-served basis, importers are required to obtain a quota allocation before requesting shipment-specific import permits. Allocations are based on a variety of methods, including: equal share amongst eligible applicants; market share (i.e. based on the applicants' share of total sales, value added, imports, or others); pro-rata of demand (i.e. allocation made based on how much the applicants requested, or a pro-rata thereof); and historical (historical importers receive the same allocation every year).5 A number of TRQs are allocated using a mix and variations of these methods.6 Under-utilization penalties, transfer and return policies are used in order to maximize TRQ fills. Some TRQs are administered on a calendar year basis, while others are administered on a marketing year basis (Table 4.1).
4.1.3 Domestic programmes
4.8. Agricultural policy is a shared responsibility between federal and provincial/territorial (FPT) governments. The development of agricultural policies, therefore, usually involves both levels of government and programmes are generally cost-shared between the two levels. The legislative framework for agriculture comprises several Acts and Regulations, most of which are administered
5 The detailed allocation methods can be found in various Notices to Importers. Viewed at:
http://www.international.gc.ca/controls-controles/index.aspx?view=d&lang=eng. 6 For example, the TRQ for chicken is allocated using a mix of the historical, markets share, and
equal-share methods, as well as a variation of the pro-rata of demand measure.

WT/TPR/S/314 • Canada
- 112 -
either by Agriculture and Agri-food Canada7 or the Canadian food Inspection Agency.8 Under the Farm Income Protection Act (FIPA)9, the federal government may enter into an agreement with one or more provinces (or territories) in order to provide for the establishment of net income stabilization account; gross revenue insurance; revenue insurance; and crop insurance programmes. The Food and Drugs Act is the primary legislation governing food safety (see Section 3.1.9). The legislative framework also includes the Agricultural Marketing Programs Act, which regulates a number of marketing programmes such as the Advance Payments Program and the Price Pooling Program.
4.9. The main FPT policy setting mechanism is an agricultural policy framework agreement, which typically lasts five years. During the review period, two such policy frameworks have been implemented: The Growing Forward Framework Agreement 1 and 2 (GF1 and GF2 respectively), for the periods 2008-13 and 2013-18. GF1 and GF2 are the continued basis for FPT collaboration with regards to agricultural policy, programmes and services.10
4.10. The current agricultural policy framework, GF2 includes Can$3 billion investment by FPT governments and constitutes the foundation for government agricultural programmes and services in the 2013-18 period. Launched in April 2013, GF2 builds on previous frameworks with an emphasis on three broad priorities: innovation, competitiveness, and market developments. The framework relies on two sets of instruments: Strategic Initiatives and a statutory demand driven suite of Business Risk Management (BRM) programmes. GF2 reforms existing programmes with a view to encouraging farmers to take greater responsibility in the management of normal business risks, and reinforces the BRM framework with the introduction of the AgriRisk initiative (see below).
4.11. Under the GF2 policy framework, up to Can$2 billion in federal funding over five years was allocated in support of Strategic Initiatives. Half of the resources have been earmarked for three new programmes to be administered at the federal level by the AAFC. The remaining portion of the funding is for programmes to be designed and/or delivered at provincial/territorial level, and funded on a cost-shared basis at a 60:40 ratio with provincial and territorial governments. AgriInnovation, AgriMarketing and AgriCompetitiveness are the three new programmes to be administered at the federal level.11
4.12. AgriInnovation builds on the Agricultural Innovation Program and the Canadian Agri-Science Clusters, both terminated in 2013. It is designed to support agricultural R&D, and the commercialization and adoption of emerging innovations. It has an overall budget of Can$698 million over a five-year period. About two-thirds of this funding is destined to projects based on applications from the sector, and the remaining portion is destined to AAFC's R&D and knowledge transfer activities. Farmers and non-profit organizations can submit their projects under one of the following two streams: the Industry-led R&D stream, and the Enabling Commercialization and Adoption Stream. Support provided under the R&D stream is non-repayable, while support under the Commercialization and Adoption Stream takes the form of non-interest bearing contribution funds, to be repaid over a period of up to 10 years following project completion. In general, AgriInnovation may contribute up to 50% of the eligible cost. However, the contribution can be raised up to 75% for projects led by a non-profit organization. There is an annual cap of Can$10 million on the maximum contribution provided to a single applicant.
4.13. AgriMarketing focuses on market access. It provides Can$341 million in the form of government projects and contribution funding, destined to support projects in the following four areas: development and implementation of long-term market development strategies; promotional
7 A list of Acts administered by AAFC can be found at: http://www.agr.gc.ca/eng/about-us/acts-and-regulations/?id=1180107359564.
8 A list of Acts administered and enforced by CFIA can be found at: http://www.inspection.gc.ca/about-the-cfia/acts-and-regulations/list/eng/1419029096537/1419029097256.
9 Farm Income Protection Act S.C. 1991, c. 22, as consolidated (Last amended on 1 March 2013). 10 AAFC online information. Viewed at: http://www.agr.gc.ca/eng/about-us/key-departmental-
initiatives/growing-forward-2/?id=1294780620963#ci. 11 Under the previous five-year policy framework (GF1), a number of policies and programmes, which
expired, played a similar role in assisting the industry with adaptation and adoption of new technologies. These included the Agricultural Flexibility Fund (AgriFlexibility); the Agri-Processing Initiative (API); and the Canadian Agricultural Adaptation Program (CAAP).
WT/TPR/S/314 • Canada
- 113 -
and market development activities in foreign markets; breaking down of trade barriers; and, building market success. For market development projects, eligible businesses can be granted up to Can$50,000 annually in funding, subject to a maximum coverage of 50% of eligible costs. AgriMarketing also comprises an Assurance Systems Stream, a component aiming at helping the industry improve its capacity to adopt assurance systems such as food safety and traceability. Under this stream, the programme may contribute up to Can$1 million per project, with a minimum contribution of 25% from the applicant.
4.14. AgriCompetitiveness targets direct investments with a view to strengthening the food and agriculture industry's capacity to adapt and be profitable in domestic and global markets. It provides Can$114.5 million in funding and comprises a combination of government initiatives and contribution funding for industry-led projects.
4.15. The policy framework also provides provinces and territories with the flexibility to design and deliver programmes that respond to regional priorities. Provinces can also determine the level of resources to be expended in the overall programme area of support within the agreed limits of the Framework Agreement. Under GF2, the federal government commits to allocate up to Can$1 billion for provincial programmes. The allocation is based on factors such as the number of producers within each province or territory, and the amount of farm cash receipts.
4.1.3.1 Business Risk Management (BRM) programmes
4.16. The BRM suite of programmes is a set of tools designed to support Growing Forward strategic outcomes by allowing producers to manage risks associated with severe market volatilities, production losses and disaster situations, thereby helping them to reduce income losses. The Farm Income Protection Act (FIPA) of 1991 is the legal basis for the programmes. The cost of BRM programmes is generally shared between federal and provincial/territorial governments on a 60:40 basis. As the programmes are demand-driven, expenditures fluctuate from year to year. From 2007 to 2012, over Can$12 billion in support was disbursed to producers through BRM programmes. The four cost-shared BRM programmes are:
a. AgriInvest, a government-matched producer savings account for moderate income declines or investments in farming operations. Farmers are able to make annual deposits in their AgriInvest account held at a participating financial institution. Deposits are based on a percentage of farmers' allowable net sales, and receive matching contributions from FPT governments. Starting in 2013, farmers can deposit up to 100% of their allowable net sales annually, with the first 1% matched by governments. The limit on matching government contributions is Can$15,000 per year. For the 2013/14 fiscal year, nearly Can$211 million were disbursed by FPT governments in matching contributions, a significant decline compared to the two previous fiscal years (see Table A4.1).
b. AgriStability, a whole-farm margin programme that provides support in years of significant income declines. AgriStability is based on margins. There is a Program margin, which is a farmer's allowable income minus his/her allowable expenses in a given year, with adjustments for changes in receivables, payables and inventory; and a Reference margin, which is a farmer's olympic average (highest and lowest values are dropped from the calculation) of Program margins for the past five years, and must not be higher than the average allowable expenses for the years used to calculate it. AgriStability provides support when a farmer's Program margin falls below 70% of the Reference margin. AgriStability is delivered in Manitoba, New Brunswick, Nova Scotia, Newfoundland and Labrador and Yukon by the federal government. In Alberta, British Columbia, Ontario, Prince Edward Island, Quebec and Saskatchewan, AgriStability is delivered provincially. During each of the 2011 and 2012 programme years (under GF1), more than Can$500 million was disbursed under AgriStability (see Table A4.1). Preliminary data for the 2013 programme year (the first year under GF2) point towards a significant decline in AgriStability support.
c. AgriInsurance, a subsidized insurance that provides coverage for production losses due to natural disasters. AgriInsurance is provincially delivered; the federal government contributes a portion of total premiums and administrative costs and provides a reinsurance arrangement (deficit financing) to provinces. Currently, five provinces

WT/TPR/S/314 • Canada
- 114 -
(Alberta, Saskatchewan, Manitoba, New Brunswick and Nova Scotia) participate in the reinsurance arrangement. AgriInsurance plans are developed and delivered by each province and may be both yield and non-yield based. They cover traditional crops such as: wheat, corn, oats and barley as well as horticultural crops. GF2 contains guidelines for provinces to develop and implement livestock plans under AgriInsurance. About Can$1.2 billion was disbursed by various governments during the fiscal year 2013/14 (Table A4.1).
d. AgriRecovery, a disaster relief framework. The AgriRecovery framework has been designed to complement the other BRM programmes in helping producers recover from natural disasters. The focus of the framework is to respond in situations where producers do not have the capacity to cover the extraordinary costs associated with recovering from a disaster, even with the assistance available from other programmes. The process for assessing disasters and developing initiatives under the framework starts with a request from a provincial or territorial government, followed by a joint assessment by the FPT governments of the impacts of the disaster, and a determination of actions producers must take to mitigate the impacts and/or resume production. It is then assessed whether producers are able to undertake these actions with the assistance available through the core BRM programmes. If further assistance is needed, an AgriRecovery initiative is activated and payments are made to eligible producers. An initiative was activated under the Framework in 2014. The 2014 Canada-Manitoba Forage Shortfall and Transportation Assistance Initiative aims at helping Manitoba livestock producers (who were experiencing forage shortages caused by elevated water levels) secure the feed they need to maintain their breeding herds over the winter feeding season.12
4.17. Under GF2, a new programme was added to BRM tools. AgriRisk Initiatives (ARI) provides financial assistance for activities related to the development and implementation of new risk management tools from the private sector. ARI consists of two components: the R&D component, funded by the federal government, and the Administrative Capacity Building (ACB) component, operated on a cost-shared basis. Projects approved under the R&D component can be eligible for federal support of up to Can$500,000 per fiscal year. For ACB projects, the federal government plans to provide up to Can$8 million annually. ARI supports research and development as well as the implementation (and pilot implementation) of new risk management tools. No expenditure was incurred under ARI during the fiscal year 2013/14.
4.18. BRM programmes are, in principle, designed to be complementary and to prevent duplication of coverages. They aim at mitigating various risk layers and addressing different types of losses. It has been noted, however, that some programmes such as AgriStability, AgriInsurance and AgriInvest may provide coverage in the same risk layers, although based on different mechanisms and rationales.13 A recent evaluation of the effectiveness of the BRM suite of programmes by the AAFC noted that this coverage overlap between programmes may be crowding out the development of producer-led or private sector initiatives that could complement current BRM tools.14 There are also concerns that coverage may be provided for low level risks (i.e., risks that occur relatively frequently but which should lie within the scope of any business to manage). As noted in a report by the OECD, the major policy challenge in Canada is to maintain farmers' incentives to proactively develop risk management strategies and improve the targeting policies to income risk.15
4.19. AAFC has taken steps to address some of the concerns identified. In this respect, under GF2, BRM programmes have been adjusted to reduce concerns about providing coverage in lower-risk layers, and to support development of new risk management tools, as recommended by the 2012 AAFC Evaluation report. These changes include a reduction in AgriStability reference
12 AAFC online information. Viewed at: http://www.agr.gc.ca/eng/?id=1387480598562. 13 However, as an OECD study notes, the overlapping between different programmes should not be
interpreted as double compensation for risk since, for example, both AgriStability and AgriRecovery have provisions to take payments from other programmes into account in determining programme benefits, OECD (2011).
14 This evaluation by the AAFC's auditing body recommended that the authorities re-examine the risks faced by the industry with a view to identifying those that would better define the level and nature of risk for which the Government was suited to cover, and adjust the programmes accordingly. Source: AAFC (2012).
15 OECD (2011).

WT/TPR/S/314 • Canada
- 115 -
margins trigger from 85% to 70% (i.e. increasing the payment trigger from 15% to a 30% margin decline). Compensation rates under the programme were to be harmonized at a flat rate of 70% of a producer's loss (previously there were three different compensation rates depending on the degree of loss). Similarly, the AgriInvest matching contribution from governments was reduced to 1% of the producer's allowable net sales (from 1.5% previously), with a cap of Can$15,000 (instead of Can$22,500). However, the maximum amount of account balance under AgriInvest has been increased from 25% to 400%16 of the allowable net sales to encourage producer savings.
4.1.3.2 Other programmes
4.20. In addition to the Growing Forward framework, the federal government funds a number of other programmes established under various pieces of legislation or policy frameworks.
4.21. Established under the Canadian Agriculture Loan Act of 1985 (CALA), the CALA Program is a loan guarantee facility that aims at supporting the renewal of the agricultural sector and enabling co-operatives to be in a better position to seize market opportunities. Under the programme, the federal government guarantees to the lender the repayment of 95% of net losses they may incur on an eligible loan. Lenders, such as banks, credit unions and caisses populaires, issue and administer loans under the CALA Program. The maximum aggregate loan limit for any one farm operation is Can$500,000: loans are capped at Can$500,000 for land and buildings and at Can$350,000 for all other loan purposes, including consolidation/refinancing. The maximum aggregate loan limit for agricultural co-operatives is Can$3 million, with the Minister's approval.17 For fiscal year 2013/14, about Can$113 million worth of loans have been issued by financial institutions under the CALA (Table A4.1).
4.22. Under the Agricultural Marketing Programs Act of 1997 (AMPA), Canada maintains several guarantee programmes, including the Advance Payments Program and the Price Pooling Program (PPP). The objective of the Price Pooling Program is to provide a price guarantee mechanism that protects marketing agencies and producers against unanticipated declines in the market price of their products.18 Under the AMPA, the federal government typically enters into an agreement with a marketing agency to market a given product under a cooperative plan. The agreement is specific to a product in a given crop year, and may be used by the marketing agency as security in obtaining credit from lending institutions. It also allows the agency to improve the producers' cash flow through an initial payment for products delivered. The price guarantee is set at a given percentage, but up to a maximum of 65% of the expected wholesale price of the product. If the realized price is less than the guarantee value (the initial payment plus the eligible costs), the programme allows for a payment for the shortfall by the federal government (through participating marketing agencies).
4.23. The Advance Payments Program is a product-specific loan guarantee programme under which the federal government, inter alia, guarantees cash advances of up to Can$400,000 to producers based on the value of the eligible product (including livestock). The programme is delivered through producer organizations, which must apply to AAFC in order to administer the programme. Loans are repayable within 18 months and the first Can$100,000 portion is interest-free. In the 2013-14 production period, the Government guaranteed Can$2.4 billion in advances.
4.24. Under the Agricultural Products Marketing Act of 1985(APMA), the federal government may grant provincial entities, including boards and agencies, authority to "regulate the marketing of agricultural products in interprovincial and export trade". A provincial entity that is granted such a power enacts regulations or other instruments specifying how the power is exercised. In some cases, these powers include the authority to set production quotas and prices. The APMA also grants provincial entities the power to set levies on the interprovincial movement or export of agricultural goods.
4.25. There are also a number of support initiatives taken at the provincial or territorial levels. For instance, Quebec and Ontario maintain provincial programmes that complement AgriStability. In
16 In 2013. 17 AAFC online information. Canadian Agricultural Loans Act Program. Viewed at:
http://www.agr.gc.ca/eng/?id=1288035482429. 18 AAFC online information. Viewed at: http://www.agr.gc.ca/eng/?id=1289934791790.

WT/TPR/S/314 • Canada
- 116 -
Quebec, the Farm Income Stabilization Insurance (ASRA) programme guarantees a stabilized income to producers who raise and sell their livestock or grow and sell crops.19 They typically pay a premium each year and receive compensation when the average selling price is lower than a reference price derived from the stabilized income. Programme participants commit for five years. The provincial government covers about two-thirds of the insurance premiums. Ontario runs a similar scheme under the Risk Management Program. This provides additional protection against risks such as rising costs and market price volatility.
4.1.4 Export measures
4.26. Canada's WTO export subsidy reduction commitments apply to 11 product groups: wheat and wheat flour, coarse grains, oilseeds, vegetable oils, oilcakes, butter, skim milk powder, cheese, other milk products, vegetables, and incorporated products. However, only five product groups are actually subject to subsidies, with commitment levels being regularly reached for milk products and incorporated products (Table 4.2). For the marketing year running from August 2011 to July 2012, total export subsidies outlays declined by 2.3% to Can$88.3 million, representing some 0.14% of agricultural exports. According to the authorities, preliminary figures for 2012-13 indicate that Canada remains well within its export subsidies commitments.
Table 4.2 Export subsidies: commitment levels and annual outlays, 2009-13
(Can$ 000') Products Annual
commitmenta Subsidised exportsa
2009-10 2010-11 2011-12 2012-13b Butter 11,025 2,321 522 0 10,364
Skim Milk Powder 31,149 31,149 31,149 31,149 31,149 Cheese 16,228 13,997 13,753 14,384 16,143
Other Milk Products 22,505 22,505 22,505 22,473 22,500 Incorporated Products 20,276 20,276 20,275 20,276 20,272
Total 101,183 90,248 88,204 88,282 100,427
a Subsidized quantities are not reported to save some space. b Estimates from Agriculture and Agri-Food Canada.
Source: WTO documents G/AG/N/CAN/92, 16 July 2012; and G/AG/N/CAN/101, 26 September 2014.
4.1.5 Evolution of support and protection
4.27. Government expenditure in support to the agriculture sector in Canada has been on a declining trend over the past decade. It was estimated at Can$6.2 billion for fiscal year 2013/14, and represented 31.2% of the sector's GDP.20 Contributions from the federal government have averaged 57.2% of total support over the past three decades. A majority of federal support (74.2%) is divided among expenditure related to research and inspection services, and programme payments (essentially BRM programmes).
4.28. Under WTO commitments, Canada bound its total Aggregate Measurement of Support (AMS) at Can$4.3 billion annually. Between 2007 and 2011, Amber box support has oscillated between Can$3 billion and Can$3.5 billion (Table 4.3). However, a large share of this support was within Canada's de minimis provisions, and is therefore exempted from WTO commitments. This has, hence, led to a much lower total AMS. For 2011, current total AMS support amounted to Can$522 million, and represented 12.1% of Canada's bound total AMS. A majority of this support is provided in the form of market price support to dairy products. Green-box type support has remained relatively stable, accounting for about 47% of total support notified to the WTO.
19 Eligible animal products include: lambs, cow calves, steers, milk-fed calves, grain-fed calves, piglets,
hogs, eligible plant products include cereals, grain corn, oilseeds, potatoes, and apples. 20 AAFC (2014a).

WT/TPR/S/314 • Canada
- 117 -
Table 4.3 Canada's domestic support, 2009-11
(Can$ million) 2009 2010 2011Measures exempt from the reduction commitment ("Green box")
Federal and federal/provincial 2,101 2,238 2,064 Provincial 587 616 663
Total Green Box 2,688 2,854 2,727 Aggregate Measurement of Support (Amber box) Product-specific AMS 1,456 867 872 - Market price support 548 461 508 - Direct payments 799 399 362 - Other supports 109 8 3 Non-product specific support 1,561 2,241 2,196 Total Amber Box 3,016 3,108 3,068 Less, De minimis - Product-specific 61 375 350 - Non-product-specific 1,561 2,241 2,196 Current total AMS 1,395 492 522Bound total AMS 4,301 4,301 4,301
Source: WTO Documents G/AG/N/CAN/98, 14 April 2014; G/AG/N/CAN/96, 13 March 2013; G/AG/N/CAN/90, 30 April 2012; G/AG/N/CAN/86, 14 October 2011; and AAFC (2014) Farm Income, Financial Conditions and Government Assistance, Data Book 2013. Viewed at: http://www.agr.gc.ca/ eng/about-us/publications/economic-publications/alphabetical-listing/farm-income-financial-conditions-and-government-assistance-data-book-2013/?id=1392131614380.
4.29. Preliminary estimates from the authorities put the 2012 total AMS at about Can$850 million, well below the annual commitment. The 2013 figure is expected to be similar given favourable crop and livestock conditions. In particular, price-related support to most products is expected to remain below the 5% de minimis level (with the exception of milk and sheep). Total non-product-specific support is expected to be below the 5% de minimis level as well.
Table 4.4 Evolution of support and protection, 2008-13
(Can$ million) 2008 2009 2010 2011 2012 2013Producer Support Estimate (PSE) 6,184 7,646 7,282 7,435 7,795 6,210 Support based on: - Commodity outputs 2,764 4,354 4,191 4,264 4,967 4,320 - Price Support 2,761 4,352 4,191 4,264 4,967 4,320 - Milk 1,849 3,071 2,977 2,606 3,071 2,701 - Poultry 493 450 353 791 920 777 - Eggs -7 116 159 206 244 200 - Other commodities 426 714 702 661 732 642 - Payments based on output 2 2 - - - - - Payments based on input use 535 472 459 501 503 414 - Payments based on A/An/R/I 2,767 2,486 2,510 2,592 2,233 1,422 - Payments based on non-commodity criteria - 285 57 15 - - - Miscellaneous payments 118 50 66 63 93 53 PSE (as a percentage of gross farm receipts) 13.49 17.22 16.50 14.85 14.51 11.60 Producer NPC 1.07 1.12 1.11 1.10 1.11 1.09 Producer NAC 1.16 1.21 1.20 1.17 1.17 1.13 Total value of production (at farm gate) 42,409 41,118 41,050 46,900 50,893 51,653
Note: A/An/R/I: Area, animal numbers, farm receipts or farm income. NPC: nominal protection coefficient. Ratio between the average price received by producers and the
border price (average producer price includes payments based on current output, e.g. deficiency payments).
NAC: nominal assistance coefficient. Producer NAC is the ratio between the value of gross farm receipts (including support) and gross farm receipts valued at border prices (measured at farm gate).
Source: OECD (2014), "Canada", in Agricultural Policy Monitoring and Evaluation 2014: OECD Countries, OECD Publishing. Viewed at: http://dx.doi.org/10.1787/agr_pol-2014-7-en.
4.30. Considering other measures of support, Canada's Producer Support Estimate (PSE) calculated by the OECD was 11.6% of the total value of production at farmgate in 2013, down

WT/TPR/S/314 • Canada
- 118 -
from 17.2% in 2009 (Table 4.4). Canada's PSE is also considerably lower than the average for the OECD as a whole, which was 18.3% in 2013.21
4.1.6 Selected sub-sectors
4.1.6.1 Wheat and barley
4.31. Although Canada's production of wheat represents only about 3% of world production, it is still the sixth largest producer of this crop and a major player in its international trade. During the 2013-14 crop year, wheat production reached a record level of 37.5 million tons due to favorable weather conditions (Table 4.5). Wheat is also an important source of farm cash receipts. In 2013, it provided Can$5.5 billion in farm cash receipts, accounting for about 10% of total farm cash receipts.22 Canada is an important producer and exporter of barley (seventh and sixth largest in the world, respectively, in 2011). Imports of both wheat and barley are negligible. Producer Single Commodity Transfers (Producer SCT) for wheat and barley represented respectively 1.5% and 2.5% of gross farm receipts during the crop year 2013-14.23
Table 4.5 Indicators for selected agricultural commodities, 2000-14
2000-01 2005-06 2010-11 2011-12 2012-13 2013-14a Wheat (including durum) Production ('000 tons) 26,536 25,749 23,300 25,288 27,206 37,530 Imports ('000 tons) 60 27 69 78 74 55 Exports ('000 tons) 17,109 15,699 16,184 17,500 19,578 23,474 Average Price, durum 253 189 300 345 290 220 Average Price, wheat 191 186 318 290 285 205 Producer SCT (Can$ million) 109 60 80 69 43 122 Percentage SCT (%) 3.0 1.8 1.7 1.3 0.6 1.5 Barley Production ('000 tons) 13,229 11,678 7,627 7,892 8,012 10,237 Imports ('000 tons) 40 46 43 14 19 9 Exports ('000 tons) 2,641 2,975 2,017 2,059 2,184 2,390 Average Price 129 110 188 225 279 188 Producer SCT (Can$ million) 57 41 40 37 10 40 Percentage SCT (%) 4.4 4.6 3.1 2.9 0.6 2.5
Note: SCT: Sum of transfers to producers granted to a single commodity. The % SCT is expressed a share of gross farm receipts for the specific commodity.
a AAFC forecast.
Source: Statistics Canada, and OECD (2014) "Producer and Consumer Support Estimates", OECD Agriculture Statistics Database, doi. Viewed at: http://dx.doi.org/10.1787/agr-pcse-data-en.
4.32. The Canada Grain Act is the main framework governing grain products such as wheat and barley. This legislation establishes the Canadian Grain Commission (CGC) as the federal agency tasked with the mandate, inter alia, of certifying the quality and the safety of grains, and overseeing quantity assurance at export. A major amendment to the legislation was introduced in 2014 under the Fair Rail for Grain Farmers Act.24 The amendment provides the CGC with the authority to address non-performance by grain companies in their contracts with producers, and to arbitrate any related dispute. The legislation requires contracts to include a penalty clause that would be paid if the company fails to take possession of the grain during the contracted delivery period.
21 OECD online information. Viewed at: http://stats.oecd.org/Index.aspx?QueryId=59239&lang=en. See
OECD (2014). 22 The figure includes payments from marketing boards, Statistics Canada online information. Viewed
at: http://www.statcan.gc.ca/tables-tableaux/sum-som/l01/cst01/agri03a-eng.htm [11.02.15]. 23 The Producer SCT is the annual monetary value of gross transfers (from consumers and taxpayers) to
producers arising from policy measures directly linked to the production of a single commodity. 24 The Act was also amended in 2012 to streamline certain elements of the legislation, including the
elimination of certain services; and the move towards an insurance-based system.

WT/TPR/S/314 • Canada
- 119 -
4.33. A major reform to the grain industry was the dismantlement of the monopoly in the marketing of wheat and barley. Until 2012, wheat and barley farmers in the western provinces (Alberta, Manitoba, Saskatchewan and part of British Columbia) were required to market their products through the Canadian Wheat Board (CWB). The Marketing Freedom for Grain Farmers Act25 signaled a move towards a more open marketing system by dismantling this monopoly and providing for a five-year transition period that would lead to a fully open market, and potentially to a full private ownership of the Board.26 In the meantime, the CWB retains federal government guarantees on borrowing and initial payments. The legislation also opened up the possibility for the Board to engage in the marketing of other crops. Since the monopoly was removed, a number of other companies are competing with CWB in the marketing of wheat and barley. The CWB expanded its business to include the marketing of canola and peas, and is planning on submitting a commercialization plan ahead of the legislated timetable of 31 July 2016.
4.34. Imports of wheat, barley and their products are subject to tariff rate quotas, administered on a marketing year basis (Table 4.1). Outside the quotas, normal tariffs apply at levels of up to 49%. Due to market dynamics, fill rates are generally low for wheat and barley.
4.35. Transportation and handling is the main challenge facing the Canadian grain industry, as a majority of the production is exported either in bulk or processed, and therefore has to be transported over long distances (mainly using the rail system). In 2013, the conjunction of record crop yields and extreme cold weather added a significant strain on the handling and transportation system. To address this issue, the Fair Rail for Grain Farmers Act was enacted to amend the Canada Transportation Act. The time-limited legislative amendments (which will expire in 2016 unless extended by Parliament), give the Minister of Transport and Minister of Agriculture and Agri-Food the right to set minimum weekly targets on volume of grains transported by railways, and impose financial penalties for non-performance (up to Can$100,000 per violation). The amendments also expanded shippers' abilities to choose a different railway by extending the interswitching27 limits from 30km to 160km, thereby fostering more competition.
4.1.6.2 Milk and dairy products
4.36. The dairy industry is the third largest contributor to Canada's agriculture and agri-food output, after the grains and red meat industries.28 It generated nearly Can$6 billion in farm revenues in 2013 (Table 4.6). The industry relies on more than 12,000 dairy farms, located mostly in the provinces of Quebec (49.2%) or Ontario (32.3%). The industry is on a concentration path, with the number of farms declining by 10% between 2008 and 2013, and about 75% of the milk production being processed by only 14% of the processing plants (owned by the three largest processors). Support levels for the dairy industry remain high; the Producer SCT as a share of revenue was 43.8% in 2013. The overall framework and regulation of the dairy sector has not changed significantly since the last review.
Table 4.6 Selected indicators of the Canadian dairy sector, 2008-13
2008 2009 2010 2011 2012 2013Farming sector Number of dairy farmsa 13,587 13,214 12,965 12,746 12,529 12,234 Total net farm receiptsb
(Can$ million) 5,306.3 5,449.9 5,524.2 5,815.5 5,917.8 5,916.1
Dairy manufacturing shipments (Can$ million)
12,793.6 13,523.4 14,150.0 14,042.9 14,699.3 15,744.5
Average farm milk price (Can$/hl) 71.94 73.26 74.27 76.45 75.63 77.12 Milk production ('000 hl) 75,720 76,412 76,525 77,547 79,576 77,977 Milk quota (in million kg of butterfat) 299.3 297.5 300.9 308.5 305.8 ..
25 The Marketing Freedom for Grain Farmers Act came into force on 1 August 2012. 26 In this respect, the Act mandates that the Corporation submit an application for continuance under
one of the following Acts for the Minister's approval: the Canada Business Corporations Act, the Canada Cooperatives Act, or the Canada Not-for-profit Corporations Act.
27 Interswitching allows shippers to ship goods on the rail network using a different railway company. In general, a shipper cannot request interswitching when the loading or the unloading point is more than 30 km from an interswitching point. Therefore, the extension of the interswitching limit from 30km to 160km is expected to foster competition among railway companies, and give shippers access to alternative rail services.
28 AAFC (2014c).

WT/TPR/S/314 • Canada
- 120 -
2008 2009 2010 2011 2012 2013Processing sector Number of plants 465 480 455 455 452 459 Fluid milk sales ('000 hl) 29,483 29,400 29,517 29,245 28,934 28,463 Industrial milk ('000 hl) 46,237 47,012 47,008 48,302 50,642 49,513 Trade (Can$ million) Exports 254.9 229.6 227.2 252.0 237.4 262.0 Imports 678.9 572.7 610.4 669.9 677.4 752.6 Support Producer SCT (Can$ million) 1,849 3,071 2,977 2,606 3,071 2,701 Percentage SCT (%) 33.4 54.8 52.3 43.3 50.4 43.8
.. Not available.
a Farms with shipments of milk or cream as of 1st August. b The value includes transportation and handling costs, and other fees.
Source: Statistics Canada, and OECD (2014), Producer and Consumer Support Estimates, OECD Agriculture Statistics Database. Viewed at: http://dx.doi.org/10.1787/agr-pcse-data-en.
4.37. The Canadian Dairy Commission (CDC) is a federal Crown corporation which plays a central role in the administration and coordination of the dairy industry. Established under the Canadian Dairy Commission Act, its objectives are "to provide efficient producers of milk and cream with the opportunity to obtain a fair return for their labour and investment and to provide consumers of dairy products with a continuous and adequate supply of dairy products of high quality".29
4.38. Milk production and marketing are regulated by provincial marketing boards and agencies. Food safety inspection for fluid milk and dairy products sold within a province falls under provincial jurisdiction, whereas the safety of inter-provincial and international movements of dairy products is under the mandate of the Canadian Food Inspection Agency.
4.39. The dairy sector is regulated through a domestic system of supply management. The system relies on three pillars: production controls (through a quota system), price controls, and import controls.30 The milk market is subdivided into the fluid milk market (about 40% of milk production), and the industrial market. The industrial market is jointly managed through a federal-provincial agreement known as the National Milk Marketing Plan, implemented by the Canadian Milk Supply Management Committee (CMSMC). The CMSMC sets the industrial milk production target. Provincial shares are established according to the National Milk Marketing Plan. Each year, the CDC reviews and establishes support prices (prices are the prices at which the CDC purchases and sells butter and skim milk powder within the framework of its various programmes) for butter and skim milk powder. In doing so, the Commission takes into account factors such as production costs, market conditions, the overall demand for milk and dairy products, and estimated fair return factors. Provincial milk marketing boards and agencies use this information to determine the price paid by processors for the milk that is used in the production of butter, skim milk powder, cheese, yogurt, ice cream and other processed foods. Fluid milk commands a higher price compared to industrial milk.
4.40. The overall quota is reviewed every year depending on the underlying demand. Between 2008 and 2012, the overall quota for industrial and fluid milk increased by 2.2% to 305.8 million kg of butter fat. This overall quota is allocated to farmers in accordance with the quotas (production rights) they own. Typically, a quota allows a farmer to produce 1kg of butter fat a day. This is approximately equivalent to 25 liters of milk, the daily production of a dairy cow. The quota is a negotiable right. Producers may trade quotas between themselves, subject to rules set by provincial marketing boards and agencies. Their prices are capped in some provinces. Such is the case of the provinces of Nova Scotia, New Brunswick, Prince Edward Island, Quebec and Ontario, where quota prices are capped at Can$25,000 per kilogram of butterfat. In the Western provinces (Manitoba, Saskatchewan, Alberta and British Columbia), prices have varied from Can$29,000 to Can$42,500 per kilogram of butterfat. The quota price acts as an "entrance fee" to the market, which can result in a barrier to entry, and is likely to hinder the competitiveness of the sector, especially for exports. Between 2008 and 2012, exports from the dairy sector represented less than 5% of total net farm receipts. Provinces have put in place various programmes to facilitate entry into the sector. Managed by provincial milk marketing boards, these programmes
29 Canadian Dairy Commission Act (R.S.C., 1985, c. C-15). 30 The supply management system also applies to poultry (chicken and turkey), and eggs.

WT/TPR/S/314 • Canada
- 121 -
typically offer to a limited number of new entrants, preferential access to quotas (through quota loans and/or privileged access on provincial quota exchange markets).
4.41. As part of the supply-management system, imports of most dairy products are subject to tariff-rate quotas (TRQs) administered by DFATD. Import quotas are established at pre-set levels. For example, the annual TRQ for cheese and butter are established respectively at 20,412 and 3,274 tonnes. In the case of the butter TRQ, the CDC is the first receiver of imports. Permits are allocated to the CDC with the understanding that the imported butter be directed for further processing. TRQ access quantities are provided in table 4.1. Out-of-quota rates are very high, and can be nearly 300% for butter, and over 245% for cheese.31
4.42. The National Dairy Regulation and Code provides requirements for milk production and transportation as well as for the processing of dairy products. It is the result of collaborative efforts by the provinces, food and health safety agencies, and the industry to harmonize basic regulations governing the production, transportation and processing of milk.
One of the weaknesses described regarding the supply managed system is the priority it gives to famers over consumers. Supply management results in limited competition, both domestic and international. The target price to producers is largely based on average production costs and the system has not created incentives for producers to lower their production costs over the years. It therefore guarantees stable revenue for producers while transferring the cost onto consumers. In a context of growing global demand for dairy products, the system also hinders the competitiveness of the industry and may be preventing it from taking advantage of international markets. Finally, the system is maintained at the cost of trade barriers (quotas, and very high out of quota tariff rates).
4.1.6.3 Red meat and livestock industry
4.43. Canada has a strong red meat and livestock industry. The industry includes beef and veal, pork, lamb and mutton, goat, rabbit, horse, as well as venison and bison. As of 1 January 2014, inventories of livestock include an estimated number of 12.2 million heads of cattle and calves, 13 million heads of hogs, and 873,900 heads of sheep.32 In July 2014, there were approximately 81,975 beef farms and ranches. Western Canada accounts for 76% of Canada's cattle inventory with approximately 41% coming from Alberta. Also in July 2014, there were 7,035 hog farms. Ontario and Quebec account for 56% of Canada's hogs with 33% in Quebec. In 2013, the sales of cattle, calves and hogs provided Can$10.9 billion in cash receipts, accounting for nearly 20% of total farm cash receipts.33 They constitute a major source of farmers' income. Shipments from the red meat industry were worth Can$16.3 billion in 2013. Canada is a major exporter of beef and pork, with the United States being the major market for Canada's red meat industry. Exports totaled some Can$4.5 billion in 2013.
4.44. The legislative framework for the meat industry remains the Meat Inspection Act (MIA) of 198534 and its related regulations, and the Food and Drugs Act (food safety). The MIA provides, inter alia, rules governing the international and interprovincial trade in meat products, the registration of meat establishments, and the inspection of animals and meat products. A provincial or federal registration is required for an establishment to operate in one of the following activities: the slaughter of food animals; the processing, packaging and labelling or storage of meat products; the refrigeration or freezing of meat products; and the inspection of imported meat products. Only meat from federally-registered establishments can be traded internationally or between provinces.35 Applications for federal registration are processed by the CFIA. The legislation also requires operators of registered meat establishments to obtain a licence from the CFIA. Licences are issued for a period not exceeding one year.
31 More precisely, 298.5% but not less than Can$4.0/kg for butter, and 245.5% but not less than Can$4.52/kg for cheese.
32 AAFC online information. Viewed at: http://www.agr.gc.ca/eng/industry-markets-and-trade/statistics-and-market-information/by-product-sector/red-meat-and-livestock/red-meat-market-information-canadian-industry/inventory/livestock-population-of-canada/?id=1415860000018.
33 AAFC online information. Viewed at: http://www.agr.gc.ca/eng/industry-markets-and-trade/statistics-and-market-information/by-product-sector/red-meat-and-livestock/red-meat-market-information-canadian-industry/industry-profile/?id=1415860000002 [07.02.2015].
34 Meat Inspection Act (R.S.C., 1985, c. 25 (1st Supp.)), last amended in 2005. 35 Meat from provincially-registered establishments can be shipped only within the province.
WT/TPR/S/314 • Canada
- 122 -
4.45. Operators of registered establishments are required to develop, implement and maintain Hazard Analysis Critical Control Point (HACCP) plans and other control programmes. Meat slaughter and processing facilities are required to process meat products in accordance with standards set out in the legislation. Meat and meat products are to be packaged and labelled according to the provisions of relevant pieces of legislation.36 It is estimated that federally registered establishments account for approximately 95% of animals slaughtered in Canada. Inspection activities in federally-registered meat establishments are performed by the CFIA.
4.46. The MIA also governs the international trade in meat and meat products. An authorization from a CFIA inspector is required prior to the exportation of any meat. Furthermore, the exporter must provide satisfactory evidence that meat products meet the requirements of the destination country. On the import side, the country of origin (and any other country in which the meat was processed) must possess meat inspection systems, and the foreign processing facility must hold a valid approval from the Canadian authorities. As of 11 February 2015, foreign establishments from 33 countries were eligible to export meat products to Canada.37
4.47. Any import shipment of meat products must meet the nationally prescribed standards (including packaging and labelling requirements) before it is allowed to enter Canada. The shipment must be accompanied by a valid Official Meat Inspection Certificate issued by the competent authority of the exporting country. Relevant documents and certificates are to be submitted to the National Import Service Centre (NISC) for review. Through the Import Control and Tracking System, the NISC verifies information such as the eligibility of the country and the establishment, and the validity of the shipping information. The CBSA will not allow the shipment to enter Canada unless the importer provides a proof that the CFIA has reviewed the documents, determined the eligibility of the shipment and taken over its tracking.
4.48. The MFN tariff on animals and animal products ranges from 0 to 391.6% with an average of 47% (Table 3.5). Beef and veal are subject to import controls under the Export and Import Permits Act. Under the legislation, an import permit is required for imports from countries with which Canada does not have a bilateral trade agreement covering these products. The annual quota pool of 76,409 tonnes is essentially reserved for Australia (45.8%) and New Zealand (38.7%). The remaining portion is available on an MFN basis (including to exporters from the reserved pool once country-specific reserves are fully utilized). The quota fill rate for beef and veal was 61.1% in 2012 (compared to 55% in 2008).
4.1.7 Fisheries
4.49. Canada is a major player in the international trade in fish and fishery products. According to FAO statistics38, Canada was the 7th largest exporter and the 16th largest importer of fish and fish products in 2012. Since 2011, fish exports and imports have been increasing gradually to reach respectively Can$4.9 billion and Can$3.4 billion in 2014 (Chart 4.2). The trade balance has remained relatively stable with a surplus hovering around Can$1.4 billion for most of the period. The fisheries industry comprises three main activities: commercial fishing, aquaculture, and fish processing.
36 These include: the Meat Inspection Act; the Food and Drug Regulations; and the Consumer Packaging
and Labelling Regulations. 37 The list of eligible foreign establishments is available online at:
http://inspection.gc.ca/active/scripts/meavia/reglist/forlist.asp?lang=e. 38 FAO (2014).

WT/TPR/S/314 • Canada
- 123 -
Chart 4.2 Trade of fish and fish products, 2011-14
(Can$ billion)
0
1
2
3
4
5
6
2011 2012 2013 2014
Exports Imports Trade balance
Source: Fisheries and Oceans Canada. Viewed at: http://www.dfo-mpo.gc.ca/stats/trade-commerce/can-eng.htm.
4.50. The Fisheries Act39 is the main federal statute governing for the management of fisheries resources in Canada. The legislative framework also includes: the Department of Fisheries and Oceans Act (establishing the powers, duties, and functions of the Minister of Fisheries and Oceans); the Oceans Act (providing for the development and implementation of an oceans management strategy); the Coastal Fisheries Protection Act (regulating access of foreign fishing vessels to Canadian fisheries waters and implementing international fisheries agreements to which Canada is party); and the Species at Risk Act (preventing wildlife species from being extirpated or becoming extinct, providing for the recovery of wildlife species that are extirpated, endangered or threatened as a result of human activity, and managing species of special concern to prevent them from becoming endangered or threatened).
4.51. The Department of Fisheries and Oceans (DFO or Fisheries and Oceans Canada) has the lead role in the management and protection of fisheries resources. DFO monitors fish landings and provides a certification that attests that fish and fish products originate from legal fisheries, thereby addressing concerns related to illegal, unreported and unregulated (IUU) fishing. Fish inspection regulation and labelling requirements are under the jurisdiction of the Canadian Food Inspection Agency. Access to commercial fisheries is restricted to eligible harvesters through a federal licensing regime. An online system is used by DFO to issue commercial and commercial-communal fishing licenses nationally, as well as marine recreational fishing licenses in Eastern Canada (Atlantic Canada and Quebec).40 Aquaculture management is under a shared jurisdiction. DFO works in concert with provincial and territorial authorities, as well as First Nations41, to administer a regulatory framework for aquaculture planning and management. The aquaculture sector is generally regulated by provinces and territories. In British Columbia and in Prince Edward Island, DFO both licenses and manages the aquaculture sector.
4.52. Management decisions regarding fisheries resources are implemented through Integrated Fisheries Management Plans and Conservation Harvesting Plans. They are updated as per the management cycle for each of the major species harvested, and cover measures such as: total allowable catches, licensing, number of traps, seasonal closures, area and/or gear restrictions, etc.
39 Fisheries Act, R.S.C., 1985, c. F-14. Last amended on 25 November 2013. 40 DFO online information. Viewed at: http://www.dfo-mpo.gc.ca/fm-gp/sdc-cps/eng-comm/faq/new-
nouveau-eng.htm. 41 The First Nations are the various aboriginal peoples in Canada who are neither Inuit nor Métis. There
are currently over 630 recognized First Nations governments or bands spread across Canada.

WT/TPR/S/314 • Canada
- 124 -
Through its legislative and regulatory authority, DFO also guides the management of marine resources using tools such as the Precautionary Approach.42
4.53. Under the Fish Inspection Act, imports of fish and fish products (other than for personal consumption or use) are subject to licensing. Importers can apply for either a fish import licence (Basic Licence) or a Quality Management Program Import Licence (QMPI Licence). Licenses are valid for one year, and subject to a fee of Can$500 for the Basic Licence or Can$5,000 for the QMPI Licence. Under the QMPI Licence, importers must develop a plan that describes how they will control and verify that imports meet regulatory requirements. This includes conducting sampling and testing in accordance with the requirements set out by the regulations. Some species of molluscan shellfish (live or raw) are subject to SPS requirements, and may be imported only from specific countries.43 Import prohibitions apply to live freshwater mitten crab and puffer fish.
4.54. IUU fishing is a global problem that does not spare the Canadian industry, as it undermines profitable opportunities for legitimate fishing activities. Over 80% of Canadian fish and seafood products are exported. Activities of foreign vessels fishing in Canadian fisheries waters are regulated by the Coastal Fisheries Protection Act. The legislation also regulates the harvesting of sedentary species on the continental shelf. Amendments have been proposed to the Act in order to provide for the implementation and ratification of the Port State Measures Agreement (PSMA), an international agreement aimed at preventing illegal fish catches from entering international markets through ports.44 Under the terms of the Agreement, foreign vessels are required to provide advance notice and request permission for port entry. Countries may seek to order their fishing vessels to port in order to verify compliance. DFO views the implementation of this Agreement as "cost-effective in preventing, deterring, and eliminating IUU fishing activities around the world".45 The authorities indicated that Canada is working towards ratification of the PSMA. Another major proposed amendment to the Act is the provision for the prohibition of the importation of illegally acquired fish and marine plants, and related activities such as their transportation, sale or distribution. Any contravention to the prohibition constitutes an offence and can be subject to a fine of up to Can$500,000.
4.55. The Freshwater Fish Marketing Corporation (FFMC) is a state-trading entity established under the Freshwater Fish Marketing Act. The legislation provides FFMC with the exclusive right to market and trade fish in interprovincial and export markets, in designated products of the freshwater fisheries supplied from the participating jurisdictions. The objective is to market fish in an orderly manner, increase returns to fishers, and promote markets and export trade in freshwater fish. There are two participating jurisdictions: Manitoba and the Northwest Territories. In 2014, the value of freshwater fish exported by FFMC was Can$57.3 million.46 The FFMC is required by law to operate on a self-sustaining basis. The FFMC uses a payment structure that determines initial and final payments under a pooling system. The final payments are determined by allocating receipts and costs by fish species. FFMC's client base is largely aboriginal.
4.56. DFO also administers a number of programmes and initiatives in the aquaculture industry. Launched in 2008 with a Can$70 million funding, the Sustainable Aquaculture Program aims at enhancing the sustainable development of the aquaculture industry. Under the programme, several regulations and policies were streamlined and resulted in an improved regulatory management. The programme has been renewed over the period 2013-18 with a Can$54 million funding.
4.57. Operated between 2008 and 2013, the Aquaculture Innovation and Market Access Program (AIMAP) aimed at catalyzing private investment in the industry. Under the programme, DFO provided non-repayable short-term funding for projects that had the potential to improve the
42 Under the UN Agreement on Straddling and Highly Migratory Fish Stocks (UNFA), countries are required, inter alia, to err on the side of caution in the management of fish stocks. Canada ratified the agreement on 3 August 1999. UNFA entered into force on 11 December 2001. Guiding principles were published in 2003. For more information, see: Privy Council Office (2003).
43 The list of approved countries is available at: http://www.inspection.gc.ca/food/fish-and-seafood/imports/molluscan-shellfish/eng/1377987441620/1377987693551.
44 FAO Agreement on Port State Measures to Prevent, Deter and Eliminate Illegal, Unreported and Unregulated Fishing, adopted in 2009.
45 DFO online information. Viewed at: http://www.dfo-mpo.gc.ca/fm-gp/sdc-cps/eng-comm/faq/new-nouveau-eng.htm.
46 These are freshwater fish classified under the following HS codes: 0302, 0303, 0304 and 0305.

WT/TPR/S/314 • Canada
- 125 -
competitiveness of the industry. According to the authorities, up to Can$4.5 million were made available annually. Over the five years duration of the programme, DFO contributed an amount of Can$23.2 million to 163 projects with a combined projects cost of Can$113.2 million.
4.58. In November 2010, the Canadian Council of Fisheries and Aquaculture Ministers launched a five-year National Aquaculture Strategic Action Plan Initiative, with a view to enhancing and advancing economically, environmentally and socially sustainable aquaculture development throughout the country. Under the collaborative initiative, specific actions have been identified in three key areas: governance; social license and reporting; and, productivity and competitiveness.
4.59. Tariff protection in the fishery sector is relatively low, with an applied average MFN tariff on fish and fishery products averaging 1.2%. The protection is not homogenous across fish products, as MFN rates range from zero to 11% (Table 3.4).
4.60. In 2013, government financial transfers (GFTs) to the fisheries sector were estimated at Can$718.6 million, returning to levels similar to the ones over the 2005 to 2008 period. GFTs represented 22% of the total 2013 landed value of Canadian fisheries (including production from aquaculture). The provision of infrastructure and unemployment insurance accounted for 51.5% of the total support.
4.2 Mining and Energy
4.61. The mining and energy sectors are important to the Canadian economy, contributing significantly to employment, exports, tax revenue, and GDP (Tables 4.7 and 4.8). With over 10% of the world's proven oil reserves and significant mineral wealth, the sectors are poised to continue to contribute to the Canadian economy in the short and long-term. During the review period, there were significant impacts on trade and the economy mainly due to fluctuations in energy prices. While world energy prices remained relatively low and fluctuating after the financial crisis, U.S. prices have generally remained even lower, particularly impacting Canada and accounting for lower export earnings. This trend has had an important effect as the sectors collectively account for approximately one-half of total Canadian merchandise exports.47
4.2.1 Policy developments
4.62. Federal and provincial governments work collaboratively on energy policy through the Energy and Mines Ministers process. In 2011 at the annual Energy and Mines Ministers' Conference, energy ministers provided guidance to ongoing collaboration among federal, provincial and territorial governments on shared priorities. Specifically, collaborative Canadian efforts on energy have focussed on the areas of energy efficiency, responsible oil and gas development, electricity reliability, and technology innovation. In addition, in August 2014, Canada's Premiers announced their shared vision and principles for a Canadian Energy Strategy which would update the previous 2007 strategy. When finalized48, the Strategy is expected to promote intergovernmental collaboration and transparency, address climate change and social and environmental responsibility, and ensure energy security and stability.
4.63. Since 2009 Canada has a corporate social responsibility (CSR) strategy for the extractive sector. This policy is put in place to encourage all Canadian firms working internationally to respect laws, operate transparently, consult with host governments, and implement CSR best practices. The CSR best practices include OECD Guidelines for Multinational Enterprises, IFC's Performance Standards on Social & Environmental Sustainability, and voluntary principles on security and human rights.49 As of November 2014, the CSR strategy was further enhanced (see Section 2.1.1).
4.64. Many resource development and extractive projects are located in or near Aboriginal communities. Federal, provincial and territorial governments have a legal duty to consult, and where appropriate, accommodate, Aboriginal groups when the Crown identifies conduct that may adversely affect potential or established Aboriginal or Treaty rights. The federal government has undertaken significant efforts in recent years to enhance the consistency and effectiveness of
47 Statistics Canada, Merchandise Exports, CANSIM Table 228-0059. 48 The Canadian Energy Strategy document is expected to be finalised in mid-2015. 49 Natural Resources Canada, Information Bulletin, "Building the Canadian Advantage: A CSR Strategy
for the International Extractive Sector", February 2011.

WT/TPR/S/314 • Canada
- 126 -
consultations, including through the integration of consultations into project reviews and through guidelines for federal officials. Modern treaties may also institute additional legal obligations for the federal, provincial or territorial governments and for industry proponents operating in modern treaty areas, including consultation with Aboriginal treaty groups, economic measures to facilitate Aboriginal participation in the resource industry via training, employment and procurement, and the development of impact benefit agreements.
4.65. In late 2014, the Government enacted the Extractive Sector Transparency Measures Act (ESTMA), which established mandatory reporting standards designed to deter corruption through reporting and transparency measures. The ESTMA requires that certain extractive entities (i.e., engaged in the commercial development of minerals, oil and natural gas), subject to Canadian law, to report annually on specific payments of Can$100,000 or more made to any government in Canada or abroad. The Canadian legislation is broadly aligned with emerging international reporting requirements in the United States and the European Union. It is anticipated that the ESTMA will come into force by mid-2015.
4.66. The National Energy Board (NEB) is the government's independent federal regulatory body for the energy sector, in particular for pipelines, energy development, and trade. In 2013 it regulated over 100 companies involved in the international transmission of electricity and energy products through pipelines and power lines by conducting nearly 300 compliance activities. The NEB is established through the National Energy Board Act. Recent implementation of amendments introduced through the Jobs, Growth, and Long-term Prosperity Act of 2012, make the regulatory reviews for projects more predictable and timely, reduce the regulatory burden and duplication, and strengthen environmental protection. In addition, new regulations enabled the NEB to issue Administrative Monetary Penalties (AMPs) to preventatively address contravention and promote compliance with the Act and regulations. The penalties range from Can$25,000 for individuals to a maximum of Can$100,000 for companies, per day, per infraction. The Jobs, Growth, and Long-term Prosperity Act also introduced changes with respect to pipeline and power lines crossing navigable waterways, requiring the NEB to consider navigation safety before recommendations or decisions are made. In 2011 the NEB created an Action Plan on Safety and Environmental Protection to make improvements to worker safety, integrity of installations, damage prevention, and emergency preparedness and response. In June 2013, the Action Plan was fully implemented. Finally, on 8 December 2013, the Government introduced the Pipeline Safety Act, to further strengthen Canada's pipeline safety regime by building on the principles of incident prevention, preparedness and response, and liability and compensation. The Pipeline Safety Act will enshrine the "polluter pays" principle, require companies operating major crude oil pipelines to have a minimum of Can$1 billion in financial capacity to respond to leaks, spills and ruptures, and ensure that companies remain responsible for their abandoned pipelines. As of February 2015, this Act had not entered into force but remained a key priority.
4.67. The Government is also improving the federal regulatory regime for reviews of major energy and mining projects.50 In 2012, the Government introduced the plan for Responsible Resource Development, a systematic and comprehensive plan to help guide the development of Canada's abundant natural resources. The plan helps facilitate investment by modernising the regulatory system for project reviews. Implementation includes changes to a number of key statutes including a new Canadian Environmental Assessment Act, 2012. The plan was guided by four objectives: (i) make project reviews more predictable and timely (e.g. by setting maximum beginning-to-end timelines for environmental assessments and introducing legally-binding timelines for key regulatory permitting processes); (ii) reducing duplication in the review process (e.g. substitution and equivalency provisions allow provincial environmental assessments that meet the federal requirements to replace federal assessments and limit the factors the National Energy Board can consider in export licence applications); (iii) strengthening environmental protection (e.g. focusing assessments on major projects that have a greater potential for significant adverse environmental effects and introducing administrative monetary penalties to promote compliance and substantial financial penalties for violations); and (iv) enhancing Aboriginal consultations (e.g. by better integrating Aboriginal consultations into the assessment and regulatory processes and establishing consultation protocols or agreements with Aboriginal groups for project reviews). Implementation of these changes is underway and will benefit major projects in the energy and mining sectors.
50 Government of Canada (2012a).

WT/TPR/S/314 • Canada
- 127 -
4.68. As part of the Responsible Resource Development Plan, the Government of Canada introduced legislation to ensure Canada's regulatory system remains competitive, efficient, and effective in the world. These changes included the implementation of the new Canadian Environmental Assessment Act, 2012 and amendments to the Fisheries Act, the Navigation Protection Act, and the Species at Risk Act. The regulatory improvements achieved to date include: environmental reviews focused on major projects; implementation of a project list based on areas of federal jurisdiction; enabling environmental assessment substitution and equivalency measures; establishment of an authority for joint regional studies; and legislated timelines for the environmental assessment regulatory permit processes.
4.2.2 Energy
4.2.2.1 Crude Petroleum
4.69. The crude oil sector is an important contributor to the Canadian economy, accounting for approximately 18%51 of the total value of merchandise exports and the largest share of Canada's total export earnings (Table 4.7). Production and exports climbed steadily during the period, while imports declined slightly (Chart 4.3). Canada exports the majority of its crude oil production, although domestic consumption has been rising slightly during the period. Many of the world's largest oil companies have operations in Canada as it remains open to private investment. While there are several hundred companies with operations, the industry is heavily concentrated with the 10 largest companies accounting for over half of production.52 Most of Canada's reserves are contained in oil sands and not conventional reserves; the share of oil sands production has risen over the period, while that of conventional production has declined slightly, thus oil sands' production now outperforms conventional production. Canada's National Energy Board authorizes the import and export of natural gas, and the export of oil via long-term licences or short term orders.
4.70. Canada's oil and gas activities are governed by the Canada Oil and Gas Operations Act, R.S.C., 1985, c. O-7, most recently amended on 1 April 2014, which applies on federal lands, and by other legislation including provincial legislation. Most of Canada's oil and gas production occurs on provincial lands, i.e. where the exploitation of natural resources is under the jurisdiction of the provinces. The Canada Oil and Gas Operations Act53 applies in respect of the exploration and drilling for and the production, conservation, processing and transportation of oil and gas in (a) that part of the onshore that is under the administration of a federal minister, (b) Nunavut, (c) Sable Island, (d) that part - of the internal waters of Canada or the territorial sea of Canada - that is not situated (i) in a province other than the Northwest Territories, or (ii) in that part of the onshore that is not under the administration of a federal minister, and (e) the continental shelf of Canada and the waters superjacent to the seabed of that continental shelf, other than of oil and gas in the adjoining area, as defined in section 2 of the Yukon Act. Any work or activity related to the exploration or drilling for oil or gas54 requires an operating licence or an authorization. As of late 2014, amendments to this Act were under parliamentary review. These amendments seek primarily to update, strengthen and increase the level of transparency of the liability regime that is applicable to spills and debris in the offshore areas.
4.71. The Canada Petroleum Resources Act R.S.C. 1985, c. 36 (2nd Supp.) regulates interests in petroleum in relation to frontier lands, as defined under that Act, that are not subject to an in-force federal-provincial offshore shared management agreements. Provincial legislation regulates interests in petroleum in relation to provincial lands. Other legislation includes: the Energy Monitoring Act; the Energy Supplies Emergency Act; the Oil Substitution and Conservation Act (R.S.C., 1985, c. O-8); the Northern Pipeline Act (R.S.C., 1985, c. N-26); the Canada-Newfoundland and Labrador Atlantic Accord Implementation Act (S.C. 1987, c. 3) (implements an agreement between the Government of Canada and the Government of Newfoundland and Labrador on offshore petroleum resource management and revenue sharing); the Canada-Nova Scotia Offshore Petroleum Resources Accord Implementation Act (S.C. 1988, c. 28) (implements an agreement between the Government of Canada and the Government of
51 Statistics Canada, Merchandise Exports, CANSIM Table 228-0059. 52 Natural Resources Canada (2014). 53 Natural Resources Canada online information. Viewed at: www.nrcan.gc.ca/acts-regulations/59. 54 Including the production, conservation, processing or transportation of oil or gas.

WT/TPR/S/314 • Canada
- 128 -
Nova Scotia on offshore petroleum resource management and revenue sharing).55 The Canada-Newfoundland and Labrador Atlantic Accord Implementation Act and the Canada-Nova Scotia Offshore Petroleum Resources Accord Implementation Act were amended during the review period in order to increase the level of safety and transparency of offshore petroleum activities. Additional amendments under parliamentary review as of late 2014 seek primarily to update, strengthen and increase the level of transparency of the liability regime that is applicable to spills and debris in the offshore areas.
4.72. The Indian Oil and Gas Act (IOGA)56 and its associated regulations cover oil and gas activity on First Nation reserve lands. The modernized Indian Oil and Gas Act received Royal Assent in May 2009 and will come into force once its regulations have been completed, currently projected to be in 2016.
4.73. The National Energy Board is the body in charge of issuing operating licences. An operating licence expires on the thirty-first day of March immediately after the day on which it is issued and may be renewed for successive periods not exceeding one year each. The Board may determine the specific conditions for issuing the licence. The issuance of an authorization may have attached conditions such as: (a) requirements relating to liability for loss, damage, costs or expenses; (b) requirements for the carrying out of environmental programmes or studies; and (c) requirements for the payment of expenses incurred by the National Energy Board in approving the design, construction and operation of production facilities and production platforms.
Table 4.7 Overview of Canada's Crude Oil Industry, 2013
Criteria Amount Proven reserves 173 billion barrels (3rd in the world) Producer rank 5th largest world producer Number of establishmentsa 4,809 Oil exports as a share of total merchandise exports 18% Exports, export market 74% of production, 97% to the United States
a Includes oil and natural gas establishments.
Source: Viewed at: http://www.nrcan.gc.ca/energy/crude-petroleum/4541, and https://www.ic.gc.ca/ app/scr/sbms/sbb/cis/definition.html?code=211&lang=eng; and Energy Market Fact Book 2014-15.
55 Natural Resources Canada online information. Viewed at: http://www.nrcan.gc.ca/acts-
regulations/59. 56 Minister of Justice (2015).

WT/TPR/S/314 • Canada
- 129 -
Chart 4.3 Oil production and trade, 2010-14
0
10,000
20,000
30,000
40,000
50,000
60,000
70,000
80,000
90,000
100,000
0
50
100
150
200
250
2010 2011 2012 2013 2014
Crude oil production Export volumes Import volumes Export values
Volume (million cubic metres) Value (Can$ million)
Source: Statistics Canada, CANSIM Tables 126-0001 and 228-0059.
4.2.2.2 Natural Gas
4.74. Natural gas is another important sector for Canada, as it is the world's 5th largest producer and 4th largest exporter, accounting for 8% of world exports in 2013; it ranks 19th in terms of world proven reserves (Table 4.8). In 2013, Canada produced 13.7 billion cubic feet of natural gas. During the review period, natural gas production and exports fell slightly, with export values dipping in particular in 2012 as North American prices fell to record lows and recovering in 2013-14 (Chart 4.4). All exported natural gas is destined to one market, the United States. With a view to diversify export markets, industry proponents are pursuing a variety of LNG export proposals that are moving through the established regulatory review process. While Canada is not yet exporting LNG, current proposals have an expected export capacity of 302 million tonnes per year, which is equivalent to 40.8 billion cubic feet of natural gas per year and almost 3 times current natural gas production. Thus, according to the authorities, it is not expected that all these proposals will be approved or developed. The exportation of natural gas and LNG requires authorization from the National Energy Board through either a short term export order or a long term export licence of up to 25 years. When considering long-term natural gas export licences, the National Energy Board assesses whether Canada's supply of natural gas is large enough to easily accommodate domestic needs as well as the proposed LNG exports, while having regard to the trends in the discovery of gas in Canada. Following National Energy Board approval, long-term export licences require Governor in Council approval before they can be issued.
4.75. As with the oil sector, the natural gas sector is governed by the Canada Oil and Gas Operations Act, where this Act applies, and by other legislation including provincial legislation (See section 4.2.2.1). Other legislation covers the transmission of natural gas via pipelines.
Table 4.8 Overview of Canada's Natural Gas Industry, 2013
Criteria Amount Proven reserves 71 Tcf (19th in the world) Producer rank 5th largest world producer Gas exports as a share of total exports 2.2% Exports, export market 57% of production, 100% to the United States
Source: Energy Market Fact Book 2014-15.

WT/TPR/S/314 • Canada
- 130 -
Chart 4.4 Gas production and trade, 2010-14
0
2,000
4,000
6,000
8,000
10,000
12,000
14,000
16,000
0
20
40
60
80
100
120
140
160
2010 2011 2012 2013 2014
Gas production Export volumes Import volumes Export values
Volume (billion cubic metres) Value (Can$)
Source: Statistics Canada, CANSIM Tables 131-0001 and 228-0059.
4.2.2.3 Electricity
4.76. Public ownership of electricity utilities is the norm in Canada, with a single, vertically-integrated crown corporation responsible for electricity generation, transmission and distribution within each province. There are some exceptions: Alberta has an open electricity market while Ontario has a hybrid market.
4.77. A significant change over the review period was Ontario's closure of all coal-fired power plants. In addition, Canada has implemented regulations on greenhouse gas emissions from coal-fired electricity plants that effectively ban construction of new coal-fired generation that does not utilized capture and storage technology. Major hydroelectric projects are being pursued in British Columbia, Manitoba, Quebec and Newfoundland and Labrador. In addition, all provinces have supported, or are supporting, the introduction of non-hydro renewables through various mechanisms. Canada continues to support R&D and demonstration of technologies relevant to the electricity sector. In October 2014, SaskPower commissioned the world's first integrated carbon capture and storage facility at the Boundary Dam coal plant in Saskatchewan.
4.78. Canada's transmission infrastructure is integrated with that of the United States. There are 34 major transmission lines that connect the two countries and support major two-way power flows (Table 4.9). Much of this trade is enabled by Canada's significant hydroelectric resources, which provide flexibility to meet electric demand on both sides of the Canada-U.S. border.
Table 4.9 Overview of Canada's Electricity Industry, 2013
Criteria Amount Electricity generation (2012) 616 TWh Producer rank (2012) 6th largest electricity generation, 3rd largest hydro
generation, 2nd largest exporter of electricity Trade balance 63 TWh exported; 11 TWh imported
0.5% of total merchandise exports Exports, export market 10% of production, 100% to the United States
Source: Energy Market Fact Book 2014-15. Viewed at: www.nrcan.gc.ca/energymarketsfacts/.

WT/TPR/S/314 • Canada
- 131 -
4.2.3 Minerals and Mining
4.2.3.1 Overview
4.79. Canada's economic and trade performance is closely tied to its mineral and metal wealth. It remains the global leader in the production (by volume) of potash, and ranks among the top-five global producers of aluminium, cobalt, diamonds, nickel, platinum group metals, salt, sulphur (elemental), titanium concentrates, tungsten, and uranium.Mining and mineral processing contributes significantly to the Canadian economy in terms of GDP, employment, foreign direct investment, services and related industries, and capital investments. The sector accounts for over 3% of Canadian GDP.
4.80. As a leader in the extraction and trade of minerals, Canada mines over 60 commodities at more than 200 principal producing operations and more than 3,000 stone quarries and gravel pits which are located throughout Canada. The commodities with the highest production values are: gold, potash, copper, iron ore, nickel, coal, and diamonds. Together they accounted for almost 75% of total mining production in 2014 (Chart 4.5).
Chart 4.5 Canada's mineral production by value, 2014
Coal8.7%
Nickel9.1%
Potash13.1%
Others27.3%
Iron ore9.8%
Gold15.3%
Copper11.7%
Diamonds5.0%
Note: Total mineral production in 2014 was Can$44,746 million.
Source: WTO Secretariat, based on Natural Resources Canada (NRCAN), Government of Canada. Viewed at: http://sead.nrcan.gc.ca/prod-prod/2014p-eng.aspx.
4.2.3.2 Trade
4.81. Canadian trade in mineral products, which includes ores, concentrates, and semi- and final-fabricated mineral products, accounted for 20% of the country's domestic export value and imports accounted for 15%. During the review period, both imports and domestic exports initially declined slightly, especially in respect to exports to the European Union, then increased in 2014. This decline was mainly attributable to reduced exports of gold destined to the United Kingdom. Overall, gold exports actually increased significantly by 22%, despite declining prices; the volume was redistributed to countries outside the EU, in particular to Hong Kong, China; the United States; and Switzerland. The overall decline in exports during 2011-13 was mainly attributable to lower volumes and prices for iron and steel, coal, and nickel. The United States is Canada's primary trading partner, accounting for about half of imports and domestic exports. The European Union; China; Japan; Hong Kong, China; Mexico; and Peru are also significant trading partners (Table 4.10).
4.82. Canada participates in the Kimberley Process Certification Scheme (KPCS) for trade in rough diamonds through its Export and Import of Rough Diamonds Act and associated regulations. Thus, certificates must accompany imports and exports of rough diamonds, and shipments must be sealed to ensure that the requirements are met under the KPCS. Canadian exporters must

WT/TPR/S/314 • Canada
- 132 -
approach Natural Resources Canada for an application and submit the necessary paperwork and present the certificate to the Canada Border Services Agency to be stamped upon exportation. Importers must present a valid KPCS certificate to Canadian customs at the point of entry.
Table 4.10 Trade of minerals and mineral products, by selected countries, 2011-14
(Can$1,000) 2011 2012 2013 2014 Exports United States 45,879,903 42,345,335 43,614,629 46,738,275 European Union 22,968,346 21,665,866 16,578,546 17,703,502 China 6,016,219 6,252,404 6,380,278 5,069,148 Japan 4,107,494 3,642,964 3,857,437 3,456,792 Hong Kong, China 1,339,286 930,478 3,105,585 2,703,177 Other countries 15,490,802 12,912,090 13,302,474 13,380,445 Total 95,802,050 87,749,137 86,838,949 89,051,338 Imports United States 38,716,786 37,966,687 37,073,678 39,666,008 China 6,546,181 6,873,624 6,746,955 8,001,248 European Union 7,264,986 6,169,951 5,997,022 7,492,697 Mexico 3,408,173 3,718,490 3,544,491 3,700,581 Peru 3,765,690 3,345,478 2,758,425 2,591,670 Other countries 16,987,714 17,028,923 16,866,199 17,533,067 Total 76,689,530 75,103,153 72,986,770 78,985,271
Note: As of 2014, Natural Resources Canada no longer includes nitrogen with the minerals and metals trade statistics. Historical data have been revised to reflect this change.
Source: Statistics Canada, Natural Resources Canada (TRAGS). Viewed at: http://sead.nrcan.gc.ca/trad-comm/1xml-eng.aspx; and information provided by Canadian authorities.
4.2.3.3 Policy
4.83. Mining in Canada is almost exclusively under government control as mining rights are separate from surface land rights. Thus, there is separate mining rights' legislation for each of the provinces and territories that allow for the lease of mining rights under government control. Depending on the province/territory, companies may require a licence before engaging in exploration while others require a licence to acquire mineral rights. Furthermore, through the various provincial laws and regulations, there are certain downstream restrictions or disincentives limiting the processing of minerals to within the province or the country.57
4.84. The federal government of Canada has limited involvement in the mining sector, generally limited to Crown corporations and mining on federal lands. However, certain trade-related laws or acts are under the federal government, such as the 2002 Export and Import of Rough Diamonds Act (see Section 4.2.3.2), as well as legislation on investment and environmental protection. In Canada, it is the provincial governments that are most concerned and responsible for the exploration, development, extraction, direct taxation, and reclamation of mines.
4.85. The Minerals and Metals Policy from 1996 continues to guide the policies in the sector. The main points of the strategy focus on sustainable development, international competitiveness, and science and technology aspects. Furthermore, it promotes regulatory efficiency and sound financial and taxation policies for the sector. The Responsible Resource Development Plan also influences the sector in terms of strengthening environmental protection and improving consultation with Aboriginal peoples. The Plan provides greater certainty for investors, while strengthening Canada's world-class environmental standards.
4.86. Canada has unique taxes, tax credits, or incentives specific to the mining sector. Canada has undertaken studies to compare its taxation policies with those of other major mining countries and has undertaken efforts to ensure its competitiveness is not undermined by taxation policies. While subject to federal and provincial income taxes, mining operations are also subject to
57 Fulbright (2013).

WT/TPR/S/314 • Canada
- 133 -
provincial/territorial mining taxes, but many of these taxes are mitigated by a number of tax credits or deductions. To enhance the neutrality of the tax system, since 2007, the Government of Canada started to phase out the mining specific tax provisions. For example, as contained in the Budget 2007, the Accelerated Capital Cost Allowance (ACCA) for oil sands projects is being phased out by the end of 2014. The Budget 2013 further proposed to (1) phase out the additional Accelerated Capital Cost Allowance (ACCA) available for mining over the 2017-20 period; and (2) reclassify pre-production mine development expenses from Canadian Exploration Expense (CEE) to Canadian Development Expense (CDE).58 Other credits that may apply include investment tax credits. The provinces and territories have different policies and rates on taxation of mining activities, but generally they range from 25-30% in the case of the combined corporate income tax rate, and 10-20% for the mining royalty rate, essentially based on profits.59
4.87. As part of its Responsible Resource Development Initiative, the Government of Canada has a legal duty to consult with Aboriginal peoples when Aboriginal or Treaty rights may be affected by a proposed resource development project. The common law duty to consult is based on the judicial interpretation of the obligations of the Crown (federal, provincial and territorial governments) in relation to potential or established Aboriginal or Treaty rights of the Aboriginal peoples of Canada, recognized and affirmed in section 35 of the Constitution Act, 1982. The duty cannot be delegated to third parties.60
4.88. In implementing the Responsible Resource Development Initiative, the amended Canadian Environmental Assessment Act of 2012 (CEAA 2012) enhanced Aboriginal consultations by better integrating Aboriginal consultations into the assessment and regulatory processes. The Canadian Environmental Assessment Agency serves as the Crown consultation coordinator for many major resource projects. CEAA 2012 also gave the Canadian Nuclear Safety Commission (CNSC) the exclusive responsibility for conducting environmental assessments for projects it regulates under the Nuclear Safety and Control Act, such as uranium mines and mills. The CNSC is the Crown consultation coordinator for projects it regulates.
4.89. For major resource projects North of 60th parallel, the Northern Projects Management Office (NPMO) within the Canadian Northern Economic Development Agency is responsible for coordinating consultation with Aboriginal people and maintaining the official Crown consultation record.61 For projects which are subject to public review processes under the National Energy Board Act, the Crown has stated that it will rely on the National Energy Board process to the extent possible to meet any duty it may have to consult with Aboriginal groups.62
4.2.3.4 Sub-sectors
4.90. Canada is the world's leading potash producer and exporter, possessing the world's largest reserves.63 During the period 2010-13, potash production, both in terms of quantity and value has fluctuated, achieving in 2011 the largest output both in volume and value terms (10,686 kilotonnes and Can$7.57 billion).64 Canada currently has 10 potash mining operations, 7 of which involve two Canadian-based firms, and 3 operated by an American-based firm. The three producers together export their products to offshore markets through Canpotex Limited, an exclusive marketing and distribution company only handling all Saskatchewan potash exports to overseas markets. In 2013, a number of antitrust lawsuits involving the company were settled in
58 Natural Resources Canada online information. Viewed at: http://www.nrcan.gc.ca/mining-
materials/taxation/mining-taxation-regime/8892. 59 Natural Resources Canada online information. Viewed at: http://www.nrcan.gc.ca/mining-
materials/markets/8358. 60 Aboriginal Affairs and Northern Development Canada online information. Viewed at:
http://www.aadnc-aandc.gc.ca/DAM/DAM-INTER-HQ/STAGING/texte-text/intgui_1100100014665_eng.pdf. 61 Canadian Northern Economic Development Agency online information. Viewed at:
http://www.cannor.gc.ca/eng/1386601644799/1386601662287. 62 National Energy Board online information. Viewed at: https://www.neb-
one.gc.ca/prtcptn/nfrmtn/brgnlppl-eng.html. 63 Natural Resources Canada online information. Viewed at: http://www.nrcan.gc.ca/mining-
materials/markets/commodity-reviews/2012/15358. 64 Natural Resources Canada online information. Viewed at: http://sead.nrcan.gc.ca/prod-prod/2011-
eng.aspx.

WT/TPR/S/314 • Canada
- 134 -
the United States after consumers filed suit.65 Approximately 95% of Canadian potash production is exported. Major markets for Canadian potash exports in 2013 were the United States, Brazil, Indonesia, and China.66
4.91. Uranium mining is another important sub-sector in mining for Canada, as it is the world's second largest producer, accounting for 16% of world production and 16% of world exports in 2013. Canada exports around 85% of its production, with Asia, North America, and Europe as the largest markets. While the regulation of mining is usually predominantly under provincial jurisdiction, the regulation of uranium mining is mainly a federal responsibility. At the federal level, uranium mining, refining, processing, fuel fabrication, and nuclear reactor operation is regulated by the Canadian Nuclear Safety Commission (CNSC).
4.92. The Government has undertaken a number of initiatives to improve the federal regime for reviews of major energy and mining projects. Canada's 2010 federal budget, the Jobs and Economic Growth Act (JEGA), gave the CNSC the authority to establish a Participant Funding Program (PFP) to give Aboriginal groups and stakeholders the opportunity to fully participate in its regulatory processes and, in 2012 the Government introduced the plan for Responsible Resource Development which helps to facilitate investment by modernizing the regulatory system for project reviews. Implementation included changes to a number of key statutes including the Canadian Environmental Assessment Act, 2012 (CEAA 2012), which gave the CNSC the exclusive responsibility for conducting environmental assessments for projects it regulates, such as uranium mines and mills, that are listed on the Regulations Designating Physical Activities.
4.93. The plan for Responsible Resource Development also supported better integration of Aboriginal consultations into the assessment and regulatory processes and allowing the CNSC to play a Crown Consultation Coordinator role for projects they regulate. In 2012, the CNSC amended its Uranium Mines and Mills Regulations under the Nuclear Safety and Control Act, to establish 24-month timelines, that are consistent with timelines established under CEAA 2012, for projects that require its environmental assessment and regulatory review and decision on new applications for a combined license to prepare a site and construct a uranium mine or mill. However, not every environmental assessment of a uranium mine in Canada is subject to CEAA 2012. For example, Areva's Kiggavik project falls under the jurisdiction of the Nunavut Land Claims Agreement, and is therefore subject to the Nunavut Impact Review Board's environmental assessment process rather than CEAA 2012. The CNSC provides technical advice to the Nunavut Impact Review Board and participates in its process. In 2013, the CNSC and Fisheries and Oceans Canada signed a Memorandum of Understanding to coordinate the administration of the fisheries protection provisions of the Fisheries Act and to assure a streamlined one window regulatory approach for projects regulated by the CNSC.
4.3 Services
4.3.1 Financial services
4.3.1.1 Overview
4.94. The federally regulated Canadian financial system is composed of 81 banking institutions, of which 28 are domestic banks, 24 foreign banks, 26 full service foreign bank branches, and three foreign bank lending branches. There are also 44 trust companies, 19 loan companies, 6 cooperative credit associations, one cooperative retail association, 74 life insurance companies, 14 fraternal benefit societies and 164 property and casualty insurance companies. A total of 23 foreign banks have representative offices in Canada (Table 4.11).67
65 Business News Network online information. Viewed at: http://www.bnn.ca/News/2013/1/30/Three-
Canadian-potash-exporters-settle-price-fixing-lawsuit.aspx. 66 Industry Canada online information. Viewed at:
https://www.ic.gc.ca/app/scr/tdst/tdo/crtr.html?naArea=9999&toFromCountry=CDN&grouped=GROUPED&runReport=true&countryList=TOP¤cy=CDN&productType=NAICS&searchType=BL&hSelectedCodes=212396&reportType=TE&timePeriod=5|Complete+Years.
67 OSFI online information. Viewed at: http://www.osfi-bsif.gc.ca/Eng/wt-ow/Pages/wwr-er.aspx?sc=1&gc=1#WWRLink11.

WT/TPR/S/314 • Canada
- 135 -
Table 4.11 Financial institutions operating in Canada, 2010 and 2014
2010 As of 31 October 2014 (unless otherwise indicated)
Number Assetsa, b Can$ billion
Number Assetsa, b Can$ billion
Federally regulated Banks 77 81 - Domestic 22 2,886.3 28 4,005.9 - Foreign subsidiaries 25 152.4 24 127.2 - Foreign branches 30 82.4 29 78.5 Trust and loan companiese 66 63 - Bank-owned 30 238.4 33 323.2 - Other 36 24.4 25 32.6 Cooperative credit associationsc 6 19.6 6 21.0 g Cooperative retail associationsd 1 4.2 1 6.9 Life insurance companiesf,g 84 74 - Canadian-incorporated 41 487.7 40 529.6 - Foreign branches 39 15.1 27 20.9 Fraternal benefit societiesf,g 17 14 - Canadian-incorporated 9 6.5 8 2.1 - Foreign branches 7 1.9 5 3.1 Property and casualty insurance companies
187 164
- Canadian-incorporated 95 82.3 88 109.0 - Foreign branches 92 29.9 76 40.7 Pension plans 1,398 122.6 1,234 171.0 Provincially regulated Cooperative credit institutions 887 297.9 887 297.9 Life insurance companiesf,g 23 64.8 19 88 Fraternal benefit societiesf,g n.a. n.a n.a. n.a. Property & casualty insurance companies
43 12.9 44 15.3
Note: The data presented in this table is for information purposes only and is not comparable across type of institution due to different reporting dates and different data sources.
n.a. Not applicable.
a Total assets of the relevant subsectors are not the simple sum of the figures. The figures for entities that report on a consolidated basis include subsidiaries whose assets may also be included in a different category.
b As of 31 January or 31 March (depending on fiscal year-end) where available, otherwise 31 December.
c Covers only associations that serve as central finance facilities for cooperative credit institutions (credit unions and caisses populaires).
d Since 2001, federally incorporated retail associations may offer services directly to the public; they must be composed of at least 2 provincial cooperative associations or at least 10 cooperatives from more than one province.
e Data is on a consolidated balance sheet basis. There may be some double counting in assets due to the fact that a trust company may fall under a loan company, or vice versa.
f "Assets" are reported under IFRS (with 2010 assets restated) and include those held on behalf of Canadian policyholders and annuitants for both general and segregated fund business. For Canadian incorporated organizations, assets held for business conducted outside Canada through foreign branch and subsidiary operations are excluded. Data reported as of 31 December 2013.
g Numbers includes only companies that are actively issuing new business; companies that are limited to administration of existing policies only are not included.
Source: WTO Secretariat, based on data provided by OSFI, the Insurance Bureau of Canada, the Canadian Life and Health Insurance Association, and some federally regulated financial institutions (FRFI) annual reports.
4.95. The banking industry remains relatively concentrated with the six largest banks accounting for approximately 90% of total assets among Canada's federally regulated deposit-taking institutions (DTIs). These large banks carry diversified business lines both domestically and internationally, and are active in a number of foreign countries. The remaining 10% of Canadian

WT/TPR/S/314 • Canada
- 136 -
banking assets are held by smaller institutions with niche markets and business strategies, such as mortgage lending, commercial real estate, or credit cards. Average return on equity for the banking sector was 16.2% in 2013, compared to 17.2% in 2012.68
4.96. Canada's GATS market access and national treatment commitments on financial services have not changed since its last Review. Canada's WTO Schedules on Specific Commitments for the sector are undertaken in accordance with the Understanding on Commitments in Financial Services, thus it contains partial commitments for the sector.
4.3.1.2 Regulatory framework
4.97. The regulation and supervision of financial services is carried out under a system of shared responsibility between the federal and provincial governments. At the institutional level, the Department of Finance, under the Minister of Finance, is responsible for the overall stability of the financial system (Table 4.12). The Office of the Superintendent of Financial Institutions (OSFI) is in charge of the prudential oversight of all federally incorporated banks, insurance companies, trust and loan companies, cooperative credit associations, fraternal benefit societies, and certain pension plans, as well as branches of foreign banks and insurance companies. OSFI is an independent, self-financed agency that reports to Parliament through the Minister of Finance. Regulation by OSFI involves mainly providing input into developing and interpreting legislation and regulations, issuing guidelines, and approving requests from federally regulated financial institutions, as required under financial institution legislation. OSFI monitors the financial and economic environment to identify issues that may adversely affect federally regulated financial institutions (FRFIs), and is also in charge of risk assessment and supervision of corporate governance practices.69
Table 4.12 Main regulatory bodies of the banking sector
Institution Mandate Legislation Department of Finance Legislative and regulatory framework for
banking and other financial services Financial Administration Act
Office of the Superintendent of Financial Institutions (OSFI)
Prudential supervisor for banks, federal insurance companies, and federally administered pension plans
Office of the Superintendent of Financial Institutions Act
Canada Deposit Insurance Corporation (CDIC)
Protects depositors and promotes the stability of the financial system. Resolution authority for Canadian banks
Canada Deposit Insurance Corporation Act
Bank of Canada Responsible for monetary policy, financial system stability, and funds management.
Bank of Canada Act
Financial Consumer Agency of Canada (FCAC)
Consumer protection Financial Consumer Agency of Canada Act (2001)
Source: Information provided by the authorities.
4.98. The Bank of Canada assesses financial stability risk and oversees systemic payment, clearing and settlement systems. The Canada Deposit Insurance Corporation (CDIC) provides deposit insurance, while the Financial Consumer Agency of Canada (FCAC) deals with consumer protection issues. All of these institutions participate in the Financial Institutions Supervisory Committee (FISC), a forum that meets regularly to share information on matters relating to the supervision of FRFIs.
4.99. Banks must be incorporated under federal legislation in order to operate. Foreign banks can establish and operate through a subsidiary or a branch (full-service branch or a lending branch). They are under federal regulation. Cooperative credit institutions, mutual funds and securities firms, including those owned by banks, are regulated largely at the provincial level for prudential soundness and market conduct. Insurance or trust and loan companies can generally be incorporated either federally or provincially and can change jurisdictions after incorporation.70 However, foreign insurers operating in Canada must be federally regulated.
68 OSFI (2014). 69 OSFI online information. Viewed at: http://www.osfi-bsif.gc.ca/Eng/osfi-bsif/Pages/default.aspx. 70 A company may incorporate federally if it is planning to operate in multiple provinces, or if the
province it plans to operate in does not provide for provincial incorporation.

WT/TPR/S/314 • Canada
- 137 -
4.100. Foreign insurers wishing to establish a branch in Canada must apply federally to obtain an order to insure against risks. However, provincial legislation, which typically covers requirements such as licensing, coverage, rates, and marketing practices, applies regardless of a company's jurisdiction of incorporation. The federal financial institutions statutes provide for provincially incorporated insurance or trust and loan companies to continue federally with the approval of the Minister of Finance. For a federally incorporated company to continue operate in the provinces, permission from the Minister of Finance must first be obtained, followed by approval from the province.
4.101. Incorporation requirements in terms of minimum capital are the same for domestic banks and foreign bank subsidiaries (Table 4.13). Foreign branches are subject to an initial capital equivalency deposit amounting to Can$100,000 for lending branches, and Can$5 million (or 5% of Canadian liabilities) in the case of full-service branches. The effective level of capital required depends on other parameters, including the proposed business plan and stress-testing analysis.
4.102. For insurers, there is a required minimum of Can$5 million in capital (in the case of incorporation) or vested assets (in the case of the establishment of a branch). Like in the case of banks, the effective level of capital or vested assets will depend on factors such as the proposed business plan, stress-testing analysis on the proposed classes of insurance, and projected reinsurance arrangements. There are also Canadian residency requirements for directors and certain officers of these institutions.
Table 4.13 Requirements upon incorporation or establishment of a branch or representative office
Minimum capital (in Can$) Canadian residencea
Banks Domestic 5 million A majority of directorsb Foreign subsidiaries 5 million At least half of directors Foreign branches
- Full service Capital equivalency deposit: the greater of 5 million or 5% of Canadian liabilities
Principal officer
- Lending Capital equivalency deposit: 100,000 Principal officer Foreign representative office None Chief Representative officer Insurance companies Canadian-incorporated 5 million A majority of directorsb Foreign branches 5 million Chief Agent
a The CEO of every bank or federal insurance company in Canada must be ordinarily resident in Canada.
b Until 2007, the requirement was formulated as "at least two-thirds" of the directors. Banks and federally regulated insurance companies must have at least seven directors.
Source: Department of Finance Canada.
4.103. OSFI participates actively in the development of international rules in the financial sector. It is an active member of the Basel Committee on Banking Supervision (BCBS), and together with the Department of Finance and the Bank of Canada, represents Canada at the Financial Stability Board (FSB). OSFI has concluded information sharing agreements with a number of regulatory authorities in regions where Canadian banks and insurers have significant operations (Table A4.2).
4.3.1.3 Banking services
4.3.1.3.1 Commercial banks
4.104. Canada's banks are federally regulated and chartered pursuant to the Bank Act. However, some subsidiary activities (including trustee services and many securities market activities) are provincially regulated.

WT/TPR/S/314 • Canada
- 138 -
4.105. In general, the ownership framework of federal financial institutions is size-based and set out in relevant pieces of legislation.71 Ownership rules are tailored to reflect the level of risk the institution could potentially pose to the financial system. Banks are categorized as small, medium or large depending on their equity capital. Banks with equity of less than Can$2 billion are classified as small. An investor may own 100% of any class of the shares of such a bank. Banks with equity between Can$2 billion and Can$12 billion are defined as medium banks, and as such, 35% of their voting shares must be listed on a stock exchange in Canada. The Minister of Finance may grant an exemption from this requirement.72 Any transaction leading to a single investor acquiring more than 10% of any class of voting shares would require the approval of the Minister of Finance, and would be subject to a "fit and proper" test on the applicant.73 Large banks, that is those with equity of Can$12 billion or more, must be widely held: no single investor may own more than 20% of any class of voting shares or 30% of non-voting shares. There are currently eight large banks in Canada.74 Trust and loan companies are subject to the same requirements, although there is no "large" categorization for them (equity of over Can$12 billion); only small and medium categorizations apply to them.
4.106. According to the authorities, the widely-held rule helps prevent inappropriate self-dealing, including the potential distortion of credit allocation by a commercial owner, and imposes a high degree of transparency and market oversight. In general, a change in ownership that represents a significant portion of the shares of a bank (or more generally a FRFI) requires the approval of the Minister of Finance.
4.107. Foreign financial services providers must establish a commercial presence to carry on business in Canada. Besides acquiring a domestic bank, the range of available options for commercial presence includes establishing subsidiaries, full-service or lending branches, and representative offices. Lending branches may lend in Canada, but are not permitted to take any deposit; full-service branches may accept deposits of Can$150,000 or more, but such deposits are not eligible for the CDIC's insurance scheme. Banks and other federally chartered deposit-taking institutions are forbidden from offering financial services such as auto-lease financing, securities brokerage or insurance services (except for certain securities activities and the authorised credit insurance products to the banks' own clients that are permitted under the Bank Act). While banks cannot offer these services directly, they can however establish their own insurance subsidiaries.
4.108. The Capital Adequacy Requirements (CAR) Guidelines is OSFI's framework for the implementation of Basel capital standards. The Guidelines were revised in 2012 to implement the Basel III framework. In 2014, as part of its Regulatory Consistency Assessment Programme, the Basel Committee on Banking Supervision conducted an assessment of Canada's implementation of the Basel capital framework. This assessment found Canadian prudential regulations to be compliant overall with the standards prescribed under the Basel global standards. During the period under review, OSFI fully implemented the Basel III capital rules on an accelerated (or "all in") basis, with no transitioning period for banks to meet the revised capital adequacy ratios or phase-in the required regulatory adjustments and deductions. Canadian banks remain above the supervisory target capital ratios, including the Common Equity Tier 1 ratio (CET1) of 7%. In 2014, OSFI also implemented the Basel III leverage ratio –years ahead of international timelines. In 2013, OSFI and the Bank of Canada conducted a stress-testing exercise, in the context of IMF's Financial Sector Assessment Program. This assessment found that Canada has a high level of compliance with the Basel committee's core principles for effective supervision.
4.109. Following the Basel Committee's guidelines, OSFI designated, in 2013, the following six banks as being domestic systemically important (D-SIBs): Bank of Montreal, Bank of Nova Scotia, Canadian Imperial Bank of Commerce, National Bank of Canada, Royal Bank of Canada,
71 Bank Act, Insurance Companies Act and Trust and Loan Companies Act. 72 Exemptions are granted for institutions for various reasons including (but not limited to) meeting the
35% public float requirement at another corporate level and when the financial institution is only growing organically or through small acquisitions.
73 A "fit and proper person" is one that is deemed to have the character, integrity, and sound business plans, and resources to own and operate a financial institution. This can be a natural person, a financial institution (regulated or unregulated) or a commercial entity.
74 Three banks with equity of less than Can$12 billion are currently classified as large: National Bank, Laurentian Bank and Canadian Western Bank. However, the Minister of Finance has the discretion to revoke this treatment and re-categorize these banks.

WT/TPR/S/314 • Canada
- 139 -
and Toronto-Dominion Bank. In line with the Basel Committee's D-SIB framework75, these banks are subject to greater prudential regulation. For instance, they are subject to a surcharge of 1% of risk-weighted capital by January 2016, on top of the 7% required from non-systemic institutions. At the end of 2014, D-SIBs had CET1s ranging from 9.2% to 10.8%.76 Moreover, D-SIBs are also subject to more intensive supervision than other financial institutions; OSFI requires them to meet enhanced disclosure requirements, and to have in place advanced practices in terms of the design and operation of oversight functions and internal controls.77
4.110. At the provincial level, Desjardins Group and Central 1 Credit Union were designated respectively by the Autorité des marchés financiers of Quebec and the Financial Institutions Commission of British Columbia, as domestic systemically important financial institutions (D-SIFI). As such, Desjardins will be subject to a 1% capital surcharge effective in 2016.78 Central 1 Credit Union is required to have a stronger liquidity buffer, leverage limits, and is subjected to an increased regulatory reporting.79
4.111. OSFI also conducts overall assessments of the safety and soundness of FRFIs through the use of the Composite Risk Rating (CRR) detailed in its Supervisory Framework. There are four possible risk ratings: low, moderate, above average, and high. The CRR is reported to most institutions at least once a year. Institutions are prohibited from publicly disclosing their rating. This prohibition also applies to OSFI itself. As of March 2014, OSFI had assigned CRR ratings of low or moderate to 91% of all CRR-rated institutions, and above average or high to 9% (compared to 89% and 11%, respectively, as of March 2013). Beginning in 2013-14, only the branch's risk is assessed for branches of foreign banks, rather than risk of the overall foreign bank. To this end, a Branch Risk Rating (BRR) is assigned to the foreign branch operating in Canada, reflecting OSFI's limited access to the information needed to assess the bank's overall safety and soundness.80
4.112. Transactions, including mergers and acquisitions, involving federally regulated financial institutions are administered by OSFI. OSFI assesses each application against the requirements set out in the relevant financial institution statute and makes a recommendation to the Minister of Finance.
4.113. One distinct element of Canada's federal financial legislative framework is that the main statutes governing FRFIs81 contains a "sunset clause" that provides for them to lapse after five years, thereby ensuring that they are reviewed and updated regularly. The most recent review was completed with the Financial System Review Act receiving Royal Assent in March 2012. The review provided, inter alia, for some amendments aimed at reinforcing stability and fine-tuning the consumer protection framework.
4.3.1.3.2 Cooperative financial institutions
4.114. Cooperative credit institutions (credit unions and caisses populaires) represent an important tier in the Canadian financial system. Cooperative credit institutions are affiliated through credit union centrals, which provide liquidity, payment and trade services to their corporate members (predominantly individual credit unions and caisses populaires). Centrals do not take deposits from the public. At the federal level, the Credit Union Central of Canada (CUCC) functions as the national trade association of the system (with the exclusion of Quebec, some credit unions in Ontario, and some caisses populaires in Manitoba, New Brunswick and Ontario). Credit Union Central of Canada currently has six members: three provincial credit union Centrals (Credit Union Central Alberta Limited, Credit Union Central of Manitoba, and SaskCentral), two regional credit union Centrals (Atlantic Central, which represents credit unions in New Brunswick, Newfoundland and Labrador, Nova Scotia and Prince Edward Island; and Central 1 Credit Union, which represents credit unions in British Columbia and Ontario), and one federation of caisses populaires (L'Alliance des caisses populaires de l'Ontario limitée).
75 BCBS (2012). 76 Information provided by Department of Finance Canada. 77 OSFI (2014). 78 Autorité des Marchés Financiers (2013). 79 Financial Institutions Commission (2014). 80 OSFI (2014). 81 The main Acts are: the Bank Act, the Cooperative Credit Associations Act, the Trust and Loan
Companies Act, and the Insurance Companies Act.

WT/TPR/S/314 • Canada
- 140 -
4.115. Cooperative credit institutions are under the jurisdiction of the province or territory in which they operate. Centrals (except the CUCC) are incorporated and regulated at the provincial level. Some centrals82 have chosen to register federally under the Cooperative Credit Associations Act, and voluntarily subject themselves to OSFI's oversight. The oversight function is limited to each central's ability to meet provincially defined liquidity requirements. In 2014, the federal government announced a number of measures aimed at strengthening the credit union framework and clarifying its mandate with regards to credit union centrals.83 In particular, OSFI will cease its supervision of provincial credit union centrals once the amendments to relevant provisions in the legislation are made.
4.116. In 2012, the Bank Act was amended to provide for a legal framework for credit unions to be incorporated and regulated at the federal level, thereby allowing them to operate seamlessly across provincial borders. Under the framework, federal credit unions are subject to the same prudential, capital, and liquidity standards as banks. They are under the oversight of OSFI and are eligible for CDIC's deposit insurance. According to the authorities, a number of credit unions have expressed interest in moving from provincial regulation to federal standards. However, they are facing challenges stemming from differences in deposit insurance coverage, and insurance networking rules (as credit unions in some provinces share premises with insurance affiliates). In January 2014, the federal government announced its intention to develop temporary transitional measures for eligible provincial credit unions that have provincial acceptance to move to the federal framework.84 The measures include extended deposit insurance and a short-term funding facility, as well as an extended transition period to comply with federal insurance networking rules.
4.3.1.4 Insurance services
4.117. At the end of 2014, there were 74 federally-regulated life insurance companies (of which 33 were branches of foreign companies), and 164 companies engaged in property and casualty insurance (of which 76 were branches of foreign companies). Including provincially-regulated companies, the life insurance segment of the industry had assets valued at Can$1,287.8 billion at the end of 2013, representing 68.4% of the country's GDP.85 The life insurance sector is highly consolidated and dominated by a few large groups: Manulife, Sun Life and Great-West Life together account for about 75% of net premium. The property and casualty industry has assets accounting for 3.2% of the financial sector's total assets.86 It is relatively less concentrated, with the top five insurers accounting for about 42% of the written premiums in 2013. Automobile insurance remains the major line of business in this segment of the industry, accounting for nearly half of net written premiums (excluding the provinces of British Columbia, Manitoba, Quebec and Saskatchewan where such business is provided by government-owned entities).
4.118. Like in the banking sector, insurance companies are categorized according to their equity capital. Companies with equity of less than Can$2 billion are categorized as small. An investor may own 100% of any class of shares of a small insurance company. Insurance companies with equity capital of Can$2 billion or more (medium) are required to have 35% of their voting shares widely held and listed on a recognized stock exchange in Canada. There are currently two large demutualized insurance companies that are required to be widely held.
4.119. The regulation of the insurance market is shared between federal, provincial and territorial authorities. Federal insurers/reinsurers must be licensed both federally and provincially in each province within which they wish to carry on business. Most of the largest Canadian insurers are federally incorporated under the Insurance Companies Act, and are regulated by OSFI. The safety and soundness of licensed Canadian branches of foreign insurers is also regulated by OSFI. A number of smaller insurers are incorporated under provincial law and regulated by provincial regulators. Provincial regulators also have the mandate to regulate market conduct, and the licensing and supervision of insurance intermediaries. The regulatory laws of provinces are
82 These are: Atlantic Central, Central 1 Credit Union, Credit Union central of Alberta Limited, Credit
Union central of Manitoba Limited, and Credit Union Central of Saskatchewan. 83 House of Common (2014a). 84 Department of Finance Canada, Letter to the Credit Union Central of Canada, January 2014. Viewed
at: http://www.fin.gc.ca/n14/data/14-010_1-eng.asp. 85 Based on data provided by the authorities. 86 Information provided by the Insurance Bureau of Canada.

WT/TPR/S/314 • Canada
- 141 -
relatively uniform and are based on common law principles, with the exception of Quebec where such laws are based on a civil code system.
4.120. During the review period, OSFI has introduced a reform to its capital adequacy requirements, issued some guidelines regarding corporate governance, and revised its Minimum Capital Test for FRFIs.
4.121. In 2012, OSFI issued the Life Insurance Regulatory Framework, announcing a reform of capital adequacy requirements. The reform provides, inter alia, for the incorporation of new risks into the framework, the accommodation of smaller as well as large companies, and the linking of risk measures to the quality of the capital available to absorb losses. OSFI has been testing refinements to the new framework through six rounds of quantitative impact studies. The last impact study is anticipated for late 2015, followed by parallel runs of the current and the new capital framework in 2016 and 2017. The new capital framework is expected to come into force in 2018.
4.122. OSFI's Corporate Governance Guideline was issued in 2013. It aims at strengthening the risk governance of some FRFIs. The Guideline does not apply to branch operations of foreign insurance companies. FRFIs were required to develop a "risk appetite framework" in order to guide their risk taking activities. They were also required to have fully implemented the Guideline by 31 January 2014.87
4.123. The Insurance Companies Act requires federally regulated property and casualty insurers to maintain adequate capital levels. Foreign property and casualty companies operating on a branch basis are required to maintain an adequate margin of assets over their liabilities in Canada. The Minimum Capital Test (MCT) Guideline sets out the minimum and the target capital level (or margin of assets) used by OSFI in assessing compliance with these requirements. A revised MCT Guideline was issued in September 2014. The objective of the revision was to create a more robust risk-based framework that better aligns capital (or asset) requirements to the risks faced by insurers.88 The Guideline provides, inter alia, for a more explicit calculation of the minimum and target capital (or margin of assets) required and the definition of the capital or assets to be used for this purpose. Property and casualty insurers are expected to meet the MCT requirements at all times. The Guideline is to be implemented over a three-year phase-in period starting in January 2015.
4.124. Historically, provincial regulators have aligned their solvency standards with those of OSFI, thereby ensuring that all insurers are subject to similar solvency requirements regardless of their place of incorporation. With the evolving nature of international (and federal) regulatory standards, significant resources were required to maintain and enforce an up-to-date solvency regime. Therefore, there is a trend among provincial regulators to delegate authority in some areas of solvency supervision to other regulators or qualified individuals hired on a contractual basis. Some provinces, especially those with a relatively large number of provincial insurers (e.g. Quebec), have chosen to preserve their autonomy in this area and become compliant with strengthened international standards. Others are assessing the legislative changes, resources and expertise required to meet the new international standards.
4.125. Foreign insurance companies, even if they cover risks located in Canada, are not necessarily subject to federal licensing requirements. Provinces and territories vary in how they allow foreign unlicensed companies to cover local risks. In most provinces89, coverage of local risks is allowed subject to some requirements regarding taxation, and only when local capacity is unavailable. In provinces and territories such as Manitoba, New Brunswick, Ontario, Prince Edward Island, and Yukon, the broker has to conduct due diligence and determine that local capacity is either cost-prohibitive, or the policy conditions are "unacceptable". Other provinces restrict it to specific lines of business: it is the case for property insurance (against fire and marine risk) in New Brunswick; property insurance in Prince Edward Island; and fire insurance in Nova Scotia.
87 OSFI (2013). 88 OSFI online information. Viewed at: http://www.osfi-bsif.gc.ca/eng/osfi-bsif/med/Pages/mct2015-
nr.aspx. 89 This applies in the provinces of Alberta, British Columbia, Newfoundland and Labrador, Ontario,
Quebec, Saskatchewan, and in the three territories (Yukon, Northwest Territories, and Nunavut).
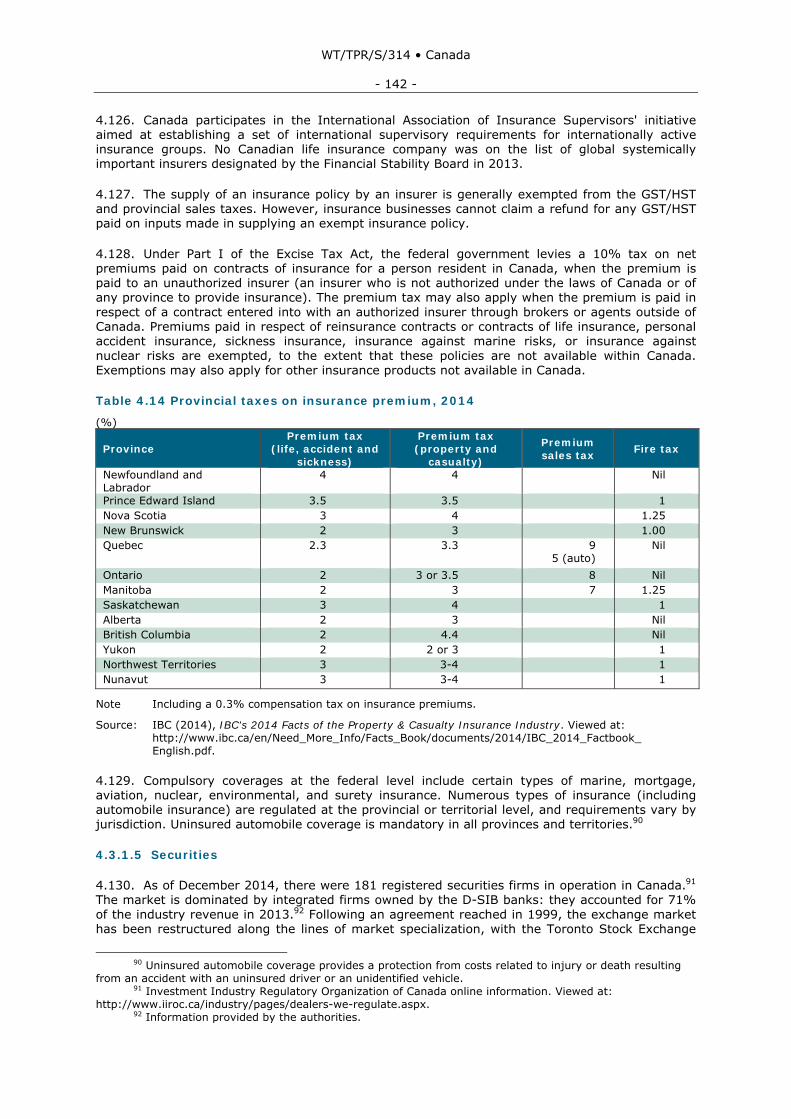
WT/TPR/S/314 • Canada
- 142 -
4.126. Canada participates in the International Association of Insurance Supervisors' initiative aimed at establishing a set of international supervisory requirements for internationally active insurance groups. No Canadian life insurance company was on the list of global systemically important insurers designated by the Financial Stability Board in 2013.
4.127. The supply of an insurance policy by an insurer is generally exempted from the GST/HST and provincial sales taxes. However, insurance businesses cannot claim a refund for any GST/HST paid on inputs made in supplying an exempt insurance policy.
4.128. Under Part I of the Excise Tax Act, the federal government levies a 10% tax on net premiums paid on contracts of insurance for a person resident in Canada, when the premium is paid to an unauthorized insurer (an insurer who is not authorized under the laws of Canada or of any province to provide insurance). The premium tax may also apply when the premium is paid in respect of a contract entered into with an authorized insurer through brokers or agents outside of Canada. Premiums paid in respect of reinsurance contracts or contracts of life insurance, personal accident insurance, sickness insurance, insurance against marine risks, or insurance against nuclear risks are exempted, to the extent that these policies are not available within Canada. Exemptions may also apply for other insurance products not available in Canada.
Table 4.14 Provincial taxes on insurance premium, 2014
(%)
Province Premium tax
(life, accident and sickness)
Premium tax (property and
casualty)
Premium sales tax Fire tax
Newfoundland and Labrador
4 4 Nil
Prince Edward Island 3.5 3.5 1 Nova Scotia 3 4 1.25 New Brunswick 2 3 1.00 Quebec 2.3 3.3 9
5 (auto) Nil
Ontario 2 3 or 3.5 8 Nil Manitoba 2 3 7 1.25 Saskatchewan 3 4 1 Alberta 2 3 Nil British Columbia 2 4.4 Nil Yukon 2 2 or 3 1 Northwest Territories 3 3-4 1 Nunavut 3 3-4 1
Note Including a 0.3% compensation tax on insurance premiums.
Source: IBC (2014), IBC's 2014 Facts of the Property & Casualty Insurance Industry. Viewed at: http://www.ibc.ca/en/Need_More_Info/Facts_Book/documents/2014/IBC_2014_Factbook_ English.pdf.
4.129. Compulsory coverages at the federal level include certain types of marine, mortgage, aviation, nuclear, environmental, and surety insurance. Numerous types of insurance (including automobile insurance) are regulated at the provincial or territorial level, and requirements vary by jurisdiction. Uninsured automobile coverage is mandatory in all provinces and territories.90
4.3.1.5 Securities
4.130. As of December 2014, there were 181 registered securities firms in operation in Canada.91 The market is dominated by integrated firms owned by the D-SIB banks: they accounted for 71% of the industry revenue in 2013.92 Following an agreement reached in 1999, the exchange market has been restructured along the lines of market specialization, with the Toronto Stock Exchange
90 Uninsured automobile coverage provides a protection from costs related to injury or death resulting
from an accident with an uninsured driver or an unidentified vehicle. 91 Investment Industry Regulatory Organization of Canada online information. Viewed at:
http://www.iiroc.ca/industry/pages/dealers-we-regulate.aspx. 92 Information provided by the authorities.

WT/TPR/S/314 • Canada
- 143 -
(TSX) being the sole senior equity exchange; the Montreal exchange dealing exclusively with derivatives; the Canadian Venture Exchange handling junior equities; and the Winnipeg Commodity Exchange specializing in agricultural futures and options. TSX is the largest stock exchange in Canada, and is also, by market capitalization, among the ten largest stock exchanges in the world. As of end December 2014, it had 1,515 listed issuers with a total market capitalization of Can$2.5 trillion.93
4.131. The day-to-day regulation and supervision of securities markets is within the jurisdiction of provincial and territorial regulators (Table 4.15). Regulators also engage in international cooperation on an individual basis. Currently, regulators from Alberta, British Columbia, Ontario, and Quebec are ordinary members of the International Organization of Securities Commissions (IOSCO). In addition, regulators participate individually in the work of regional bodies such as the North American Securities Administrators Association, and the Council of Securities Regulators of the Americas. There is, a high degree of cooperation among regulators through the Canadian Securities Administrators (CSA). All provinces and territories (except Ontario) have implemented a common "passport system"94, providing market participants with the possibility to clear a prospectus, register as a dealer or adviser, or obtain certain discretionary exemptions from the regulator in their home jurisdiction, with applicability in all other participating jurisdictions. Although Ontario is not covered by the system, its market participants have access to the market of the participating jurisdictions through the Ontario Securities Commission (OSC).
Table 4.15 Provincial and territorial securities regulators
Province Regulator Legislation (as of January 2015) Alberta Alberta Securities Commission Securities Act, RSA 2000 Chapter S-4
Latest amendment in 2014 British Columbia British Columbia Securities
Commission Securities Act R.S.B.C. 1996, c. 418 Latest amendment in 2012
Manitoba The Manitoba Securities Commission The Securities Act, C.C.S.M. c. S50 The Commodity Futures, C.C.S.M. c. C152 Latest amendment in 2014
New Brunswick Financial and Consumer Services Commission
Securities Act, S.N.B. 2004, c.S-5.5 Latest amendment in 2014
Newfoundland & Labrador
Office of the Superintendent of Securities Service
Securities Act, R.S.N.L. 1990, Chapter S-13Latest amendment in 2013
Northwest Territories
Office of the Superintendent of Securities Northwest Territories
Securities Act, S.N.W.T. 2008, c.10 Latest amendment in 2012
Nova Scotia Nova Scotia Securities Commission Securities Act, R.S. 1989 c 418 Latest amendment in 2014
Nunavut Nunavut Securities Office Securities Act S.Nu.2008,c.12 Latest amendment in 2011
Ontario Ontario Securities Commission Securities Act R.S.O. 1990, C. S.5 Commodity Futures Act R.S.O. 1990, C. 20Latest amendment in 2014
Prince Edward Island
The Office of the Superintendent Securities Consumer
Securities Act R.S.P.E.I. 1988 Latest amendment in 2012
Quebec Autorité des Marchés Financiers Securities Act (CQLR, c. V-1.1) Latest amendment in 2013
Saskatchewan Financial and Consumer Affairs Authority of Saskatchewan
The Securities Act, 1988 Chapter S-42.2 Latest amendment in 2013
Yukon Office of the Yukon Superintendent of Securities
The Securities Act SY 2007 C.16 Latest amendment in 2012
Source: WTO Secretariat, based on the information provided by the Canadian authorities.
4.132. Certain regulatory responsibilities are delegated to the Investment Industry Regulatory Organization of Canada (IIROC), an industry-led self-regulatory organization. These include setting and enforcing rules and standards pertaining to dealer firms operating in the industry. In particular, the registration of securities firms (and individuals who are carrying out certain
93 TSX online information. Viewed at: http://www.tsx.com/resource/en/569 [04.02.2015]. 94 2004 Provincial/Territorial Memorandum of Understanding Regarding Securities Regulation (MOU).

WT/TPR/S/314 • Canada
- 144 -
functions with them) has been delegated to IIROC in the following provinces and territories: Alberta, British Columbia, Saskatchewan and Newfoundland and Labrador.95 IIROC also acts as a regulator for securities trading and market-related activities in over a dozen equity marketplaces (including the Toronto Stock Exchange). IIROC handles investor complaints by first documenting and interpreting facts, and then evaluating whether it should launch an investigation. It can take disciplinary measures which may include fines, suspensions and permanent bans. IIROC is an affiliate member of the IOSCO.
4.133. The industry has also established the Canadian Investor Protection Fund, with a view to covering investors in case of insolvency by a member. The coverage is paid for by securities dealers, and is limited to Can$1 million per customer.
4.134. The federal government and several provincial and territorial governments are working together towards the operationalization of a Cooperative Capital Markets Regulatory System, with a view to strengthening the regulation of capital markets. One principal component of the Cooperative System would be a single regulator responsible for administering uniform provincial securities law and complementary federal legislation addressing capital markets-related systemic risk, national data collection and criminal offenses. In September 2013, the governments of British Columbia, Ontario and the federal government announced the establishment of the Cooperative System. New Brunswick, Prince Edward Island and Saskatchewan joined in 2014. The system is to be operationalized through several phases which include: consultations on draft initial regulations in mid-2015; the enactment of uniform provincial and complementary federal legislation by the respective legislatures of the participating jurisdictions; and, the operationalization of the cooperative regulator. Some provinces and territories are yet to join the Cooperative System.
4.3.2 Postal and courier services
4.135. The Canada Post Corporation Act is the main postal law in Canada.96 It established the Canada Post Corporation (Canada Post) as a Crown corporation with the sole and exclusive privilege of collecting, transmitting, and delivering letters weighing up to 500 grams to addresses within Canada. Exceptions to this postal monopoly include legal documents, cargo letters, letters of the carrier, urgent letters97, and outbound international mail. Also excluded from this privilege is the transmission of newspapers, magazines, books, catalogues and goods. Canada Post is allowed to compete with other providers outside its exclusive area but is not permitted to cross-subsidize its competitive services from its monopoly revenues.
4.136. Under the Act, Canada Post may make regulations pertaining to, inter alia, rates of postage and other matters related to the efficient operation of its business. The Act also gives the Corporation the ability to provide unregulated bulk rates. Postage rates are uniform for letters of similar size and weight, regardless of the address. As of 31 March 2014, the basic domestic rate for regulated lettermail ranges from Can$1 for standard letters98 (30 grams or less) to Can$5.05 for oversized mail (between 400 and 500 grams).
4.137. The legislation does not impose specifically a universal postal service obligation on Canada Post, but a mandate for "maintaining basic customary postal service". In 2009, the Government released the Canadian Postal Service Charter, outlining its expectations with regards to the services provided by the Corporation. The Charter covers issues such as universal service obligations, postage rates, delivery expectations, and complaint-resolution procedures. The Corporation also delivers certain public-policy programmes on behalf of the Government. These include: the Food Mail Program, under which the Federal Government subsidizes the cost of food transportation to isolated communities; the free mailing for some government mail and materials for the blind; and a reduced rate for library materials.
95 The provinces of Ontario and Quebec have delegated their registration powers to IIROC to register
individuals who are carrying out certain functions with investment dealers. 96 The Canada Post Corporation Act was amended in 2013 to make provisions for a reduced rate of
postage for library materials. 97 Urgent letters are defined as letters that are "transmitted by a messenger for a fee at least equal to
an amount that is three times the regular rate of postage payable for delivery in Canada of similarly addressed letters weighing fifty grams" (Canada Post Corporation Act, Section 21).
98 The rate drops to Can$0.85 if the stamps are purchased in a booklet or coil.

WT/TPR/S/314 • Canada
- 145 -
4.138. Despite the constant decline in the number of pieces to be delivered, Canada Post has been delivering mail to an ever increasing number of addresses in Canada. Between 2006 and 2013, the number of addresses has increased by 1.2 million to 15.5 million.99 At the same time, the volume of transaction mail (which includes letters, bills and statements), the Corporation's core product, has been declining every year, and stood at 9.4 billion pieces in 2013. The Corporation has been experiencing financial losses every year since 2011. A report by the Conference Board of Canada projected the annual loss to reach Can$1 billion by 2020.100 The authorities indicated that losses are absorbed internally within the corporation.
4.139. In December 2013, the corporation unveiled a Five-Point Action Plan101 with the goal of returning to financial stability by 2019 while maintaining its public policy obligations. The Plan comprises the following initiatives: converting door-to-door delivery to community mailbox delivery for roughly five million addresses; introducing a tiered pricing structure for lettermail; expanding convenience by opening more postal franchises; streamlining operations; and addressing the cost of labour, mostly through attrition. Canada Post is also focusing on investment in eCommerce, increasing its share of the parcel segment of the market and improving its direct mail business.
4.140. The courier service market outside Canada Post's monopoly is open to competition. It is unregulated and there are no foreign ownership restrictions.
4.141. Canada has not made any GATS commitments on postal services in its WTO Schedule on Specific Commitments, thus they remain unbound. With respect to courier services, this subsector contains partial GATS commitments, as some courier services remain unbound.
4.3.3 Tourism
4.3.3.1 Overview and developments
4.142. The Canadian tourism industry is an important services sector, accounting for approximately 2% of Canadian GDP and 1.4% of total investment in Canada; it also contributes significantly to employment.102 Total tourism revenue from domestic and international travellers exceeded Can$84 billion in 2013, while tourism revenue from foreign travellers amounted to Can$16.4 billion in 2013, making tourism Canada's most important services export.103 According to the World Economic Forum Travel & Tourism Competitiveness Report, Canada improved to 8th place in 2013. Its strengths were rich natural resources, highly qualified human resources, cultural resources, and air transport infrastructure, where Canada ranked first in the world. Canada lost some ground in terms of price competitiveness (ticket takes and airport charges), visa requirements and environmental sustainability.104
4.143. Most of tourism in Canada is domestic, accounting for 81% of tourism revenues in 2013.105 In terms of international arrivals, the United States is the most significant source. Arrivals from the United States have remained flat over the period, whereas international arrivals from other countries have shown small gains, albeit from a much smaller base (Table 4.16). The other top countries in terms of international arrivals are the United Kingdom, France, China, and Germany. In terms of enterprises, small and medium sized business enterprises dominate the tourism sector, accounting for 98% of the sector.106
99 Canada Post Corporation (2014). 100 Stewart-Patterson, Gill, and Hoganson (2013). 101 Canada Post Corporation (2013). 102 One in eleven jobs (1.6 million) are associated with the tourism economy, with over 618,000 directly
supporting tourism. Canadian Tourism Commission (2011). 103 CANSIM Table 376-0108 as cited in Canadian Tourism Commission (2013). 104 WEF (2013). 105 Canadian Tourism Commission online information. Viewed at:
http://www.tourism.gc.ca/eic/site/034.nsf/eng/00444.html. 106 Canada's Federal Tourism Strategy. Viewed at: http://www.tourism.gc.ca.

WT/TPR/S/314 • Canada
- 146 -
Table 4.16 Tourism indicators, 2011-13
2011 2012 2013
Tourism export revenue (Can$ billion)
15.5 16 16.4
Total tourism GDP (Can$ million) 30,876 32,037 33,030
Transportation 6,736 6,986 7,163
Accommodation 7,277 7,536 7,730
Food and beverage services 3,910 4,105 4,268
Other tourism industries 4,849 5,017 5,125
Other industries 8,104 8,393 8,744
Total tourism commodities (Can$ million)
Transportation 90,013 92,786 96,016
Passenger air transport 17,328 18,403 18,918
Passenger rail transport 304 294 285
Interurban bus transport 1,239 1,196 1,122
Vehicle rental 2,406 2,490 2,514
Vehicle repairs and parts 22,660 22,821 23,585
Vehicle fuel 43,377 44,807 46,764
Other transportation 2,699 2,775 2,828
Accommodation 12,371 12,805 13,333
Food and beverage services 57,276 59,850 62,009
Other tourism commodities 30,117 31,080 31,581
Recreation and entertainment 22,959 23,549 23,720
Travel agency services 4,159 4,418 4,618
Pre-trip expenditures 2,751 2,854 2,972
Convention fees 248 259 271
Employment generated by tourism 600,300 609,500 618,900
International travellers entering or returning to Canada (thousands)
94,355 98,082 98,511
US residents entering Canada 20,543 20,719 20,435
Residents of other countries entering Canada
4,523 4,599 4,732
Total non-resident travellers 25,066 25,318 25,167
Canadian residents returning from the United States
52,802 55,609 56,208
Canadian residents returning from other countries
9,108 9,570 9,590
Total Canadian residents 61,911 65,179 65,798
Other travellers 7,378 7,585 7,546
Tourism Demand (Can$ million)
Transportation 31,283 32,617 33,568
Passenger air transport 16,476 17,493 17,989
Passenger rail transport 285 275 266
Interurban bus transport 1,164 1,123 1,054
Vehicle rental 1,649 1,712 1,728
Vehicle repairs and parts 1,556 1,562 1,621
Vehicle fuel 9,477 9,759 10,209

WT/TPR/S/314 • Canada
- 147 -
2011 2012 2013
Other transportation 676 693 701
Accommodation 11,226 11,621 12,101
Food and beverage services 11,331 11,836 12,277
Other tourism commodities 12,254 12,760 13,126
Recreation and entertainment 5,143 5,278 5,315
Travel agency services 4,132 4,390 4,589
Pre-trip expenditures 2,751 2,854 2,972
Convention fees 228 238 250
Total other commodities 12,370 12,915 13,449
Source: Statistics Canada, CANSIM tables 387-0001, 387-0002, 387-0003, and 387-0010.
4.3.3.2 Legal and Regulatory Framework
4.144. The federal government, provinces and territories, municipalities, and the private sector all have a role in tourism. At the level of the federal government, Industry Canada takes a lead role in policy formulation and implementation, however over 20 federal departments and agencies are involved in tourism activities or services, such as Canada Border Services Agency, Canadian Heritage and Parks Canada. During the fiscal year 2011/12 over Can$645 million was spent at the federal level for programmes and projects with a direct impact on tourism. Some of these programmes include regional tourism development programmes, tourism infrastructure, and tourism marketing.
4.145. The Canadian Tourism Commission (CTC), a government Crown Corporation established by the Canadian Tourism Commission Act (S.C. 2000, c. 28), is responsible for promoting Canada as an international tourism destination. The CTC pursues the policy goal of creating a vibrant tourism sector that provides significant and sustained benefits for the Canadian economy and its people through partnerships with diverse partners including provincial and territorial marketing organization, destination marketing organizations, federal and sub-federal governments of Canada, and the private sector.
4.146. Canada does not have a federal tourism act or legislation, only the Act establishing the CTC. Activities including visa issuance and facilitation, air sector competitiveness and border clearance are governed federally; however, other laws and regulations for tourism activities and travel agents are at the provincial/territorial level. For example, the licencing of travel agents, regulation of the food and beverage and accommodations industries, food safety, and liquor distribution and sale are all governed by provinces/territories subject to their individual legislation. Some provinces, such as British Columbia, Ontario and Quebec, have a specific Travel Assurance Fund to compensate consumers who do not receive their travel services. Other areas, such as hotel green eco-rating, tour operators approved to offer travel for Chinese groups, and a passenger rights code of conduct for airlines, are voluntary programmes by the private sector.
4.147. At the provincial or territorial level, the legislation or regulations pertaining to tourism activities varies significantly. An overview of selected provincial and territorial laws and regulations is provided in Table 4.17.

WT/TPR/S/314 • Canada
- 148 -
Table 4.17 Selected Tourism Related Legislation of the Provinces and Territoriesa
Province/Territory Legislation British Colombia The Tourism Act
Enables the Ministry to carry out the duties and powers necessary in relation to tourism policy, tourism services and infrastructure, industry support and tourism marketing, including powers related to roles of the newly formed crown Destination British Columbia. The Hotel Guest Registration Act Sets out the requirements for a record of guest information that must be maintained by a hotel. The Hotel Keepers Act Regulates the hotel industry in relation to liens on guest property, liability for guest property, ability to maintain order (issue offence). The Tourist Accommodation (Assessment Relief) Act Provides property assessment relief for eligible properties. The Vancouver Tourism Levy Enabling Act Provides a framework for the Lieutenant Governor in Council with regard to levies applied to tourism businesses, collection of levies, etc. Provincial Sales Tax Act Authorized under the Provincial Sales Tax Act, the Municipal and Regional District Tax (MRDT) is a tax of up to 2% charged on sales of taxable accommodation in participating municipalities and regional districts in B.C. The tax can apply to the entire municipality or regional district, or to a specific area within the municipality or regional district. The MRDT assists municipalities, regional districts and other eligible entities in promoting tourism in their area and, to a lesser extent, financing new tourist facilities or programs. The MRDT applies to taxable accommodation sold in hotels, motels, resorts, hostels, bed & breakfasts and other establishments offering short term accommodation. The BC Ministry of Finance charges an administration fee to cover the cost of administering the tax, and provides the balance of the tax collected to the municipality, regional district or eligible entity on a monthly basis. Business Practices and Consumer Protection Act – Travel Industry Regulation The Travel Industry Regulation governs the operation of British Columbia travel agencies and wholesalers. The Regulation also governs payments into a Travel Assurance Fund and establishes eligibility requirements. The Travel Assurance Fund (TAF) provides a possible source of compensation when consumers do not receive the travel services they purchased through a BC licensed travel agent. Consumer Protection BC is a not-for-profit authority established under the Business Practices and Consumer Protection Act that has signed an administrative agreement with the Province of BC setting out the terms and conditions under which the authority will operate and remain accountable to the government. Other legislation that impacts BC's tourism industry, includes: Assessment Act, British Columbia Wine Act, Commercial River Rafting Safety Act, Water Sustainability Act, Environment and Land Use Act, Environmental Assessment Act, Fisheries Act, Forest and Range Practices Act, Heritage Conservation Act, Land Act, Liquor Control and Licensing Act, Liquor Distribution Act, Motor Vehicle (All Terrain) Act, Motor Vehicle Act, Park Act, Public Health Act, and the Wildlife Act.
Northwest Territories
The Northwest Territories Tourism Act and Regulations Governs the activities of anyone offering commercial guided tourism services in the NWT. The Northwest Territories Wildlife Act and Regulations- Governs the activities of big game outfitters; these outfitters also have to comply with the Tourism Act.

WT/TPR/S/314 • Canada
- 149 -
Province/Territory Legislation Nunavut Travel and Tourism Act (TTA)
Was adopted from the Northwest Territories, and Nunavut is in the process of updating the TTA which regulates businesses that provide accommodations to the travelling public, or that provide services associated with outdoor recreational activities. The purpose of the TTA is to support the development of a tourism industry, protect the interests of licenced tourism operators, support the safe operation of tourism businesses, and assure that tourism in Nunavut is a regulated and safe industry. Pursuant to the TTA, three types of licences are issued, namely, Outfitter Licence, Tourist Establishment Licence, and Building Permit. The following entities require a Tourist Establishment licence—hotels, lodges, motels, outpost camps, tent camps, cabin establishments, camping establishments, bed & breakfasts, and homestays. Even though Nunavut licences all these tourist establishments, the TTA does not specifically addresses restaurants or travel agents.
Quebec Ministry of Tourism Act Governs activities of the Quebec Ministry of Tourism Law for Tourist Accommodation Establishments Regulations for Tourist Accommodation Establishments Law for Travel Agents
Saskatchewan The Tourism Saskatchewan Act Governs the structure and functions of Tourism Saskatchewan. The organization is responsible primarily for the provision of tourism marketing, industry development and visitor information services for the province. The Provincial Sales Tax Act Mandates that anyone selling taxable goods or services in Saskatchewan is required to obtain a vendor's license and PST number to be legally recognized as a business. The Liquor Consumption Tax Act The Act and the issuance of liquor licenses is regulated by the Saskatchewan Liquor and Gaming Authority and the Ministry of Finance. The Saskatchewan Hotel Keepers Act, 1978 Contains provisions for liability, property exempt from seizure, registration of guests, and disturbances that apply to hotel keepers. The Public Health Act, 1994 Saskatchewan's Public Accommodation Regulations and Provincial Itinerant Use Accommodation Standards require that all public accommodation providers (itinerant use accommodation) operate under a license issued by the local health authority. A license cannot be granted if regulations and standards are not met. The Consumer Protection and Business Practices Act Various sections pertain to travel agencies/travel clubs. The Act sets out obligations of suppliers in their interactions with consumers, requires a consumer to make a reasonable effort to minimize any loss and to attempt to resolve a dispute with a supplier before taking further action. The Natural Resources Act and The Outfitter and Guide Regulations, 2004 Governs the responsibilities of hunting and angling outfitters and guides and the use thereof by non-resident hunters and anglers; and other acts and regulations also govern responsibilities of hunters/anglers and the issuance of licences, as overseen by Ministry of the Environment.
a This is not an exhaustive list of tourism legislation for the provinces and territories.
Source: Information provided by the Canadian authorities.
4.3.3.3 Policy actions
4.148. In 2011 Canada created a Federal Tourism Strategy to provide a government-wide approach for the tourism sector, positioning it for long-term growth and competitiveness. To implement the strategy, a steering committee of senior federal executives was formed. While the committee consists of government officials, the private sector was invited to attend meetings. The strategy identifies four priority areas:
• Increasing awareness of Canada as a premier tourist destination;

WT/TPR/S/314 • Canada
- 150 -
• Facilitating access and movement for travellers while ensuring the safety and integrity of Canada's borders;
• Encouraging product development and investments in Canadian tourism assets and products; and
• Fostering an adequate supply of skills and labour to enhance visitor experiences through quality service and hospitality.107
4.149. Under the strategy a number of key achievements have been reached such as the creation of the Canadian Signature Experiences programme, as well as leading trade missions for tour operators and travel agents. Furthermore, Canada's Blue Sky policy108, announced in 2006, also supports the Federal Tourism Strategy through new or expanded air transport agreements or administrative arrangements covering over 85 countries. In particular, the following markets have been addressed in the context of air transport negotiations since the creation of the Federal Tourism Strategy in 2011: Brazil, Japan, India, Mexico, Pakistan, Rwanda, Turkey, Bahrain, Kenya, Sierra Leone, Honduras, China, Nicaragua, Curacao, Saint Maarten, Colombia, Senegal, Gambia, Uruguay, Paraguay, Kingdom of Saudi Arabia, Azerbaijan, Burkina Faso, Peru, Bangladesh, Algeria, Ethiopia, South Africa, Israel, Malaysia, Ecuador, Macedonia, Panama, Haiti, Burundi, Togo, and the Philippines.
4.150. Canada's Economic Action Plan initiatives has also contributed to the tourism sector by providing funding for tourism events including the 2015 Pan and ParaPan American Games, national parks, infrastructure, visa processing capacity, and marketing initiatives.
4.3.3.4 GATS and FTA commitments
4.151. Under the GATS, Canada has made commitments for hotels, restaurants, travel agencies, and tour operators' services. The limitations in these areas mainly relate to residency requirements or commercial presence requirements for travel agents, and to the sale of liquor or alcoholic beverages in hotels and restaurants. Tourist guide services and other tourism services remain unbound under the GATS. In its FTAs, Canada has taken strong commitments in the tourism services sector, with a limited number of non-conforming measures at the provincial/territorial level. These non-conforming measures exist in certain provinces and mainly relate to residency requirements for licenses for certain types of hunting guide services and residency and/or commercial presence requirements for travel agency and travel wholesaler services.
4.3.4 Environmental services
4.152. Canada has made full commitments under the GATS for environmental services, covering all the sub-sectors of sewage services, refuse disposal services, sanitation and similar services, and other environmental services. In Canada's FTAs, which generally follow a negative list approach, no restrictions were listed, and thus the FTAs reaffirm the open commitments already given in the WTO.
4.153. According to a study by Environmental Business International, Canada had an environmental market of US$23.4 billion in 2014, accounting for about 2.5% of the global environmental market, and growing at about 3% per year. Further, Canada has strong international competitiveness in consulting and engineering, remediation, and analytical environmental services, but is weaker in solid waste management, hazardous waste management, and water treatment works.109 In 2012, sales of environmental services in Canada amounted to Can$2.3 billion of which environmental consulting services was the largest contributor, with about 66% of total environmental services sales. Site remediation and emergency environmental services generated the remaining Can$757 million in revenue.110 The major export market for
107 Government of Canada (2014a). 108 Blue Sky Policy, Transport Canada online information. Viewed at:
http://www.tc.gc.ca/eng/policy/ace-blueskypolicy-menu-749.htm. 109 "Global Environmental Market Data", Environmental Business International, Inc. Viewed at:
http://www.ebionline.org. 110 Statistics Canada, Survey of Environmental Goods and Services, 2012. Viewed at:
http://www.statcan.gc.ca/daily-quotidien/150313/dq150313c-eng.htm.

WT/TPR/S/314 • Canada
- 151 -
environmental goods and services is the United States, accounting for 78% of environmental exports of Can$748 million in 2012.111 The remainder was distributed amongst other international markets.
4.154. Businesses operating in Canada spent Can$9.5 billion in 2010 to protect the environment, up by 9% from 2008. Following a long-standing trend, the largest share of these expenditures was spent to deal with pollutants after they were created. The oil and gas extraction industry spent more on environmental protection than any other industry surveyed, followed by the electric power generation, transmission and distribution industry, accounting for 42% and 12% of the total expenditures for 2010, respectively. Of the Can$4.2 billion in capital expenditures made for environmental protection, the majority was for pollution abatement and control (35%) followed by pollution prevention (26%).112
4.155. Table 4.18 provides a summary of the market structure of environmental services and their main characteristics.
Table 4.18 Market structure of environmental services, 2014
Type of service Main Features Water utilities and waste water treatment services
Share of the global market 2% (2010) Volume 3,472 km3 per year Level of regulation Federal, provincial, and territorial Main regulations Canada Water Act, International Rivers Improvement
Act, Wastewater Systems Effluent Regulations Main objectives of the regulations Determines how waste water can be treated and
disposed Solid and hazardous waste management services
Share of the global market 2% (2010) Share of the private sector in the revenues of 72% Market size, number of firms, and employment For private sector/municipal
1,697 firms / n.a. 27,261 employees / 7,816 employees Can$5,959 million revenues / Can$2,321 million revenues
Public sector customer / private sector customer ratio
81% of employees in the private sector
Level of regulation Federal, provincial, and territorial Main regulations Canadian Environmental Protection Act 1999,
Fisheries Act Main objectives of the regulations Determines how waste can be disposed Air and noise pollution abattement services Level of regulation Federal, provincial, and territorial Main regulations Canadian Environmental Protection Act 1999 Main objectives of the regulations Sets limits on pollutants Remediation and nature and landscape protection (NLP) services
Share of the worldwide remediation and industrial services market
4% (2010)
Revenues, number of firms and employment in the remediation and industrial services sector
173,925 employees (2013) Remediation-597 firms
Level of regulation Federal, provincial, and territorial
Source: Compiled by the WTO Secretariat from USITC, Statistics Canada, and Environment Canada online information.
4.3.4.1 Regulatory Aspects
4.156. Regulation of environmental services in Canada falls under federal, provincial and territorial and, in some cases, municipal government jurisdiction. Various federal government departments, including Environment Canada, the Department of Fisheries and Oceans, Natural
111 Statistics Canada, Survey of Environmental Goods and Services, 2012. Viewed at:
http://www.statcan.gc.ca/daily-quotidien/150313/dq150313c-eng.htm. 112 Statistics Canada, Environmental Protection Expenditures in the Business Sector, 2010.

WT/TPR/S/314 • Canada
- 152 -
Resources Canada, Health Canada and Industry Canada play important roles in establishing national environmental standards, enforcing federal environmental regulations, consulting with industry stakeholders on new policies, addressing international issues and conducting critical research on the environmental services industries.
4.157. The Canadian Environmental Protection Act, 1999 (CEPA 1999) aims at preventing pollution and protecting the environment and human health. The goal of CEPA 1999 is to contribute to sustainable development - development that meets the needs of the present generation without compromising the ability of future generations to meet their own needs. A key aspect of CEPA 1999 is the prevention and management of risks posed by toxic and other harmful substances. CEPA 1999 also manages environmental and human health impacts of products of biotechnology, marine pollution, disposal at sea, vehicle, engine and equipment emissions, fuels, hazardous wastes, environmental emergencies and other sources of pollution. In addition, CEPA 1999 provides the government with broad powers to issue a range of nationally applied regulatory and non-regulatory tools specifically for activities carried out on federal and aboriginal lands. Both the Minister of the Environment and the Minister of Health jointly administer the task of assessing and managing the risks associated with toxic substances.
4.158. Provincial and territorial governments are responsible for many of the in-the-field aspects of environmental services regulation in Canada. Provincial and territorial responsibilities include establishing provincial environmental standards; consulting with industry stakeholders; undertaking inspection, investigation and enforcement activities to ensure that environmental services firms are in compliance with environmental regulations; addressing regional environmental issues; monitoring and reporting of air, water and soil quality levels; and oversight of environmental remediation projects. In addition, provincial and territorial governments are responsible for oversight of environmental services provided at the municipal level.
4.159. Similar to the federal level, several ministries in each province and territory share responsibility for the regulation of environmental services. In Ontario, for example, regulatory authority is shared between the provincial Ministry of the Environment, the Ministry of Natural Resources, the Ministry of Municipal Affairs, the Ministry of Health and Long-Term Care, and the Ministry of Northern Development and Mines, amongst others. Harmonization of environmental services regulations across Canada is supported by the Canadian Council of Ministers of the Environment, an intergovernmental forum composed of federal, provincial and territorial ministers that seeks to collectively establish nationally consistent environmental standards, strategies and objectives so as to achieve a high level of environmental quality across the country.
4.160. Provincial and territorial legislatures are responsible for deciding which responsibilities to delegate to municipalities. Municipalities are then authorized to regulate those areas through the issuance of bylaws. In the case of environmental services, many municipal governments provide environmental services such as refuse disposal services and sewage services directly to the public. For those services that have been privately contracted, municipal Conservation Authorities conduct monitoring and management of private environmental services contracts.
4.3.4.2 Industry Structure
4.161. The waste management industry in Canada comprises the collection and transportation of waste for disposal and recycling, the operation of hazardous and non-hazardous waste disposal facilities, operation of transfer stations, operation of recycling and compost facilities, and hazardous waste treatment. These services are provided by public bodies such as local governments or municipalities, or private firms that are typically contracted by local governments. The number of full-time workers in the waste management industry, including both government and business sectors, totalled just over 32,000 in 2010, an increase of 2% from 2008. Over 1,500 Canadian firms are engaged in this industry, providing a number of services such as waste management planning, consulting, engineering and analytical services, customized landfill and liner design, landfill management, stabilization and containment services and procedures for hazardous waste and pollution prevention systems. Hazardous waste in Canada is comprised of household hazardous waste, mostly batteries, medication, and paint; e-waste; and radioactive waste, i.e. spent nuclear fuel waste. The majority of household hazardous waste is returned to suppliers or waste depots, while e-waste is most often brought to waste depots. A lot of

WT/TPR/S/314 • Canada
- 153 -
radioactive waste is imported or exported for treatment or recycling in the United States, i.e. 358,236 tonnes was imported and 425,334 tonnes was exported in 2010.113
4.162. Hazardous wastes and hazardous recyclable materials can come from a myriad of sources such as residues from industrial operations, manufacturing processing plants and hospitals, or they can be obsolete materials such as waste lubricants and pesticides. Canada implements its international obligations as a party to the Basel Convention on the Control of Transboundary Movements of Hazardous Wastes and their Disposal (Basel Convention), the OECD Decision on the Control of Transboundary Movement of Wastes Destined for Recovery Operations, and the Canada–USA Agreement on the Transboundary Movement of Hazardous Waste through the Export and Import of Hazardous Waste and Hazardous Recyclable Material Regulations. These regulations control and track the movement of hazardous waste and hazardous recyclable material between Canada and other countries, as well as implement prior informed consent mechanisms for exports, imports and transit of such materials. The regulations cover hazardous waste and hazardous recyclable material generated from industrial, commercial, governmental, and institutional activities. More than 99% of Canada's imports and 98% of Canada's exports of both hazardous waste and hazardous recyclable materials are with the United States. In 2012, the quantity of hazardous waste and hazardous recyclable material imported into Canada was 346,700 tonnes, while the quantity exported from Canada was 496,095 tonnes.114
4.163. Radioactive waste in Canada is comprised of nuclear fuel waste, low-level and intermediate-level waste, and uranium mine tailings. Canada exports radioactive waste to the United States for recycling and volume reduction. Metal radioactive waste is melted at United States' commercial facilities for recycling within the nuclear industry, and combustible radioactive waste is volume-reduced through incineration, with the residual material (ash) returned to Canada for long-term management. Canada also exports very-low-level radioactive waste to the United States for disposal in commercial hazardous waste facilities. This export route is limited to materials that meet the waste acceptance criteria for disposal as hazardous waste. Further, Canada repatriates U.S.-origin highly enriched uranium materials under the Global Threat Reduction Initiative, in response to commitments made by the Government of Canada at the 2010 and 2012 Nuclear Security Summits.
4.164. The wastewater sector in Canada is comprised of municipal wastewater, industrial wastewater, and storm water, of which Canada renews an average of 3,472 km3 per year, one of the largest in the world. Most of the wastewater is generated from households, accounting for 65% of wastewater.115 Industrial wastewater accounts for 18%, and discharge from electric and nuclear power generating facilities accounts for the majority of this wastewater. Not all wastewater is treated before being released in Canada. While the majority of municipal wastewater is treated by municipal sewers before being released into the environment, the situation is different for industrial wastewater, as over 85% is released to surface freshwater or tidewater.116 Canadian firms in the wastewater industry provide a number of services, notably water purification services and rain water harvesting and treatment.
4.165. Canada's air pollution control industry employs over 65,000 people, and firms in this industry export over Can$187 million annually in services and products. In recent years, annual Canadian air pollution control revenues exceeded Can$771 million, with 10% of services and 29% of equipment revenues derived from international sales. Canadian firms offer a variety of air pollution control services such as environmental impact assessments, preparation of performance specifications and compliance management, expert air monitoring, sampling and testing analysis with dispersion modelling and prevention control processes and mechanisms.
4.166. Soil remediation and contaminated site assessment technologies and services are in high demand in Canada. Between 2002 and 2008, the Canadian soil remediation industry grew by 26%; in 2005 revenues in the industry were between Can$250 million and Can$500 million. Canadian firms in this industry have a wide range of service expertise in the assessment, clean-up, decommissioning and rehabilitation of soil contaminated by petroleum hydro carbons, pesticides, in-organics, heavy metals and radioactive wastes. The Federal Contaminated Sites Action Plan
113 "Human Activity and the Environment, 2012", Statistics Canada. 114 "Canadian Environmental Protection Act (1999) 2013 Annual Report", Environment Canada. 115 "Human Activity and the Environment, 2012", Statistics Canada. 116 "Human Activity and the Environment, 2012", Statistics Canada.

WT/TPR/S/314 • Canada
- 154 -
(FCSAP) is a 15-year programme that was established in 2005 with funding of Can$3.5 billion from the Government of Canada. The primary objective of this programme is to reduce environmental and human health risks from known federal contaminated sites and associated federal financial liabilities. Between 2011 and 2014, the Government of Canada invested Can$1 billion in the FCSAP programme, including work on close to 1,100 federal remediation projects.
4.167. The Government of Canada is also implementing the Nuclear Legacy Liabilities Program (NLLP) to decommission outdated nuclear research facilities, remediate lands contaminated by past practices, and manage legacy waste at Atomic Energy of Canada Limited (AECL) sites. Since the inception of the NLLP in 2006, the Government of Canada has spent Can$1.2 billion to control and reduce risks and liabilities at AECL sites. In addition, the Government's Port Hope Area Initiative (PHAI) is implementing long-term solutions for the clean-up and safe management of historic low-level radioactive waste in the municipalities of Port Hope and Clarington, Ontario. The Can$1.3 billion implementation phase of the PHAI was initiated in 2012, and is expected to take about 10 years to complete.
4.3.4.3 Sustainable Technologies
4.168. Sustainable technologies are a priority sector in Canada's Global Markets Action Plan and, as such, Canada is seeking to further liberalize trade in this area, notably in the context of the plurilateral initiative for a WTO Environmental Goods Agreement. The sustainable technologies sector includes both environmental goods and services. The Canadian sustainable technologies sector, which is highly export intensive, is comprised of several sub-sectors: industrial processes and products, transportation, energy efficiency green buildings, recycling, recovery and remediation, water and wastewater, power generation and, energy infrastructure/smart grid (Table 4.19). In 2012, the Canadian sustainable technologies sector, which mainly includes small and medium-sized enterprises, was estimated at Can$11.3 billion, directly employed around 41,100 people and had research and development expenditures of around Can$1.143 billion.117
Table 4.19 Overview of Sustainable Technology Sub-sectors
Sub-Sector Description of sub-sector
Percent of sustainable technology
industry revenues
Percent of sustainable technology
industry employment
Percent of sustainable technology
industry research &
development Industrial Processes & Products
Bio-based products Emissions detection and/or control Energy efficiency - industrial Nano and high performance materials Water treatment – industrial
17 13 13
Transportation Electric charging components & systems Hydrogen fueling components & systems Marine transportation Vehicle control systems Vehicle and components (e.g. batteries, fuel cells, drive trains) Vehicle emissions abatement Vehicle heat & energy recovery
16 14 21
Energy Efficiency Green Buildings
Building energy management Building materials District heating & cooling Energy use information systems Geoexchange Glass Lighting Lighting management
16 20 14
117 Analytica Advisors (2014).

WT/TPR/S/314 • Canada
- 155 -
Sub-Sector Description of sub-sector
Percent of sustainable technology
industry revenues
Percent of sustainable technology
industry employment
Percent of sustainable technology
industry research &
development Recycling, Recovery & Remediation
e-waste Hazardous waste Industrial waste Municipal solid & organic waste Refrigerants Soil remediation - non extractive
14 14 3
Water & Wastewater
Desalination Greywater treatment Groundwater remediation Nuclear, heavy water treatment Potable water Wastewater treatment Water infrastructure Water management Water use information software (consumer & commercial)
12 10 7
Power Generation Bio-feedstock to heat Co-generation (from bio-feedstock) Fuel cells Geothermal Hydro (in-river, tidal, wave) Solar - Photovoltaic and Concentrator Solar Panels Solar components & systems Waste-to-energy (industrial, municipal waste) Wind Wind components & systems
11 12 9
Energy Infrastructure/Smart Grid
Advanced batteries Advanced metering infrastructure (AMI) Demand Response Distributed generation & dispatch Distribution automation & security Energy storage (e.g. thermal, mechanical, hydrogen) Grid asset management Microgrids Transmission automation & security
7 8 9
Other 7 9 24
Source: Information provided by Canadian authorities.

WT/TPR/S/314 • Canada
- 156 -
REFERENCES
AAFC (2012), "Evaluation of Income Stability Tools – AgriStability and AgriInvest". AAFC Evaluation Committee, June. Viewed at: http://publications.gc.ca/collections/collection_2013/aac-aafc/A22-559-2012-eng.pdf. AAFC (2014a), "Agriculture and Agri-Food Canada", "Statistics of the Canadian Dairy Industry", 2013 Edition. Viewed at: http://publications.gc.ca/collections/collection_2013/aac-aafc/A71-18-2013-eng.pdf. AAFC (2014b), An Overview of the Canadian Agriculture and Agri-Food System 2014, April. Viewed at: http://publications.gc.ca/collections/collection_2014/aac-aafc/A38-1-1-2014-eng.pdf. AAFC (2014c), Statistics of the Canadian Dairy Industry, 2013 Edition. Agriculture and Agri-Food Canada. Viewed at: http://publications.gc.ca/collections/collection_2013/aac-aafc/A71-18-2013-eng.pdf. Analytica Advisors (2014), "Canadian Clean Technology Industry Report". Viewed at: http://www.analytica-advisors.com/sites/default/files/Stand%20alone%20ES.pdf. Autorité des Marchés Financiers (2013), Notice Related to Designation of Desjardins Group as a Domestic Systemically Important Financial Institution, June. Viewed at: http://www.lautorite.qc.ca/files/pdf/reglementation/assurances-inst-depot/avis-ifis-d-cq_desjardins_a.pdf. Bank of Canada, Annual Report 2013. Viewed at: http://www.bankofcanada.ca/wp-content/uploads/2014/03/Annual-Report-2013.pdf. BCBS (2012), "A framework for dealing with domestic systemically important banks". Basel, October. Viewed at: http://www.bis.org/publ/bcbs233.pdf. Canada Post Corporation (2014), "2013 Annual Report". Viewed at: http://www.canadapost.ca/cpo/ mc/assets/pdf/aboutus/annualreport/2013_ar_overview_en.pdf. Canada Post Corporation's (2013) "Five-Point Action Plan", December. Viewed at: https://www.canadapost.ca/cpo/mc/assets/pdf/aboutus/5_en.pdf. Canadian Tourism Commission (2011), "Tourism Competitive Benchmarking Study". Viewed at: https://en-corporate.canada.travel/sites/default/files/pdf/Research/Industry-research/Economic-political-impacts/tourism_competitive_benchmarking_study_en_2011.pdf. Canadian Tourism Commission (2013), "Helping Tourism Businesses Prosper", 2013 Annual Report. Viewed at: https://en-corporate.canada.travel/sites/default/files/pdf/Corporate_reports/final_2013_annual_report_en.pdf. Competition Bureau (2014), Annual Report 2013. Viewed at: http://www.competitionbureau.gc.ca. Crisan, D., and McKenzie, K.J. (2013), "Government Owned Enterprises in Canada", SPP Research Papers, School of Public Policy, University of Calgary. Viewed at: http://archives.enap.ca/bibliotheques/2013/08/030434024.pdf. Department of Finance (2014), Fiscal Reference Tables, October. Viewed at: http://www.fin.gc.ca/frt-trf/2014/frt-trf14-eng.pdf. DFATD (2013), A Guide to Canada's Export Controls 2013, December. Viewed at: http://www.international.gc.ca/controls-controles/assets/pdfs/documents/guide-2013-EN.pdf. FAO (2014), "Fishery and Aquaculture Statistics, 2012", Annual Yearbook. Rome, June. Viewed at: http://www.fao.org/3/a-i3740t.pdf.

WT/TPR/S/314 • Canada
- 157 -
Financial Institutions Commission (2014), "Notice on Identification of Central 1 as a Domestic Systemically Important Financial Institution" February. Viewed at: http://www.fic.gov.bc.ca/pdf/info_bulletins/cu-14-001.pdf. Fulbright, N. R. (2013), "Guide to Mining Projects and Mining Finance in Canada", October. Viewed at: http://www.nortonrosefulbright.com/files/guide-to-mining-projects-and-mining-finance-in-canada-pdf-5mb-110136.pdf. Gold, R., and Shortt, M. (2014), "The Promise of the Patent in Canada and around the World", Vol. 30:1, Canadian Intellectual Property Review, June. Viewed at: http://www.pijip.org/wp-content/uploads/2014/06/Gold-and-Shortt.pdf. Government of Canada (2011), Beyond the Border: A shared vision for perimeter security and economic competitiveness, December. Viewed at: http://actionplan.gc.ca/grfx/psec-scep/pdfs/bap_report-paf_rapport-eng-dec2011.pdf. Government of Canada (2012a), "Canada as a Global Leader in Renewable Energy", Energy and Mines Ministers' Conference, September. Viewed at: http://www.nrcan.gc.ca/sites/www.nrcan.gc.ca/files/www/pdf/publications/ emmc/renewable_energy_e.pdf. Government of Canada (2012b), Red Tape Reduction Action Plan. Viewed at: http://www.tbs-sct.gc.ca/rtrap-parfa/rtrapr-rparfa-eng.pdf. Government of Canada (2014a), "Federal Tourism Strategy Annual Report 2013". Viewed at: https://www.ic.gc.ca/eic/site/034.nsf/eng/h_00466.html. Government of Canada (2014b), Global Markets Action Plan: The Blueprint for Creating Jobs and Opportunities for Canadians through Trade. Viewed at: http://international.gc.ca/global-markets-marches-mondiaux/index.aspx?lang=eng. Health Canada (2014), Guidance Document for Industry - Review of Drug Brand Names, 2 July. Viewed at: http://www.hc-sc.gc.ca/dhp-mps/pubs/medeff/_guide/2014-review-examen_drug-medicament_names-marques/index-eng.php. House of Commons (2009). "Statutes of Canada 2009, Chapter 2", March. Viewed at: http://www.parl.gc.ca/content/hoc/Bills/402/Government/C-10/C-10_4/C-10_4.PDF; and House of Commons (2010) "Statutes of Canada 2010, Chapter 12", July. Viewed at: http://www.parl.gc.ca/content/hoc/Bills/403/Government/C-9/C-9_4/C-9_4.PDF. House of Commons (2011), "Statutes of Canada, Chapter 24", December. Viewed at: http://www.parl.gc.ca/content/hoc/Bills/411/Government/C-13/C-13_4/C-13_4.PDF. House of Commons (2013a), Intellectual Property Regime in Canada: Report of the Standing Committee on Industry, Science and Technology of the 41st Parliament, March. Viewed at: http://www.parl.gc.ca/content/hoc/Committee/411/INDU/Reports/RP6038442/indurp03/indurp03-e.pdf. House of Commons (2013b), Intellectual Property Regime in Canada: Report of the Standing Committee on Industry, Science and Technology, June. Viewed at: http://www.parl.gc.ca/HousePublications/Publication.aspx?DocId=6237704&Language=E&Mode=1&Parl=41&Ses=1. House of Commons (2013c), "Statutes of Canada, Chapter 33", June. Viewed at: http://www.parl.gc.ca/content/hoc/Bills/411/Government/C-60/C-60_4/C-60_4.PDF. House of Common (2014a), "The road to balance: creating jobs and opportunities". Economic Action Plan 2014, February. Viewed at: http://actionplan.gc.ca/sites/default/files/pdfs/budget2014-eng.pdf. House of Commons (2014b), "Statutes of Canada 2014, Chapter 20", June. Viewed at: http://www.parl.gc.ca/content/hoc/Bills/412/Government/C-31/C-31_4/C-31_4.PDF.

WT/TPR/S/314 • Canada
- 158 -
IMF (2011) "Canada, 2011 Article IV Consultation", IMF Country Report No. 11/364, December. Viewed at: http://www.imf.org/external/pubs/ft/scr/2011/cr11364.pdf. IMF (2014a), "2013 Article IV Consultation", Canada, February. Viewed at: https://www.imf.org/external/pubs/ft/scr/2014/cr1427.pdf. IMF (2014b), "Concluding Statement of the 2014 Article IV Mission", November. Viewed at: http://www.imf.org/external/np/ms/2014/112614.htm. IMF (2015), "2014 Article IV Consultation", IMF Country Report No. 15/22, January. Viewed at: http://www.imf.org/external/pubs/ft/scr/2015/cr1522.pdf. Milke, M. (2014), Government Subsidies in Canada: A Can$684 Billion Price Tag – Taxpayer Subsidies to Corporations, Government Businesses, and Consumers, Fraser Institute, June. Viewed at: http://www.fraserinstitute.org/uploadedFiles/fraser-ca/Content/research-news/research/publications/government-subsidies-in-canada-a-684-billion-price-tag.pdf. Minister of Justice (2015), "Indian Oil and Gas Act", February. Viewed at: http://laws-lois.justice.gc.ca/PDF/I-7.pdf. Natural Resources Canada (2014), "Energy Markets Fact Book, 2014-2015". Viewed at: http://www.nrcan.gc.ca/sites/www.nrcan.gc.ca/files/energy/files/pdf/2014/14-0173EnergyMarketFacts_e.pdf. OECD (2011), "Managing Risk in Agriculture: Policy Assessment and Design", OECD Publishing. Viewed at: http://www.oecd-ilibrary.org/docserver/download/5111101e.pdf?expires=1424184122&id=id&accname=ocid195767&checksum=F6DD19C337DB5D9352EC343600F9985F. OECD (2012) "Economic Surveys, Canada", June. Viewed at: http://www.oecd.org/eco/50543310.pdf. OECD (2014), "Agricultural Policy Monitoring and Evaluation 2014", OECD Countries, OECD Publishing. Viewed at: http://dx.doi.org/10.1787/agr_pol-2014-7-en. OSFI (2013) "Letter on Final Corporate Governance Guideline", January. Viewed at: http://www.osfi-bsif.gc.ca/Eng/ Docs/CG_let.pdf. OSFI (2014) OSFI Annual Report 2013-2014. Viewed at: http://www.osfi-bsif.gc.ca/eng/docs/ar-ra/1314/eng/ar1314.pdf. Patented Medicine Price Review Board (2014), Annual Report 2013. Viewed at: http://www.pmprb-cepmb.gc.ca/view.asp?ccid=938#1761. Privy Council Office (2003), "A Framework for the Application of Precaution in Science-based Decision Making about Risk". Privy Council Office, Ottawa. Viewed at: http://www.pco-bcp.gc.ca/docs/information/publications/precaution/Precaution-eng.pdf. Science, Technology and Innovation Council Secretariat (2013), State of the Nation 2012. Viewed at: http://www.stic-csti.ca/eic/site/stic-csti.nsf/vwapj/StateOfTheNation2012-may16-eng.pdf/$file/StateOfTheNation2012-may16-eng.pdf. Siebrasse, N. (2012), "The False Doctrine of False Promise", Vol. 29, Canadian Intellectual Property Review, November. Viewed at: http://papers.ssrn.com/sol3/papers.cfm?abstract_id=2171762. Stewart-Patterson, D., Gill, V., and Hoganson, C. (2013), "The Future of Postal Service in Canada". The Conference Board of Canada Report, April, Ottawa. UNCTAD (2014), Global Investment Trends Monitor, No. 15, January. Viewed at: http://unctad.org/en/PublicationsLibrary/webdiaeia2014d1_en.pdf.

WT/TPR/S/314 • Canada
- 159 -
UNCTAD (2015), Global Investment Trends Monitor, No. 18, January. Viewed at: http://unctad.org/en/PublicationsLibrary/webdiaeia2015d1_en.pdf. Van Biesebroeck, J., Yu, E., and Chen, S. (2010), "The Impact of Trade Promotion Services on Canadian Exporter Performance", Canadian Journal of Economics. Viewed at: http://feb.kuleuven.be/public/N07057/CV/vbyc10dfait.pdf. WEF (2013), "Travel & Tourism Competitiveness Report 2013". Viewed at: http://www.weforum.org/reports/travel-tourism-competitiveness-report-2013.

WT/TPR/S/314 • Canada
- 160 -
5 APPENDIX TABLES
Table A1. 1 Canada's Balance of Payments, 2011-14
(Can$ billion) Current account and capital account 2011 2012 2013 2014Current account balance -47.2 -59.9 -56.3 -43.5 Goods and services balance -21.2 -33.8 -30.2 -17.9 Exports of goods 456.6 463.1 479.3 528.6 Exports of services 84.4 90.0 92.5 95.2 Travel 16.6 17.4 18.2 19.3 Transportation 13.6 14.0 14.2 14.7 Other servicesa 54.1 58.6 60.1 61.2 Imports of goods 456.0 474.3 486.5 523.7 Imports of services 106.2 112.7 115.5 117.9 Travel 33.0 35.0 36.2 37.2 Transportation 23.7 23.7 24.0 24.7 Other servicesa 49.5 53.9 55.3 56.0 Primary income balance -23.1 -22.8 -24.2 -24.2 Primary income credit 69.3 73.6 75.2 81.4 Compensation of employees 1.2 1.2 1.2 1.3 Investment income 68.2 72.4 74.0 80.1 Primary income debit 92.4 96.4 99.4 105.7 Compensation of employees 3.1 3.2 3.3 3.4 Investment income 89.3 93.2 96.1 102.3 Secondary income balance -2.9 -3.3 -1.9 -1.4 Credits 9.8 9.7 11.5 11.9 Private transfersb 3.3 2.8 3.6 4.2 Government transfers 6.5 6.8 7.9 7.7 Debits 12.7 13.0 13.4 13.3 Private transfersb 7.2 7.5 7.7 8.1 Government transfers 5.5 5.4 5.7 5.3 Balance on capital account 0.0 -0.1 -0.1 0.0 Credit 0.3 0.3 0.3 0.3 Debit 0.3 0.4 0.4 0.3 Net lending / net borrowing, from current and capital accounts -47.2 -60.1 -56.3 -43.5 Financial account balancec 54.0 59.2 55.7 36.6Net acquisition of financial assets 109.2 122.1 76.8 135.6 Canadian direct investment abroad 51.6 53.9 52.0 58.2 Canadian portfolio investment 18.3 35.1 29.3 56.4 Official international reserves 8.1 1.7 4.9 5.9 Other Canadian investment 31.2 31.3 -9.4 15.1 Net incurrence of liabilities 163.2 181.2 132.5 172.2 Foreign direct investment in Canada 39.3 39.2 72.7 59.6 Foreign portfolio investment 100.5 83.5 43.1 59.8 Other foreign investment 23.4 58.5 16.8 52.8 Net lending / net borrowing, from financial accountd -54.0 -59.2 -55.7 -36.6 Net errors and omissions -6.8 0.9 0.6 6.9
a Other services include both commercial services and government services. b Private transfers and other private transfers include the counterpart of adjustments for insurance
claims volatility made in the insurance services. c In the financial account, a plus sign denotes an increase in investment and a minus sign denotes a
decrease in investment. d A net lending is shown as a plus sign whereas a net borrowing is shown as a minus sign.
Source: Statistics Canada, Cansim tables 376-0101 and 376-0102.

WT/TPR/S/314 • Canada
- 161 -
Table A1. 2 Merchandise exports and re-exports by HS sections, 2011-14
(Can$ million and %) Description 2011 2012 2013 2014Total 446,707 455,171 471,948 524,495 (% of total exports and re-exports) 1 - Live animals and animal products 2.3 2.3 2.4 2.6 2 - Vegetable products 4.4 4.7 4.8 4.9 3 - Animal or vegetable fats and oils and their cleavage products; prepared edible fats; animal or vegetable waxes
0.8 0.9 0.7 0.6
4 - Prepared foodstuffs; beverages, spirits and vinegar; tobacco and manufactures tobacco substitutes
2.3 2.5 2.6 2.6
5 - Mineral products 28.0 27.8 28.4 29.2 6 - Products of the chemical or allied industries 6.7 6.3 6.3 6.0 7 - Plastics and articles thereof; rubber and articles thereof
3.6 3.6 3.6 3.6
8 - Raw hides and skins, leather, furskins and articles thereof; saddlery and harness; travel goods, handbags and similar containers; articles of animal gut (other than silk-worm gut)
0.2 0.3 0.3 0.3
9 - Wood and articles of wood; wood charcoal; cork and articles of cork; manufactures of straw, of esparto or of other plaiting materials; basketware and wickerwork
2.0 2.2 2.7 2.7
10 - Pulp of wood or of other fibrous cellulosic material; recovered (waste and scrap) paper or paperboard
4.1 3.6 3.5 3.4
11 - Textiles and Textile Articles 0.7 0.7 0.7 0.7 12 - Footwear, headgear, umbrellas, sun umbrellas, walking-sticks, seat-sticks, whips, riding-crops and parts thereof; prepared feathers and articles made therewith; artificial flowers; articles of human hair
0.1 0.1 0.1 0.1
13 - Articles of stone, plaster, cement, asbestos, mica or similar materials; ceramic products; glass and glassware
0.4 0.4 0.4 0.4
14 - Natural or cultured pearls, precious or semi- precious stones, precious metals, metals clad with precious metal and articles thereof; imitation jewellery; coin
5.9 5.1 5.1 4.6
15 - Base metals and articles of base metal 8.2 7.5 7.0 7.1 16 - Machinery and mechanical appliances; electrical equipment; parts thereof; sound recorders and reproducers, television image and sound recorders and reproducers, and parts and accessories of such articles
10.4 10.5 9.9 9.7
17 - Vehicles, aircraft, vessels and associated transport equipment
14.0 15.9 15.4 15.4
18 - Optical, photographic, cinematographic, measuring, checking, precision, medical or surgical instruments and apparatus; clocks and watches; musical instruments; parts and accessories thereof
1.3 1.3 1.3 1.3
19 - Arms and ammunition; parts and accessories thereof
0.1 0.1 0.1 0.1
20 - Miscellaneous manufactured articles 1.3 1.4 1.4 1.4 21 - Works of art, collectors' pieces and antiques 3.0 3.0 3.3 3.4
Source: Government of Canada, Statistics Canada, Canada InternationalMerchandise Trade Database.

WT/TPR/S/314 • Canada
- 162 -
Table A1. 3 Merchandise imports by HS sections, 2011-14
(Can$ million and %) Description 2011 2012 2013 2014Total 446,666 462,072 475,630 511,409 (% of total imports) 1 - Live animals and animal products 1.1 1.1 1.2 1.2 2 - Vegetable products 2.3 2.4 2.4 2.5 3 - Animal or vegetable fats and oils and their cleavage products; prepared edible fats; animal or vegetable waxes
0.2 0.2 0.2 0.2
4 - Prepared foodstuffs; beverages, spirits and vinegar; tobacco and manufactures tobacco substitutes
3.8 3.9 4.0 4.1
5 - Mineral products 12.9 12.1 11.8 11.2 6 - Products of the chemical or allied industries 8.4 8.2 8.4 8.4 7 - Plastics and articles thereof; rubber and articles thereof 4.8 4.9 4.8 4.9 8 - Raw hides and skins, leather, furskins and articles thereof; saddlery and harness; travel goods, handbags and similar containers; articles of animal gut (other than silk-worm gut)
0.4 0.4 0.5 0.5
9 - Wood and articles of wood; wood charcoal; cork and articles of cork; manufactures of straw, of esparto or of other plaiting materials; basketware and wickerwork
0.7 0.7 0.7 0.7
10 - Pulp of wood or of other fibrous cellulosic material; recovered (waste and scrap) paper or paperboard
2.1 1.9 1.9 1.9
11 - Textiles and Textile Articles 3.0 2.9 3.0 3.0 12 - Footwear, headgear, umbrellas, sun umbrellas, walking-sticks, seat-sticks, whips, riding-crops and parts thereof; prepared feathers and articles made therewith; artificial flowers; articles of human hair
0.6 0.6 0.6 0.6
13 - Articles of stone, plaster, cement, asbestos, mica or similar materials; ceramic products; glass and glassware
1.1 1.1 1.1 1.2
14 - Natural or cultured pearls, precious or semi-precious stones, precious metals, metals clad with precious metal and articles thereof; imitation jewellery; coin
3.9 3.3 3.0 2.8
15 - Base metals and articles of base metal 6.8 6.9 6.6 7.0 16 - Machinery and mechanical appliances; electrical equipment; parts thereof; sound recorders and reproducers, television image and sound recorders and reproducers, and parts and accessories of such articles
24.3 24.4 24.1 24.1
17 - Vehicles, aircraft, vessels and associated transport equipment
16.1 17.0 17.4 17.4
18 - Optical, photographic, cinematographic, measuring, checking, precision, medical or surgical instruments and apparatus; clocks and watches; musical instruments; parts and accessories thereof
2.9 3.1 3.0 2.9
19 - Arms and ammunition; parts and accessories thereof 0.1 0.1 0.1 0.1 20 - Miscellaneous manufactured articles 2.9 3.1 3.2 3.2 21 - Works of art, collectors' pieces and antiques 1.6 1.6 1.9 1.9
Source: Government of Canada, Statistics Canada, Canada International Merchandise Trade Database.

WT/TPR/S/314 • Canada
- 163 -
Table A1. 4 Merchandise exports and re-exports by trading partner, 2011-14
(Can$ million and %) Description 2011 2012 2013 2014Total exports and re-exports 446,707 455,171 471,948 524,495 (% of exports and re-exports) America 76.8 77.6 78.7 79.5 United States 73.6 74.5 75.9 76.8 Other America 3.2 3.1 2.9 2.7 Mexico 1.2 1.2 1.1 1.0 Brazil 0.6 0.6 0.5 0.4 Chile 0.2 0.2 0.2 0.2 Colombia 0.2 0.2 0.2 0.2 Peru 0.1 0.1 0.1 0.2 Venezuela 0.1 0.2 0.2 0.1 Cuba 0.1 0.1 0.1 0.1 Trinidad & Tobago 0.1 0.1 0.1 0.1 Ecuador 0.1 0.1 0.1 0.1 Argentina 0.1 0.1 0.1 0.0 Europe 10.2 9.5 8.1 8.3 EU(28) 9.0 8.6 7.0 7.4 United Kingdom 4.2 4.1 3.0 2.9 Italy 0.4 0.4 0.4 0.8 Netherlands 1.1 1.0 0.8 0.7 Belgium 0.5 0.5 0.5 0.6 France 0.7 0.7 0.7 0.6 EFTA 0.9 0.7 0.8 0.7 Norway 0.6 0.5 0.4 0.4 Switzerland 0.3 0.2 0.4 0.3 Other Europe 0.3 0.2 0.2 0.2 Turkey 0.3 0.2 0.2 0.2 Commonwealth of Independent States (CIS)a 0.4 0.5 0.4 0.3 Russian Federation 0.3 0.4 0.3 0.2 Africa 0.8 0.8 0.8 0.9 Botswana 0.0 0.0 0.1 0.1 Nigeria 0.1 0.1 0.1 0.1 Egypt 0.2 0.1 0.1 0.1 Middle East 0.8 1.0 0.8 0.9 United Arab Emirates 0.3 0.3 0.3 0.3 Saudi Arabia 0.2 0.3 0.2 0.2 Asia 10.9 10.6 11.1 10.1 China 3.8 4.3 4.3 3.7 Japan 2.4 2.3 2.3 2.0 Six East Asian Traders 2.7 2.2 2.6 2.5 Hong Kong, China 0.7 0.5 1.0 0.9 Korea, Republic of 1.1 0.8 0.7 0.8 Chinese Taipei 0.4 0.3 0.3 0.3 Singapore 0.2 0.2 0.2 0.2 Malaysia 0.2 0.2 0.2 0.2 Thailand 0.2 0.2 0.2 0.1
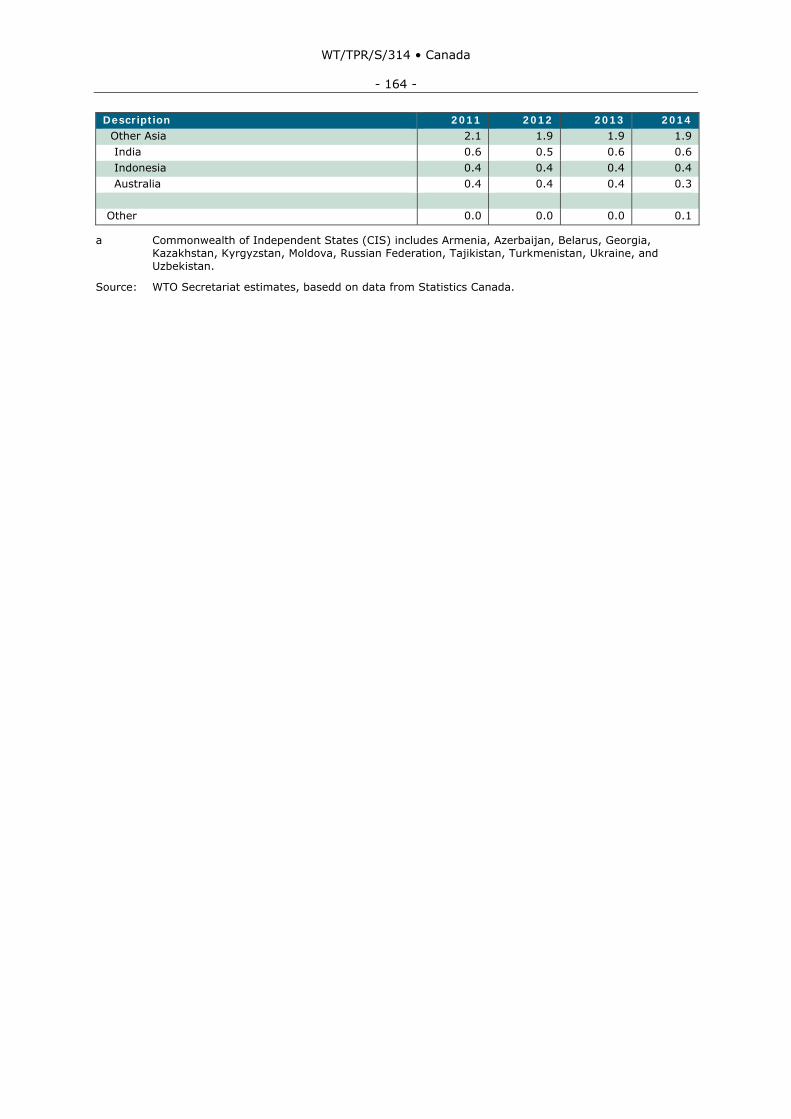
WT/TPR/S/314 • Canada
- 164 -
Description 2011 2012 2013 2014 Other Asia 2.1 1.9 1.9 1.9 India 0.6 0.5 0.6 0.6 Indonesia 0.4 0.4 0.4 0.4 Australia 0.4 0.4 0.4 0.3 Other 0.0 0.0 0.0 0.1
a Commonwealth of Independent States (CIS) includes Armenia, Azerbaijan, Belarus, Georgia, Kazakhstan, Kyrgyzstan, Moldova, Russian Federation, Tajikistan, Turkmenistan, Ukraine, and Uzbekistan.
Source: WTO Secretariat estimates, basedd on data from Statistics Canada.

WT/TPR/S/314 • Canada
- 165 -
Table A1. 5 Merchandise imports by trading partner, 2011-14
(Can$ million and %) Description 2011 2012 2013 2014Total imports 446,666 462,072 475,630 511,409 (% of imports) America 59.2 59.8 61.2 63.3 United States 49.6 50.6 52.1 54.3 Other America 9.6 9.1 9.1 9.0 Mexico 5.5 5.5 5.6 5.6 Brazil 0.9 0.9 0.8 0.7 Peru 1.0 0.8 0.6 0.6 Argentina 0.5 0.5 0.4 0.4 Chile 0.4 0.4 0.4 0.3 Dominican Republic 0.0 0.1 0.3 0.3 Colombia 0.2 0.1 0.1 0.2 Europe 13.6 12.9 13.1 12.8 EU(28) 11.7 10.9 11.2 11.3 Germany 2.9 3.1 3.2 3.1 United Kingdom 2.3 1.8 1.8 1.8 Italy 1.1 1.1 1.2 1.3 France 1.2 1.1 1.1 1.2 EFTA 1.7 1.6 1.6 1.2 Switzerland 0.7 0.8 0.8 0.8 Norway 1.0 0.8 0.8 0.4 Other Europe 0.3 0.3 0.3 0.3 Turkey 0.3 0.3 0.3 0.3 Commonwealth of Independent States (CIS)a 1.1 1.3 0.9 0.4 Russian Federation 0.3 0.2 0.2 0.1 Kazakhstan 0.6 0.7 0.5 0.1 Africa 3.2 2.9 2.0 1.2 Algeria 1.2 1.3 0.7 0.3 Angola 0.5 0.4 0.3 0.2 Middle East 1.7 1.8 1.6 1.2 Saudi Arabia 0.6 0.6 0.6 0.5 Iraq 0.6 0.9 0.7 0.4 Asia 20.2 20.7 20.4 20.4 China 10.8 11.0 11.1 11.5 Japan 2.9 3.3 2.9 2.6 Six East Asian Traders 4.1 3.9 3.8 3.7 Korea, Republic of 1.5 1.5 1.5 1.5 Chinese Taipei 1.1 1.0 1.0 0.9 Thailand 0.6 0.6 0.6 0.6 Malaysia 0.5 0.5 0.5 0.5 Singapore 0.3 0.3 0.3 0.2 Hong Kong, China 0.1 0.1 0.1 0.1 Other Asia 2.4 2.6 2.6 2.6 India 0.6 0.6 0.6 0.6 Viet Nam 0.3 0.4 0.5 0.6

WT/TPR/S/314 • Canada
- 166 -
Description 2011 2012 2013 2014 Indonesia 0.3 0.3 0.3 0.3 Australia 0.4 0.5 0.4 0.3 Other 0.9 0.6 0.8 0.7
a Commonwealth of Independent States (CIS) includes Armenia, Azerbaijan, Belarus, Georgia, Kazakhstan, Kyrgyzstan, Moldova, Russian Federation, Tajikistan, Turkmenistan, Ukraine, and Uzbekistan.
Source: WTO Secretariat estimates, based on data from Statistics Canada.

WT/TPR/S/314 • Canada
- 167 -
Table A2. 1 Canada's Involvement in Dispute Settlement Cases, 1 January 2011-1 January 2015
Subject Respondent/ complainant/
appellant
Request for consultation
received/ compliance
panel established
Status (as at 30 October
2014)
WTO document
series
Requests for consultations China – Anti-dumping Measures on imports of cellulose pulp from Canada
China/Canada 15-Oct-14 Consultations WT/DS483
Panels Canada as a respondant: Canada – Measures Relating to the Feed-in Tariff Program
Canada/EU 11-Aug-11 Implementation, under bilateral surveillance
WT/DS426
Canada – Anti-dumping Measures on Imports of Certain Carbon Steel Welded Pipe from the Separate Customs Territory of Taiwan, Penghu, Kinmen and Matsu
Canada/Chinese Taipei
25-Jun-14 Consultations WT/DS482
Canada as a third party: China – Rare Earths China/US-EU-
Japan 13-Mar-12 Implementation WT/DS431,
432, and 433 Australia – Plain Packaging Australia 13-Mar-12, 4-
Apr-12, 18-Jul-12, 3-May-13, 20-Sept-13
Panel established, interim report pending
WT/DS434, 435, 441, 458 and 467
US – Countervailing Measures on Certain Hot-Rolled Carbon Steel Flat Products from India
US/India 12-Apr-12 Appeal filed WT/DS436
US – Countervailing Duty Measures on Certain Products from China
US/China 25-May-12 Appeal filed WT/DS437
Argentina – Import Measures
Argentina/EU-US-Japan
25-May-12, 21-Aug-12
Appeal filed WT/DS438, 444, and 445
US — Countervailing and Anti-Dumping Measures (China)
US/China 17-Sep-12 Implementation WT/DS449
India – Certain Measures Relating to Solar Cells and Solar Modules
India/US 6-Feb-13 Panel established, interim report pending
WT/DS456
Brazil – Certain Measures Concerning Taxation and Charges
Brazil/EU 19-Dec-13 Panel request pending
WT/DS472
European Union – Cost Adjustment Methodologies and Certain Anti-dumping Measures on Imports from Russia
EU/Russia 23-Dec-13 Panel established, but not yet composed
WT/DS474
Indonesia - Importation of Horticultural Products, Animals and Animal Products
Indonesia/United States
10-Jan-13 Panel established, but not yet composed
WT/DS455
United States - Certain Methodologies and their Application to Anti-Dumping Proceedings involving China
United States/ China
3-Dec-13 Panel established, interim report pending
WT/DS471

WT/TPR/S/314 • Canada
- 168 -
Subject Respondent/ complainant/
appellant
Request for consultation
received/ compliance
panel established
Status (as at 30 October
2014)
WTO document
series
United States - Anti-Dumping and Countervailing Measures on Large Residential Washers from Korea
United States/ Korea
29-Aug-13 Panel established, interim report pending
WT/DS464
Compliance Panel under Article 21.5 United States – Certain Country of Origin Labelling (COOL) Requirements
US/Canada 25-Sep-13 Reports circulated, DSB adoption pending
WT/DS384
Source: WTO Secretariat and information provided by Canadian authorities.

WT/TPR/S/314 • Canada
- 169 -
Table A2. 2 Selected Notifications to the WTO, 1 January 2011-1 January 2015
WTO Agreement
Description Document symbol Date
Agreement on Agriculture Articles 10 and 18.2 (ES:1, ES:2, and ES:3)
Export subsidies commitments: budgetary outlays and quantity reduction commitments; and notification of total exports
G/AG/N/CAN/101 G/AG/N/CAN/92
26/09/2014 16/07/2012
Article 16.2 NF:1 (1)-(4)
Net-food Importing Developing Country (NFIDC) Decision: food and other assistance; and other specific actions
G/AG/N/CAN/100 G/AG/N/CAN/93 G/AG/N/CAN/88
22/09/2014 17/10/2012 03/11/2011
Article 18.2 (DS:1)
Domestic support G/AG/N/CAN/98 G/AG/N/CAN/96 G/AG/N/CAN/90 G/AG/N/CAN/86
14/04/2014 13/03/2013 30/04/2012 14/10/2011
Article 18.2 (MA:1)
Administration of tariff and other quota commitments
G/AG/N/CAN/87/Rev.1 G/AG/N/CAN/87
24/02/2012 03/11/2011
Article 18.2 (MA:2)
Tariff quotas G/AG/N/CAN/103 G/AG/N/CAN/95 G/AG/N/CAN/89 G/AG/N/CAN/85 G/AG/N/CAN/83
18/11/2014 11/01/2013 24/02/2012 07/10/2011 13/01/2011
Article 18.3 (DS:2)
New or modified exempt domestic support measures
G/AG/N/CAN/99 G/AG/N/CAN/97 G/AG/N/CAN/91
14/04/2014 13/03/2013 30/04/2012
Articles 5.7 and 18.2 (MA:5)
Special safeguard provisions G/AG/N/CAN/102 G/AG/N/CAN/94 G/AG/N/CAN/84
11/11/2014 11/01/2013 05/10/2011
General Agreement on Trade in Services Article III:3 Notification pursuant to Article III:3 of GATS S/C/N/679 26/02/2013 Article III:4 or IV:2
Contact and enquiry points S/ENQ/78/Rev.14 25/10/2013
Article V:7(a)(3)
Economic integration agreements: Canada-Korea, Canada-Chile, Canada-Colombia, Canada-Panama
S/C/N/789 S/C/N/65/Add.1 S/C/N/691 S/C/N/602
20/01/2015 14/01/2014 12/04/2013 11/10/2011
Agreement on the Implementation of Article VI of the GATT 1994 (Anti-Dumping Agreement) Article 16.4 – ad hoc
Anti-dumping actions (preliminary and final) G/ADP/N/263 G/ADP/N/261 G/ADP/N/260 G/ADP/N/258 G/ADP/N/254 G/ADP/N/251 G/ADP/N/248 G/ADP/N/247 G/ADP/N/246 G/ADP/N/243 G/ADP/N/242 G/ADP/N/241 G/ADP/N/239 G/ADP/N/238 G/ADP/N/234 G/ADP/N/232 G/ADP/N/229 G/ADP/N/227 G/ADP/N/215 G/ADP/N/211 G/ADP/N/210
15/10/2014 19/08/2014 15/07/2014 19/06/2014 17/02/2014 19/12/2013 14/10/2013 13/09/2013 19/08/2013 17/06/2013 30/05/2013 16/04/2013 18/02/2013 21/01/2013 16/10/2012 10/08/2012 13/06/2012 04/04/2012 21/06/2011 22/02/2011 18/01/2011

WT/TPR/S/314 • Canada
- 170 -
WTO Agreement
Description Document symbol Date
Article 16.4 – semi annual
Anti-dumping actions (taken within the preceding six months)
G/ADP/N/259/CAN G/ADP/N/252/CAN G/ADP/N/244/CAN G/ADP/N/237/CAN G/ADP/N/230/CAN G/ADP/N/223/CAN G/ADP/N/216/CAN/Rev.1 G/ADP/N/216/CAN G/ADP/N/209/CAN
22/08/2014 03/03/2014 11/09/2013 21/02/2013 06/08/2012 22/03/2012 29/11/2011 21/09/2011 16/03/2011
GATT 1994 Article XXIV:7(a) of GATT 1994 and Article V:7(a) of GATS
Free-trade areas: Canada-Korea, Canada-Chile, Canada-Jordan, Canada-Colombia, Canada-Panama
WT/REG362/N/1 WT/REG38/N/1/Add.2 WT/REG335/N/1 WT/REG334/N/1 WT/REG301/N/1
20/01/2015 14/01/2014 12/04/2013 12/04/2013 11/10/2011
Article XVII:4(a) and Paragraph 1 of the Understanding on the Interpretation of Article XVII
State trading activities
G/STR/N/15/CAN G/STR/N/14/CAN G/STR/N/13/CAN/Add.1
08/07/2014 06/07/2012 19/07/2012
Committee on Trade and Development
Generalized System of Preferences WT/COMTD/N/15/Add.3 17/11/2014
Article XXVIII:5
Invocation of paragraph 5 of Article XXVIII G/MA/299 G/MA/253
17/10/2014 29/09/2011
Agreement on Government Procurement Work Programme on Exclusions
Notification pursuant to paragraph 2 of the Committee's Decision on a work programme on exclusions and restrictions in parties' annexes
GPA/WPS/EXCS/1 22/10/2014
Agreement on Import Licensing Article 7.3 Replies to the questionnaire G/LIC/N/3/CAN/12
G/LIC/N/3/CAN/11 G/LIC/N/3/CAN/10
04/04/2014 02/11/2012 18/11/2011
Decision on Notification Procedures for Quantitative Restrictions G/L/59/Rev.1 Notification of QRs G/MA/QR/N/CAN/2
G/MA/QR/N/CAN/1 24/10/2014 03/12/2012
Agreement on Rules of Origin Paragraph 4 of Annex II
Preferential rules of origin G/RO/N/111 G/RO/N/102 G/RO/N/101 G/RO/N/71
02/04/2014 19/09/2013 19/09/2013 05/07/2011
Agreement on Subsidies and Countervailing Measures Article 25.1 and GATT 1994 Article XVI:1
Subsidies G/SCM/N/71/CAN G/SCM/N/253/CAN G/SCM/N/220/CAN
28/10/2013 19/07/2013 14/07/2011

WT/TPR/S/314 • Canada
- 171 -
WTO Agreement
Description Document symbol Date
Article 25.11 – ad hoc
Countervailing duty actions (preliminary and final)
G/SCM/N/279 G/SCM/N/277 G/SCM/N/276 G/SCM/N/269 G/SCM/N/266 G/SCM/N/263 G/SCM/N/262 G/SCM/N/258 G/SCM/N/257 G/SCM/N/256 G/SCM/N/254 G/SCM/N/252 G/SCM/N/247 G/SCM/N/246 G/SCM/N/245 G/SCM/N/241 G/SCM/N/239 G/SCM/N/227 G/SCM/N/222 G/SCM/N/221
15/10/2014 25/08/2014 11/07/2014 14/02/2014 09/12/2013 12/09/2013 02/08/2013 12/06/2013 16/05/2013 10/04/2013 12/02/2013 22/01/2013 05/10/2012 17/09/2012 07/08/2012 07/06/2012 05/04/2012 17/06/2011 16/02/2011 13/01/2011
Article 25.11 - semi
Countervailing duty actions (taken within the preceding six months)
G/SCM/N/274/CAN G/SCM/N/267/CAN G/SCM/N/259/CAN G/SCM/N/250/CAN G/SCM/N/242/CAN G/SCM/N/235/CAN G/SCM/N/228/CAN G/SCM/N/219/CAN
29/08/2014 05/03/2014 11/09/2013 22/03/2013 23/08/2012 23/03/2012 21/09/2011 18/03/2011
Agreement on Sanitary and Phytosanitary Measures Article 7 Annex B
Sanitary and phytosanitary regulations Many notifications received, please see: http://www.wto.org/english/tratop_e/sps_e/work_and_doc_e.htm
Agreement on Technical Barriers to Trade Article 2.10 TBT Notification G/TBT/N/CAN/354
G/TBT/N/CAN/355 22/12/2011 22/12/2011
Article 2.9 Technical regulations Many notifications received, please see http://tbtims.wto.org/
Articles 2.9 and 5.6
Technical regulations and conformity assessment procedures
Many notifications received, please see http://tbtims.wto.org/
Article 5.6 TBT Notification G/TBT/N/CAN/365/Rev.1 G/TBT/N/CAN/365 G/TBT/N/CAN/111/Add.8 G/TBT/N/CAN/71/Add.2 G/TBT/N/CAN/300/Add.1
24/08/2012 18/06/2012 03/10/2012 14/02/2012 18/04/2011
Article 5.7 TBT Notification G/TBT/N/CAN/356 13/01/2012 Article unspecified
Technical regulations G/TBT/N/CAN/376
13/11/2012
Agreement on Trade-Related Aspects of Intellectual Property Rights Article 63.2 Laws / regulations; amendment of a law /
regulation IP/N/1/CAN/C/3 IP/N/1/CAN/3
11/01/2013 19/12/2012

WT/TPR/S/314 • Canada
- 172 -
WTO Agreement
Description Document symbol Date
Article 67 Member's Contact Points for technical cooperation
IP/N/7/CAN/1 07/11/2012
Article 69 Member's Contact Points IP/N/3/CAN/1 07/11/2012
Source: WTO Secretariat.

WT/TPR/S/314 • Canada
- 173 -
Table A2. 3 List of beneficiaries of Canada's unilateral preference programmes as provided by Canada
Country GPT LDCT CCCT Afghanistan √ √ Algeria * American Samoa * Angola √ √ Anguilla √ √ Antigua and Barbuda * √ Antilles, Netherlands * Argentina * Armenia √ Ascension Island √ Azerbaijan * Bahamas * √ Bahrain * Bangladesh √ √ Barbados * √ Belize √ √ Benin √ √ Bermuda * √ Bhutan √ √ Bolivia √ Bosnia and Herzegovina
*
Botswana * Brazil * British Indian Ocean Territory
√
Brunei Darussalam * Burkina Faso √ √ Burundi √ √ Cambodia √ √ Cameroon √ Cape Verde √ √ Cayman Islands * √ Central African Republic
√ √
Chad √ √ Chile * China * Christmas Island √ Cocos (Keeling) Islands
√
Colombia * Comoros √ √ Congo √ Cook Islands √ Costa Rica * Côte d'Ivoire √ Croatia * Cuba * Democratic Republic of Congo
√ √
Djibouti √ √ Dominica * √ Dominican Republic * Ecuador * Egypt √ El Salvador √ Equatorial Guinea * * Eritrea √ √ Ethiopia √ √ Falkland Islands √ Fiji √ French Polynesia * Gabon * Gambia √ √ Georgia √

WT/TPR/S/314 • Canada
- 174 -
Country GPT LDCT CCCT Ghana √ Gibraltar * Grenada * √ Guam * Guatemala √ Guinea √ √ Guinea-Bissau √ √ Guyana √ √ Haiti √ √ Honduras √ Hong Kong, China * India * Indonesia * Iran * Iraq √ Israel * Jamaica * √ Jordan * Kazakhstan * Kenya √ Kiribati √ √ Kuwait * Kyrgystan √ Laos √ √ Lebanon * Lesotho √ √ Liberia √ √ Macao China * Macedonia * Madagascar √ √ Malawi √ √ Malaysia * Maldives * * Mali √ √ Mariana Islands * Marshall Islands √ Mauritania √ √ Mauritius * Mexico * Micronesia √ Moldova √ Mongolia √ Montserrat √ √ Morocco √ Mozambique √ √ Namibia * Nauru √ Nepal √ √ New Caledonia and Dependencies
*
Nicaragua √ Niger √ √ Nigeria √ Niue √ Norfolk Island √ North Africa (Spanish) √ Oman * Pakistan √ Palau * Panama * Papua New Guinea √ Paraguay √ Peru * Philippines √ Pitcairn √ Qatar * Russian Federation * Rwanda √ √

WT/TPR/S/314 • Canada
- 175 -
Country GPT LDCT CCCT Saint Helena and Dependencies
√
Saint Kitts and Nevis * √ Saint Lucia * √ Saint Vincent and the Grenadines
* √
Samoa √ √ Sao Tome and Principe √ √ Senegal √ √ Seychelles * Sierra Leone √ √ Singapore * Solomon Islands √ √ Somalia √ √ South Africa * Republic of Korea * South Sudan √ √ Southern and Antarctic Territories (French)
√
Sri Lanka √ Sudan √ √ Suriname * Swaziland √ Syria √ Tajikistan √ Tanzania √ √ Thailand * Timor-Leste √ √ Togo √ √ Tokelau Islands √ Tonga √ Trinidad and Tobago * √ Tristan Da Cunha √ Tunisia * Turkey * Turkmenistan √ Turks and Caicos Islands
* √
Tuvalu √ √ Uganda √ √ Ukraine √ United Arab Emirates * Uruguay * Uzbekistan √ Vanuatu √ √ Venezuela * Viet Nam √ Virgin Islands (British) √ √ Virgin Islands (U.S.A.) * Yemen √ √ Zambia √ √ Zimbabwe √
* Eligibility removed as of 1 January 2015.
Source: Canada Customs Tariff 2014 and information provided by Canadian authorities.

WT/TPR/S/314 • Canada
- 176 -
Table A3. 1 Canadian participation in conformity assessment agreements, 2014
Signatories Instrument type Coverage Standards Council of Canada (SCC) and American National Standards Institute and the Registrar Accreditation Board (ANSI-RAB, United States)
Memorandum of Understanding (MoU) – 1991
Cooperation in the harmonization of standardization and conformity assessment activities.
SCC and American Society for Quality National Accreditation Board (ANAB, United States), Joint Accreditation System of Australia and New Zealand (JAS-ANZ), the Japan Accreditation Board for Conformity Assessment, and Entidad Mexicana de Acreditación (Mexico)
Mutual Cooperative Accreditation Arrangement (MCAA) - 2005
Recognition of quality and environmental management systems assessment and accreditation results.
SCC and Standardization Administration of China (SAC)
Cooperation Agreement - 2005
Exchange of information on standards development and conformity assessment
SCC and other Inter-American Accreditation Co-operation (IAAC) bodies
Mutual Recognition Agreement (MRA) - 2002
Mutual recognition of laboratory, quality management system, and certification procedures.
SCC and other International Accreditation Forum (IAF) bodies
MRA – 1998 Recognition of quality management system, environmental management system, and product certification body accreditations.
SCC and other International Laboratory Accreditation Cooperation (ILAC) bodies
MRA – 2000 Recognition of laboratory accreditations.
SCC and other Asia-Pacific Laboratory Accreditation Cooperation (APLAC) bodies
MRA – 2000 Recognition of laboratory accreditations.
Canada, Mexico, and the United States (all three as part of the North American Calibration Committee – NACC)
MoU – 2001 Promotion of the harmonization of laboratory accreditation systems and development of mutual confidence in measurements of accredited laboratories.
National Research Council (Canada), Centro Nacional de Metrología (Mexico), and National Institute of Standards and Technology (all three as part of the North American Metrology Co-operation - NORAMET)
MRA – 1999 Technical cooperation on the methodologies and application of metrological activities.
SCC and Occupational Health and Safety Administration (OSHA, United States)
Cooperation Arrangement - 1997
Information exchange, participation in assessments, and policy and procedure harmonization.
SCC and other Pacific Accreditation Co-operation (PAC) bodies
MRA – 1998 Recognition of quality management system, environmental management system, and product certification body accreditations.
Canada and other APEC members MRA Product certification procedures and results for terminal equipment, radio equipment, EMC and electrical safety.
Canada and EEA EFTA members (Iceland, Liechtenstein, and Norway)
MRAa Telecoms, Electromagnetic compatibility (EMC), recreational craft, medical devices (not implemented), electrical safety (not implemented), GMP-Pharma.
Canada and the European Community MRAa Telecoms, EMC, recreational craft, medical devices (not implemented), electrical safety (not implemented), GMP-Pharma.

WT/TPR/S/314 • Canada
- 177 -
Signatories Instrument type Coverage Canada and Switzerland MRAa Telecoms, EMC, medical devices (not
implemented), electrical safety (not implemented), GMP-Pharma.
Canada and other members of the Inter-American Telecommunication Commission (CITEL)
MRA Product certification procedures and results for terminal equipment, radio equipment, EMC and electrical safety.
Canada and Australia MRA Certification and acceptance of certificates of good manufacturing practice of manufacturers of medicinal products.
a Legally binding.
Source: WTO Secretariat, based on information provided by the Canadian authorities.
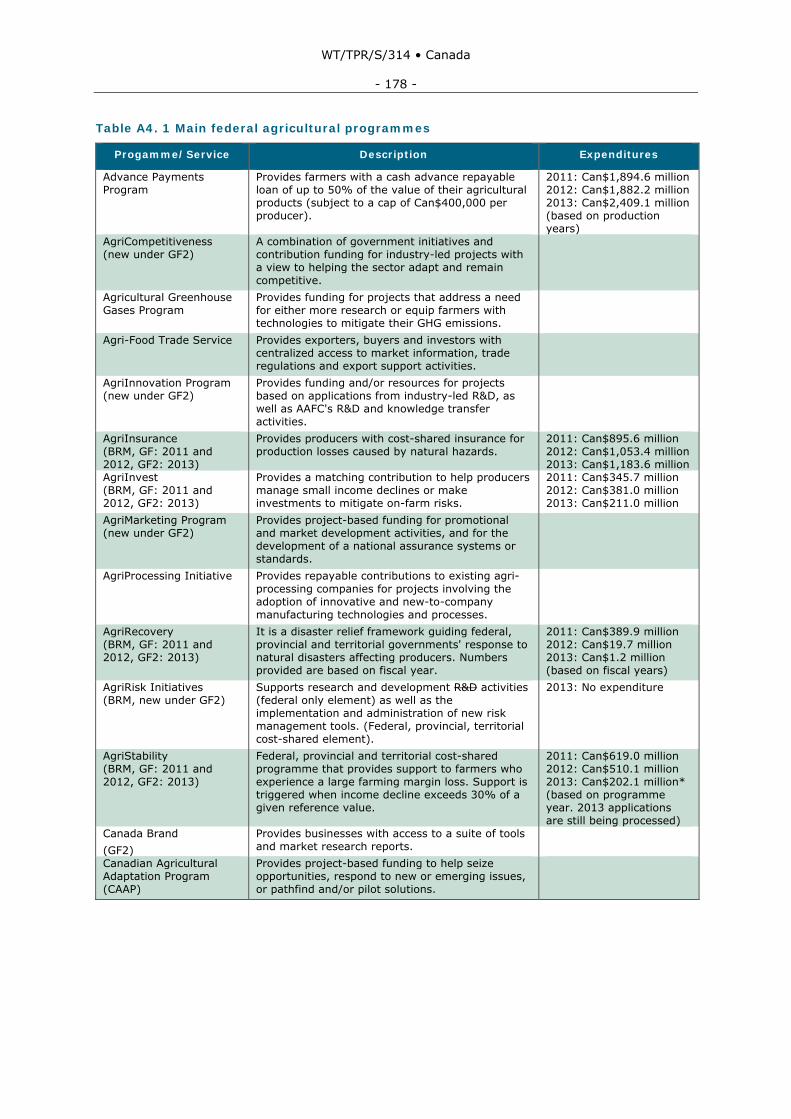
WT/TPR/S/314 • Canada
- 178 -
Table A4. 1 Main federal agricultural programmes
Progamme/Service Description Expenditures
Advance Payments Program
Provides farmers with a cash advance repayable loan of up to 50% of the value of their agricultural products (subject to a cap of Can$400,000 per producer).
2011: Can$1,894.6 million 2012: Can$1,882.2 million 2013: Can$2,409.1 million (based on production years)
AgriCompetitiveness (new under GF2)
A combination of government initiatives and contribution funding for industry-led projects with a view to helping the sector adapt and remain competitive.
Agricultural Greenhouse Gases Program
Provides funding for projects that address a need for either more research or equip farmers with technologies to mitigate their GHG emissions.
Agri-Food Trade Service Provides exporters, buyers and investors with centralized access to market information, trade regulations and export support activities.
AgriInnovation Program (new under GF2)
Provides funding and/or resources for projects based on applications from industry-led R&D, as well as AAFC's R&D and knowledge transfer activities.
AgriInsurance (BRM, GF: 2011 and 2012, GF2: 2013)
Provides producers with cost-shared insurance for production losses caused by natural hazards.
2011: Can$895.6 million 2012: Can$1,053.4 million 2013: Can$1,183.6 million
AgriInvest
(BRM, GF: 2011 and 2012, GF2: 2013)
Provides a matching contribution to help producers manage small income declines or make investments to mitigate on-farm risks.
2011: Can$345.7 million 2012: Can$381.0 million 2013: Can$211.0 million
AgriMarketing Program (new under GF2)
Provides project-based funding for promotional and market development activities, and for the development of a national assurance systems or standards.
AgriProcessing Initiative
Provides repayable contributions to existing agri-processing companies for projects involving the adoption of innovative and new-to-company manufacturing technologies and processes.
AgriRecovery (BRM, GF: 2011 and 2012, GF2: 2013)
It is a disaster relief framework guiding federal, provincial and territorial governments' response to natural disasters affecting producers. Numbers provided are based on fiscal year.
2011: Can$389.9 million 2012: Can$19.7 million 2013: Can$1.2 million (based on fiscal years)
AgriRisk Initiatives
(BRM, new under GF2) Supports research and development R&D activities (federal only element) as well as the implementation and administration of new risk management tools. (Federal, provincial, territorial cost-shared element).
2013: No expenditure
AgriStability
(BRM, GF: 2011 and 2012, GF2: 2013)
Federal, provincial and territorial cost-shared programme that provides support to farmers who experience a large farming margin loss. Support is triggered when income decline exceeds 30% of a given reference value.
2011: Can$619.0 million 2012: Can$510.1 million 2013: Can$202.1 million* (based on programme year. 2013 applications are still being processed)
Canada Brand
(GF2) Provides businesses with access to a suite of tools and market research reports.
Canadian Agricultural Adaptation Program (CAAP)
Provides project-based funding to help seize opportunities, respond to new or emerging issues, or pathfind and/or pilot solutions.

WT/TPR/S/314 • Canada
- 179 -
Progamme/Service Description Expenditures
Canadian Agricultural Loans Act Program (CALA)
Federal-only programme that provides loan guarantees to help farmers establish or develop farms, and agricultural cooperatives, process, distribute or market farm products.
2011: Can$131.6 million 2012: Can$106.9 million 2013: Can$113.1 million (Based on fiscal year. Numbers represents the values of loans issued by financial institutions under the guarantee)
Canadian Animal Genetic Resources (CAGR)
Aims at preserving the genetic diversity of the livestock and poultry breeds, and developing new techniques for germplasm conservation.
Career Focus Program Covers 50% of eligible costs for projects that hire recent graduates in agriculture, agri-food science and veterinary medicine.
Churchill Port Utilisation Program
Provides financial incentives to legal entities that arrange for/transact the shipment of eligible grain through the Port of Churchill (the incentive rate for 2014 was Can$9.20 per tonne).
Community Pasture Program
Promotes land conservation, protecting it from deterioration due to drought while utilizing it primarily for the grazing and breeding of livestock.
Drought Watch Provides timely information to the agricultural sector in order to identify the impacts of climatic variability on water supply and agriculture.
Farm Debt Mediation Service
Provides financial counselling and mediation services to farmers in financial difficulty.
Food Research and Development Centre's Industrial Program
Provides direct access to sophisticated equipment and a versatile R&D environment to agri-food companies in order to assist with small-scale food processing and testing needs, and to foster innovation.
Geospatial Products Provides online access to agriculture-related maps, geospatial data and tools.
Livestock Auction Traceability Initiative (LATI)
Provides project-based funding to livestock facility owners/managers for the alteration of animal handling structures, to enhance traceability capabilities at high-risk, high through-put co-mingling sites.
Minor Use Pesticides Program
Works with various stakeholders to establish producer-selected pest problems on minor crops, match them with pesticides and prepare regulatory submissions for new minor uses of pesticides.
Office of Intellectual Property and Commercialization (OIPC)
Supports the development and transfer of the results of research efforts by AAFC's research branch.
Pesticide Risk Reduction Program
Develops pesticide risk reduction strategies and associated tools, practices and technologies.
Price Pooling Program Provides marketing agencies and producers with a price guarantee for eligible products, to assist and encourage cooperative marketing.
Source: Information provided by the Canadian authorities.

WT/TPR/S/314 • Canada
- 180 -
Table A4. 2 Information sharing agreements concluded by OSFI with foreign supervisors (as of January 2015)
Partner Regulatory Authority Sector(s)
Australia Australian Prudential Regulation Authority Banking and Insurance
Bahamas Central Bank of The Bahamas Banking
Barbados Central Bank of Barbados Banking
Belgium Banking, Finance and Insurance Commission Banking and Insurance
Belgium/Luxembourg Banking, Finance and Insurance Commission/ Commission de Surveillance du Secteur Financier
RBC/Dexia (joint venture specific)
Bermuda Bermuda Monetary Authority Banking and Insurance
British Virgin Islands British Virgin Islands Financial Services Commission Banking
Cayman Islands Cayman Islands Monetary Authority Banking and Insurance
Chile Superintendencia de Bancos e Instituciones Financieras Chile
Banking
China China Banking Regulatory Commission Banking
Costa Rica Superintendencia General de Entidades Financieras Banking
Dominican Republic Superintendent of Banks of the Dominican Republic Banking
Dubai Dubai Financial Services Authority Banking and Insurance
El Salvador Superintendencia del Sistema Financiero Banking
France Commission bancaire Banking
Germany Federal Financial Supervisory Authority Banking and Insurance
Hong Kong, China Hong Kong Insurance Authority Hong Kong Monetary Authority
Insurance Banking
Ireland Central Bank of Ireland Banking and Insurance
Jersey Jersey Financial Services Commission Banking and Insurance
Mexico National Banking and Securities Commission Banking
Netherlands De Nederlandsche Bank Banking and Insurance
Panama Superintendency of Banks of the Republic of Panama Banking
Peru Superintendence of Banks, Insurance and Private Management of Pension Funds
Banking and Insurance
Chinese Taipei Financial Supervisory Commission Banking and Insurance
Thailand Office of Insurance Commission Insurance
Trinidad and Tobago Central Bank of Trinidad and Tobago Banking and Insurance
Turks and Caicos Turks and Caicos Islands Financial Services Commission
Banking and Insurance
United Kingdom Bank of England Prudential Regulation Authority Banking and Insurance

WT/TPR/S/314 • Canada
- 181 -
Partner Regulatory Authority Sector(s)
United States Federal institutions:
• Office of Thrift Supervision Banking and Insurance
• Federal Reserve/Office of the Comptroller of the Currency/Federal Deposit Insurance Corporation
Banking
State-level institutions:
• Connecticut Department of Banking Banking
• Illinois Department of Financial and Professional Regulation
Banking and Insurance
• Massachusetts Division of Insurance Insurance
• Office of Financial and Insurance Regulation (Michigan)
Banking and Insurance
• State of New York Banking Department Banking
• North Carolina Office of the Commissioner of Banks
Banking
Source: Information provided by the Canadian authorities.
__________