trade liberalization, growth and inequality in bangladesh: an
TRANSCRIPT

Trade liberalization, Growth and Inequality in Bangladesh: An Empirical Analysis*
Hiranya K Nath†
and
Khawaja Abdullah Al Mamun‡
(Preliminary)
October 2004
Abstract: This paper examines time series evidence to establish a link between trade, economic growth and income inequality in Bangladesh. The empirical results from a Vector Autoregression (VAR) model suggest that there is some evidence of trade liberalization accelerating growth in Bangladesh. Trade openness promotes investment. We find little evidence of trade affecting income distribution or of income distribution affecting growth or investment. Given poor quality of the data on inequality measures, there is scope for further investigation. Sensitivity analysis with change in the sample time period suggests that during the post independence period investment has significant positive impact on trade liberalization. Keywords: Trade liberalization; Income inequality; VAR Analysis; Generalized impulse response JEL Classification: O1; F1
* This version of the paper has been written for presentation at the 41st Annual Conference of the Missouri Valley Economic Association held in Nashville, TN. Comments are welcome. †Department of Economics and International Business, Sam Houston State University, Huntsville, TX 77320; Phone: 936-294-4760; Fax: 936-294-3488; E-mail: [email protected]. ‡ Department of Economics, Southern Methodist University, Dallas, TX 75275; Phone: 214-768-3637 ; E-mail: [email protected]

1
1. Introduction
Bangladesh, in its quest for growth, has moved from an import-substituting
inward-oriented policy regime towards a more liberalized trade and market oriented
regime. In over three decades of its independence, Bangladesh has witnessed growth in
per capita real GDP, in volume and value of trade and also an increase in income
inequality1. In the trade literature, there are strong arguments and counter-arguments as to
whether trade liberalization promotes growth and leads to a more equitable distribution of
income. But how trade liberalization affects growth and income distribution in a country
is a purely empirical question.
Bangladesh, immediately after its independence in 1971, adopted import-
substitution based inward-oriented economic policies. By the 1980s, the dismal growth
performance of the earlier period and a general euphoria about trade liberalization
reinforced by disillusionment of most developing countries over import-substitution
development strategies they experimented with during the 1950s through the 1970s on
one hand, and by the success of the Asian Tigers with trade-oriented development
strategies on the other, made a case for policy shift in Bangladesh as in many other
developing countries. The statements of Industrial Policy and Trade Policy in the 1980s
recognized the need for greater efficiency and international competitiveness, faster
growth of export-oriented industries, reduction of regulation and control along with tariff
rationalization, a liberalized market-based competitive structure, disinvestment of public
sector enterprises and coordination of industrial and export policies.
1 For a detailed account on the growth of GDP and trade, see Ahmed and Sattar (2004). What has happened to income distribution is controversial. As we will see, the World Bank Deininger and Square Data set indicates a decline in inequality. But two other data sets we use in this study indicate a rise in income inequality. Some recent studies (e.g. Khan and Sen (2001) and Wodon (2000)) have shown that income inequality has risen in the nineties.

2
From the theoretical point of view, trade liberalization will allocate resources to
those areas where Bangladesh has comparative advantage, which in turn will promote
specialization and growth. Trade liberalization is also likely to accelerate investment by
allowing access to bigger markets, permitting scale economies, and encouraging imports
of cheaper capital goods and intermediate inputs. Trade openness rewards a country’s
relatively abundant factor of production – unskilled labor in Bangladesh – by augmenting
real wages. This will most likely improve the income distribution in Bangladesh.
Despite the fact that Bangladesh has adopted trade liberalization as a policy to
achieve higher economic growth there have been few attempts to assess the impact of
trade liberalization on macroeconomic performances. Among the earlier studies, Love
(1995) made a few observations on the changes in the export sector that followed after
Bangladesh had started moving towards a liberalized trade policy regime with emphasis
on export growth. He is, however, skeptical about the success of export-oriented policies
and suggests that Bangladesh should exercise caution in implementing those policies.
Ahmed and Sattar (2004), however, attribute growth and poverty reduction in
recent decades largely to trade liberalization in Bangladesh. They examine both aggregate
and disaggregate data to find that the faster pace of trade liberalization in the 1990s has
much larger impact on growth while reduction in poverty has slowed down during that
period. They ascribe this trend in poverty reduction to slowing down of employment and
real wage growth. Accelerating growth in output and slowing down in poverty reduction
also indicate that the income distribution has worsened. This accords well with the
findings of other empirical research on poverty and inequality in Bangladesh (for
example, Khan and Sen (2001)).

3
Mamun and Nath (2004) examine time series evidence to investigate the link
between exports and economic growth in Bangladesh. Using quarterly data for a period
from 1976 to 2003 they find that industrial production and exports are cointegrated. The
results of an Error Correction Model (ECM) suggest that there is a long-run
unidirectional causality from exports to growth in Bangladesh. By focusing only on
exports they do not take into account the full effects of trade liberalization.
There is an empirical literature that examines poverty and inequality in
Bangladesh. Muqtada (1986) studies the trends in poverty and income inequality during
sixties and seventies. He also examines demographic pressure, land ownership, and
impact of HYV technology as some of the probable determinants of increasing poverty
and income inequality. Khan (1990) observes high inequality in agriculture which he
attributes to interaction among institutional, technological and demographic factors. He
argues that such inequality is a hindrance to poverty alleviation and sustained economic
growth. In a paper that explores the connections between environmental damages,
inequality and poverty in Bangladesh, Khan (1997) argues that a policy that encompasses
environmental quality control may help enhance the poverty reducing effects of growth.
None of these studies, however, examines the relationship between trade liberalization
and income inequality. One limitation of such an endeavor could the lack of reliable data
on inequality in Bangladesh. A cursory look at widely-used World Bank data (Deininger
and Square Data set) on income inequality makes one suspicious about the quality of the
data.
This paper is an attempt to examine the interrelations among trade liberalization,
growth and income distribution in Bangladesh using time series data. We estimate

4
different specifications of a Vector Autoregression (VAR) model. VAR analysis allows
investigation of interrelations among variables without apriori commitment to
established theorems. Our results suggest that there is no strong time series evidence of
trade liberalization accelerating growth in Bangladesh. However, trade openness
promotes investment. We do not find any evidence of trade affecting income distribution
or of income distribution affecting growth or investment. Given poor quality of the data
on inequality measures, there is scope for further investigation.
The rest of the paper is organized as follows. Section 2 discusses data sources and
describes the variables. We present the empirical results from a VAR analysis in the third
section. First we discuss the relationship between trade liberalization and growth, and
then we explore how income inequality fits into the picture. In Section 4 we present
sensitivity analysis. We re-estimate the model with data for post independence period.
The next section summarizes and concludes.
2. Data Sources and Description of the Variables
The data used in this paper have been obtained from several sources. The first set
of data on real GDP, investment, openness – all in per capita terms – comes from the
Penn World Table 6.1 (PWT). These data series cover a period from 1959 to 2000 and
the annual values are in 1996 international dollars. We define the following variables to
be used in the current study:
gdppc = logarithmic value of Real GDP per capita (Laspeyres) [RGDPL in PWT]
invpc = logarithmic value of per capita real investment [RGDPL × KI in PWT]

5
t_ratio = exports plus imports divided by RGDPL [OPENK/100 in PWT], used as
a measure of trade liberalization2
gdp = logarithmic value of real GDP [RGDPL × POP in PWT]
Data on income inequality come from various sources: the ‘high quality data’ for
different years between 1963 and 2000 are obtained from the World Bank Deininger and
Square Data Set compiled from various sources; the second set of inequality data comes
from the World Income Inequality Database (WIID) compiled by the United Nations
University – World Institute of Development Economics Research (UNU-WIDER); and
the third set of data on ‘estimated household income inequality (EHII)’ covering a period
from 1967 to 1992 is obtained from the University of Texas Inequality Project (UTIP)3.
The third data set alone contains continuous time series data on inequality. These three
inequality measures described above are denoted by ineq_ds, ineq_wider and ineq_utip
respectively.
Table 1 presents summary statistics of the data series: gdp, gdppc and invpc in
first differences, and of the rest in levels. Furthermore, Figure 1.a plots gdppc, invpc and
t_ratio and Figure 1.b plots the three inequality measures. As we can see from the table,
real GDP increased at an annual average growth rate of 3.6 percent whereas per capita
real GDP and investment increased at 1.1 and 3.2 percent respectively during the period
between 1959 and 2000. Moreover, the growth of investment is highly volatile. As one
can see from Figure 1.a, per capita real GDP, investment and trade-GDP ratio all declined
sharply in early 70s – about the time Bangladesh got independence from Pakistan in
1971. All three variables have been growing steadily since then.
2 Ahmed and Sattar (2004) also uses trade-GDP ratio as a measure of trade liberalization 3 See Galbraith and Kum (2003) for methodology used to estimate this inequality measure.
6
There is no uniform pattern in the inequality measure. The plots of the three
measures in Figure 1.b reflect poor quality of data. Although it is difficult to draw any
conclusion about trends in income inequality in Bangladesh, other studies (for example,
Wodon (1999, 2000) and Khan and Sen (2001)) have shown that inequality has risen in
Bangladesh in recent times.
Because we are using time series data it is imperative that we test for stationarity
of each variable. We conduct Augmented Dickey Fuller Test (ADF) for unit root on each
of the five variables. The test statistics along with MacKinnon’s p-values are reported in
Table 2. As we see from the table, gdppc, invpc, t_ratio and ineq_utip are I (1) processes
while gdp is an I (2) process. Multivariate time series modeling technique suggests that if
the variables are non stationary and they are of same order of integration one should test
for cointegration. However Johansen’s cointegration test on gdppc, invpc, t_ratio and
ineq_utip rejects any cointegrating relationship among these variables. We, however, do
not report the results.
3. Empirical Results from VAR Analysis
We use a Vector Autoregression (VAR) model to investigate the interrelations
among trade, growth and income inequality. In particular, we estimate different
specifications of a VAR model of the following form:
∑=
− ++=p
ititit YAAY
10 ε
where Yt is an n ×1 vector of variables in time t, A0 is an n ×1 vector of constant terms,
Ai is an n × n matrix of the coefficients associated with lag i of the variables in Y and p is

7
the maximum lag included in the VAR model. εt is an n ×1 vector of white noise
disturbances. n is the number of variables in vector Y.
3.1. Trade Liberalization and Growth
3.1.1 A ‘parsimonious’ specification
In order to investigate the relationship between trade liberalization and growth
without getting mired in a lot of detail, we first estimate a bivariate VAR which is
parsimonious in terms of the number of variables. We estimate three alternative versions
of the model with the vector Y including the following variables4:
Model 1: Y = (gdppc, t_ratio)
Model 2: Y = (∆gdppc, t_ratio)
Model 3: Y = (∆gdp, t_ratio)
We include two lag of each variable in the estimation of Model 1 and one lag in the
estimation of Model 2 and 3. The lags are selected on the basis of AIC.
The estimated generalized impulse responses5 (along with two standard error
bands) are shown in Figure 2. The first row of graphs shows the responses of each
variable to a one standard deviation innovation in the other variable in Model 1. An
innovation in Trade-GDP ratio leads to a permanent increase in per capita real GDP. Per
capita real GDP has a positive permanent effect on trade liberalization and it gets stronger
over time. One has to be careful in interpreting these results. First, as ADF test results
indicate all these variables are unit root processes. Therefore, a disturbance is more likely
4 Whether the variables in a VAR need to be stationary is controversial. Sims (1980) and others (e.g. Doan (1992)), argue that the goal of VAR analysis is to determine the interrelationships among the variables, not the parameter estimates. Also see Enders (1995) 5 Generalized impulses are derived from an orthogonal set of innovations that do not depend on the VAR ordering. For details, see Pesaran and Shin (1997)

8
to cause a permanent drift in the variable. Second, as time passes the estimated standard
errors become more imprecise.
The middle row shows the generalized impulse responses derived from the
estimation of Model 2. An innovation in Trade-GDP ratio leads to a permanent increase
in the growth rate of per capita real GDP but this effect is not strong in terms of statistical
significance. The effects of GDP growth on trade liberalization are weak. However, the
responses of the growth in real GDP to a one standard deviation innovation in Trade-
GDP ratio – shown in the third row of Figure 3 - are a bit weaker than those of per capita
GDP growth. Again, trade-GDP ratio does not seem to respond to shock to per capita
GDP growth rate.
3.1.2 An augmented VAR
At the theoretical level, one would expect that investment – change in the capital
stock – and the change in the labor input will affect the growth rate of real GDP. In per
capita terms, per capita real investment will affect the growth rate of per capita real GDP.
We, therefore, add investment to the system so that we can control for the effects of
investment while looking at the impact of trade liberalization. We estimate two
alternative specifications of the model with the vector Y including the following
variables:
Model 4: Y = (∆gdppc, invpc t_ratio)
Model 5: Y = (gdppc, invpc, t_ratio)
We include two lags of each variables selected by the AIC.
9
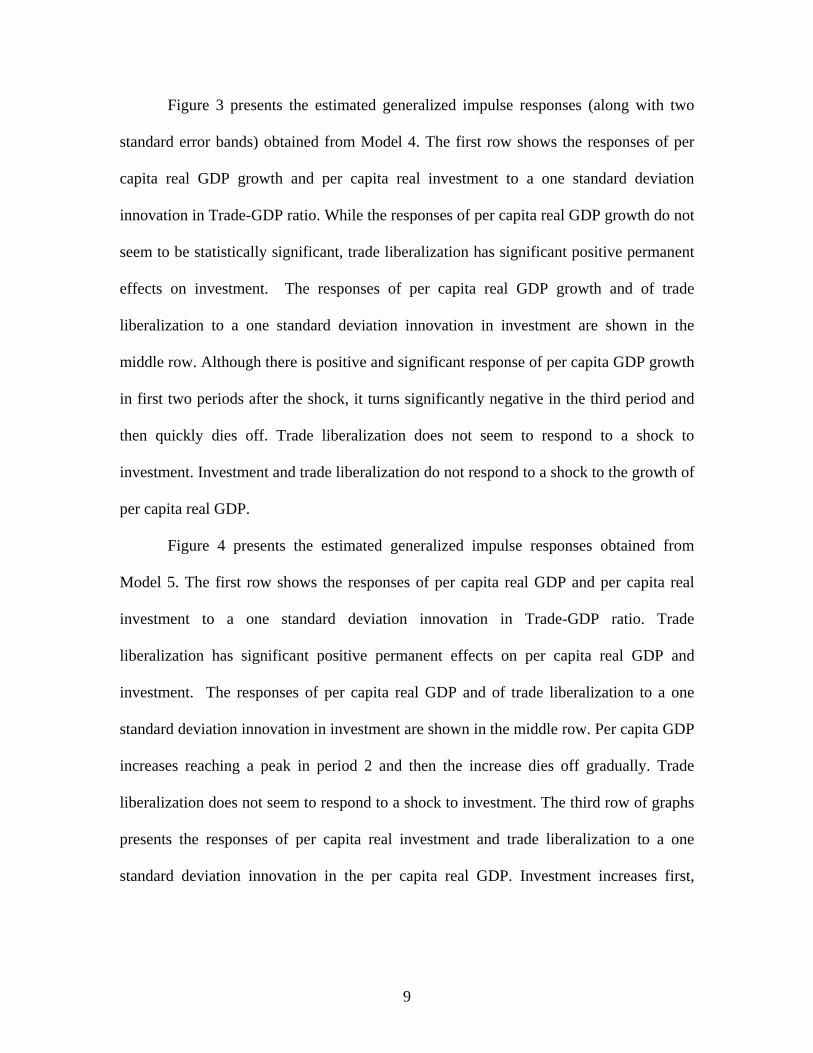
Figure 3 presents the estimated generalized impulse responses (along with two
standard error bands) obtained from Model 4. The first row shows the responses of per
capita real GDP growth and per capita real investment to a one standard deviation
innovation in Trade-GDP ratio. While the responses of per capita real GDP growth do not
seem to be statistically significant, trade liberalization has significant positive permanent
effects on investment. The responses of per capita real GDP growth and of trade
liberalization to a one standard deviation innovation in investment are shown in the
middle row. Although there is positive and significant response of per capita GDP growth
in first two periods after the shock, it turns significantly negative in the third period and
then quickly dies off. Trade liberalization does not seem to respond to a shock to
investment. Investment and trade liberalization do not respond to a shock to the growth of
per capita real GDP.
Figure 4 presents the estimated generalized impulse responses obtained from
Model 5. The first row shows the responses of per capita real GDP and per capita real
investment to a one standard deviation innovation in Trade-GDP ratio. Trade
liberalization has significant positive permanent effects on per capita real GDP and
investment. The responses of per capita real GDP and of trade liberalization to a one
standard deviation innovation in investment are shown in the middle row. Per capita GDP
increases reaching a peak in period 2 and then the increase dies off gradually. Trade
liberalization does not seem to respond to a shock to investment. The third row of graphs
presents the responses of per capita real investment and trade liberalization to a one
standard deviation innovation in the per capita real GDP. Investment increases first,

10
declines in period 2 to where it was before, and increases again. Trade-GDP ratio
permanently increases as a result of the shock to per capita real GDP.
The key result of this subsection is that an innovation in trade liberalization leads
to a positive and permanent increase in investment. Furthermore, there is some weak
evidence of trade liberalization accelerating the growth rate of per capita real GDP.
3.2 Trade Liberalization, Growth and Income Inequality
Now we expand our set of variables to include measures of income inequality so
that we can examine interrelations among trade liberalization, growth and income
inequality. Because we have continuous time series data only on ineq_utip we use that
series only. However, this data series is available only for the period from 1967 to 1992
and, therefore, we use data on each variable for that sub-period. We estimate the
following specifications:
Model 6: Y = (∆gdppc, ineq_utip, t_ratio)
Model 7: Y = (∆gdppc, ineq_utip, invpc, t_ratio)
Figure 5 presents the estimated generalized impulse responses (along with two
standard error bands) obtained from Model 6. The first row shows the responses of per
capita real GDP growth and inequality to a one standard deviation innovation in Trade-
GDP ratio. Although the responses of per capita real GDP growth and inequality are
positive they are not statistically significant. As we can see from the second and the third
row one standard deviation innovation in inequality and real per capita growth seems to
have no statistically significant effects on the other variables.
11
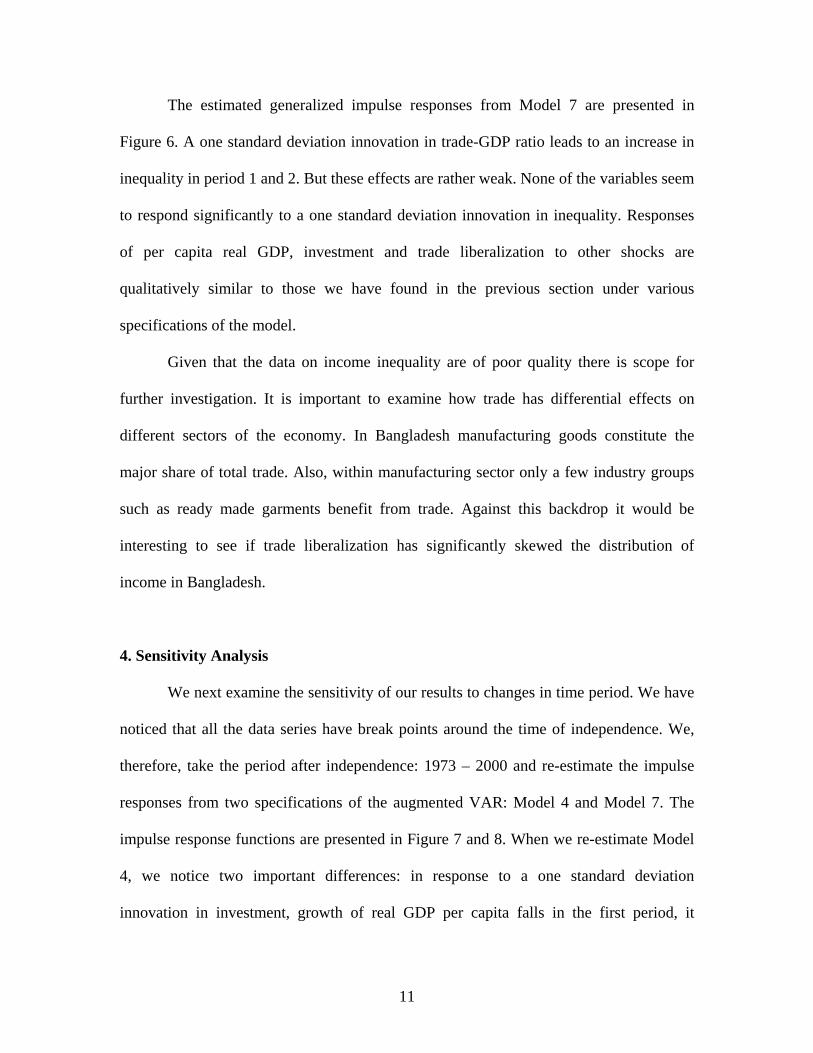
The estimated generalized impulse responses from Model 7 are presented in
Figure 6. A one standard deviation innovation in trade-GDP ratio leads to an increase in
inequality in period 1 and 2. But these effects are rather weak. None of the variables seem
to respond significantly to a one standard deviation innovation in inequality. Responses
of per capita real GDP, investment and trade liberalization to other shocks are
qualitatively similar to those we have found in the previous section under various
specifications of the model.
Given that the data on income inequality are of poor quality there is scope for
further investigation. It is important to examine how trade has differential effects on
different sectors of the economy. In Bangladesh manufacturing goods constitute the
major share of total trade. Also, within manufacturing sector only a few industry groups
such as ready made garments benefit from trade. Against this backdrop it would be
interesting to see if trade liberalization has significantly skewed the distribution of
income in Bangladesh.
4. Sensitivity Analysis
We next examine the sensitivity of our results to changes in time period. We have
noticed that all the data series have break points around the time of independence. We,
therefore, take the period after independence: 1973 – 2000 and re-estimate the impulse
responses from two specifications of the augmented VAR: Model 4 and Model 7. The
impulse response functions are presented in Figure 7 and 8. When we re-estimate Model
4, we notice two important differences: in response to a one standard deviation
innovation in investment, growth of real GDP per capita falls in the first period, it

12
increases in the second period and then the change dies off. A shock to the growth of per
capita real GDP has significant negative effects on investment for first three periods after
the shock. It is intuitively not clear why shock to per capita real GDP leads to a decline in
investment or why an innovation in investment negatively affect the growth rate of per
capita real GDP.
Re-estimation of Model 7 with a shorter sample produces impulse responses very
similar to the one we estimate with the full sample. However, a one percent standard
deviation innovation in investment leads to a significant positive effect on the trade-GDP
ratio for at least four periods after the shock.
5. Concluding Remarks
This paper examines time series evidence to establish a link between trade,
economic growth and income inequality in Bangladesh. The empirical results from a
Vector Autoregression (VAR) model suggest that there is some evidence of trade
liberalization accelerating growth in Bangladesh. Trade openness promotes investment.
We find little evidence of trade affecting income distribution or of income distribution
affecting growth or investment. Given the poor quality of the data on inequality
measures, there is scope for further investigation. Re-estimation of the model with post
independence data suggests that investment could be important for trade liberalization.

13
Table 1: Summary Statistics of the Data Series
Sample period Mean Standard
deviation No. of
observations Variable (1) (2) (3) (4)
∆gdp 1960 - 2000 0.036 (-0.094,0.152) 0.042 41
∆gdppc 1960 -2000 0.011 (-0.121,0.125) 0.043 41
∆invpc 1960 -2000 0.032 (-0.843, 0.644) 0.222 41
t_ratio 1959 -2000 0.164 (0.092,0.309) 0.065 42
ineq_ds 1963 -2000 0.336 (0.259,0.390) 0.039 13
ineq_wider 1963-1999 0.377 (0.290,0.450) 0.036 19
ineq_utip 1967-1992 0.412 (0.361,0.456) 0.024 26
Note: In column 2, the numbers in parentheses are the minimum and maximum
values of the variables

14
Table 2: Augmented Dickey Fuller Test Results
ADF test statistic MacKinnon p-value Variable
(1) (2)
gdp 5.473 1.000
gdppc -1.086 0.919
invpc -2.342 0.164
ineq_utip -4.946 0.003
t_ratio 2.346 0.995
∆gdp 0.277 0.760
∆gdppc -5.122 0.001
∆invpc -7.256 0.000
∆t_ratio -8.594 0.000
∆2gdp -5.096 0.000

15
Figure 1.a
3
4
5
6
7
8
.08
.12
.16
.20
.24
.28
.32
60 65 70 75 80 85 90 95 00
GDPPC INVPC T_RATIO
Per Capita Real GDP, Investment and Trade-GDP Ratio in Bangladesh: 1959 - 2000Pe
r cap
ita re
al G
DP
(gdp
pc) a
nd in
vest
men
t(inv
pc)
(loga
rithm
ic v
alue
)
t_ratio
Figure 1.b

16
Figure 2: Generalized Impulse Responses: Model 1, 2 and 3

17
Figure 3: Generalized Impulse Responses: Model 4

18
Figure 4: Generalized Impulse Responses: Model 5

19
Figure 5: Generalized Impulse Responses: Model 6

20
Figure 6: Generalized Impulse Responses: Model 7

21
Figure 7: Generalized Impulse Responses: Model 4 (1973 – 2000)

22
Figure 8: Generalized Impulse Responses: Model 7 (1973 – 1992)

23
References Ahmed, Sadiq and Zaidi Sattar (2004) Trade Liberalization, Growth and Poverty Reduction: The Case of Bangladesh, Washington, D.C.: World Bank. Doan, Thomas (1992) RATS User’s Manual, Evanson, Ill: Estima. Enders, Walter (1995) Applied Econometric Time Series, New York: John Wiley & Sons, Inc. Galbraith, James K. and Hyunsub Kum (2003): Estimating the Inequality of Household Incomes: Filling Gaps and Fixing Problems in Deininger & Square, UTIP Working Paper No. 22. International Monetary Funds: International Financial Statistics, (http://ifs.apdi.net/imf/logon.aspx) Washington D.C.: IMF Khan, Azizur Rahman (1990) Poverty in Bangladesh: A Consequence of and a Constraint on Growth, The Bangladesh Development Studies, vol. 18, no.3: 19-34 Khan, Haider Ali (1997) Ecology, Inequality, and Poverty: The Case of Bangladesh, Asian Development Review, vol.15, no.2: 164-179. ___, __________ and Binayak Sen (2001) Inequality and Its Sources in Bangladesh, 1991/92 to 1995/96: An Analysis Based on Household Expenditure Surveys, The Bangladesh Development Studies, vol. 27 (March), no. 1: 1 – 49. Love, James (1995) Adoption of the Export-led Growth Strategy in Bangladesh: Some Thoughts. In Grieve, Roy H.; Huq, M. Mozammel, eds. Bangladesh: Strategies for Development, Dhaka: University Press.
Mamun, Khawaja A and Hiranya K Nath, 2004, Export-led Growth in Bangladesh: A Time Series Analysis, manuscript, Sam Houston State University Muqtada, M (1986) Poverty and Inequality: Trends and Causes, in Bangladesh, Selected Issues in Employment and Development, New Delhi: International Labour Organization: 41-60. Pesaran, M.H. and Shin, Y (1997) Generalized Impulse Response Analysis in Linear Multivariate Models, Working Paper, Department of Applied Economics, University of Cambridge. Sims, Christopher, (1980) Macroeconomics and Reality, Econometrica, vol. 48: 1- 49 Wodon, Quentin T (2000) Microdeterminants of consumption, poverty, growth, and inequality in Bangladesh, Applied Economics, vol.32: 1337-1352

24
_____________ (1999) Between Group Inequality and Targeted Transfers, Review of Income and Wealth, series 45, no. 1: 21-39