trade in services by gats modes of...
TRANSCRIPT

Chief Economist Note
1
TRADE IN SERVICES BY GATS MODES OF SUPPLY: STATISTICAL CONCEPTS AND FIRST EU ESTIMATES
Rueda-Cantuche, José M.a, Kerner, Riina b, Cernat, Lucian c, Ritola, Veijo b
a European Commission, DG Joint Research Centre b European Commission, Eurostat
c European Commission, Directorate General for Trade1
Abstract
Services account for an overwhelming share of overall economic activities and are increasingly delivered across borders under various modes of supply. Given their growing importance for trade negotiators, the availability of statistics on the international supply of services detailed by services category, mode of supply and partner country is critically important for services trade policy making. Based on a recent Eurostat project, this paper presents the first estimates for EU trade in services by modes of supply and explores possible avenues to build a global services dataset by modes of supply, building on the latest European initiatives in this area. Keywords: Modes of Supply; Trade; Services, General Agreement on Trade in Services (GATS)
1 The views expressed herein are those of the authors and do not necessarily reflect an official position of the European Commission. The authors would like to thank Jose Antonio Isanta Foncuberta, Andreas Maurer and colleagues in DG TRADE and EUROSTAT for their valuable inputs and comments.
Issue 3 November 2016
Editor: Lucian Cernat ISSN 2034-9815

Chief Economist Note
2
1. Services trade statistics by modes of supply: trade policy imperatives
The role of services in EU trade has been growing steadily over the last decade: the ratio of services-to-goods exports (including only services trade as measured in Balance of Payments (BoP) statistics) increased from around 38% to over 45%. Furthermore, as one of the main conclusions of this paper clearly indicates, the share of services in total EU exports is considerably higher, when considering the mode 3 services trade through the sales of EU foreign affiliates.
For services trade negotiations, comprehensive information on trade in services by mode of supply has been a longstanding priority. This need points to the necessity to develop statistics on the international supply of services which go beyond the primary objective of the BoP statistics. The availability of statistics on the international supply of services detailed by services category, mode of supply and partner country is highly important for services trade policy making and related analysis. The same conclusion is reached by the Australian government (DFAT, 2007: 5):
One of the major unmet user needs is for detailed trade in services data by mode of supply by country to support Australian trade negotiators. Detailed services trade data by mode of supply provide the basis for analysis and development of negotiating priorities and for support of our market access positions.
Although the need for better services trade statistics to inform services trade negotiations has been clearly identified early on (see for instance Stern and Hoekman (1987), Karsenty (2000) and Chang et al. (1999)), the growing economic importance of services trade is still not matched by the level of statistical details needed by policy makers. Notable exceptions are the efforts to produce services by modes of supply estimates by Karsenty (2000), Maurer et al. (2008), Magdelaine and Maurer (2008), and WTO (2016). A number of country-specific assessments also provided valuable information. The US Bureau of Economic Analysis has been at the forefront of detailed services trade statistics for many years, including on issues pertaining to modes of supply.2 Very valuable work has also been carried out under the auspices of the OECD (see for instance OECD (2015) for several recent developments and experiences of other countries with regard to services by modes of supply). Meehan (2014) offers an assessment of New Zealand's services exports by modes of supply based on BoP
2 For an early attempt to offer a comprehensive assessment of US services trade from BoP and FATS see for instance Baldwin and Kimura (1998).

Chief Economist Note
3
Comprehensive information on trade in services by mode of supply has been a longstanding priority for negotiators
Important aspects of trade in services are not captured by the standard statistics
data (modes 1, 2, and 4). The Reserve Bank of India also conducts an annual survey of computer software and IT enabled services exports that includes a split by modes of supply.
In parallel, a large body of literature was concerned with a whole range of other key services issues: mapping and quantifying the various trade restrictions affecting services trade (e.g. the
longstanding work programme carried out by the OECD and World Bank on services restrictiveness indexes), assessing the nature of services commitments in various trade agreements (e.g. Roy, Marchetti and Lim (2007), Marchetti and Roy (2014)), the broader economic
implications and the rationale for services liberalization and domestic reform across a wide range of sectors (e.g. transport, logistics, telecommunications, banking, insurance, health care, education services, etc.).3 Jansen and Piermartini (2004) assessed the inter-linkages between various modes of supply, notably the complementarity between mode 4 services and other modes of supply. A growing literature using CGE modelling examined the impact of services liberalization under multilateral and regional liberalization initiatives, including modes of supply.4
Currently, international trade in services statistics originate mainly from the transactions covered by a country's BoP, and they are primarily collected for many purposes, going beyond international trade. BoP transactions by services' category are defined with respect to the residency of the seller and the purchaser, without a distinction regarding how the service is actually supplied. This means that important aspects of the international supply of services, taking place through commercial presence are not captured by the Balance of Payments framework. Given their importance, foreign affiliates' statistics or FATS, should be integrated as mode 3 services trade (through foreign affiliates).
The General Agreement on Trade in Services (GATS), the multilateral agreement covering global trade in services, defines trade in services as the supply of a service through four modes of supply. Services broken
down by the mode of supply give an indication where and in which way the services are
3 A thorough overview of this vast literature would go beyond the purpose of this paper. For a general literature review covering several strands of service-related work, see Hoekman (2006) for instance. A good collection of sectoral services studies can be found in Mattoo, Stern and Zanini (2008) and in Dee (2013). For an overall assessment of the various economic, political, and legal issues surrounding services negotiations see Sauvé and Stern (2000) and Sauvé and Roy (2016). 4 For a recent overview of the use of CGE modelling for service trade analysis see for instance Christen, Francois and Hoekman (2013). For an example of CGE analysis of mode 4 liberalization, see for instance Walmsley and Winters (2005).

Chief Economist Note
4
supplied to foreign customers. For example, legal services may be supplied to the customer through e-mail (cross-border supply or mode 1), by an established affiliate abroad (commercial presence or mode 3) or by the lawyer's presence abroad (presence of natural persons or mode 4). This would enable an assessment of both the relative importance of different modes of supply in a particular sector and the impact of measures affecting each mode of supply.
Services represent a very large share of domestic activities but are currently less traded than goods, not least because of important trade barriers, as the services trade restrictiveness metrics clearly suggests. Services trade negotiations offer important opportunities to reduce barriers for trade in services, which also differ across modes of supply. As the OECD and World Bank’s databases on services restrictions suggest, there is considerable variation in the level of services protection across modes of supply, sectors and countries.
For instance, based on the World Bank Services Trade Restrictions database, countries vary widely in the level of their cross-sectoral restrictiveness index across modes 1, 3, and 4 (see Figure 1).
Figure 1. Overall services trade restrictions in selected countries, by modes of supply
Source: Based on the World Bank STR Database (http://iresearch.worldbank.org/servicetrade/default.htm). The World Bank database encompasses information on 103 countries (of which 79 are non-OECD countries) and five major services sectors (financial services, telecommunications, retail distribution, transportation and professional services), with each sector further disaggregated into subsectors. For more details see Borchert, Gootiiz and Mattoo (2012).
An even greater degree of variation is found when breaking down services trade restrictions by country, sector and mode of supply (see Figure 2). Based on the same World Bank

Chief Economist Note
5
The current services trade statistics and the analytical tools available are not well equipped to capture all the negotiating parameters
database, choosing a handful of countries, two sectors and two modes, services trade restrictiveness varies from completely open to completely closed for banking, either for mode 1 or mode 3 in several countries in the World Bank database, whereas transportation seems to be always subject to some barriers in all countries, irrespective of modes of supply.
Figure 2. Services trade restrictions in selected countries and sectors, by modes of supply
Source: Based on the World Bank STR Database (http://iresearch.worldbank.org/servicetrade/default.htm).
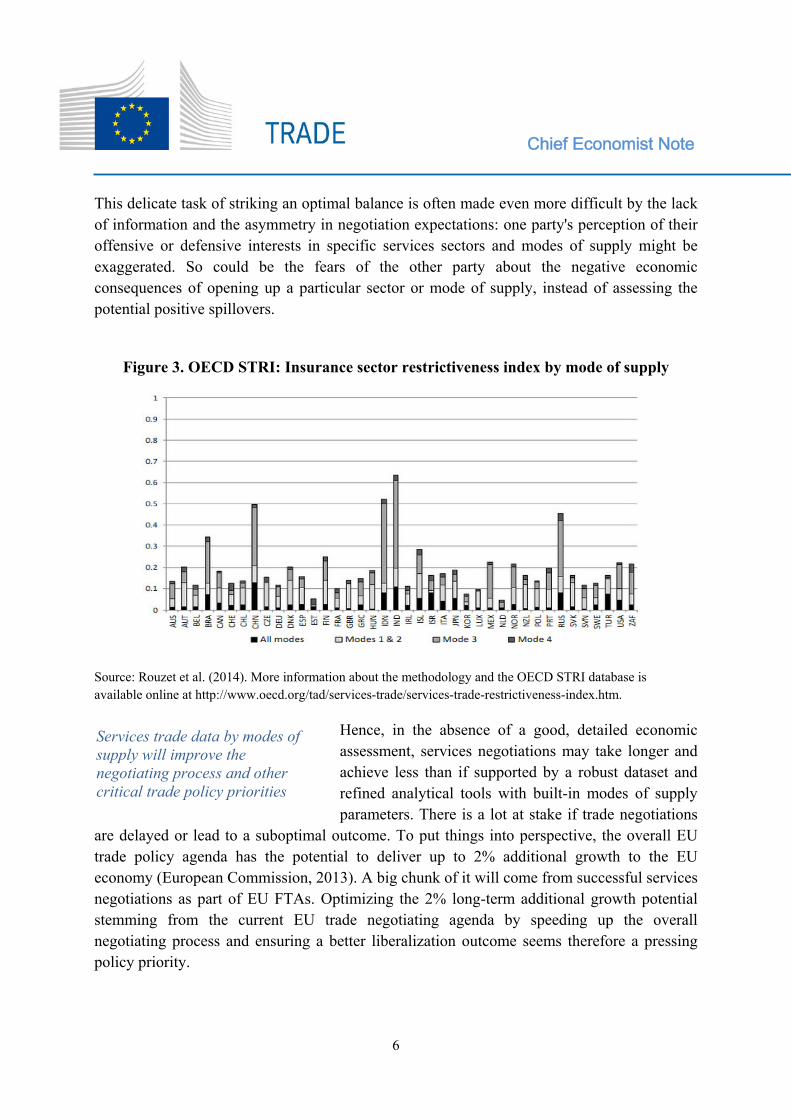
A similar effort to chart the landscape of trade restrictions faced by services trade in a wide range of countries and sectors has been carried out over the years by the OECD secretariat, leading to a rich database and a Services Trade Restrictiveness Index (STRI). While the methodology is slightly different from the one applied by the World Bank, the OECD STRI offers a wealth of information on the various measures applied at sectoral level and on various modes of services trade (see Figure 3 for an example of the restrictions applied on insurance services).
Despite these major analytical advances on key aspects governing trade in services, unfortunately the current services trade statistics and the analytical tools available (modelling, econometrics, etc.) are
not well equipped to capture the key negotiating parameters that are crucially dependent on the specific modes of supply. In the absence of such data, the task of trade negotiators is made more difficult. Given the complex interplay between sectors and modes of supply, services trade negotiations are subject to numerous compromises, and finally not all negotiating objectives can be achieved.
Chief Economist Note
6
Services trade data by modes of supply will improve the negotiating process and other critical trade policy priorities
This delicate task of striking an optimal balance is often made even more difficult by the lack of information and the asymmetry in negotiation expectations: one party's perception of their offensive or defensive interests in specific services sectors and modes of supply might be exaggerated. So could be the fears of the other party about the negative economic consequences of opening up a particular sector or mode of supply, instead of assessing the potential positive spillovers.
Figure 3. OECD STRI: Insurance sector restrictiveness index by mode of supply
Source: Rouzet et al. (2014). More information about the methodology and the OECD STRI database is available online at http://www.oecd.org/tad/services-trade/services-trade-restrictiveness-index.htm.
Hence, in the absence of a good, detailed economic assessment, services negotiations may take longer and achieve less than if supported by a robust dataset and refined analytical tools with built-in modes of supply parameters. There is a lot at stake if trade negotiations
are delayed or lead to a suboptimal outcome. To put things into perspective, the overall EU trade policy agenda has the potential to deliver up to 2% additional growth to the EU economy (European Commission, 2013). A big chunk of it will come from successful services negotiations as part of EU FTAs. Optimizing the 2% long-term additional growth potential stemming from the current EU trade negotiating agenda by speeding up the overall negotiating process and ensuring a better liberalization outcome seems therefore a pressing policy priority.

Chief Economist Note
7
Beyond the EU agenda, given the growing importance of services for many developing countries, it would be extremely important to ensure an optimal negotiating outcome at global level, exchanging the bargaining chips on the most important combinations of sectors and modes of supply that lead to higher economic gains for all negotiating parties.
In order to do so, having a global dataset of bilateral services trade flows by modes of supply that can be corroborated with the existing information on services trade barriers already classified by modes of supply (such as the ones collected by the Organization for Economic Cooperation and Development, OECD, World Bank, or World Trade Organization, WTO) will offer a tremendous tool for trade policy analysts and negotiators.
Having a services trade dataset by modes of supply will not only improve the negotiating process but also other critical trade policy priorities, such as monitoring and implementation of existing trade agreements, ex-post evaluations, etc. Providing clear evidence that trade agreements work well not just in terms of boosting trade in goods from tariff removal but that they are also beneficial for services companies and their customers is of paramount importance, at a time where many sceptical voices call into question the benefits of trade liberalization.
2. Services modes of supply: a short overview Unlike the trade in goods, one peculiarity of the trade rules governing services trade is the distinction under the GATS agreement and bilateral treaties covering services of several modes of delivery for international trade in services. The intellectual origin of this conceptual framework can be traced back to Sampson and Snape (1985), who put forward a taxonomy of services trade similar to the one currently incorporated in GATS.5
According to GATS, services are supplied by four modes of supply. A standard, brief graphic description of the four modes of supply in services trade, based on the GATS provision offers a clear picture of the nature of international services trade under each of the four different modes of supply covered in GATS (see Figure 4):
• Mode 1 is the cross-border supply of services, from the territory of one country into
the territory of another country. For example, the computer services company in one country sells the computer services to the company (including its affiliates) in the
5 See Marchetti and Mavroidis (2011) for a detailed account of the political and negotiating dynamics that shaped the final contours of the GATS.

Chief Economist Note
8
other country (the supplier and the consumer remain in their own countries). The existing statistical framework mostly measures this mode in the BoP context.
Figure 4. Simplified descriptions on how services are supplied
Source: Eurostat, based on GATS provisions.
• Mode 2 is the consumption of services abroad. Customers travel to another country to buy services by their own account. The travel item would cover information relating to this transaction.
• Mode 3 is the commercial presence of a company from country A in the other country. For example, the computer service is provided to the customer by an affiliate

Chief Economist Note
9
A simplified approach on how to estimate the services trade by mode of supply has been adopted by the global statistical community
in the other country. Currently, the Foreign Affiliates' Statistics (FATS) provides the information for that purpose.
• Mode 4 is the presence of natural persons abroad. For example, one computer services company from country A is sending its employees directly to a customer in another country for supplying the services there.
The GATS modes of supply posed from the beginning a number of challenges for the services trade statistics. However, over time, considerable progress has been made and measuring international trade in services by mode of supply is gradually being covered under the extended scope of the existing statistical framework. One of the main objective of such efforts is to ensure that BoP services trade statistics would be also available broken down by sector and mode of supply for each service item (see Annex 2 for the specific services sub-sectors under each service category used herein), and to the extent possible to also have a bilateral, country by country breakdown .
While BoP data covers modes 1,2 and 4, FATS remain the main data source for assessing mode 3 (commercial presence) services trade. In the majority of cases this mode of supply corresponds to the activities of entities that are controlled or owned from abroad, in the territory where they are established. The supply of services through mode 3, by non-resident suppliers to residents of the compiling economy, is made by the resident affiliate of this supplier (i.e. recorded as transactions between residents of the same economy).
From a mode 3 perspective, the main interest is in compiling services data broken down by businesses' control and by service category. However, in the absence of data by service category, it is still possible to estimate the most relevant category of service being provided according to the primary activity of the business (legal entity). For example, an affiliated company in the telecommunication services industry is likely to have been set up abroad to provide mainly the telecommunication services.
3. Services statistics: compilation methods
Combining statistics on residents' and non-residents' services transactions from the standard BoP statistical framework and FATS statistics gives the users a broad perspective on the
international supply of services. This broad perspective recognises the key role in the delivery of services internationally played by affiliates that are located inside the markets they serve. It is also consistent with the view many firms take of their world-wide operations.
Chief Economist Note
10
Data collection based on the value of the international supply of services should include:
• The compilation of residents' and non-residents' services trade data in the context of the BoP (mainly referring to modes 1, 2 and 4) and by the relationship between the trading parties. • The foreign affiliates' statistics (FATS), exclusively referring to mode 3.
Modes of supply data for trade in services can be either collected through direct reporting systems (surveys) or they can be estimated or modelled. In many cases a combination of the two approaches should be used to obtain the required aggregates. For the countries using an international transaction reporting system (ITRS), modelling the relevant mode of supply may be the only option. Data on mode 3 (commercial presence) will need to be added in addition to existing data on resident/non-resident services trade, as this mode of services supply falls outside the scope of service transactions measured under the BoP framework. In mode 3, there might be some double counting, because some affiliates' exports might be captured also by international trade in services statistics (see UN (2011: 111) for more detailed explanations).
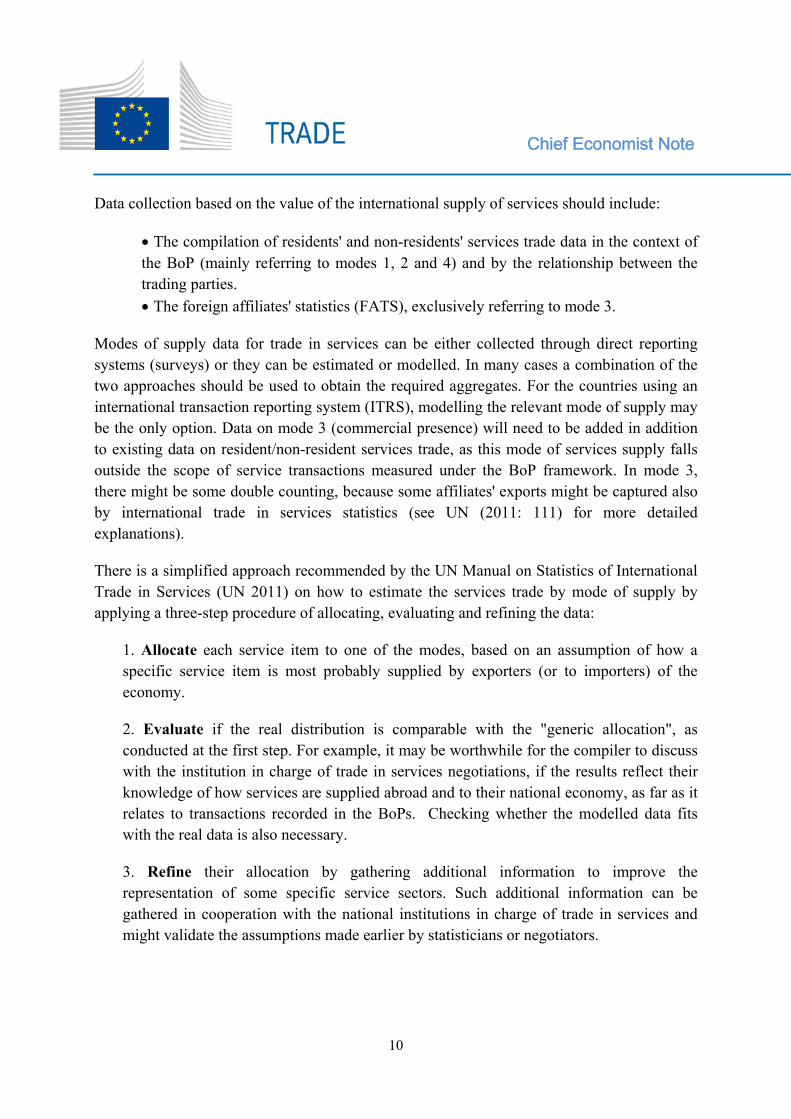
There is a simplified approach recommended by the UN Manual on Statistics of International Trade in Services (UN 2011) on how to estimate the services trade by mode of supply by applying a three-step procedure of allocating, evaluating and refining the data:
1. Allocate each service item to one of the modes, based on an assumption of how a specific service item is most probably supplied by exporters (or to importers) of the economy.
2. Evaluate if the real distribution is comparable with the "generic allocation", as conducted at the first step. For example, it may be worthwhile for the compiler to discuss with the institution in charge of trade in services negotiations, if the results reflect their knowledge of how services are supplied abroad and to their national economy, as far as it relates to transactions recorded in the BoPs. Checking whether the modelled data fits with the real data is also necessary.
3. Refine their allocation by gathering additional information to improve the representation of some specific service sectors. Such additional information can be gathered in cooperation with the national institutions in charge of trade in services and might validate the assumptions made earlier by statisticians or negotiators.
Chief Economist Note
11
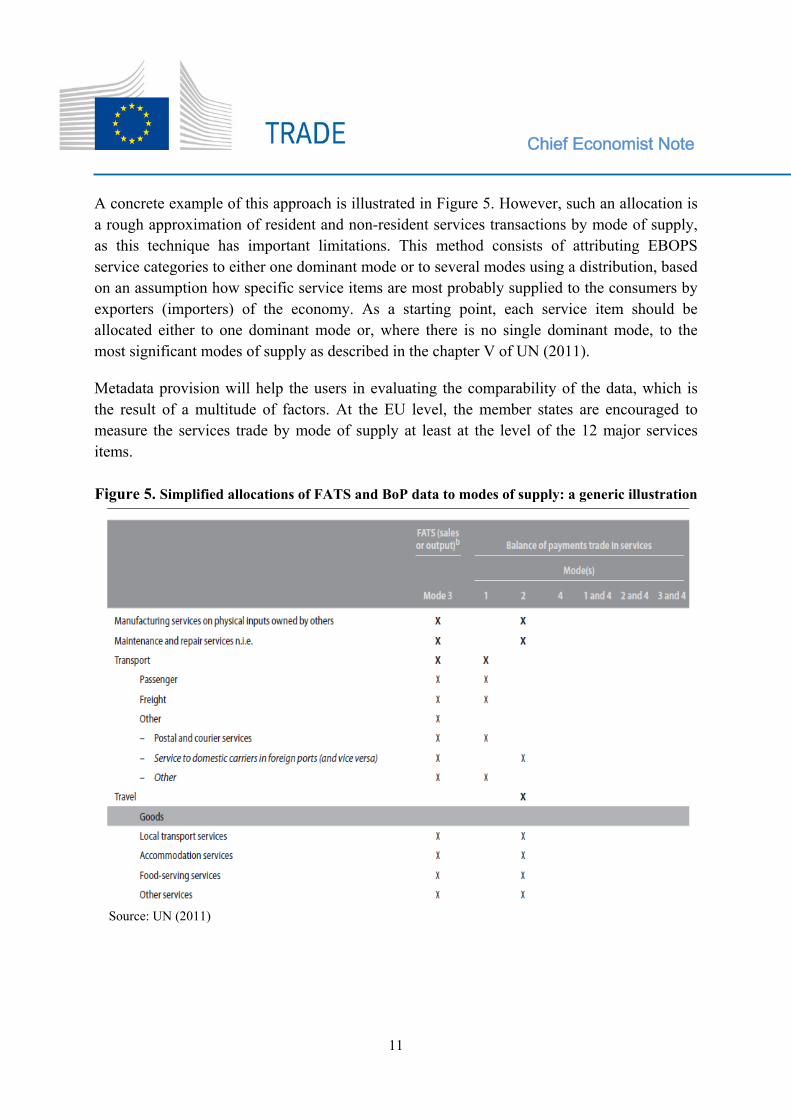
A concrete example of this approach is illustrated in Figure 5. However, such an allocation is a rough approximation of resident and non-resident services transactions by mode of supply, as this technique has important limitations. This method consists of attributing EBOPS service categories to either one dominant mode or to several modes using a distribution, based on an assumption how specific service items are most probably supplied to the consumers by exporters (importers) of the economy. As a starting point, each service item should be allocated either to one dominant mode or, where there is no single dominant mode, to the most significant modes of supply as described in the chapter V of UN (2011).
Metadata provision will help the users in evaluating the comparability of the data, which is the result of a multitude of factors. At the EU level, the member states are encouraged to measure the services trade by mode of supply at least at the level of the 12 major services items. Figure 5. Simplified allocations of FATS and BoP data to modes of supply: a generic illustration
Source: UN (2011)

Chief Economist Note
12
4. Eurostat's experience on the estimation of services trade by modes of supply
This section is based on the Eurostat’s experience on the estimation of services trade broken down by the four modes of supply with the simplified allocation approach, using the publicly existing data. This method has led to the first estimation of EU services by modes of supply comparable at country level, despite important limitations. Some independent national experiences that were extremely useful in validating the EU-wide dataset are also summarised below.
Eurostat has undertaken the work to make the best use of the publicly existing BoP and FATS data in the development of services' mode of supply estimates at EU and Member State level, applying the UN method for estimating services trade by mode of supply. This study is a relatively low-cost method as no special surveys have been conducted. Hence it can only be considered as a rough approximation of how services are supplied.
Some limitations for interpreting the results should be taken into consideration. GATS negotiators are only interested in the supply of services. However, the value of goods is also included under some service items - travel, construction, and maintenance and repair service items. Unfortunately it has not been possible to identify separately the goods and services for all these items.
Also, there is inevitably some double counting by using both FATS and BoP data in the analysis. Sales of services of foreign affiliates based in the compiling economy can include exports by the affiliate, which should have already been captured by the trade in services statistics.
Data sources and methodology
The data sources used are all publicly available as part of various Eurostat databases. Methods are based on the Manual on the Statistics of International Trade in Services (UN 2011), while some further assumptions and developments were made. UN (2011) sets out the internationally agreed framework for the compilation and reporting of statistics of international trade in services, including data by mode of supply.
To obtain the mode of supply estimates, a correspondence table has been developed to show the relationship between the trade in services based on the BoP classification with the different classification used in FATS, in order to present the mode of supply data according to a single classification. The correspondence table from the activity classification (NACE) to the EBOPS services' based classification was developed for the purpose of this study to

Chief Economist Note
13
allocate the FATS data categorisation to the service or "product" based categorisation. This draft correspondence table has been developed for analytical purposes and can be found in Annex 1.
The structure for allocating each service item to one or more modes of supply follows the UN (2011) simplified approach. A methodology for estimating missing data, including confidential and not available data, was also designed.
Several sector-specific methodological details are worth noting. For instance, a methodology has been designed on how to estimate distribution services from FATS statistics. "Distribution services" is an additional service item (not used in EBOPS terminology) whose value has been derived from the production value of the enterprises in the wholesale and retail activities (NACE section G) rather than simple use of the turnover value of the enterprises.
However, production values are available only for inward FATS, so production values for outward FATS have been derived from the production value/ turnover ratio derived for inward FATS. The resulting “sales” are allocated to Mode 3 as “distribution services”.
Concerning the EBOPS services allocation to the modes of supply, each service item is assumed to be delivered by either one mode or a combination of modes. For example, manufacturing services (code SA) are assumed to be delivered via mode 2, while transport services (code SC) are assumed to be delivered via modes 1 and 2, estimated as 75% and 25% respectively, based on the EU28 average with partner as Extra-EU28.
The allocation of services items by modes off supply was done on the most detailed level of the service categorisation. For example, within transport services, passenger and freight services are assumed to be delivered via mode 1, while other supporting and auxiliary services are delivered via mode 2. The total value of transport services is based on the sum of the sub-items and how they have been distributed by different modes. Under the travel item, the services share has been estimated as 65% in exports and 74% in imports, thus excluding the goods' value from the travel expenditures.
Country experiences: Spain and Germany
i. Spain
Following the simplified approach described earlier, the Spanish National Statistical Institute (NSI) incorporated additional information on services trade by modes of supply to the national services trade survey as of 2013 (Isanta, 2014). The lack of information by modes of supply was mainly due to the fact that for such surveys, dealing with transactions between

Chief Economist Note
14
residents and non-residents by EBOPs categories and trading partners, the modes of supply were not considered important in the past. Moreover, in order to reduce the burden to respondents the most, the Spanish NSI opted for providing a box where respondents only have to tick (one or more) dominant modes. No figure is required from the respondent at this stage. They only have to report the type of service exported/imported (and its code), the country of destination/origin and the export/import value. The Spanish survey eventually distinguishes 62 EBOPs categories, much more than those suggested in the UN (2011: 132).
Nevertheless, the survey mostly covers mode 1 and mode 4 in the case of Spain. In order to get primary data for travel services (mainly supplied by mode 2) two different data sources are currently used: a) for the consumption of non-residents in the domestic territory (export of services), the Tourist Expenditure Survey (EGATUR) and the Tourist Movement on Borders (Frontur); b) for the consumption abroad of residents (import of services), the Residents Travel Survey.
In the Balance of Payments and National Accounts systems, travel exports are estimated mostly on the basis of the information provided by the Tourist Expenditure Survey (EGATUR), and travel imports on the basis of information on the transactions payments with debit/credit cards. This variety of source data and their subsequent heterogeneity may constitute a limitation to develop a more accurate measure of the amount of services traded through mode 2. As already hinted in the previous section, one of the main limitation regarding mode 3 services is that the turnover of foreign affiliates generated in the host country are not broken down by EBOPs type of service but only by activity. A good future strategy would be to separate at least how much goods and services are traded by these affiliates. Presently, the direct integration between BoP and FATS makes it difficult to fully cover all transactions made through mode 3.
However, in Spain inward FATS have more information than outward FATS, which benefit from the other survey on Foreign Direct Investment (FDI). The Structural Business Survey can also be helpful to complement the information coming from inward FATS. And last but not least, the estimation of services trade by modes of supply also faces another complexity, which is the conversion from NACE/CPA industries to EBOPS service items.
ii. Germany
The Deutsche Bundesbank (Walter, 2016) has devoted some efforts during the last two years to investigate the allocation of service transactions collected for EBOPS statistics to the different modes of supply. Their starting point was also the simplified approach recommended by the UN (2011). In this case, the idea was to allocate service categories to one or two

Chief Economist Note
15
Mode 3 (commercial presence) is the largest mode of EU services trade
maximum dominant modes. Allocations across modes 1 and 4 were done on the basis of different simplifying scenarios using extra information (e.g. computer services) that could be obtained from income statements from important companies of the sector at hand.
The results showed that there was a high sensitivity in the outcomes depending on the type of allocation used, thus leading to a proposal of producing maximum and narrow bandwidths. Attributing the values of the EBOPS categories to mode 2 (single correspondence according to UN(2011)) was straightforward. Nevertheless, the Deutsche Bundesbank recognises that no assumption can compete with real information directly collected from the companies so they have designed a questionnaire sent out to fifty companies which import and export services to know more about the different modes of supply.
In the German case, the treatment of mode 3 through FATS was made using inward FATS statistics data and a bridge matrix linking EBOPs categories and NACE/CPA codes. This bridge matrix is based on existing correspondence tables. However, the work is still at an early stage and the results are not considered to be official European statistics.
5. A first breakdown of EU services trade by modes of supply: the results of the Eurostat initiative Given the policy relevance of improved service statistics, Eurostat launched a project to estimate services trade flows by modes of supply, using the UN simplified methodology and using the available BoP and FATS data. If data were missing in the Eurostat public database due to confidentiality or reliability matters, the national databases have been investigated.
Generally, a "top-down" approach for estimating modes 1, 2 and 4 was used, meaning that the services total values were taken as the benchmark (with partner Extra EU, Intra EU and World).6 Due to the residuals' distribution across the service items, some discrepancies may occur.
6 Goods' value has been subtracted from the travel item. The total corresponds to the "total services" minus goods' share in travel item (goods comprising approximately 30% of the travel services).

Chief Economist Note
16
There is a lot of variation across Member States in terms of the importance of the various modes of supply
Figure 6. EU total services exports by modes of supply, partner extra-EU, 2013
Source: Eurostat pilot project
Note: Total services refer to standard ITSS and FATS services data combined. For mode 3 estimates, the missing (confidential and non-publishable) values have not estimated by the countries in this context. As a consequence, at this stage, the countries' totals
for mode 3 cannot be calculated, due to the missing values by NACE activity. The mode 3 for EU aggregate has been calculated based on the EU28 data which was nearly exhaustively available.7 As shown in Figure 6, our results on the EU total services exports by mode of
supply indicate that mode 3 (commercial presence) is the largest mode of service delivery abroad (69% of the total), followed by mode 1 (cross-border supply) and mode 2 (consumption in EU, travellers from Extra-EU28). Mode 3 exports are considerably larger than all other BoP modes 1, 2, and 4 combined. A similar structure is found for EU services imports. Our EU estimates are in line with the services modes of supply breakdown reported in Magdeleine and Maurer (2008) based on Australian data, and in WTO (2016) based on US data. Regarding the sectorial distribution of the supply of services, mode 1 (cross-border supply) is mostly used for services trade related to intellectual property changes, followed by transport and other business services (Figure 7). Mode 4 (presence of natural persons) is naturally more linked to construction activities and telecommunication, computer and information services.
7 EU aggregate does not include the "Sewerage" turnover value (E37), as data was not available

Chief Economist Note
17
Figure 7. EU28 supply of services, partner extra-EU28, 2013
Legend: The "transport" sector includes air transport.
Figure 8. EU28 Member States services exports by modes 1, 2 and 4, partner extra-EU28, 2013
Source: Eurostat pilot project

Chief Economist Note
18
"Other business services" generate nearly one third of EU mode 1 exports, followed by transport services and financial services
More than two thirds of the total value of EU28 mode 3 services was generated by distribution, financial and business services
Mode 3 (commercial presence) is prevalent in financial and insurance services, personal, cultural and recreational activities, construction and distribution services. Mode 2 (consumption abroad) is economically important for travel, manufacturing services
(processing) and maintenance and repairing. Under the EU averages there is nevertheless a lot of variation across Member States in terms of the importance of the various modes of supply (see Figure 8). This might be mainly due to structural differences and types of services traded. Disregarding mode 3 for which data
limitations still exist8, more than two thirds of the international services trade in the EU are channelled through mode 1 (cross-border supply). Luxembourg and Denmark are the countries for which the shares were the highest: 96% and 84%, respectively. The Greek exporters supplied services less through mode 1 in their international services transactions (9%); however, Greece is the country where mode 2 (consumption abroad) is most used (87%), followed by Croatia (60%) and Bulgaria (53%). For mode 4 (presence of natural persons), Ireland and Finland ranked first with 25% and 23%, respectively, followed by Romania (22%).
It should also be mentioned that the results from Eurostat’s project (“simplified allocation”) do not deviate much from the estimates made by the Spanish National Statistical Institute (INE), even when the
years of reference are different (2012 for Eurostat and 2014 for INE). The estimated value of the Spanish services exports under mode of 1 amounted to 48% of the total services value, whereas the Eurostat methodology yielded 42%. For imports, the Spanish data indicated a share of 67% for mode 1 versus 65% based on the Eurostat's unofficial estimate.
Interesting findings can also be gauged from the sectoral distribution of Mode 1 services for the EU28 aggregate (see figure 9). A similar breakdown can be obtained for the value of EU services exports under mode 3, the dominant mode of services exports. As shown in Figure 10, more than two thirds of the total value of trade in the EU28 supplied by mode 3 were associated to distribution services, other business services, and financial and insurance services. Telecommunication and information services; and transport activities follow in order of importance. 8 In the Eurostat pilot methodology, mode 3 data could not be summed up, because of the missing values in FATS data, as they were not estimated on the 2-digit NACE activity level. In the future, this limitation should be avoided by estimating the missing data and by summing up FATS data by the activities.

Chief Economist Note
19
Figure 9. EU28 mode 1 services exports: sectoral breakdown, partner Extra-EU28, 2013
Source: Eurostat pilot project
Figure 10. EU28 mode 3 services exports: sectoral breakdown, partner Extra-EU28, 2013
Source: Eurostat pilot project

Chief Economist Note
20
The production of services trade statistics by mode of supply should be formally integrated into the regular statistical process of National Statistical Institutes
6. Conclusions
Trade negotiators and the academic community need a global services trade dataset by modes of supply to formulate their trade negotiating strategies and respond to their analytical questions. With the development of the UN Manual on Statistics of International Trade in Services and the respective Compiler's Guide, the necessity of a complete services trade dataset by modes of supply has been reiterated. Currently since such dataset is not available, trade economists have been tempted to use estimations, particularly for mode 4 (income flows). This might have been misleading for measuring trade in services through the presence of juridical or natural persons (mode 4) and counterproductive for both national and global objectives.
The UN Manual for the first time included recommendations on the estimation of international services trade by modes of supply. However, the implementation of the concepts and definitions developed to obtain comparable data depends on the countries' national priorities and resources allocated for
such statistical work. It can be assessed that the production of this type of data should be formally integrated into the regular statistical production process of the National Statistical Institutes, given the importance of such statistics for trade negotiations and their expected contribution to economic dynamism in Europe and across the world.
In the meantime, nevertheless, it is necessary to complement official data with estimates that follow as much as possible the international concepts in order to meet the needs of the trade negotiators and analysts. In the future, information on mode 3 statistics, broken down by "domestic turnover" and "exports", is essential. Also, mode 3 statistics and international trade in services statistics broken down by "goods" and "services" is needed for improving the quality of services supplied by modes of supply estimates.
To support the process of creating a global database in trade in services with modes of supply for future use in trade negotiations, the European Commission has launched a new initiative, in cooperation with the World Trade Organisation and other interested institutional partners (OECD, UN agencies) and the research community (the GTAP community, input-output experts, national statisticians, etc.).
This new initiative will build on existing efforts to create a global database on service trade by mode of supply at sectoral level and scale up at global level recent successful experiences such as the ones carried out by Eurostat. The newly created database will be augmented with

Chief Economist Note
21
A new initiative by the European Commission supports the creation of a global database in trade in services by modes of supply for future use in trade negotiations
information on services trade restrictions from existing databases (such as the ones compiled by the World Bank and OECD). The new services trade database by modes of supply will then be integrated in existing CGE models and other empirical tools used for trade policy analyses.
When modes of supply will be part of the analytical toolbox available to policy makers, trade negotiators will be finally equipped with a state-of-the-art analytical platform that can guide them towards a more optimal outcome of bilateral, plurilateral or multilateral services negotiations. Recently, Cernat et al (2014) went beyond the four modes of supply and proposed to include the so called “mode 5” to account for services embodied in the exports of manufacturing goods. But that would be another story… References Baldwin, R. and F. Kimura (1998) “Measuring U.S. International Goods and Services Transactions", NBER Working Paper No. 5516, National Bureau of Economic Research: Cambridge.
Borchert, I., B. Gootiiz and A. Mattoo (2012) "Guide to the Services Trade Restrictions Database", World Bank Policy Research Working Paper no. 6108, The World Bank: Washington, DC.
Cernat, L. and Z. Kutlina-Dimitrova (2014), “Thinking in a Box: A ‘Mode 5’ Approach to Services Trade”, Journal of World Trade, 48 (6): 1109-1126.
Chang, P., G Karsenty, A Mattoo, and J. Richtering (1999) "GATS, the Modes of Supply and Statistics on Trade in Services", Journal of World Trade 33(3): 93-115.
Christen, E., J. Francois and B. Hoekman (2013) "Computable General Equilbrium Modeling of Market Access in Services", in P. B. Dixon and D. W. Jorgenson (eds.), Handbook of Computable General Equilibrium Modeling, Vol.1, Elsevier: 1601–1643
Dee, Ph. (2013) Priorities and Pathways in Services Reforms, World Scientific Studies in International Economics vol.23, Singapore.
DFAT (2007) "Trade in services statistics – the Australian experience", Australian Department of Foreign Affairs and Trade, available online at https://dfat.gov.au/about-us/publications/Documents/trade-in-services-statistics-the-australian-experience.pdf
European Commission (2013) Trade, Growth and Jobs: Commission contribution to the European

Chief Economist Note
22
Council, European Commission: Brussels, February. Hoekman, B. (2006) "Liberalizing Trade in Services: A Survey", World Bank Policy Research Working Paper 4030, World Bank: Washington, D.C., October.
Isanta, J.A. (2014) “Trade in services by modes of supply: experience and first results from Spain”, Meeting on the Liaison Platform on ITSS, Eurostat: Luxembourg, June 19.
Jansen, M. and R. Piermartini (2004) "The Impact of Mode 4 on Trade in Goods and Services", WTO Staff Working Paper 7/2004, World Trade Organization: Geneva.
Karsenty, G. (2000) "Assessing Trade in Services by Modes of Supply", in P. Sauvé and R. M. Stern (eds.), GATS 2000: New Directions in Services Trade Liberalization, Brookings Institution Press: Washington, D.C.: 33-56.
Kerner, R. (2015) "Services Trade by Mode of Supply", Working Group on International Trade in Services Statistics, Eurostat: Luxembourg, June 2015.
Mattoo, A., R.M. Stern and G. Zanini (eds.) (2008) A Handbook of International Trade in Services, Oxford University Press: Oxford.
Maurer, A., Y. Marcus, J. Magdeleine, and B. d’Andrea (2008) "Measuring Trade in Services" in Mattoo, A., R.M. Stern and G. Zanini (eds.) (2008) A Handbook of International Trade in Services, Oxford University Press: Oxford.
Magdeleine, J., A. Maurer (2008) "Measuring GATS Mode 4 Trade Flows", WTO Staff Working Paper 5/2008, World Trade Organization: Geneva.
Meehan, L. (2014) "New Zealand's international trade in services: A background note", Research Note 1/2014, New Zealand Productivity Commission: Wellington, June.
Marchetti, J. A., M. Roy (2014) "The TISA Initiative: An Overview of Market Access Issues", Journal of World Trade 48(4): 683–728.
Marchetti, J. A. and P. C. Mavroidis (2011) "The Genesis of the GATS (General Agreement on Trade in Services)", The European Journal of International Law, 22(3): 689–721
OECD (2015) "Results of the work of WPTGS Informal Reflection Group 3 on providing more detailed services trade data", Organisation for Economic Cooperation and Development: Paris. Roy, M., J. Marchetti and H. Lim (2007) ‘Services Liberalization in the New Generation of Preferential Trade Agreements: How Much Further than the GATS?", World Trade Review 6(2): 155–192.

Chief Economist Note
23
Rouzet, D., H. Nordas, F. Gonzales, M. G. Grosso, I. Lejaragga, S. Miroudot, A. Ueno (2014) "Services Trade Restrictiveness Index (STRI): Financial Services", OECD Trade Policy Papers 175, OECD: Paris. Sampson, G. and R. Snape (1985) “Identifying the Issues in Trade in Services,” The World Economy 8: 171-81.
Sauvé, P. and R. M. Stern (eds.), GATS 2000: New Directions in Services Trade Liberalization, Brookings Institution Press: Washington, D.C.
Sauvé, P. and M. Roy (2016) Research Handbook on trade in services, Edward Elgar: Cheltenham.
Stern, R.M., and B. Hoekman (1987). “Analytical Issues and Data Needs for GATT Negotiations on
Services,” The World Economy 10: 39-60.
United Nations (2011) Manual on Statistics of International Trade in Services 2010, United Nations: New York.
United Nations (2014) Manual on Statistics of International Trade in Services - Compilers Guide, United Nations: New York.
Walmsley, T. and L. A. Winters (2005) “Relaxing the Restrictions on the Temporary Movement of Natural Persons: A Simulation Analysis,” Journal of Economic Integration 20(4): 688-736
Walter, J. (2016) “Services trade statistics by modes of supply: a progress report”, Meeting of the OECD Working Party on International Trade in Goods and Trade in Services Statistics, OECD, Paris, March 21-24.
WTO (2016) World Trade Statistical Review 2016, World Trade Organization: Geneva.

Chief Economist Note
24
Annex 1 ITSS exports and outward FATS:
allocation of FATS and BoP services data to modes of supply
EBOPS FATS Mode 3
Mode 1
Mode 2
Mode 4
SA Manufacturing services C10-C329 Manufacturing X
SB Maintenance and repair services C33+10 Repair and installation of
machinery equipment X X X
SC Transport services H+ Transportation and storage X X X
SD Travel I+ Accommodation and food service activities X X
SE Construction F+ Construction X X
SF Insurance and pension services K65+
Insurance, reinsurance and pension funding, except compulsory social security
X X
SG Financial services K64+ Financial services activities, except insurance and pension funding
X X
SH Charges for the use of intellectual property n.i.e.
J59+ Motion picture, video and TV production, sound recording and music publishing activity
X X
SI Telecommunications, computer and information services
J (part) Information and communication X X X
SJ Other business services M+ Professional, scientific and technical activities X X X X
SK Personal, cultural and recreational services R+ Arts, entertainment and recreation X X X
Distribution (wholesale, retail trade) services
G45+G46+ G4711 Wholesale trade and Retail trade X
9 This FATS sector is not included in the current estimates, as it is assumed that enterprises belonging to manufacturing activities, produce mainly goods. Further development needed in the future to estimate the "services" share in the manufacturing turnover of FATS. Breakdown by goods and services is needed in FATS data. 10 "+" means that there are some more NACE sub-activities that are added to the main activity turnover value. 11 For "distribution services", "production" value was used, instead of "turnover" value that was used for the other activities' estimates.

Chief Economist Note
25
Annex 2
Service components in the UN Manual on Statistics of International Trade in Services
This annex offers additional information on the services components included in the sectoral breakdown used in this paper. The scope of international trade in services in the conventional balance of payments sense of transactions between residents and non-residents is determined by the scope of the major service components of BPM6 which, for the purposes of this paper, are as follows (MSITS Compilers Guide, 2014):
• Manufacturing services on physical inputs owned by others. • Maintenance and repair services n.i.e. • Transport. • Travel. • Construction. • Insurance and pension services. • Financial services. • Charges for the use of intellectual property n.i.e. • Telecommunications, computer and information services. • Other business services. • Personal, cultural and recreational services.
Manufacturing services on physical inputs owned by others, the following activities are included: processing, assembly, labelling and packing that are undertaken by enterprises that do not own the goods. Examples include oil refining, liquefaction of natural gas and assembly of clothing and electronics. Excluded are the assembly of prefabricated construction (included in construction) and labelling, and packing incidental to transport (included in transport services). Maintenance and repair services include: maintenance and repair work by residents on goods that are owned by non-residents (and vice versa). The repairs may be performed at the site of the repairer or elsewhere. Maintenance and repairs on ships, aircraft and other transport equipment are included in this item. The compilers should note, however, that the following items are excluded: (i) cleaning of transport equipment (included in transport services), (ii) construction repairs and maintenance (included under construction), (iii) maintenance and repairs of computers (included under computer services). Transport covers the process of carriage of people and objects from one location to another location as well as related supporting and auxiliary services and rentals (charters) of carriers with crew. Transport also includes postal and courier services. Transport can be classified according to the mode of transport and what is carried – passengers or freight, as well as by

Chief Economist Note
26
other auxiliary services. Passenger services cover the transport of people. It includes all services provided in the international transport of non-residents by resident carriers (export of services) and that of residents by non-resident carriers (import of services). Freight services cover the transport of goods. EBOPS transport item covers also (i) other supporting and auxiliary transport services and (ii) postal and courier services. Travel, unlike most services in EBOPS, travel is not a specific product; rather, it encompasses a range of goods and services consumed by non-residents in the economy that they visit. Travel is defined as covering goods and services for own use or to be given away, acquired from an economy, by non-residents during visits to that economy. It covers stays of any length, provided that there is no change in residence. Construction covers the creation, management, renovation, repair or extension of fixed assets in the form of buildings, land improvements of an engineering nature and other constructions such as roads, bridges and dams. It also includes related installation and assembly work, site preparations and general construction as well as specialized services such as painting, plumbing and demolition. Constructions lasting one year or less are included here. Insurance and pension services cover the provision to non-residents of various types of insurance by resident insurance corporations, and vice versa. Financial services cover financial intermediation and auxiliary services, except those of insurance corporations and pension funds. These services include those usually provided by banks and other financial intermediaries and auxiliaries. Financial services include services provided in connection with transactions in financial instruments, as well as other services related to financial activity. Financial services may be charged by: explicit charges; margins on buying and selling transactions etc. For many financial services, explicit fees are charged, thus estimation does not require any special calculation. Telecommunications, computer and information services: Telecommunications services cover the broadcast or transmission of sound, images, data, or other information by telephone, telex, telegram, radio and television cable transmission, radio and television satellite, electronic mail, facsimile, etc., and includes business network services, teleconferencing and support services. Computer services consist of hardware- and software-related services and data processing services. Information services consist of news agency services and other information services. Other business services includes three sub-components: research and development services, professional and management consulting services and technical, trade-related and other business services. Research and development services cover those services that are associated with basic research, applied research and experimental development of new products and processes. Professional and management consulting services include legal, accounting, management consulting, and public relations services, advertising, market research and public opinion polling services. Technical, trade-related and other business services cover architectural, engineering, scientific and other technical services; waste treatment and de-

Chief Economist Note
27
pollution, agricultural and mining services; operating leasing services; trade-related services; and other business services. Personal, cultural, and recreational services comprises two sub-components: (i) audio-visual and related services and (ii) other personal, cultural, and recreational services. Audio-visual and related services covers services associated with audio-visual activities (movies, music, radio and television) as well as services relating to the performing arts. Other personal, cultural, and recreational services cover health services, education services, heritage and recreational services and other personal services.