trade and inequality, revisited
TRANSCRIPT


Trade and inequality, revisited
Paul Krugman

Ayes Noes
Democrats 102 156
Republicans 132 43
The NAFTA vote, 1993

AYES NOES
REPUBLICAN 202 27DEMOCRATIC 15 187INDEPENDENT 1TOTALS 217 215
CAFTA VOTE, 2005
The pact faces near-unanimous opposition by Democrats, who charge it failsto offer adequate labor protections. It also faces opposition or misgivings byRepublicans from districts with large numbers of sugar producers, textilemakers and other manufacturers - Marketwatch
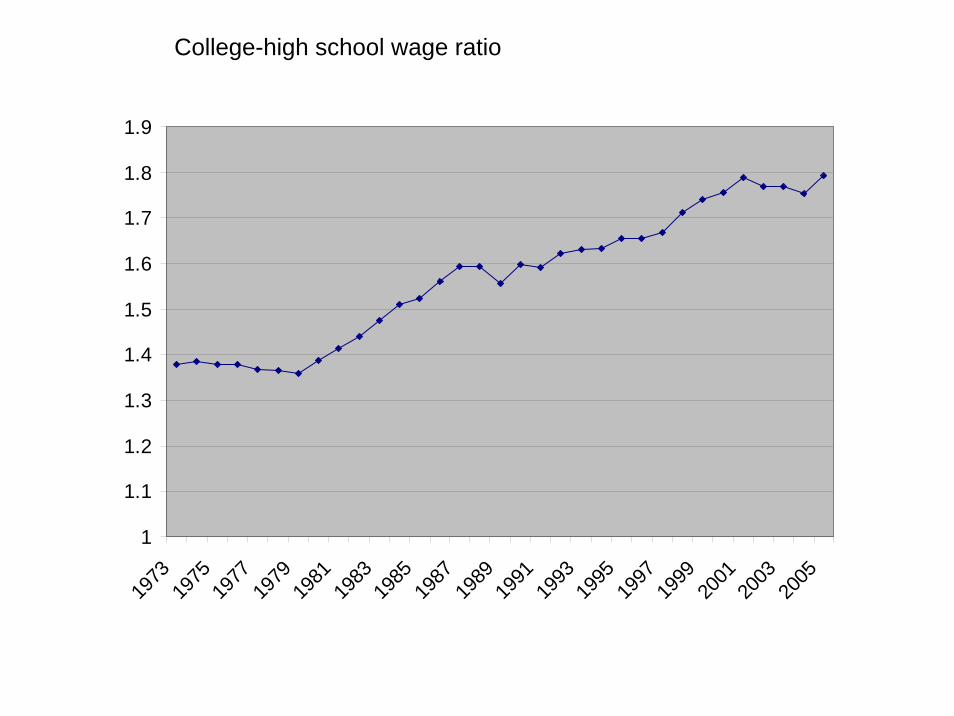
1
1.1
1.2
1.3
1.4
1.5
1.6
1.7
1.8
1.9
1973
1975
1977
1979
1981
1983
1985
1987
1989
1991
1993
1995
1997
1999
2001
2003
2005
College-high school wage ratio

From John Romalis, AER 2004

From “Growing world trade: causes and consequences”, 1995

0
1
2
3
4
5
6
1970 1990
% o
f GD
P
Imports of manufactures from NIEs

From “Growing world trade: causes and consequences”, 1995
Bernanke, this year:
Unfortunately, much of the available empirical research on the influenceof trade on earnings inequality dates from the 1980s and 1990s and thusdoes not address later developments. Whether studies of the more-recentperiod will reveal effects of trade on the distribution of earnings that differfrom those observed earlier is to some degree an open question.

0
1
2
3
4
5
6
1970 1990 2005
% o
f GD
P
Imports of manufactures from NIEs

From Romalis 2004

Relative trading partner wages
0
10
20
30
40
50
60
70
80
1975 1990 2005
% o
f US

“Growing world trade,” again

H
L
Outsourcing made simple (really): Samuelson’s angel
Computers
Apparel

H
L
The angel’s wrath …
Factor price equalization
North
South

H
L
Bundling
North
South
L-intensiveactivities incomputers
H-intensive activities in apparel
FPE


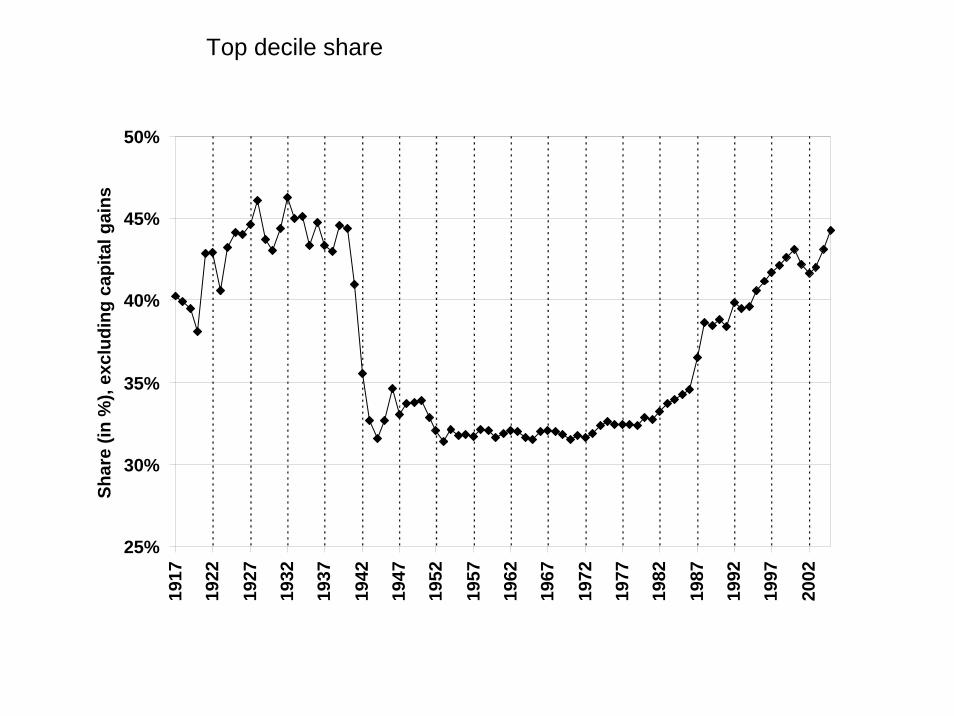
25%
30%
35%
40%
45%
50%
1917
1922
1927
1932
1937
1942
1947
1952
1957
1962
1967
1972
1977
1982
1987
1992
1997
2002
Shar
e (in
%),
excl
udin
g ca
pita
l gai
ns
Top decile share

5%6%7%8%9%
10%11%12%13%14%15%16%17%18%19%20%
1913
1918
1923
1928
1933
1938
1943
1948
1953
1958
1963
1968
1973
1978
1983
1988
1993
1998
2003
Shar
e (in
%),
excl
udin
g ca
pita
l gai
ns
P90-95 P95-99 P99-100
