tracy elementary school · 2015-11-17 · tracy elementary school school improvement plan 2015-2016...
TRANSCRIPT
Tracy Elementary School
School Improvement Plan
2015-2016
School Improvement Team
Pattye Griffin - Principal Allison Gibbs - Math CIT
Deborah Grant - Grade 2 Teacher Christina Kotsakis - Reading Teacher
Amy O’Shea Wallace - Special Education Teacher
School Council Members
Pattye Griffin - Principal Amanda Place - ESL Teacher
Kristin Page – Grade 1 Teacher Jennifer Nordyke - Grade 5 Teacher
Bessie Broufas - Grade 5 Teacher Jean DeMase - Parent Rocio Mora – Parent
Tracy Elementary School 2015-2016 School Improvement Plan
2
Vision and Mission Lynn Public School’s Vision: All Lynn students will graduate from high school with the skills to make informed choices and pursue further learning as socially responsible citizens.
Lynn Public School’s Mission: To continuously improve students’ social, cultural, and academic achievement and provide all students with the skills, knowledge and experiences to achieve our vision.
Narrative Description of the School Demographic Data: Include a description of the student population (subgroup status, enrollment history, attendance), administrative staff, teaching staff (including years of service, attendance, and recruitment of highly qualified teachers), and the organization of the school.
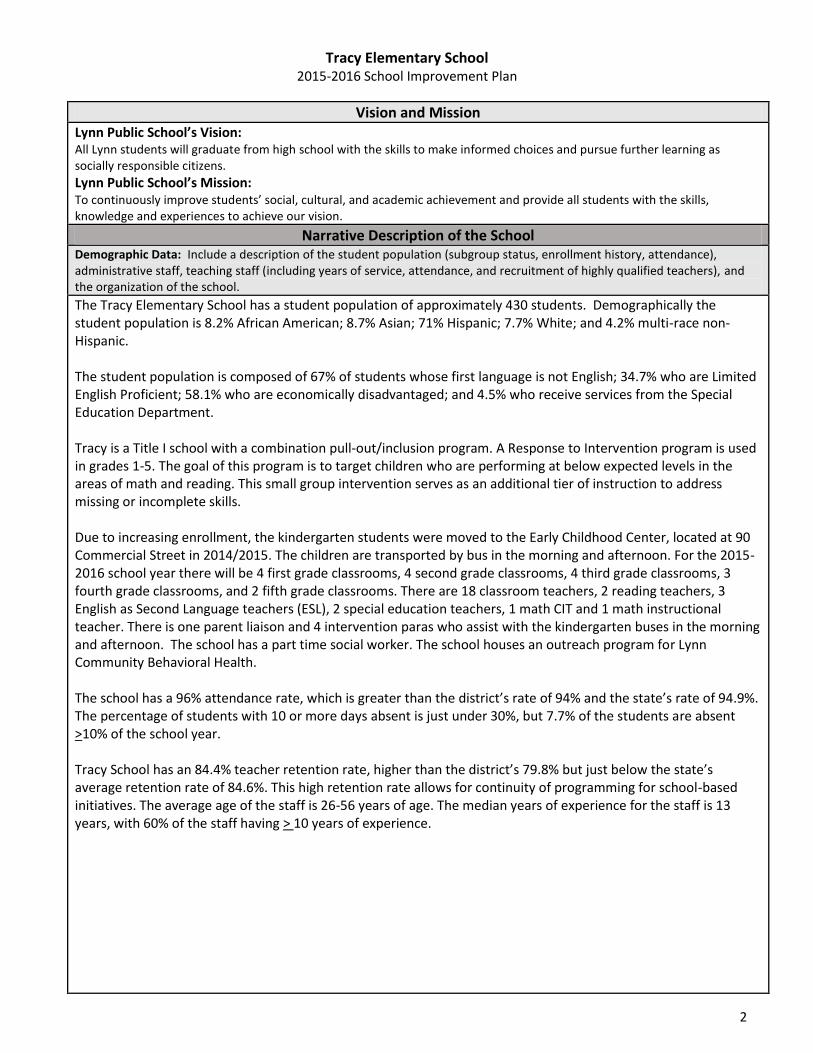
The Tracy Elementary School has a student population of approximately 430 students. Demographically the student population is 8.2% African American; 8.7% Asian; 71% Hispanic; 7.7% White; and 4.2% multi-race non-Hispanic. The student population is composed of 67% of students whose first language is not English; 34.7% who are Limited English Proficient; 58.1% who are economically disadvantaged; and 4.5% who receive services from the Special Education Department. Tracy is a Title I school with a combination pull-out/inclusion program. A Response to Intervention program is used in grades 1-5. The goal of this program is to target children who are performing at below expected levels in the areas of math and reading. This small group intervention serves as an additional tier of instruction to address missing or incomplete skills. Due to increasing enrollment, the kindergarten students were moved to the Early Childhood Center, located at 90 Commercial Street in 2014/2015. The children are transported by bus in the morning and afternoon. For the 2015-2016 school year there will be 4 first grade classrooms, 4 second grade classrooms, 4 third grade classrooms, 3 fourth grade classrooms, and 2 fifth grade classrooms. There are 18 classroom teachers, 2 reading teachers, 3 English as Second Language teachers (ESL), 2 special education teachers, 1 math CIT and 1 math instructional teacher. There is one parent liaison and 4 intervention paras who assist with the kindergarten buses in the morning and afternoon. The school has a part time social worker. The school houses an outreach program for Lynn Community Behavioral Health. The school has a 96% attendance rate, which is greater than the district’s rate of 94% and the state’s rate of 94.9%. The percentage of students with 10 or more days absent is just under 30%, but 7.7% of the students are absent >10% of the school year. Tracy School has an 84.4% teacher retention rate, higher than the district’s 79.8% but just below the state’s average retention rate of 84.6%. This high retention rate allows for continuity of programming for school-based initiatives. The average age of the staff is 26-56 years of age. The median years of experience for the staff is 13 years, with 60% of the staff having > 10 years of experience.
Tracy Elementary School 2015-2016 School Improvement Plan
3
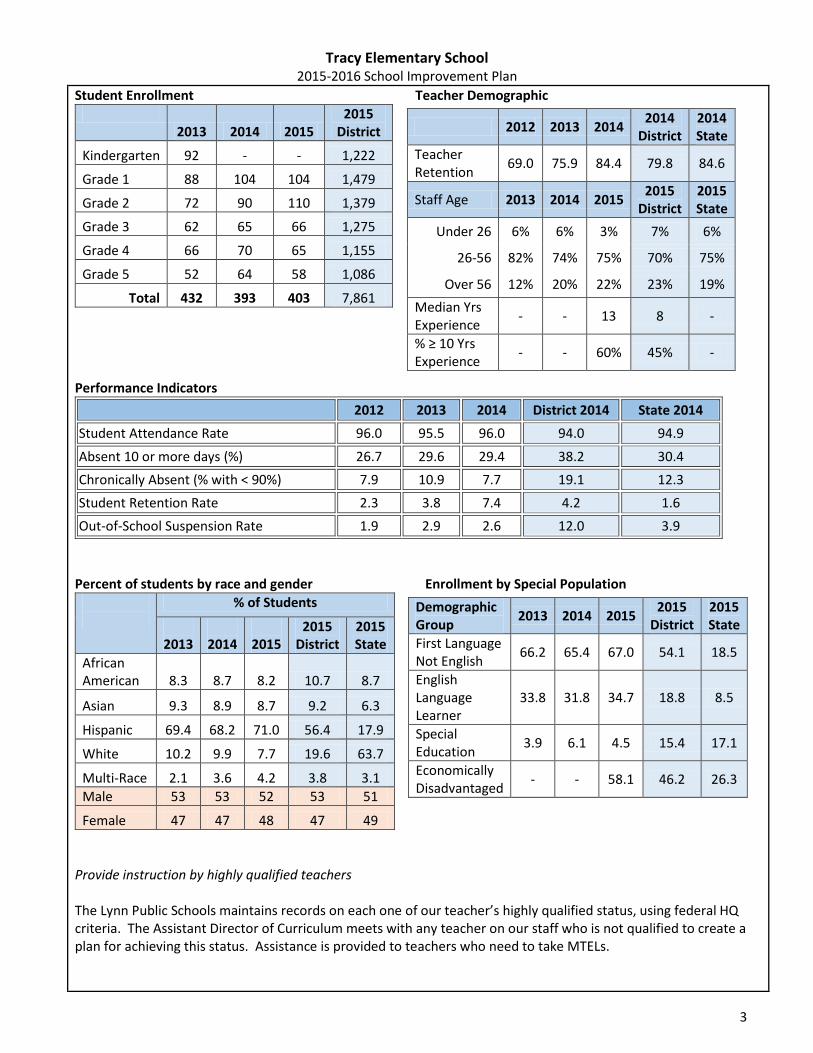
Student Enrollment Teacher Demographic
2013 2014 2015
2015 District
Kindergarten 92 - - 1,222
Grade 1 88 104 104 1,479
Grade 2 72 90 110 1,379
Grade 3 62 65 66 1,275
Grade 4 66 70 65 1,155
Grade 5 52 64 58 1,086
Total 432 393 403 7,861
Performance Indicators
2012 2013 2014 District 2014 State 2014
Student Attendance Rate 96.0 95.5 96.0 94.0 94.9
Absent 10 or more days (%) 26.7 29.6 29.4 38.2 30.4
Chronically Absent (% with < 90%) 7.9 10.9 7.7 19.1 12.3
Student Retention Rate 2.3 3.8 7.4 4.2 1.6
Out-of-School Suspension Rate 1.9 2.9 2.6 12.0 3.9
Percent of students by race and gender Enrollment by Special Population
% of Students
2013
2014
2015
2015 District
2015 State
African American 8.3 8.7 8.2 10.7 8.7
Asian 9.3 8.9 8.7 9.2 6.3
Hispanic 69.4 68.2 71.0 56.4 17.9
White 10.2 9.9 7.7 19.6 63.7
Multi-Race 2.1 3.6 4.2 3.8 3.1
Male 53 53 52 53 51
Female 47 47 48 47 49
Provide instruction by highly qualified teachers The Lynn Public Schools maintains records on each one of our teacher’s highly qualified status, using federal HQ criteria. The Assistant Director of Curriculum meets with any teacher on our staff who is not qualified to create a plan for achieving this status. Assistance is provided to teachers who need to take MTELs.
2012 2013 2014 2014
District 2014 State
Teacher Retention
69.0 75.9 84.4 79.8 84.6
Staff Age 2013 2014 2015 2015
District 2015 State
Under 26 6% 6% 3% 7% 6%
26-56 82% 74% 75% 70% 75%
Over 56 12% 20% 22% 23% 19%
Median Yrs Experience
- - 13 8 -
% ≥ 10 Yrs Experience
- - 60% 45% -
Demographic Group
2013 2014 2015 2015
District 2015 State
First Language Not English
66.2 65.4 67.0 54.1 18.5
English Language Learner
33.8 31.8 34.7 18.8 8.5
Special Education
3.9 6.1 4.5 15.4 17.1
Economically Disadvantaged
- - 58.1 46.2 26.3
Tracy Elementary School 2015-2016 School Improvement Plan
4
School Processes Data: Include a description of the implementation of the core instructional programs for all students, students with disabilities, and English language learners and the intervention strategies designed to address the needs of at-risk students. In addition, provide information about any other initiatives being implemented in regards to curriculum, instruction, assessment, professional development, and school culture.
Core Instructional programs:
National Geographic’s REACH for Reading Program for Grades One and Two
National Geographic’ REACH program for ESL students in Grades One and Two
Houghton Mifflin’s Trophies Reading Program for Grades Three, Four, and Five
Houghton Mifflin’s Go Math
Common Core State Standards (CCSS)
Science program designed by the city of Lynn Tracy School uses Cross Classroom instructional groupings to address students who are performing below grade level expectations. Data Meetings are scheduled every eight weeks to review the student’s scores on DIBELs, DAZE, and math fact fluency tests, as well as common grade level assessments. Students who are not making anticipated gains in these tests are identified and an analysis of the students’ errors assists in identifying the instructional needs of the students. Students are placed into small groups for a Tier 2 instructional group according to similarities of errors. The children receive their instruction during a grade-wide Walk to Intervention Block for reading. For Math Interventions, the students receive an additional dose of instruction during the independent phase of the gradual release model. Materials used during interventions include:
Anchor Comprehension by Benchmark
Sidewalks
Intervention Toolkits
Trait Crates
Encore Math
First In Math
Do The Math by Marilyn Burns
Internet Resources In addition to the data Meetings held every eight weeks, teachers have weekly common planning time with grade-level teachers and associated interventionists. During this time the teachers review the planned lessons for possible interventions that may be necessary. By using common lesson plans across all grade levels, it ensures all students have similar curricular knowledge and allows the teachers to actively use student work as a basis for understanding the student response to instruction. In the past few years, the teachers have delved into a variety of instructional techniques. Several teachers were trained in Universal Design for Learning (UDL). The principal and another teacher participated in training at Harvard University during July, 2013. Additional training of 9 staff members and the principal was held at CAST in Wakefield. This identified practice was the focus of staff meetings. Lessons were expected to utilize the practice of individualizing instruction for the neediest students. The following year training and best practices for English Language Learners based on ACCESS’s Can-Do Indicators, including model performance indicators (MPIs) was the school wide focus. The goal was to provide instructional techniques for showing student mastery based on the student’s English language acquisition. The staff meetings, led by the ESL teachers, worked to increase teachers’ ability to plan for the students identified model performance indicators using the can-do descriptors from WIDA. Last year the focus was on Total Participation Techniques (TPT) for enhanced student engagement. In order to increase student performance the students needed to be actively engaged in the lesson. A year-long staff development, in the form of a book talk on the book Total Participation Techniques: Making Every Student and Active Learner by Persida Himmele and William Himmele (2011). The teachers constructed a flipchart designed by
Tracy Elementary School 2015-2016 School Improvement Plan
5
the principal of the various techniques and they used them in their lessons as evidenced by lesson plans, student work samples, and principal’s observation. Reflecting on the 2015 ACCESS scores, the speaking scores are significantly lower in comparison to listening, reading, and writing. Therefore, the focus of the school will be to increase academic discourse within the classrooms using best practices including sentence frames, graphic organizers, TPTs, word banks, etc. Monthly Faculty meetings gives teachers time to review the current school based initiative, increasing academic discourse. Meetings are structured as a professional learning community, giving teachers time to develop new knowledge and instructional strategies. The teachers are expected to utilize those strategies during classroom instruction, as evidenced by lesson plans, student work samples, and principal walk-throughs. An additional focus will be to decrease the amount of chronically tardy and absent students. Methodology includes tips and strategies from the Attendanceworks.org website. Since research identifies poor attendance as a hindrance to academic learning, the school will work to increase parental awareness of the effects of poor attendance as a way of increasing the student’s academic language. School endeavors to develop students who are demonstrate strong citizenship skills. This is evident during the morning announcements when the students are greeted as Tracy Family and they recite the school motto “Do something nice for somebody else, just because you can” and the Pledge of Allegiance. Every child is recognized with birthday bags to celebrate their birthday. Accomplishments such as Daily and Weekly acknowledgement of First in Math achievements, Perfect Attendance and Citizen of the Month are recognized at the monthly family meetings. The communities are included during Family and community engagement activities, such as Winter Wonderland and Field Day and Holiday concerts and performances, such as Veteran’s Day, Memorial Day, Flag Day, Winter concert, etc. Additional community support is given through weekly parent newsletters as well as the Spanish-speaking school liaison
Students are given additional opportunities for learning through MCAS Bootcamps for ELA and Math for targeted students in grades 3-5. To increase interest in science, the fifth grades have a Robotics Club that meets weekly. Students who are acquiring English have the opportunity to participate in the Imagine Learning computer program three times a week. Students who need assistance completing their homework may join the Homework Help club, which is staffed by teachers and volunteers from the fifth grade student council. Create strategies to attract highly qualified teachers Our school is advised by the Lynn Public Schools’ Human Resources Office when teaching positions become available at the school. Resumes are forwarded from their office with the credentials of all teaching applicants. The Human Resources Office, in concert with the Assistant Director of Curriculum for Teaching Quality work to identify teachers who are highly qualified in terms of credentials and who aspire to serve youths in a large, urban community with many challenges. Recruitment fairs, advertising, and contacts with local schools of education are utilized as a way in which to locate teachers. In addition, the district has implemented processes and procedures for student teachers, which has resulted in a number of subsequent teaching hires at our school. Collaborative programs with Salem State, Northeast Consortium for Staff Development and several planned coop programs with Endicott College are easily accessed by teachers who are earning credentials. Furthermore, the district provides tutoring for any professional seeking to pass MTELs. Teacher Evaluation All of our teachers are evaluated using the Massachusetts Educator Evaluation System. Teachers who might be “in need of improvement” are monitored as they work towards improving their instruction. Curriculum and instruction teachers, math and ELA coaches, and ESL coaches work to model lessons for teachers who need to improve.
Tracy Elementary School 2015-2016 School Improvement Plan
6
Coordinate and integrate Federal, State, and local services and programs; and meet intent and purposes of each program whose funds are consolidated, if applicable. Our school submits budget requests directly to the Superintendent’s Senior Leadership team. This team includes both Deputy Superintendents, the Executive Director of Curriculum, the ELL coordinator, the SPED administrator, the human resources manager, and the financial manager for the Lynn Public Schools. As the organization is formed and resources are allocated, all sources of funds are coordinated in order to meet the needs of our school.
Perception Data: Provide any formal or informal information regarding the perception of the school’s learning environment by district and school leaders, students, teachers, parents and community members.
The school is perceived in a positive light by students and parents. In a formal survey of grades one and two parents, a majority agreed that the school is adequately preparing their child for the future. Furthermore, parents provided feedback stating “As a mother, I am satisfied with what the school has done for my son,” and “At this moment, the school is doing what they are supposed to do. I'm grateful and content with the way the school works.” One fifth grade student expressed his connection with the school by writing, “They (the teachers) all care about my grades and all the teachers … are concerned, believe in me, and want me to succeed in life and also to have a great life.”
Student Learning Data: Provide a summary of the achievement trends of the school. Include information about student proficiency on MCAS and accountability data (i.e., CPI, student growth percentiles, and graduation and dropout rates).
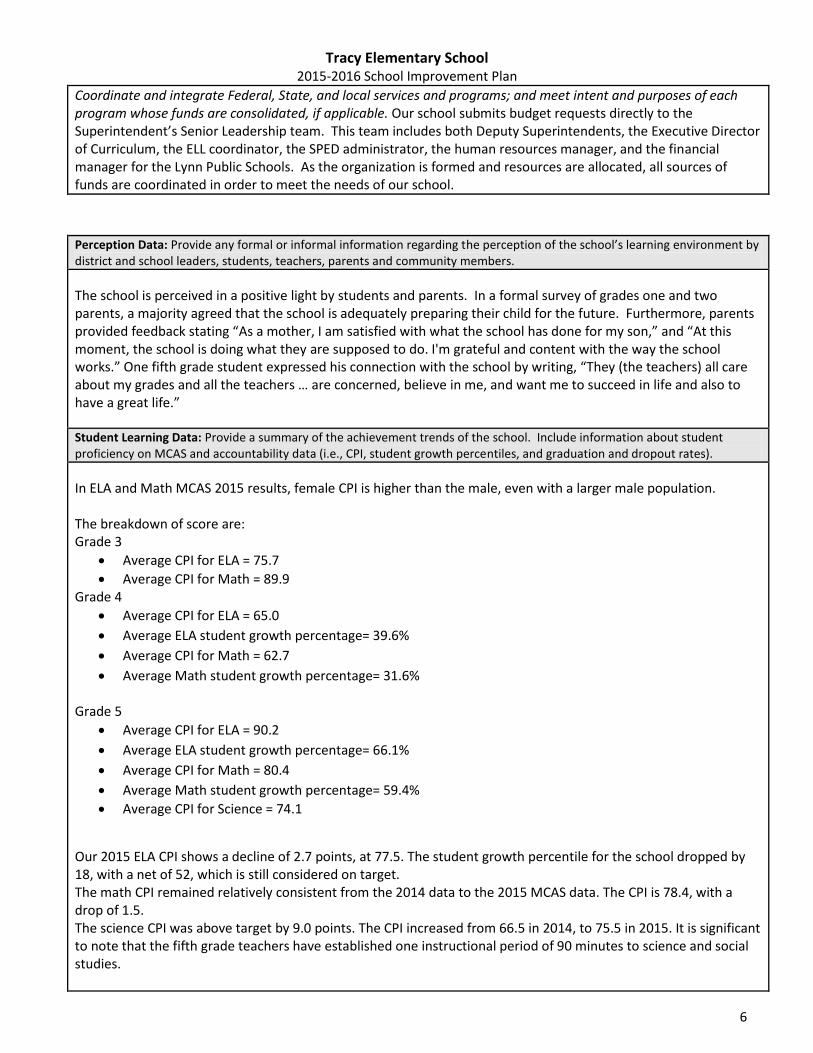
In ELA and Math MCAS 2015 results, female CPI is higher than the male, even with a larger male population. The breakdown of score are: Grade 3
Average CPI for ELA = 75.7
Average CPI for Math = 89.9 Grade 4
Average CPI for ELA = 65.0
Average ELA student growth percentage= 39.6%
Average CPI for Math = 62.7
Average Math student growth percentage= 31.6% Grade 5
Average CPI for ELA = 90.2
Average ELA student growth percentage= 66.1%
Average CPI for Math = 80.4
Average Math student growth percentage= 59.4%
Average CPI for Science = 74.1
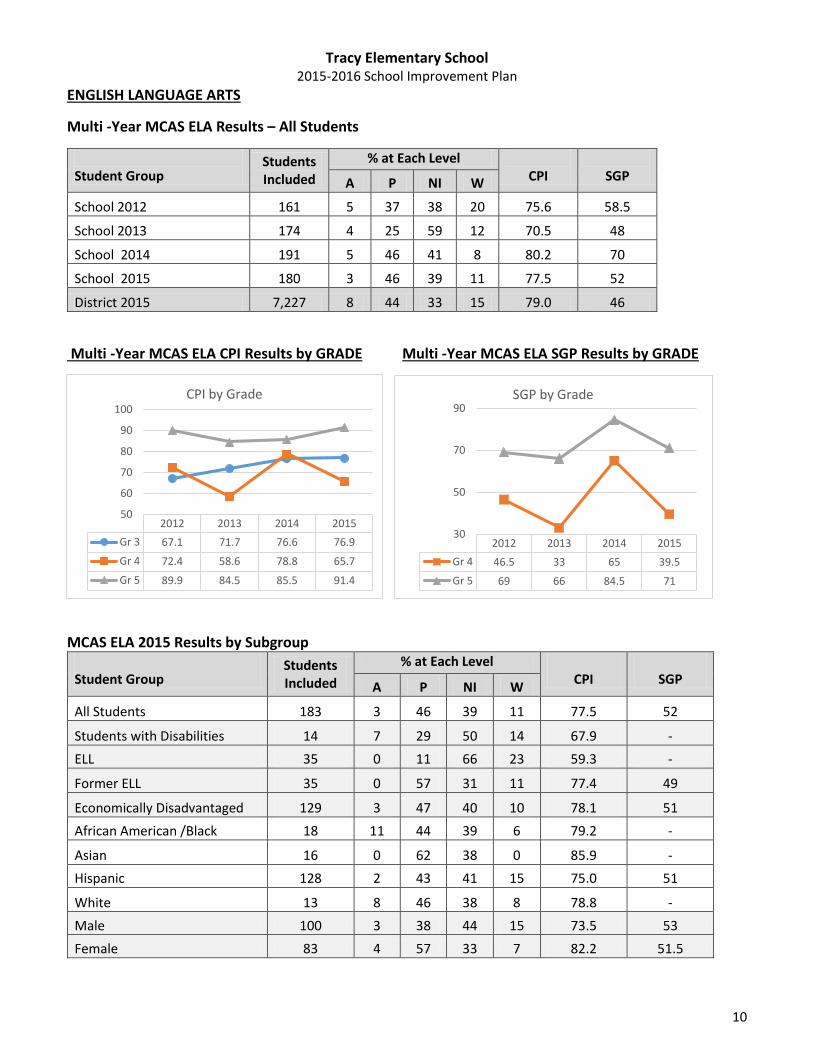
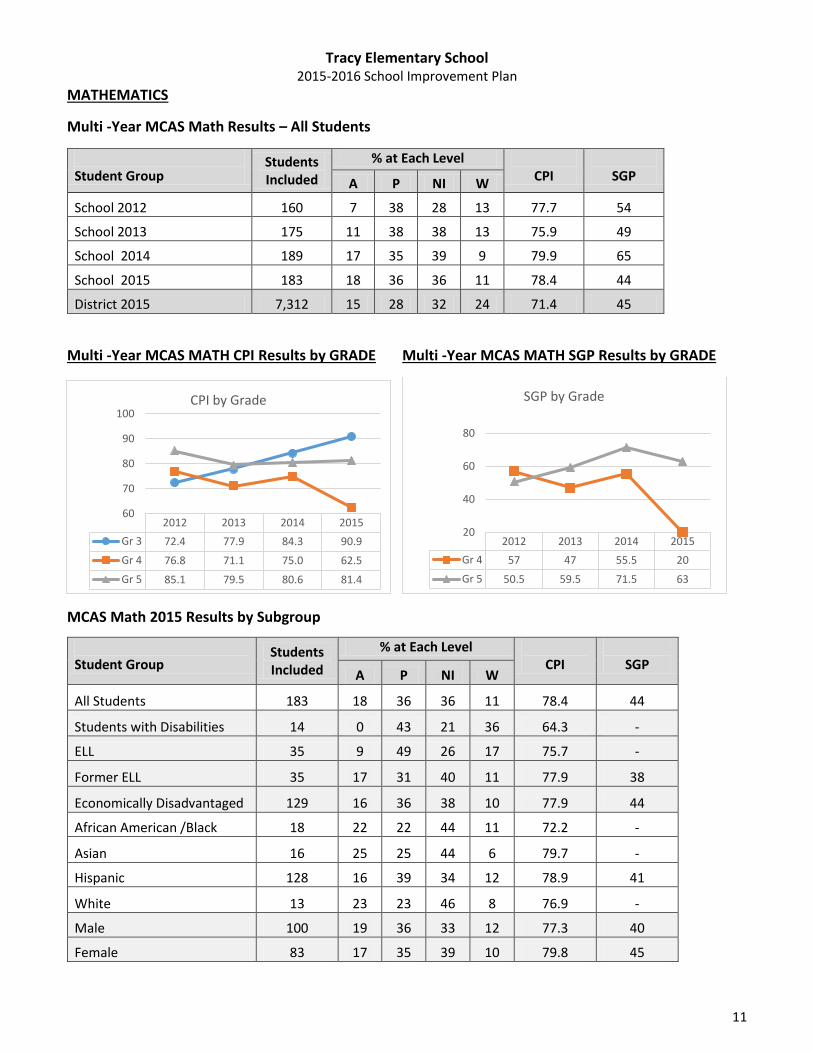
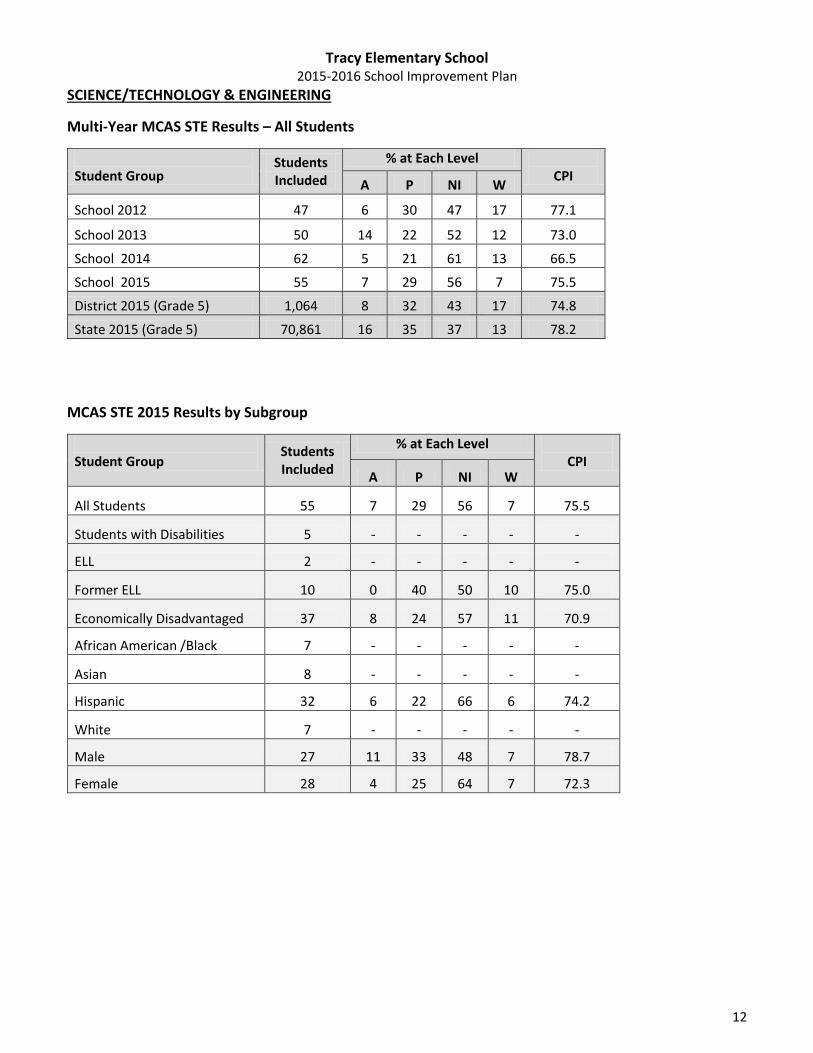
Our 2015 ELA CPI shows a decline of 2.7 points, at 77.5. The student growth percentile for the school dropped by 18, with a net of 52, which is still considered on target. The math CPI remained relatively consistent from the 2014 data to the 2015 MCAS data. The CPI is 78.4, with a drop of 1.5. The science CPI was above target by 9.0 points. The CPI increased from 66.5 in 2014, to 75.5 in 2015. It is significant to note that the fifth grade teachers have established one instructional period of 90 minutes to science and social studies.
Tracy Elementary School 2015-2016 School Improvement Plan
7
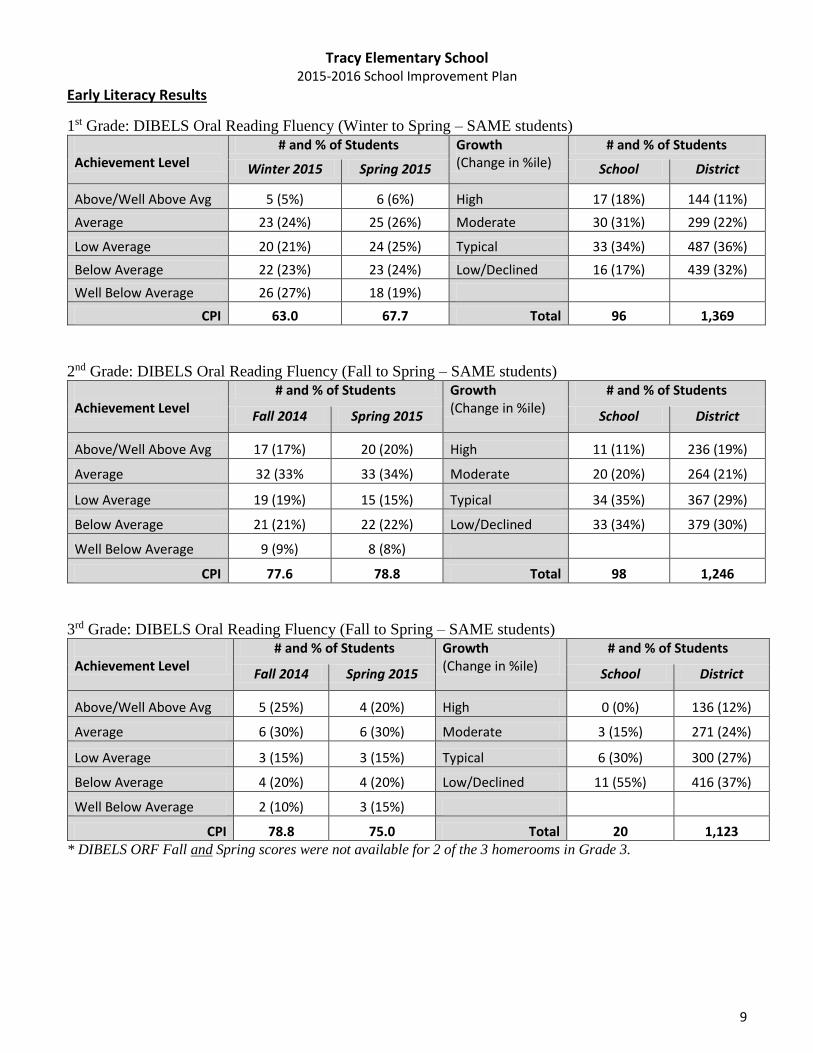
The student growth percentile (SGP) for all subgroups is at or near the 50th percentile. The student growth percentile for the All Students group (n=183) is 52%. The Former ELL group (n=35) has a SGP of 49%, Economically disadvantaged (n= 129) has a SGP of 51%, and the Hispanic subgroup (n=128) has a SGP of 51%. The male SGP (n=100) is 53% and the female (n=83) is 51.5%. In the DIBELS Next Oral Reading Fluency assessment for the end of the year, 83% of the first grade students made typical, moderate, or high growth. The CPI for DIBELS Next Oral Reading Fluency increased from 63.0 in the winter benchmarks to 67.7 in the spring benchmarks. In second grade 67% made typical, moderate, or high growth. The CPI for DIBELS Next Oral Reading Fluency increased from 77.8 in the fall benchmarks to 78.8 in the spring benchmarks. In the 2015 ACCESS testing, the data illustrates the growth achieved in reading and writing, which were focus areas
in previous years. The current focus area will be to increase the students’ academic discourse. These efforts will
provide the basis for increased scores in the speaking domain.
Tracy Elementary School 2015-2016 School Improvement Plan
8
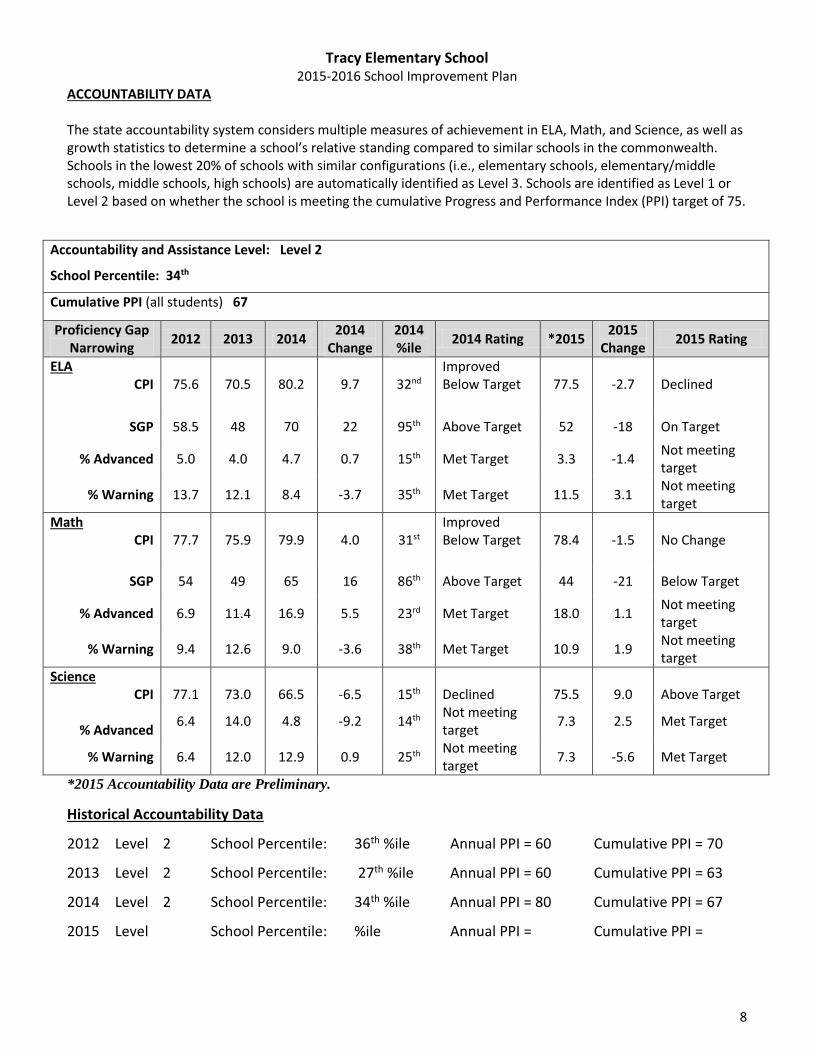
ACCOUNTABILITY DATA The state accountability system considers multiple measures of achievement in ELA, Math, and Science, as well as growth statistics to determine a school’s relative standing compared to similar schools in the commonwealth. Schools in the lowest 20% of schools with similar configurations (i.e., elementary schools, elementary/middle schools, middle schools, high schools) are automatically identified as Level 3. Schools are identified as Level 1 or Level 2 based on whether the school is meeting the cumulative Progress and Performance Index (PPI) target of 75.
Accountability and Assistance Level: Level 2
School Percentile: 34th
Cumulative PPI (all students) 67
Proficiency Gap Narrowing
2012 2013 2014 2014
Change 2014 %ile
2014 Rating *2015 2015
Change 2015 Rating
ELA CPI
75.6
70.5
80.2
9.7
32nd
Improved Below Target
77.5
-2.7
Declined
SGP 58.5 48 70 22 95th Above Target 52 -18 On Target
% Advanced 5.0 4.0 4.7 0.7 15th Met Target 3.3 -1.4 Not meeting target
% Warning 13.7 12.1 8.4 -3.7 35th Met Target 11.5 3.1 Not meeting target
Math CPI
77.7
75.9
79.9
4.0
31st
Improved Below Target
78.4
-1.5
No Change
SGP 54 49 65 16 86th Above Target 44 -21 Below Target
% Advanced 6.9 11.4 16.9 5.5 23rd Met Target 18.0 1.1 Not meeting target
% Warning 9.4 12.6 9.0 -3.6 38th Met Target 10.9 1.9 Not meeting target
Science CPI
77.1
73.0
66.5
-6.5
15th
Declined
75.5
9.0
Above Target
% Advanced
6.4 14.0 4.8 -9.2 14th Not meeting target
7.3 2.5 Met Target
% Warning 6.4 12.0 12.9 0.9 25th Not meeting target
7.3 -5.6 Met Target
*2015 Accountability Data are Preliminary.
Historical Accountability Data
2012 Level 2 School Percentile: 36th %ile Annual PPI = 60 Cumulative PPI = 70
2013 Level 2 School Percentile: 27th %ile Annual PPI = 60 Cumulative PPI = 63
2014 Level 2 School Percentile: 34th %ile Annual PPI = 80 Cumulative PPI = 67
2015 Level School Percentile: %ile Annual PPI = Cumulative PPI =
Tracy Elementary School 2015-2016 School Improvement Plan
9
Early Literacy Results
1st Grade: DIBELS Oral Reading Fluency (Winter to Spring – SAME students)
Achievement Level
# and % of Students Growth (Change in %ile)
# and % of Students
Winter 2015 Spring 2015 School District
Above/Well Above Avg 5 (5%) 6 (6%) High 17 (18%) 144 (11%)
Average 23 (24%) 25 (26%) Moderate 30 (31%) 299 (22%)
Low Average 20 (21%) 24 (25%) Typical 33 (34%) 487 (36%)
Below Average 22 (23%) 23 (24%) Low/Declined 16 (17%) 439 (32%)
Well Below Average 26 (27%) 18 (19%)
CPI 63.0 67.7 Total 96 1,369
2nd Grade: DIBELS Oral Reading Fluency (Fall to Spring – SAME students)
Achievement Level
# and % of Students Growth (Change in %ile)
# and % of Students
Fall 2014 Spring 2015 School District
Above/Well Above Avg 17 (17%) 20 (20%) High 11 (11%) 236 (19%)
Average 32 (33% 33 (34%) Moderate 20 (20%) 264 (21%)
Low Average 19 (19%) 15 (15%) Typical 34 (35%) 367 (29%)
Below Average 21 (21%) 22 (22%) Low/Declined 33 (34%) 379 (30%)
Well Below Average 9 (9%) 8 (8%)
CPI 77.6 78.8 Total 98 1,246
3rd Grade: DIBELS Oral Reading Fluency (Fall to Spring – SAME students)
Achievement Level
# and % of Students Growth (Change in %ile)
# and % of Students
Fall 2014 Spring 2015 School District
Above/Well Above Avg 5 (25%) 4 (20%) High 0 (0%) 136 (12%)
Average 6 (30%) 6 (30%) Moderate 3 (15%) 271 (24%)
Low Average 3 (15%) 3 (15%) Typical 6 (30%) 300 (27%)
Below Average 4 (20%) 4 (20%) Low/Declined 11 (55%) 416 (37%)
Well Below Average 2 (10%) 3 (15%)
CPI 78.8 75.0 Total 20 1,123 * DIBELS ORF Fall and Spring scores were not available for 2 of the 3 homerooms in Grade 3.
Tracy Elementary School 2015-2016 School Improvement Plan
10
ENGLISH LANGUAGE ARTS
Multi -Year MCAS ELA Results – All Students
Student Group
Students Included
% at Each Level CPI
SGP A P NI W
School 2012 161 5 37 38 20 75.6 58.5
School 2013 174 4 25 59 12 70.5 48
School 2014 191 5 46 41 8 80.2 70
School 2015 180 3 46 39 11 77.5 52
District 2015 7,227 8 44 33 15 79.0 46
Multi -Year MCAS ELA CPI Results by GRADE Multi -Year MCAS ELA SGP Results by GRADE
MCAS ELA 2015 Results by Subgroup Student Group
Students Included
% at Each Level CPI
SGP
A P NI W
All Students 183 3 46 39 11 77.5 52
Students with Disabilities 14 7 29 50 14 67.9 -
ELL 35 0 11 66 23 59.3 -
Former ELL 35 0 57 31 11 77.4 49
Economically Disadvantaged 129 3 47 40 10 78.1 51
African American /Black 18 11 44 39 6 79.2 -
Asian 16 0 62 38 0 85.9 -
Hispanic 128 2 43 41 15 75.0 51
White 13 8 46 38 8 78.8 -
Male 100 3 38 44 15 73.5 53
Female 83 4 57 33 7 82.2 51.5
2012 2013 2014 2015
Gr 4 46.5 33 65 39.5
Gr 5 69 66 84.5 71
30
50
70
90SGP by Grade
2012 2013 2014 2015
Gr 3 67.1 71.7 76.6 76.9
Gr 4 72.4 58.6 78.8 65.7
Gr 5 89.9 84.5 85.5 91.4
50
60
70
80
90
100CPI by Grade
Tracy Elementary School 2015-2016 School Improvement Plan
11
MATHEMATICS
Multi -Year MCAS Math Results – All Students
Student Group
Students Included
% at Each Level CPI
SGP
A P NI W
School 2012 160 7 38 28 13 77.7 54
School 2013 175 11 38 38 13 75.9 49
School 2014 189 17 35 39 9 79.9 65
School 2015 183 18 36 36 11 78.4 44
District 2015 7,312 15 28 32 24 71.4 45
Multi -Year MCAS MATH CPI Results by GRADE Multi -Year MCAS MATH SGP Results by GRADE
MCAS Math 2015 Results by Subgroup
Student Group
Students Included
% at Each Level CPI
SGP
A P NI W
All Students 183 18 36 36 11 78.4 44
Students with Disabilities 14 0 43 21 36 64.3 -
ELL 35 9 49 26 17 75.7 -
Former ELL 35 17 31 40 11 77.9 38
Economically Disadvantaged 129 16 36 38 10 77.9 44
African American /Black 18 22 22 44 11 72.2 -
Asian 16 25 25 44 6 79.7 -
Hispanic 128 16 39 34 12 78.9 41
White 13 23 23 46 8 76.9 -
Male 100 19 36 33 12 77.3 40
Female 83 17 35 39 10 79.8 45
2012 2013 2014 2015
Gr 4 57 47 55.5 20
Gr 5 50.5 59.5 71.5 63
20
40
60
80
SGP by Grade
2012 2013 2014 2015
Gr 3 72.4 77.9 84.3 90.9
Gr 4 76.8 71.1 75.0 62.5
Gr 5 85.1 79.5 80.6 81.4
60
70
80
90
100CPI by Grade
Tracy Elementary School 2015-2016 School Improvement Plan
12
SCIENCE/TECHNOLOGY & ENGINEERING
Multi-Year MCAS STE Results – All Students
Student Group
Students Included
% at Each Level CPI
A P NI W
School 2012 47 6 30 47 17 77.1
School 2013 50 14 22 52 12 73.0
School 2014 62 5 21 61 13 66.5
School 2015 55 7 29 56 7 75.5
District 2015 (Grade 5) 1,064 8 32 43 17 74.8
State 2015 (Grade 5) 70,861 16 35 37 13 78.2
MCAS STE 2015 Results by Subgroup
Student Group
Students Included
% at Each Level CPI
A P NI W
All Students 55 7 29 56 7 75.5
Students with Disabilities 5 - - - - -
ELL 2 - - - - -
Former ELL 10 0 40 50 10 75.0
Economically Disadvantaged 37 8 24 57 11 70.9
African American /Black 7 - - - - -
Asian 8 - - - - -
Hispanic 32 6 22 66 6 74.2
White 7 - - - - -
Male 27 11 33 48 7 78.7
Female 28 4 25 64 7 72.3
Tracy Elementary School 2015-2016 School Improvement Plan
13
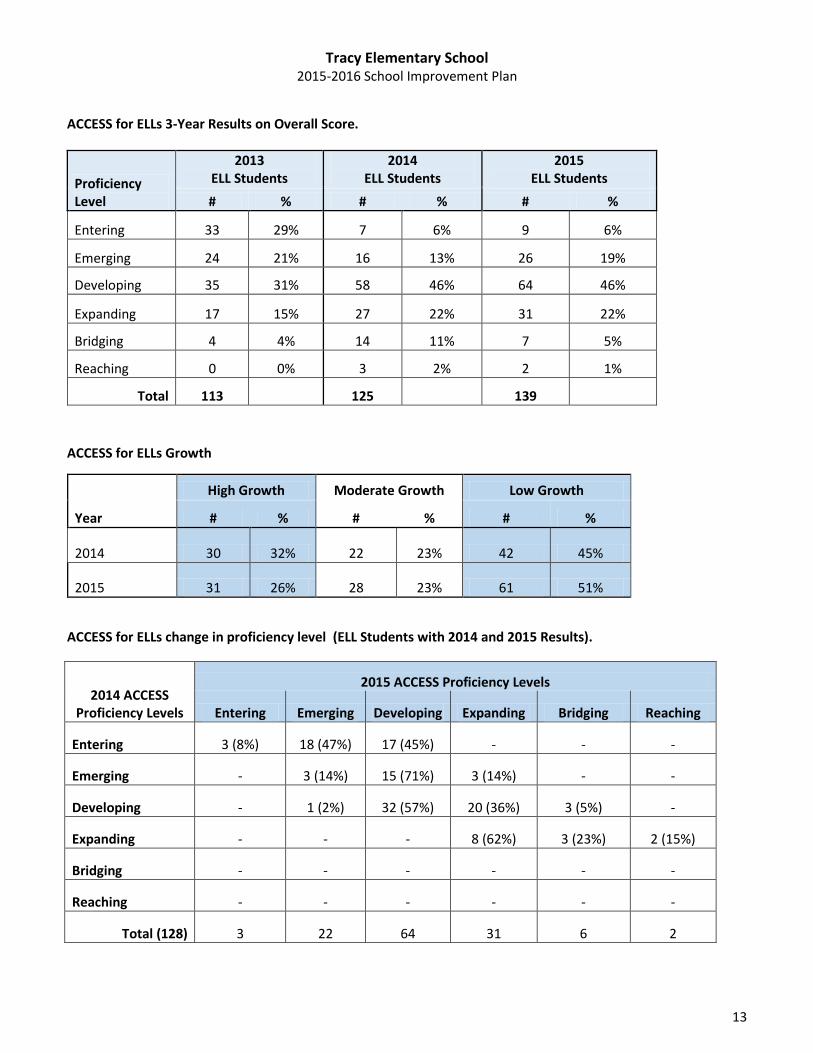
ACCESS for ELLs 3-Year Results on Overall Score.
ACCESS for ELLs Growth
Year
High Growth Moderate Growth Low Growth
# % # % # %
2014 30 32% 22 23% 42 45%
2015 31 26% 28 23% 61 51%
ACCESS for ELLs change in proficiency level (ELL Students with 2014 and 2015 Results).
Proficiency Level
2013 ELL Students
2014 ELL Students
2015 ELL Students
# % # % # %
Entering 33 29% 7 6% 9 6%
Emerging 24 21% 16 13% 26 19%
Developing 35 31% 58 46% 64 46%
Expanding 17 15% 27 22% 31 22%
Bridging 4 4% 14 11% 7 5%
Reaching 0 0% 3 2% 2 1%
Total 113 125 139
2014 ACCESS Proficiency Levels
2015 ACCESS Proficiency Levels
Entering Emerging Developing Expanding Bridging Reaching
Entering 3 (8%) 18 (47%) 17 (45%) - - -
Emerging - 3 (14%) 15 (71%) 3 (14%) - -
Developing - 1 (2%) 32 (57%) 20 (36%) 3 (5%) -
Expanding - - - 8 (62%) 3 (23%) 2 (15%)
Bridging - - - - - -
Reaching - - - - - -
Total (128) 3 22 64 31 6 2
Tracy Elementary School 2015-2016 School Improvement Plan
14
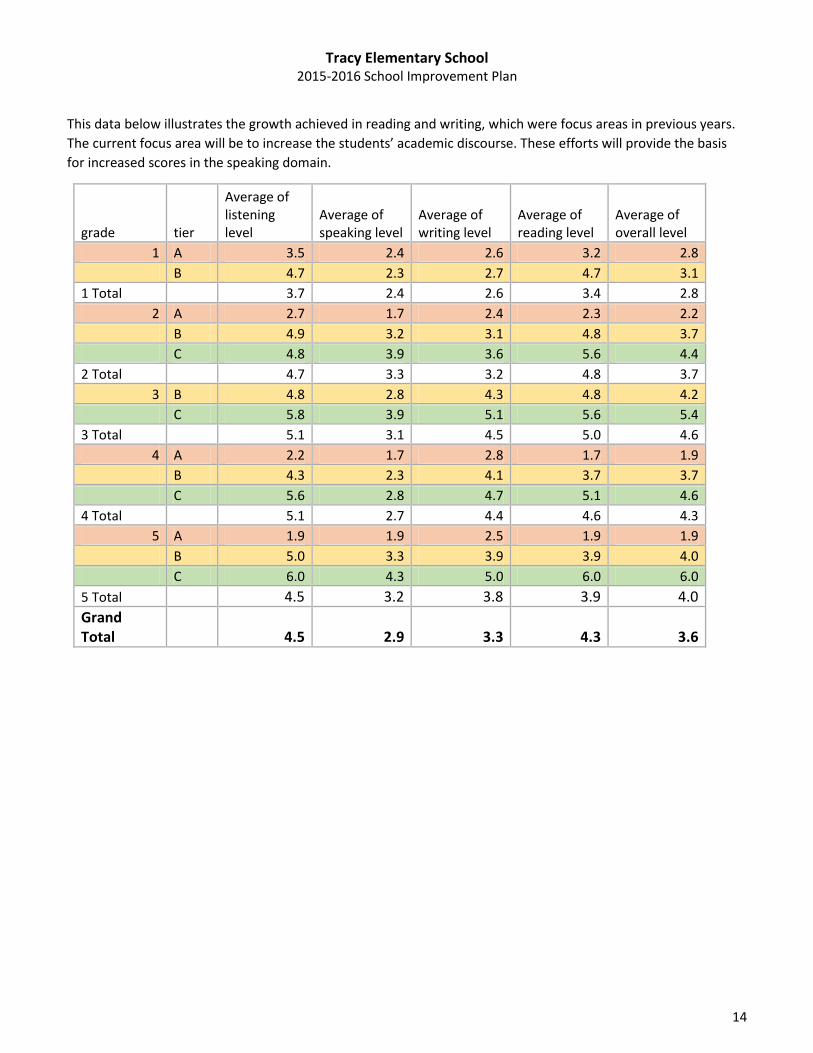
This data below illustrates the growth achieved in reading and writing, which were focus areas in previous years.
The current focus area will be to increase the students’ academic discourse. These efforts will provide the basis
for increased scores in the speaking domain.
grade tier
Average of listening level
Average of speaking level
Average of writing level
Average of reading level
Average of overall level
1 A 3.5 2.4 2.6 3.2 2.8
B 4.7 2.3 2.7 4.7 3.1
1 Total 3.7 2.4 2.6 3.4 2.8
2 A 2.7 1.7 2.4 2.3 2.2
B 4.9 3.2 3.1 4.8 3.7
C 4.8 3.9 3.6 5.6 4.4
2 Total 4.7 3.3 3.2 4.8 3.7
3 B 4.8 2.8 4.3 4.8 4.2
C 5.8 3.9 5.1 5.6 5.4
3 Total 5.1 3.1 4.5 5.0 4.6
4 A 2.2 1.7 2.8 1.7 1.9
B 4.3 2.3 4.1 3.7 3.7
C 5.6 2.8 4.7 5.1 4.6
4 Total 5.1 2.7 4.4 4.6 4.3
5 A 1.9 1.9 2.5 1.9 1.9
B 5.0 3.3 3.9 3.9 4.0
C 6.0 4.3 5.0 6.0 6.0
5 Total 4.5 3.2 3.8 3.9 4.0
Grand Total 4.5 2.9 3.3 4.3 3.6
Tracy Elementary School 2015-2016 School Improvement Plan
15
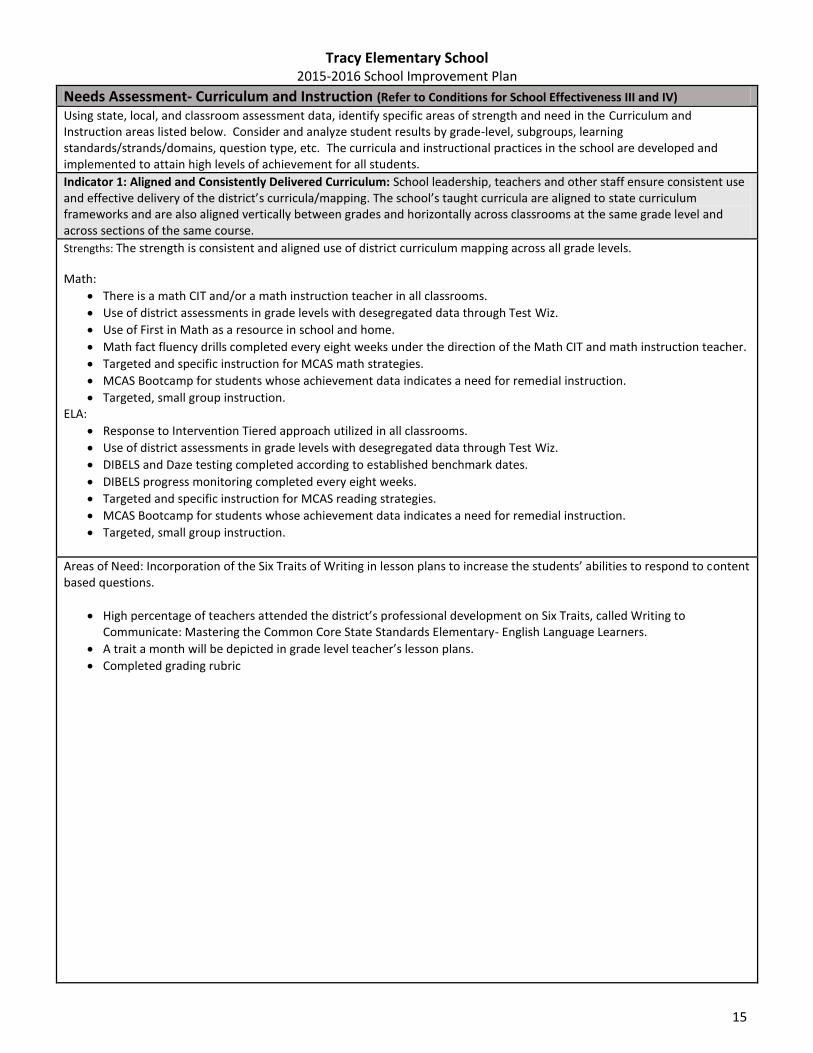
Needs Assessment- Curriculum and Instruction (Refer to Conditions for School Effectiveness III and IV)
Using state, local, and classroom assessment data, identify specific areas of strength and need in the Curriculum and Instruction areas listed below. Consider and analyze student results by grade-level, subgroups, learning standards/strands/domains, question type, etc. The curricula and instructional practices in the school are developed and implemented to attain high levels of achievement for all students.
Indicator 1: Aligned and Consistently Delivered Curriculum: School leadership, teachers and other staff ensure consistent use and effective delivery of the district’s curricula/mapping. The school’s taught curricula are aligned to state curriculum frameworks and are also aligned vertically between grades and horizontally across classrooms at the same grade level and across sections of the same course.
Strengths: The strength is consistent and aligned use of district curriculum mapping across all grade levels.
Math:
There is a math CIT and/or a math instruction teacher in all classrooms.
Use of district assessments in grade levels with desegregated data through Test Wiz.
Use of First in Math as a resource in school and home.
Math fact fluency drills completed every eight weeks under the direction of the Math CIT and math instruction teacher.
Targeted and specific instruction for MCAS math strategies.
MCAS Bootcamp for students whose achievement data indicates a need for remedial instruction.
Targeted, small group instruction. ELA:
Response to Intervention Tiered approach utilized in all classrooms.
Use of district assessments in grade levels with desegregated data through Test Wiz.
DIBELS and Daze testing completed according to established benchmark dates.
DIBELS progress monitoring completed every eight weeks.
Targeted and specific instruction for MCAS reading strategies.
MCAS Bootcamp for students whose achievement data indicates a need for remedial instruction.
Targeted, small group instruction.
Areas of Need: Incorporation of the Six Traits of Writing in lesson plans to increase the students’ abilities to respond to content based questions.
High percentage of teachers attended the district’s professional development on Six Traits, called Writing to Communicate: Mastering the Common Core State Standards Elementary- English Language Learners.
A trait a month will be depicted in grade level teacher’s lesson plans.
Completed grading rubric
Tracy Elementary School 2015-2016 School Improvement Plan
16
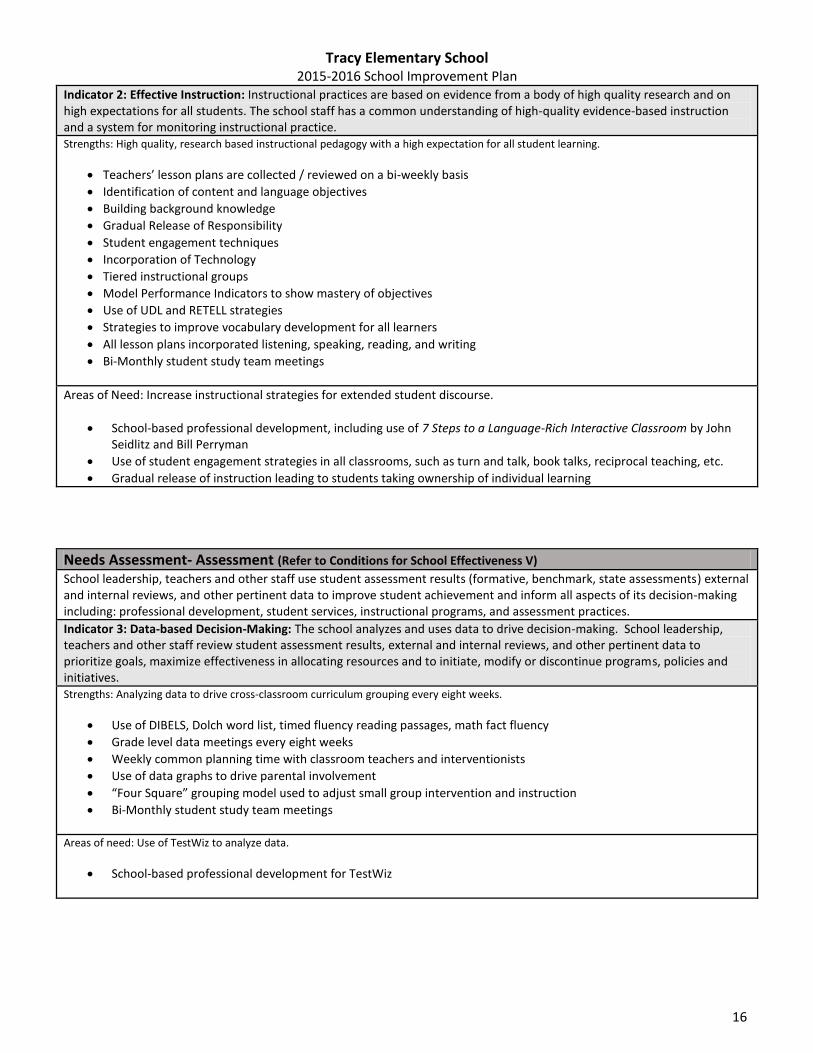
Indicator 2: Effective Instruction: Instructional practices are based on evidence from a body of high quality research and on high expectations for all students. The school staff has a common understanding of high-quality evidence-based instruction and a system for monitoring instructional practice. Strengths: High quality, research based instructional pedagogy with a high expectation for all student learning.
Teachers’ lesson plans are collected / reviewed on a bi-weekly basis
Identification of content and language objectives
Building background knowledge
Gradual Release of Responsibility
Student engagement techniques
Incorporation of Technology
Tiered instructional groups
Model Performance Indicators to show mastery of objectives
Use of UDL and RETELL strategies
Strategies to improve vocabulary development for all learners
All lesson plans incorporated listening, speaking, reading, and writing
Bi-Monthly student study team meetings
Areas of Need: Increase instructional strategies for extended student discourse.
School-based professional development, including use of 7 Steps to a Language-Rich Interactive Classroom by John Seidlitz and Bill Perryman
Use of student engagement strategies in all classrooms, such as turn and talk, book talks, reciprocal teaching, etc.
Gradual release of instruction leading to students taking ownership of individual learning
Needs Assessment- Assessment (Refer to Conditions for School Effectiveness V) School leadership, teachers and other staff use student assessment results (formative, benchmark, state assessments) external and internal reviews, and other pertinent data to improve student achievement and inform all aspects of its decision-making including: professional development, student services, instructional programs, and assessment practices.
Indicator 3: Data-based Decision-Making: The school analyzes and uses data to drive decision-making. School leadership, teachers and other staff review student assessment results, external and internal reviews, and other pertinent data to prioritize goals, maximize effectiveness in allocating resources and to initiate, modify or discontinue programs, policies and initiatives. Strengths: Analyzing data to drive cross-classroom curriculum grouping every eight weeks.
Use of DIBELS, Dolch word list, timed fluency reading passages, math fact fluency
Grade level data meetings every eight weeks
Weekly common planning time with classroom teachers and interventionists
Use of data graphs to drive parental involvement
“Four Square” grouping model used to adjust small group intervention and instruction
Bi-Monthly student study team meetings
Areas of need: Use of TestWiz to analyze data.
School-based professional development for TestWiz
Tracy Elementary School 2015-2016 School Improvement Plan
17
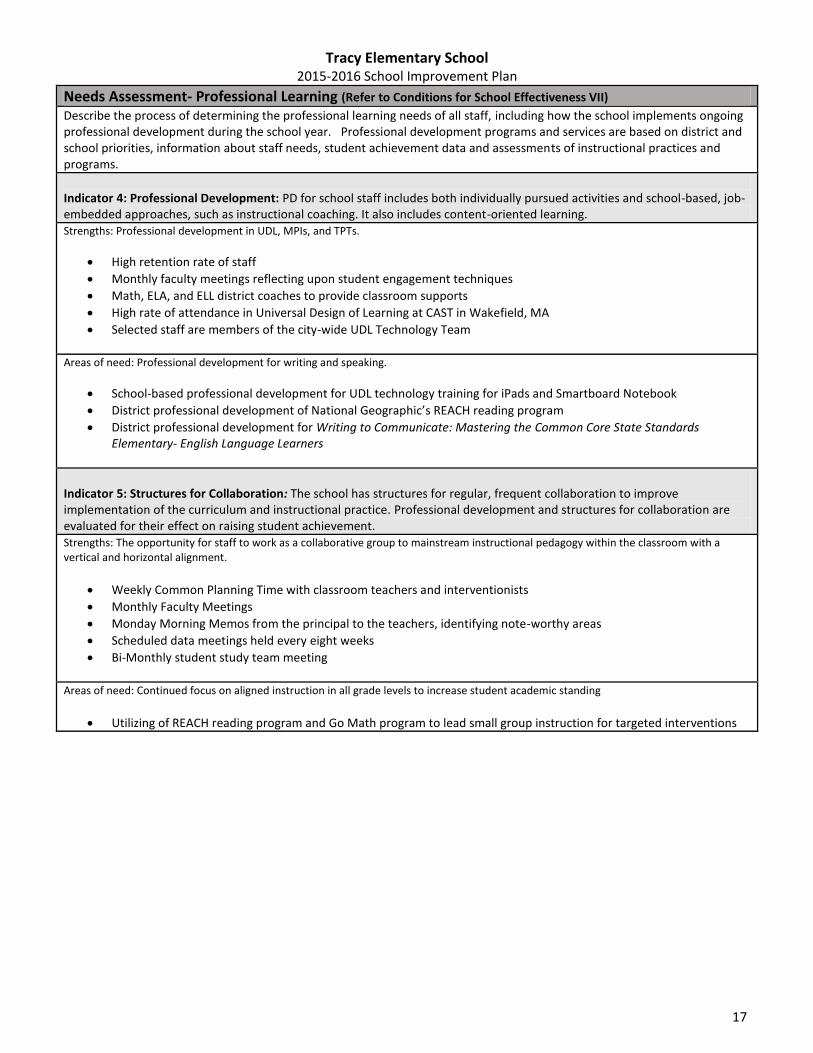
Needs Assessment- Professional Learning (Refer to Conditions for School Effectiveness VII) Describe the process of determining the professional learning needs of all staff, including how the school implements ongoing professional development during the school year. Professional development programs and services are based on district and school priorities, information about staff needs, student achievement data and assessments of instructional practices and programs.
Indicator 4: Professional Development: PD for school staff includes both individually pursued activities and school-based, job-embedded approaches, such as instructional coaching. It also includes content-oriented learning. Strengths: Professional development in UDL, MPIs, and TPTs.
High retention rate of staff
Monthly faculty meetings reflecting upon student engagement techniques
Math, ELA, and ELL district coaches to provide classroom supports
High rate of attendance in Universal Design of Learning at CAST in Wakefield, MA
Selected staff are members of the city-wide UDL Technology Team
Areas of need: Professional development for writing and speaking.
School-based professional development for UDL technology training for iPads and Smartboard Notebook
District professional development of National Geographic’s REACH reading program
District professional development for Writing to Communicate: Mastering the Common Core State Standards Elementary- English Language Learners
Indicator 5: Structures for Collaboration: The school has structures for regular, frequent collaboration to improve implementation of the curriculum and instructional practice. Professional development and structures for collaboration are evaluated for their effect on raising student achievement. Strengths: The opportunity for staff to work as a collaborative group to mainstream instructional pedagogy within the classroom with a vertical and horizontal alignment.
Weekly Common Planning Time with classroom teachers and interventionists
Monthly Faculty Meetings
Monday Morning Memos from the principal to the teachers, identifying note-worthy areas
Scheduled data meetings held every eight weeks
Bi-Monthly student study team meeting
Areas of need: Continued focus on aligned instruction in all grade levels to increase student academic standing
Utilizing of REACH reading program and Go Math program to lead small group instruction for targeted interventions
Tracy Elementary School 2015-2016 School Improvement Plan
18
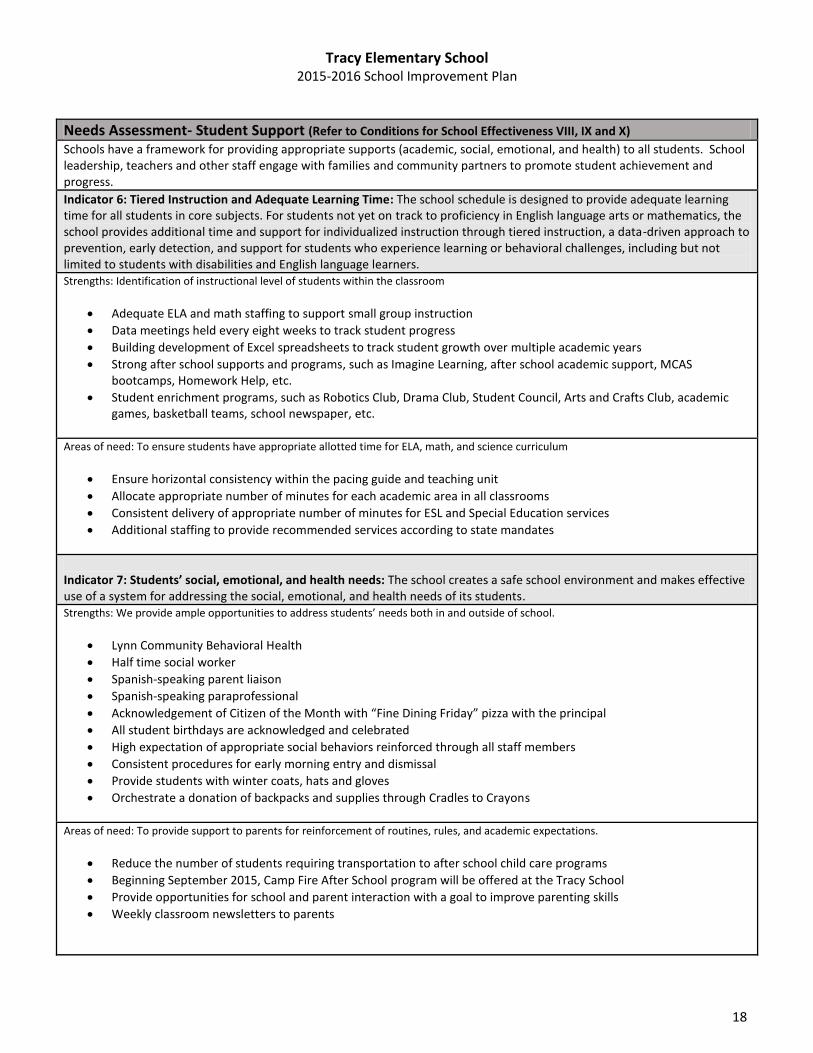
Needs Assessment- Student Support (Refer to Conditions for School Effectiveness VIII, IX and X) Schools have a framework for providing appropriate supports (academic, social, emotional, and health) to all students. School leadership, teachers and other staff engage with families and community partners to promote student achievement and progress.
Indicator 6: Tiered Instruction and Adequate Learning Time: The school schedule is designed to provide adequate learning time for all students in core subjects. For students not yet on track to proficiency in English language arts or mathematics, the school provides additional time and support for individualized instruction through tiered instruction, a data-driven approach to prevention, early detection, and support for students who experience learning or behavioral challenges, including but not limited to students with disabilities and English language learners. Strengths: Identification of instructional level of students within the classroom
Adequate ELA and math staffing to support small group instruction
Data meetings held every eight weeks to track student progress
Building development of Excel spreadsheets to track student growth over multiple academic years
Strong after school supports and programs, such as Imagine Learning, after school academic support, MCAS bootcamps, Homework Help, etc.
Student enrichment programs, such as Robotics Club, Drama Club, Student Council, Arts and Crafts Club, academic games, basketball teams, school newspaper, etc.
Areas of need: To ensure students have appropriate allotted time for ELA, math, and science curriculum
Ensure horizontal consistency within the pacing guide and teaching unit
Allocate appropriate number of minutes for each academic area in all classrooms
Consistent delivery of appropriate number of minutes for ESL and Special Education services
Additional staffing to provide recommended services according to state mandates
Indicator 7: Students’ social, emotional, and health needs: The school creates a safe school environment and makes effective use of a system for addressing the social, emotional, and health needs of its students. Strengths: We provide ample opportunities to address students’ needs both in and outside of school.
Lynn Community Behavioral Health
Half time social worker
Spanish-speaking parent liaison
Spanish-speaking paraprofessional
Acknowledgement of Citizen of the Month with “Fine Dining Friday” pizza with the principal
All student birthdays are acknowledged and celebrated
High expectation of appropriate social behaviors reinforced through all staff members
Consistent procedures for early morning entry and dismissal
Provide students with winter coats, hats and gloves
Orchestrate a donation of backpacks and supplies through Cradles to Crayons
Areas of need: To provide support to parents for reinforcement of routines, rules, and academic expectations.
Reduce the number of students requiring transportation to after school child care programs
Beginning September 2015, Camp Fire After School program will be offered at the Tracy School
Provide opportunities for school and parent interaction with a goal to improve parenting skills
Weekly classroom newsletters to parents
Tracy Elementary School 2015-2016 School Improvement Plan
19
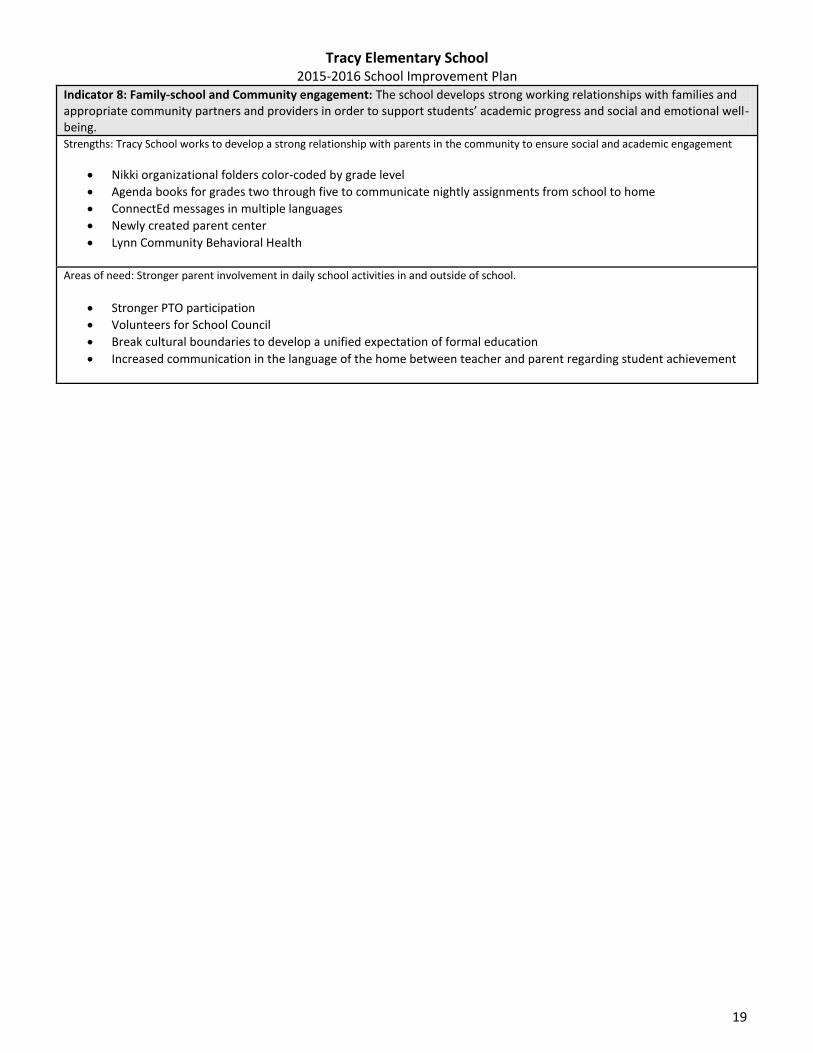
Indicator 8: Family-school and Community engagement: The school develops strong working relationships with families and appropriate community partners and providers in order to support students’ academic progress and social and emotional well-being. Strengths: Tracy School works to develop a strong relationship with parents in the community to ensure social and academic engagement
Nikki organizational folders color-coded by grade level
Agenda books for grades two through five to communicate nightly assignments from school to home
ConnectEd messages in multiple languages
Newly created parent center
Lynn Community Behavioral Health
Areas of need: Stronger parent involvement in daily school activities in and outside of school.
Stronger PTO participation
Volunteers for School Council
Break cultural boundaries to develop a unified expectation of formal education
Increased communication in the language of the home between teacher and parent regarding student achievement
Tracy Elementary School 2015-2016 School Improvement Plan
20
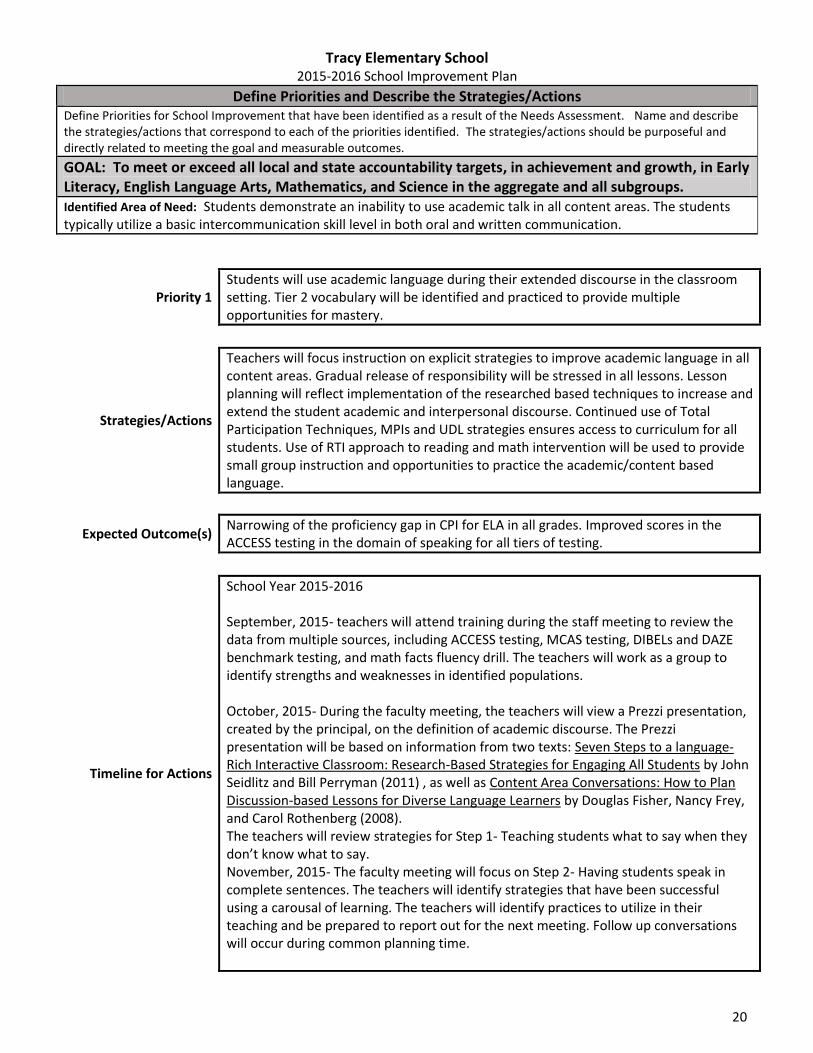
Define Priorities and Describe the Strategies/Actions Define Priorities for School Improvement that have been identified as a result of the Needs Assessment. Name and describe the strategies/actions that correspond to each of the priorities identified. The strategies/actions should be purposeful and directly related to meeting the goal and measurable outcomes.
GOAL: To meet or exceed all local and state accountability targets, in achievement and growth, in Early Literacy, English Language Arts, Mathematics, and Science in the aggregate and all subgroups. Identified Area of Need: Students demonstrate an inability to use academic talk in all content areas. The students typically utilize a basic intercommunication skill level in both oral and written communication.
Priority 1 Students will use academic language during their extended discourse in the classroom setting. Tier 2 vocabulary will be identified and practiced to provide multiple opportunities for mastery.
Strategies/Actions
Teachers will focus instruction on explicit strategies to improve academic language in all content areas. Gradual release of responsibility will be stressed in all lessons. Lesson planning will reflect implementation of the researched based techniques to increase and extend the student academic and interpersonal discourse. Continued use of Total Participation Techniques, MPIs and UDL strategies ensures access to curriculum for all students. Use of RTI approach to reading and math intervention will be used to provide small group instruction and opportunities to practice the academic/content based language.
Expected Outcome(s) Narrowing of the proficiency gap in CPI for ELA in all grades. Improved scores in the ACCESS testing in the domain of speaking for all tiers of testing.
Timeline for Actions
School Year 2015-2016 September, 2015- teachers will attend training during the staff meeting to review the data from multiple sources, including ACCESS testing, MCAS testing, DIBELs and DAZE benchmark testing, and math facts fluency drill. The teachers will work as a group to identify strengths and weaknesses in identified populations. October, 2015- During the faculty meeting, the teachers will view a Prezzi presentation, created by the principal, on the definition of academic discourse. The Prezzi presentation will be based on information from two texts: Seven Steps to a language-Rich Interactive Classroom: Research-Based Strategies for Engaging All Students by John Seidlitz and Bill Perryman (2011) , as well as Content Area Conversations: How to Plan Discussion-based Lessons for Diverse Language Learners by Douglas Fisher, Nancy Frey, and Carol Rothenberg (2008). The teachers will review strategies for Step 1- Teaching students what to say when they don’t know what to say. November, 2015- The faculty meeting will focus on Step 2- Having students speak in complete sentences. The teachers will identify strategies that have been successful using a carousal of learning. The teachers will identify practices to utilize in their teaching and be prepared to report out for the next meeting. Follow up conversations will occur during common planning time.
Tracy Elementary School 2015-2016 School Improvement Plan
21
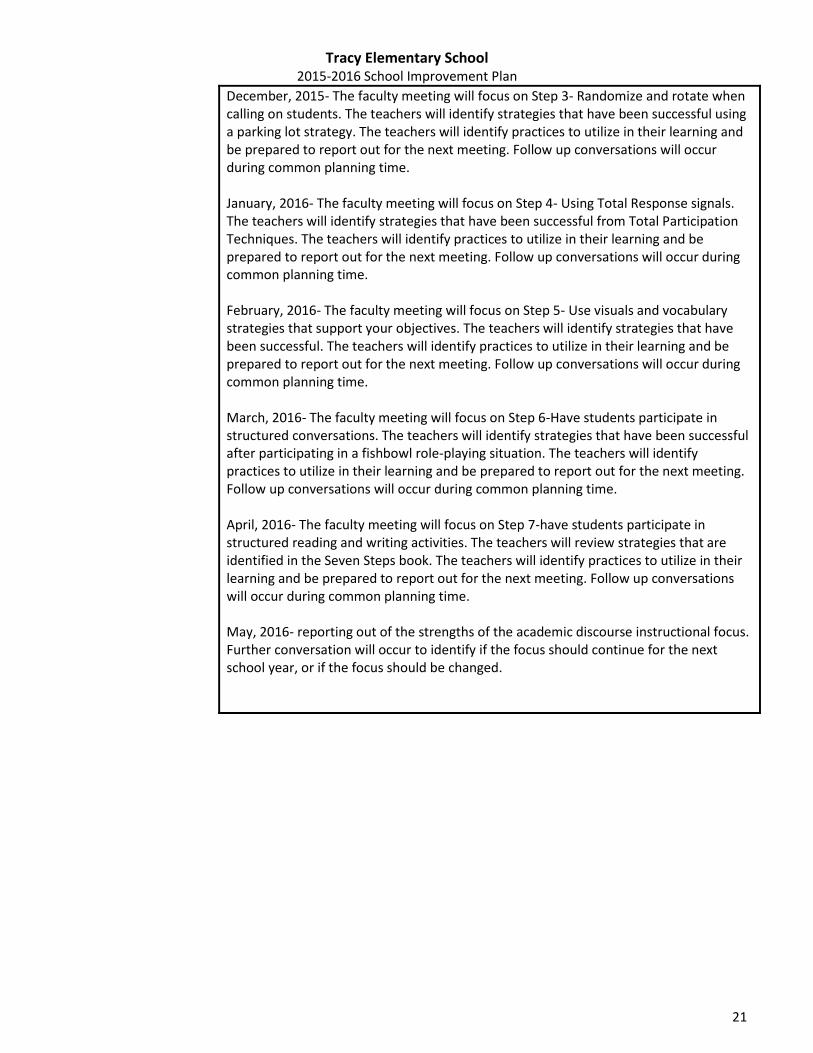
December, 2015- The faculty meeting will focus on Step 3- Randomize and rotate when calling on students. The teachers will identify strategies that have been successful using a parking lot strategy. The teachers will identify practices to utilize in their learning and be prepared to report out for the next meeting. Follow up conversations will occur during common planning time. January, 2016- The faculty meeting will focus on Step 4- Using Total Response signals. The teachers will identify strategies that have been successful from Total Participation Techniques. The teachers will identify practices to utilize in their learning and be prepared to report out for the next meeting. Follow up conversations will occur during common planning time. February, 2016- The faculty meeting will focus on Step 5- Use visuals and vocabulary strategies that support your objectives. The teachers will identify strategies that have been successful. The teachers will identify practices to utilize in their learning and be prepared to report out for the next meeting. Follow up conversations will occur during common planning time. March, 2016- The faculty meeting will focus on Step 6-Have students participate in structured conversations. The teachers will identify strategies that have been successful after participating in a fishbowl role-playing situation. The teachers will identify practices to utilize in their learning and be prepared to report out for the next meeting. Follow up conversations will occur during common planning time. April, 2016- The faculty meeting will focus on Step 7-have students participate in structured reading and writing activities. The teachers will review strategies that are identified in the Seven Steps book. The teachers will identify practices to utilize in their learning and be prepared to report out for the next meeting. Follow up conversations will occur during common planning time. May, 2016- reporting out of the strengths of the academic discourse instructional focus. Further conversation will occur to identify if the focus should continue for the next school year, or if the focus should be changed.
Tracy Elementary School 2015-2016 School Improvement Plan
22
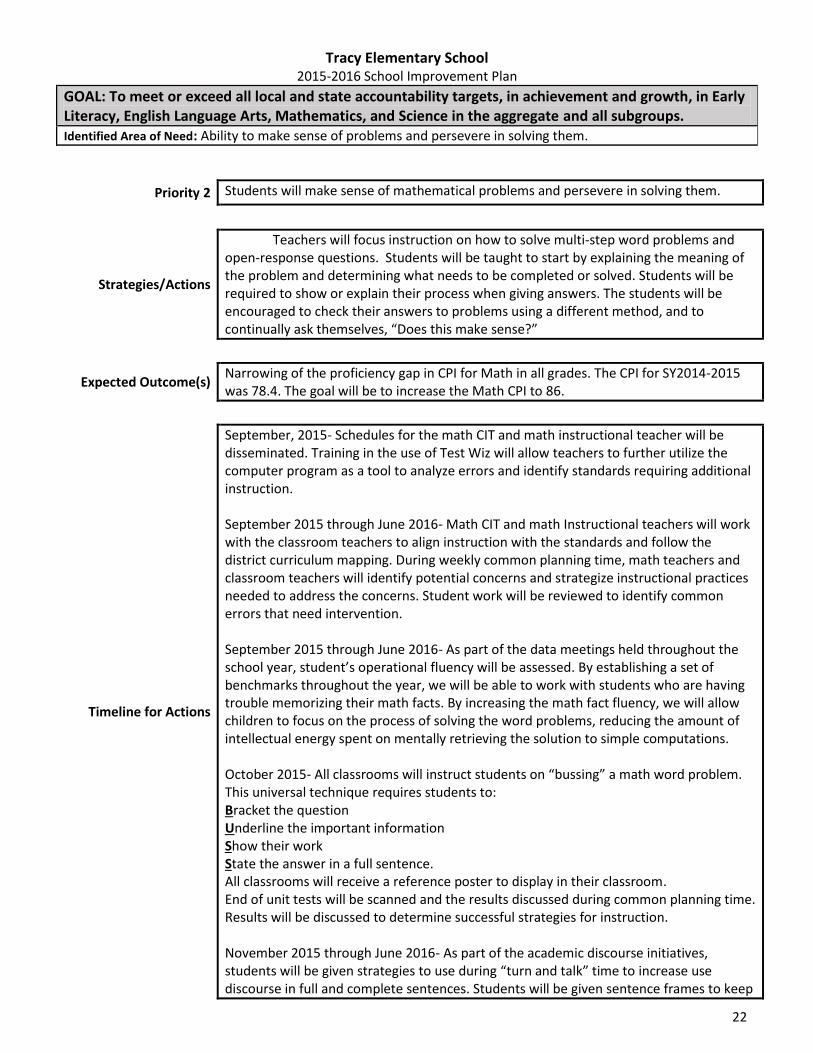
GOAL: To meet or exceed all local and state accountability targets, in achievement and growth, in Early Literacy, English Language Arts, Mathematics, and Science in the aggregate and all subgroups. Identified Area of Need: Ability to make sense of problems and persevere in solving them.
Priority 2 Students will make sense of mathematical problems and persevere in solving them.
Strategies/Actions
Teachers will focus instruction on how to solve multi-step word problems and open-response questions. Students will be taught to start by explaining the meaning of the problem and determining what needs to be completed or solved. Students will be required to show or explain their process when giving answers. The students will be encouraged to check their answers to problems using a different method, and to continually ask themselves, “Does this make sense?”
Expected Outcome(s) Narrowing of the proficiency gap in CPI for Math in all grades. The CPI for SY2014-2015 was 78.4. The goal will be to increase the Math CPI to 86.
Timeline for Actions
September, 2015- Schedules for the math CIT and math instructional teacher will be disseminated. Training in the use of Test Wiz will allow teachers to further utilize the computer program as a tool to analyze errors and identify standards requiring additional instruction. September 2015 through June 2016- Math CIT and math Instructional teachers will work with the classroom teachers to align instruction with the standards and follow the district curriculum mapping. During weekly common planning time, math teachers and classroom teachers will identify potential concerns and strategize instructional practices needed to address the concerns. Student work will be reviewed to identify common errors that need intervention. September 2015 through June 2016- As part of the data meetings held throughout the school year, student’s operational fluency will be assessed. By establishing a set of benchmarks throughout the year, we will be able to work with students who are having trouble memorizing their math facts. By increasing the math fact fluency, we will allow children to focus on the process of solving the word problems, reducing the amount of intellectual energy spent on mentally retrieving the solution to simple computations. October 2015- All classrooms will instruct students on “bussing” a math word problem. This universal technique requires students to: Bracket the question Underline the important information Show their work State the answer in a full sentence. All classrooms will receive a reference poster to display in their classroom. End of unit tests will be scanned and the results discussed during common planning time. Results will be discussed to determine successful strategies for instruction. November 2015 through June 2016- As part of the academic discourse initiatives, students will be given strategies to use during “turn and talk” time to increase use discourse in full and complete sentences. Students will be given sentence frames to keep
Tracy Elementary School 2015-2016 School Improvement Plan
23
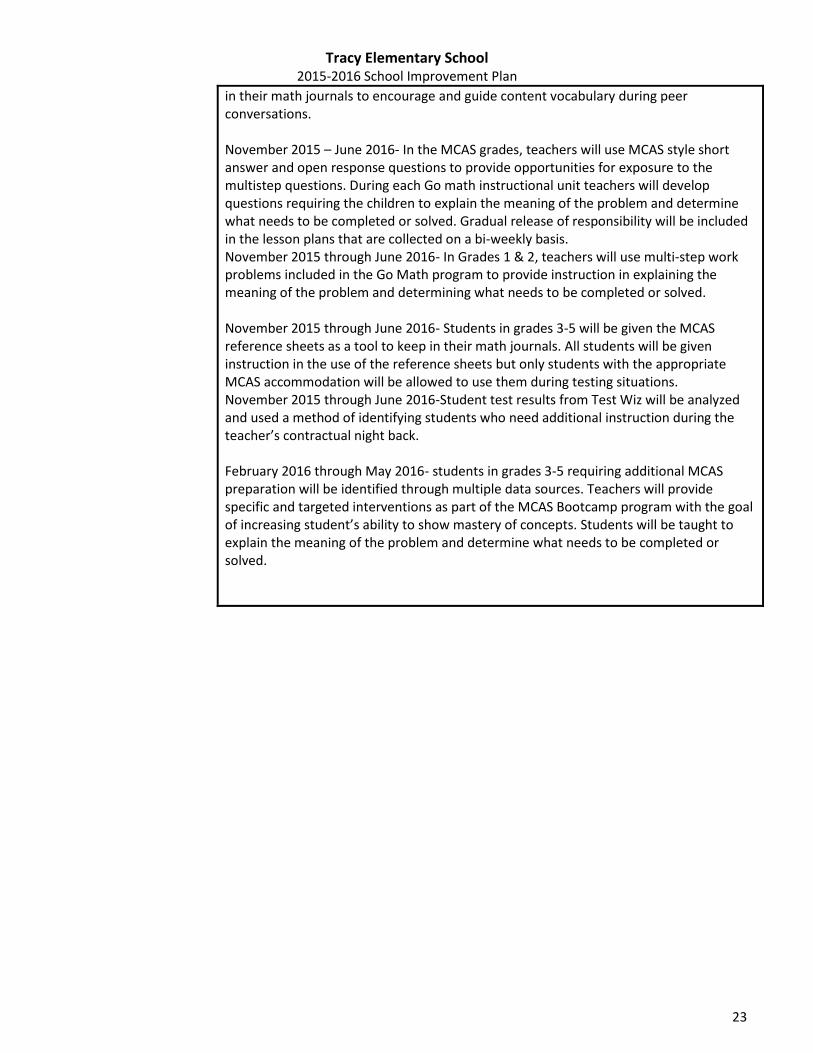
in their math journals to encourage and guide content vocabulary during peer conversations. November 2015 – June 2016- In the MCAS grades, teachers will use MCAS style short answer and open response questions to provide opportunities for exposure to the multistep questions. During each Go math instructional unit teachers will develop questions requiring the children to explain the meaning of the problem and determine what needs to be completed or solved. Gradual release of responsibility will be included in the lesson plans that are collected on a bi-weekly basis. November 2015 through June 2016- In Grades 1 & 2, teachers will use multi-step work problems included in the Go Math program to provide instruction in explaining the meaning of the problem and determining what needs to be completed or solved. November 2015 through June 2016- Students in grades 3-5 will be given the MCAS reference sheets as a tool to keep in their math journals. All students will be given instruction in the use of the reference sheets but only students with the appropriate MCAS accommodation will be allowed to use them during testing situations. November 2015 through June 2016-Student test results from Test Wiz will be analyzed and used a method of identifying students who need additional instruction during the teacher’s contractual night back. February 2016 through May 2016- students in grades 3-5 requiring additional MCAS preparation will be identified through multiple data sources. Teachers will provide specific and targeted interventions as part of the MCAS Bootcamp program with the goal of increasing student’s ability to show mastery of concepts. Students will be taught to explain the meaning of the problem and determine what needs to be completed or solved.
Tracy Elementary School 2015-2016 School Improvement Plan
24
Appendix A
Implementation Reflection: Please provide a brief description of the implementation of the strategies/actions identified
for the priority areas this year. Provide evidence, qualitative and quantitative, to support the identified successes and/or challenges in the implementation.
February (Mid-Year) Implementation reflections and adjustments (as needed):
To June (End-of-Year) Implementation Reflection:
October Accountability Data Update and Reflections: