tracking key caadp indicators and implementation
Upload: african-regional-strategic-analysis-and-knowledge-support-system-resakss
Post on 09-Feb-2017
105 views
TRANSCRIPT
Impacts of CAADP on Africa’s Agricultural-
Led Development
Sam Benin, IFPRI
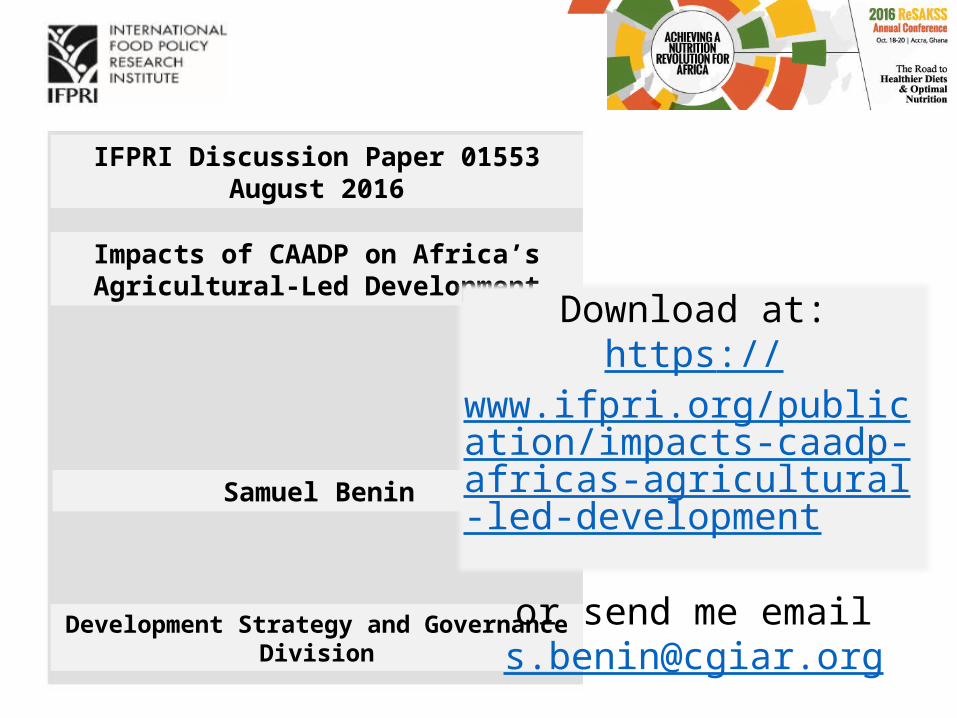
Impacts of CAADP on Africa’s Agricultural-Led Development
Samuel Benin
Development Strategy and Governance Division
IFPRI Discussion Paper 01553August 2016
Download at:https://
www.ifpri.org/publication/impacts-caadp-africas-agricultural-led-development
or send me [email protected]
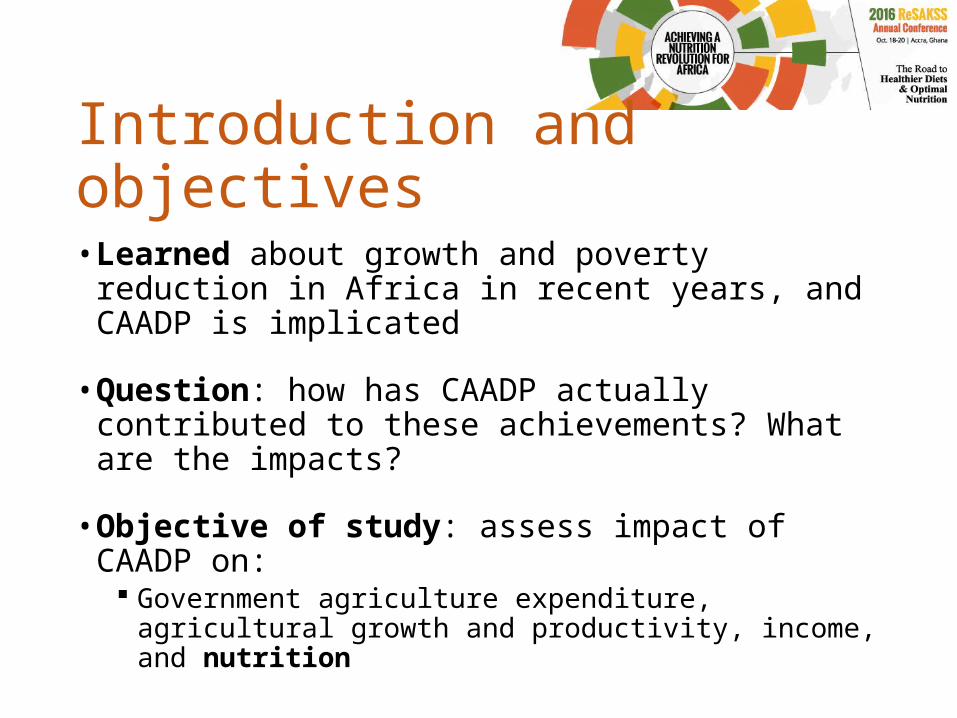
Introduction and objectives• Learned about growth and poverty reduction in
Africa in recent years, and CAADP is implicated
• Question: how has CAADP actually contributed to these achievements? What are the impacts?
• Objective of study: assess impact of CAADP on: Government agriculture expenditure, agricultural
growth and productivity, income, and nutrition
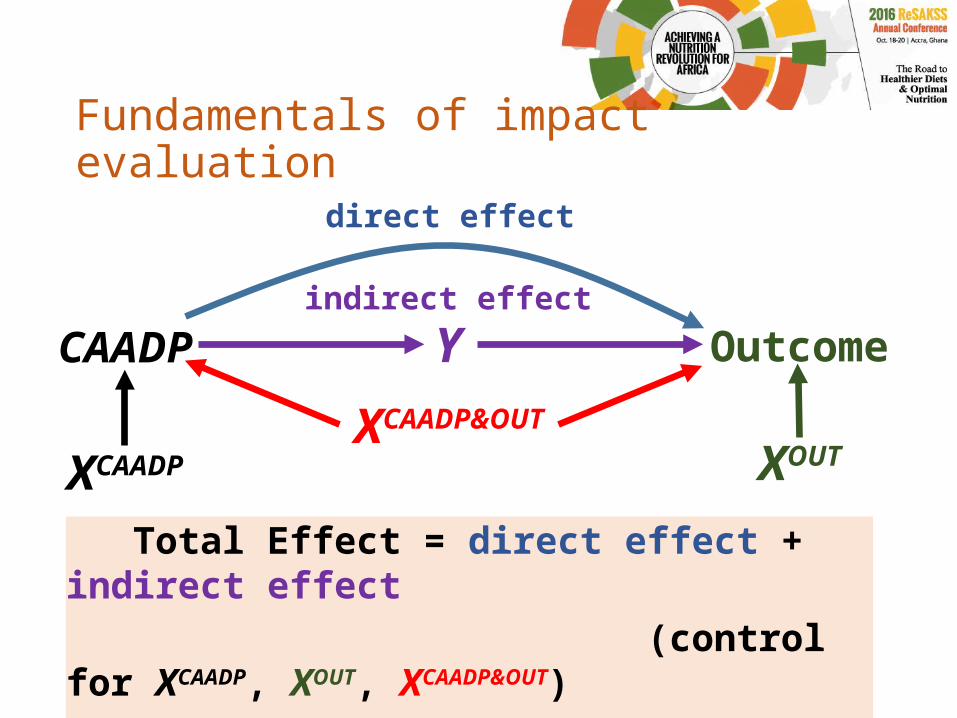
CAADP Outcome
direct effect
Yindirect effect
XCAADP XOUTXCAADP&OUT
Total Effect = direct effect + indirect effect (control for XCAADP, XOUT, XCAADP&OUT)
Key Assumption: Xi is known, observed, and used
Fundamentals of impact evaluation

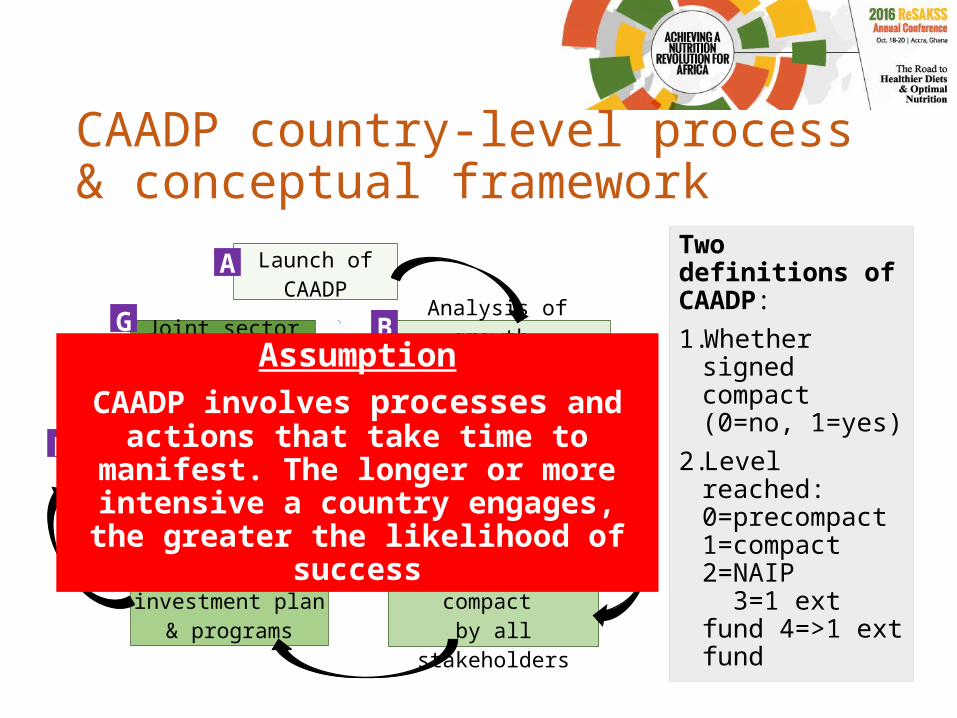
CAADP country-level process & conceptual framework
Joint sector review & mutual
accountability
Launch of CAADP
Financing and implementation of plan and programs
Analysis of growth options, investment, &
capacity needs
Consultations with stakeholders and
validation of results
Preparation of investment plan &
programs
Preparation and signing of compact by all stakeholders
A
B
C
DE
F
G
Two definitions of CAADP:1. Whether
signed compact (0=no, 1=yes)
2. Level reached: 0=precompact 1=compact 2=NAIP 3=1 ext fund 4=>1 ext fund
AssumptionCAADP involves processes and actions that take time to manifest. The longer or more intensive a country engages, the greater the likelihood of success
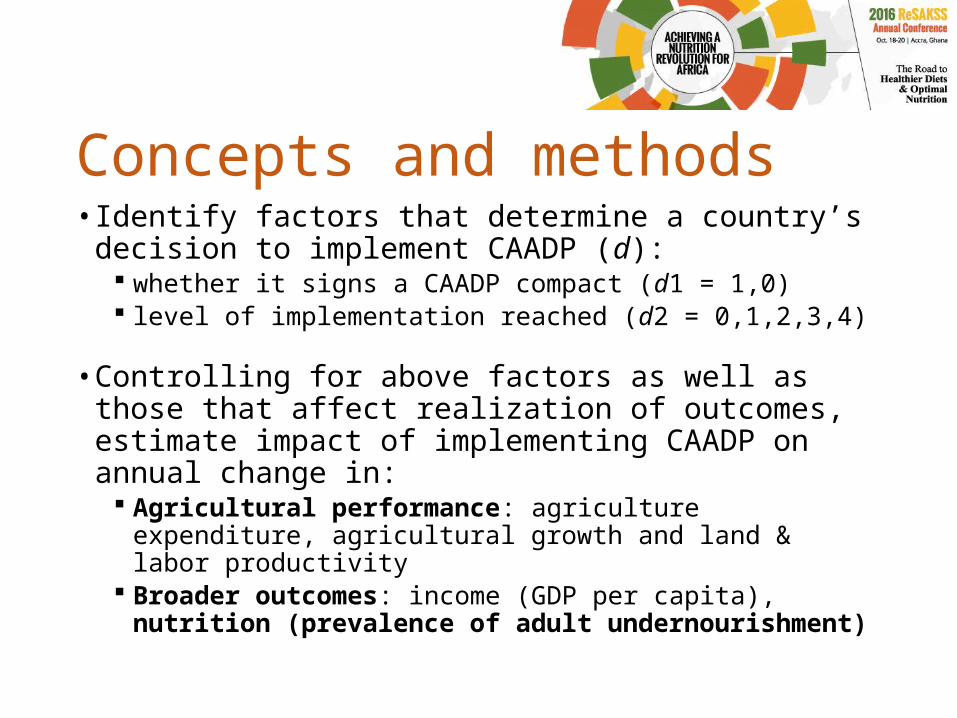
Concepts and methods• Identify factors that determine a country’s decision
to implement CAADP (d): whether it signs a CAADP compact (d1 = 1,0) level of implementation reached (d2 = 0,1,2,3,4)
• Controlling for above factors as well as those that affect realization of outcomes, estimate impact of implementing CAADP on annual change in:
Agricultural performance: agriculture expenditure, agricultural growth and land & labor productivity
Broader outcomes: income (GDP per capita), nutrition (prevalence of adult undernourishment)

Influential factors and hypothesisConceptual factor (expected) Variables and measures
Relevance of CAADP/ Importance of agriculture (+)
Share of agricultural value added in total GDP, share of agricultural area in total area
Political will (+) Number of AU charters/treaties ratified by 2003
Peer pressure (+) Share of bordering countries at next stage of CAADP implementation (physical or REC)
Negotiation posture (-) Total expenditure per capita, share of GDP in Africa’s total GDP
Capacity of government (+) Cumulative years agricultural minister in place
Demand and capacity of citizens (+/-)
Voice and accountability index (-2.5 to 2.5), autocracy-democracy index (-10 to 10)
Pretreatment outcomes Lagged values of the outcome variables
Cross-country effects Population density, rainfall, AEZ-economic class
Global effects Financial crisis (0 up to 2008, 1 after 2008)
Data sources and estimation• Data from various international and national
sources from 2001 to 2014
• Use panel-data regression methods to estimate treatment effects of CAADP and deal with several relevant econometric issues
• Use different model specifications to evaluate sensitivity of results to different issues and assumptions generate greater confidence in results
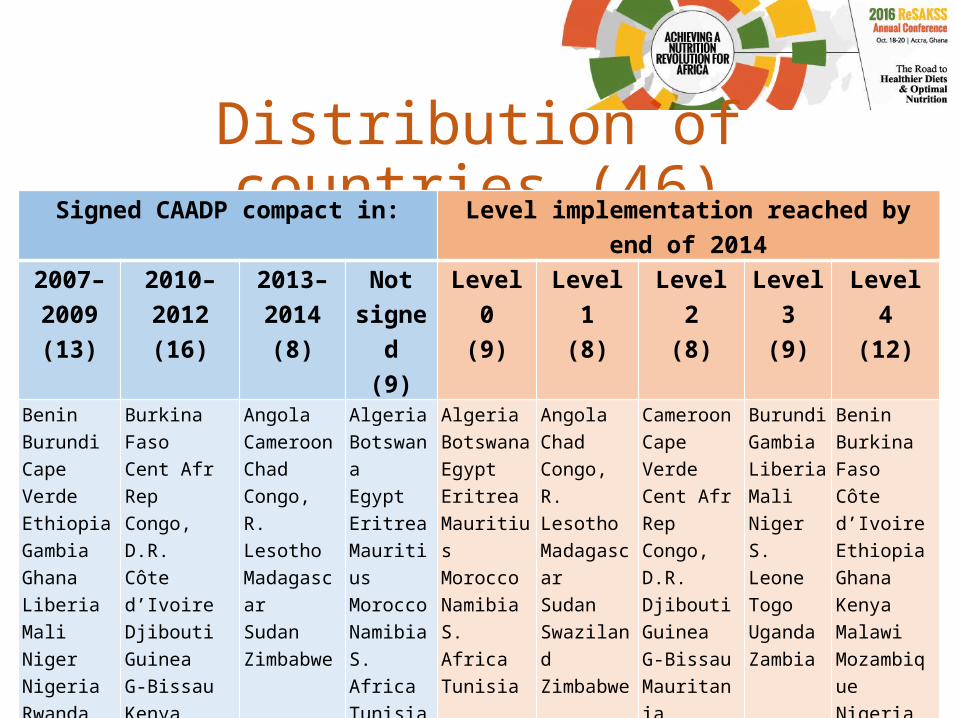
Distribution of countries (46)Signed CAADP compact in: Level implementation reached by end of 2014
2007–2009(13)
2010– 2012(16)
2013–2014(8)
Not signed
(9)
Level 0(9)
Level 1(8)
Level 2(8)
Level 3(9)
Level 4(12)
BeninBurundiCape VerdeEthiopiaGambiaGhanaLiberiaMaliNigerNigeriaRwandaS. LeoneTogo
Burkina FasoCent Afr RepCongo, D.R.Côte d’IvoireDjiboutiGuineaG-BissauKenyaMalawiMauritaniaMozambiqueSenegalSwazilandTanzaniaUgandaZambia
AngolaCameroonChadCongo, R.LesothoMadagascarSudanZimbabwe
AlgeriaBotswanaEgyptEritreaMauritiusMoroccoNamibiaS. AfricaTunisia
AlgeriaBotswanaEgyptEritreaMauritiusMoroccoNamibiaS. AfricaTunisia
AngolaChadCongo, R.LesothoMadagascarSudanSwazilandZimbabwe
CameroonCape VerdeCent Afr RepCongo, D.R.DjiboutiGuineaG-BissauMauritania
Burundi Gambia Liberia Mali Niger S. LeoneTogo Uganda Zambia
Benin Burkina Faso Côte d’Ivoire Ethiopia Ghana Kenya Malawi Mozambique Nigeria Rwanda SenegalTanzania

Determinants of CAADP implementationSigned compact (logit) Level reached (ologit)
Model 1 Model 2 Model 1 Model 2Importance of agriculture 0.57 *** 0.48 *** -0.01 0.02
Political will 0.70 ** 0.63 ** -6.69 -6.38
Peer pressure 0.06 *** 0.11 *** 0.00 0.02 ***
Negotiation posture -1.49 ** -1.56 ** 1.47 1.56
Government capacity 3.71 *** 5.38 *** 2.11 *** 2.27 ***
Citizens’ demand&capacity 0.58 0.80 0.63 0.16
Financial crisis 23.24 *** 4.86 ***
Population density 0.03 *** 0.02 *** 0.06 * 0.11 ***
Intercept -75.72 *** -65.06 *** n.a. n.a.
Chi-square statistic 58.85 *** 81.28 *** 803.2 *** 769.0 ***
*, **, and *** = statistical significance at the 10%, 5%, and 1%, respectively

Determinants of CAADP implementationSigned compact (logit) Level reached (ologit)
Model 1 Model 2 Model 1 Model 2Importance of agriculture 0.57 *** 0.48 *** -0.01 0.02
Political will 0.70 ** 0.63 ** -6.69 -6.38
Peer pressure 0.06 *** 0.11 *** 0.00 0.02 ***
Negotiation posture -1.49 ** -1.56 ** 1.47 1.56
Government capacity 3.71 *** 5.38 *** 2.11 *** 2.27 ***
Citizens’ demand&capacity 0.58 0.80 0.63 0.16
Population density 0.03 *** 0.02 *** 0.06 * 0.11 ***
Financial crisis 23.24 *** 4.86 ***
Intercept -75.72 *** -65.06 *** n.a. n.a.
Chi-square statistic 58.85 *** 81.28 *** 803.2 *** 769.0 ***
*, **, and *** = statistical significance at the 10%, 5%, and 1%, respectively
• Regarding compact signing, variables representing: Role of agriculture, political will, peer pressure,
government capacity, and financial crisis have positive and statistically significant influence
Negotiation posture has negative influence, likely due to alternative (non-agriculture) sources of development
Citizens’ demands and capacity are not significant
• For level of implementation reached: Only peer pressure (stage of implementation of neighbor)
and government capacity (how long minister of agriculture has been in place) are important
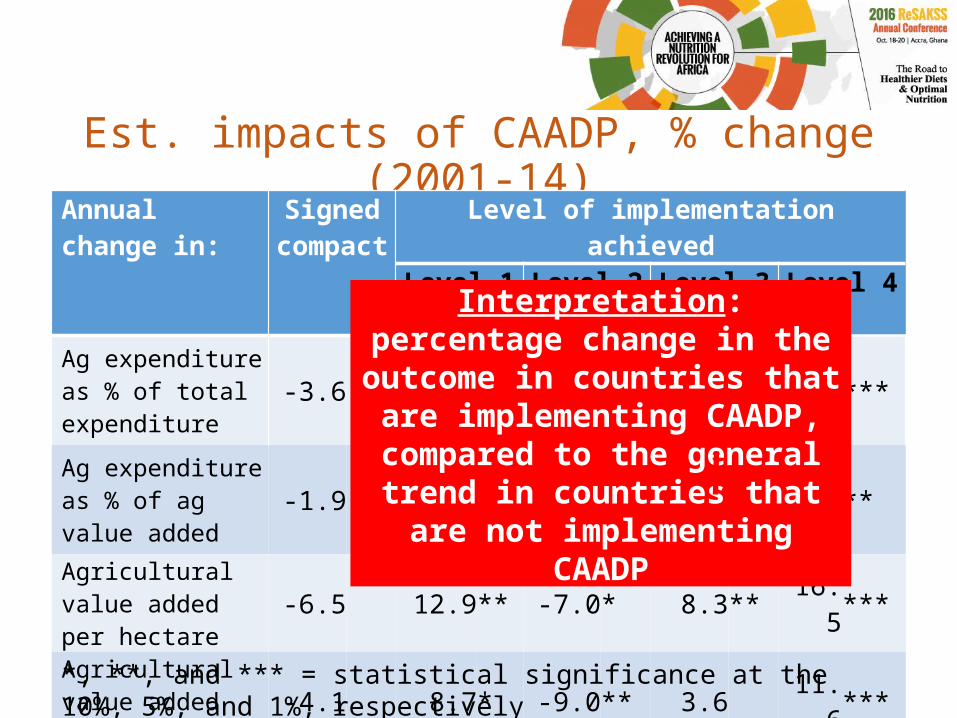
Est. impacts of CAADP, % change (2001-14)Annual change in: Signed
compactLevel of implementation achieved
Level 1 Level 2 Level 3 Level 4
Ag expenditure as % of total expenditure -3.6 -4.0 -5.1 6.3 -23.0***Ag expenditure as % of ag value added -1.9 -5.0 -7.8 -2.3 -20.1**Agricultural value added per hectare -6.5 12.9** -7.0* 8.3** 16.5***Agricultural value added per worker -4.1 8.7* -9.0** 3.6 11.6***Agricultural value added 4.9 8.6** 7.4** 10.8** 16.7***
GDP per capita -0.6 -1.3 -0.3 -0.2 1.5Prevalence of adult undernourishment 1.3 1.1 1.1 3.0 -0.1
*, **, and *** = statistical significance at the 10%, 5%, and 1%, respectively
Interpretation: percentage change in the outcome in countries that are implementing CAADP, compared to the general trend in countries that
are not implementing CAADP

Est. impacts of CAADP, % change (2001-14)Annual change in: Signed
compactLevel of implementation achieved
Level 1 Level 2 Level 3 Level 4
Ag expenditure as % of total expenditure -3.6 -4.0 -5.1 6.3 -23.0***Ag expenditure as % of ag value added -1.9 -5.0 -7.8 -2.3 -20.1**Agricultural value added per hectare -6.5 12.9** -7.0* 8.3** 16.5***Agricultural value added per worker -4.1 8.7* -9.0** 3.6 11.6***Agricultural value added 4.9 8.6** 7.4** 10.8** 16.7***
GDP per capita -0.6 -1.3 -0.3 -0.2 1.5Prevalence of adult undernourishment 1.3 1.1 1.1 3.0 -0.1
*, **, and *** = statistical significance at the 10%, 5%, and 1%, respectively
No
signi
fican
t im
pact
s
Larg
est s
igni
fican
t im
pact
s
Puzzling impacts
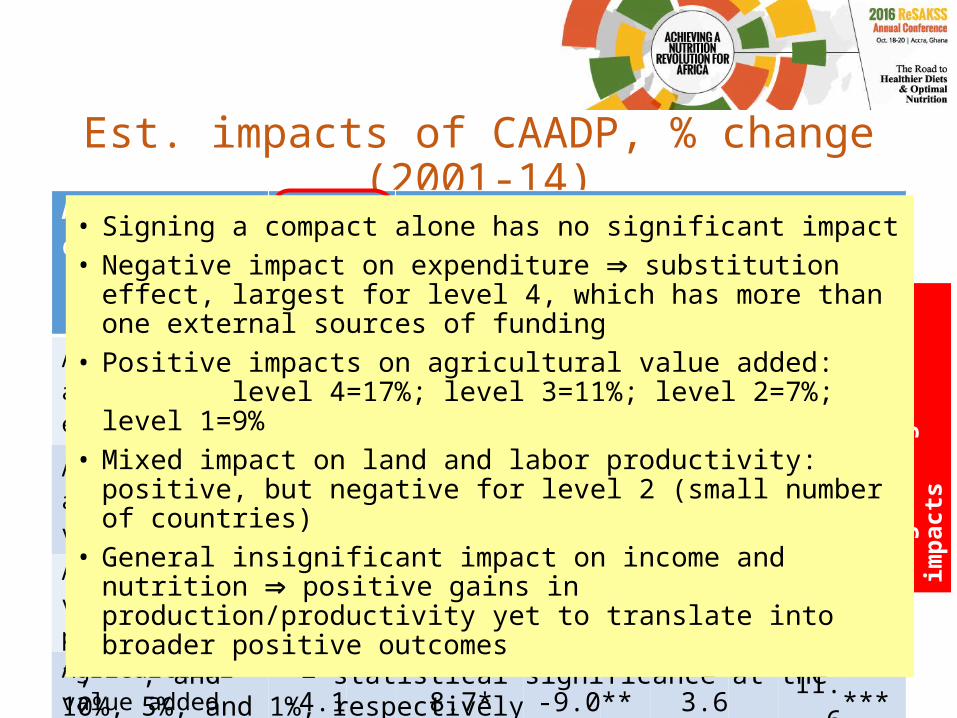
• Signing a compact alone has no significant impact• Negative impact on expenditure substitution effect,
largest for level 4, which has more than one external sources of funding
• Positive impacts on agricultural value added: level 4=17%; level 3=11%; level 2=7%; level 1=9%
• Mixed impact on land and labor productivity: positive, but negative for level 2 (small number of countries)
• General insignificant impact on income and nutrition positive gains in production/productivity yet to translate into broader positive outcomes
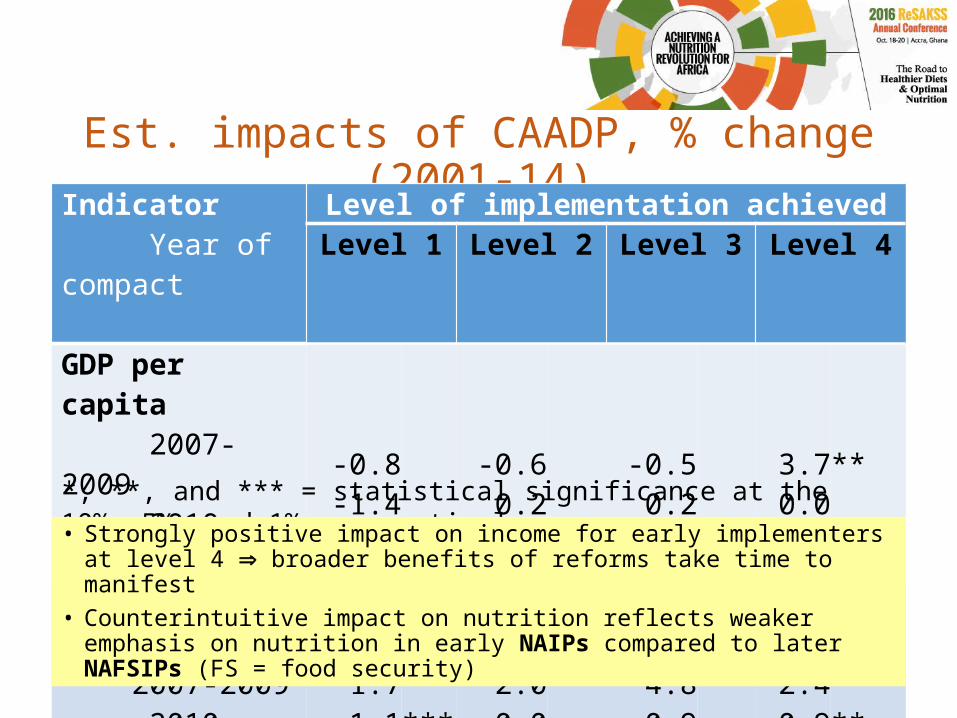
Est. impacts of CAADP, % change (2001-14)Indicator
Year of compactLevel of implementation achieved
Level 1 Level 2 Level 3 Level 4
GDP per capita 2007-2009 2010-2014
-0.8-1.4
-0.60.2
-0.50.2
3.70.0
**
Undernourishment 2007-2009 2010-2014
1.7-1.1
*****
2.00.0
* 4.80.9
** 2.4-0.9
***
*, **, and *** = statistical significance at the 10%, 5%, and 1%, respectively
• Strongly positive impact on income for early implementers at level 4 broader benefits of reforms take time to manifest
• Counterintuitive impact on nutrition reflects weaker emphasis on nutrition in early NAIPs compared to later NAFSIPs (FS = food security)
Overall implications• Because CAADP is a framework for inclusive participation,
ownership, evidence-based policy making, and donor alignment for an agricultural-led development it takes time to gain buy-in from all stakeholders to safeguard
successful implementation as such, finding a shortcut is unlikely
• We can expect (greater) benefits from processes that include a systematic effort to identify strategies that are likely to work (as expected of the growth
options and investment and capacity requirements analyses) articulate those strategies in a plan that is adequately funded and
implemented accordingly to monitor and evaluate progress to continuously refine the
investments and programs Thank you