tracking gravity waves in baroclinic jet-front systems
TRANSCRIPT

Tracking Gravity Waves in Baroclinic Jet-Front Systems
YONGHUI LIN
Department of Atmospheric Sciences, Texas A&M University, College Station, Texas, and State Key Laboratory of Severe Weather,Chinese Academy of Meteorological Sciences, Beijing, China
FUQING ZHANG
Department of Atmospheric Sciences, Texas A&M University, College Station, Texas
(Manuscript received 30 March 2007, in final form 9 October 2007)
ABSTRACT
Using a two-dimensional Fourier decomposition and a four-dimensional ray-tracing technique, the propa-gating characteristics and source mechanisms of mesoscale gravity waves simulated in idealized baroclinicjet-front systems are investigated. The Fourier decomposition successfully separates the simulated gravitywaves from a complex background flow in the troposphere. Four groups of gravity waves in the lowerstratosphere are identified from the spectral decomposition. One is a northward-propagating short-scalewave packet with horizontal wavelength of �150 km, and another is a northeastward-propagating medium-scale wave packet with horizontal wavelength of �350 km. Both of these are most pronounced in the exitregion of the upper-tropospheric jet. A third group exists in the deep trough region above (and nearlyperpendicular to) the jet, and a fourth group far to the south of the jet right above the surface cold front,both of which are short-scale waves and have a horizontal wavelength of �100–150 km.
Ray-tracing analysis suggests that the medium-scale gravity waves originate from the upper-troposphericjet-front system where there is maximum imbalance, though contributions from the surface fronts cannot becompletely ruled out. The shorter-scale, northward-propagating gravity waves in the jet-exit region, on theother hand, may originate from both the upper-tropospheric jet-front system and the surface frontal system.The shorter-scale gravity waves in the deep trough region across the jet (and those right above the surfacecold fronts) are almost certain to initiate from the surface frontal system. Ray-tracing analysis also revealsa very strong influence of the spatial and temporal variability of the complex background flow on thecharacteristics of gravity waves as they propagate.
1. Introduction
The generation and propagation of gravity waves areessential and important dynamic processes within theatmosphere, and many studies have yielded a morethorough understanding of their origins and generalcharacteristics (Fritts and Alexander 2003). Gravitywaves play a prominent role in transferring largeamounts of energy and momentum, which can havesignificant impact on the general circulation of the at-mosphere (e.g., Holton and Alexander 2000). They alsocan initiate and organize convection (e.g., Zhang et al.2001), and they are identified as a possible source of
clear-air turbulence (e.g., Koch et al. 2005). Mountains,convection, wind shear, and adjustment of unbalancedflows related to jet streams and frontal systems are themost important sources of gravity waves (Hooke 1986).
Uccellini and Koch (1987) conceptualized the synop-tic pattern of gravity wave generation and found thatmesoscale waves with amplitudes of 1–15 hPa, horizon-tal wavelengths of 50–500 km, and periods of 1–4 hfrequently appear in the vicinity of jet streaks and onthe cold-air side of surface frontal systems. Since frontalsystems and other related synoptic systems play an im-portant role in the generation of the gravity waves, theorigin of gravity waves accompanying low-level and up-per-level frontogenesis has been investigated with theuse of idealized models (e.g., Snyder et al. 1993; Grif-fiths and Reeder 1996). Snyder et al. (1993) found thatgravity waves with a 100–200-km wavelength may beemitted by frontogenesis when the cross-front scale be-
Corresponding author address: Dr. Fuqing Zhang, Departmentof Atmospheric Sciences, Texas A&M University, College Sta-tion, TX 77845-3150.E-mail: [email protected]
2402 J O U R N A L O F T H E A T M O S P H E R I C S C I E N C E S VOLUME 65
DOI: 10.1175/2007JAS2482.1
© 2008 American Meteorological Society
JAS2482
Unauthenticated | Downloaded 04/02/22 03:58 PM UTC

comes sufficiently small. Meanwhile, Griffiths andReeder (1996) found that propagating gravity waveswith horizontal wavelengths of order 400–1200 km canbe generated from upper-level frontogenesis.
Using a three-dimensional hemispheric primitiveequation model, O’Sullivan and Dunkerton (1995)demonstrated that gravity waves arose spontaneouslyas the tropospheric jet stream was distorted by baro-clinic instability. With a multiply nested mesoscalemodel with grid spacing down to 3.3 km, Zhang (2004,hereafter Z04) further investigated the generation ofmesoscale gravity waves during the life cycle of ideal-ized baroclinic jet-front systems. Long-lived, verticallypropagating gravity waves with horizontal wavelengthsof �100–200 km are simulated near the exit region ofthe upper-tropospheric jet streaks, consistent with pastobservational studies (Uccellini and Koch 1987). Mostrecently, Plougonven and Snyder (2005), Plougonvenand Zhang (2007), and Wang and Zhang (2007) exam-ined the gravity wave generation during different lifecycles of baroclinic waves.
The imbalance diagnosis and model simulations inZ04 suggest that spontaneous balance adjustment islikely the mechanism responsible for the generation ofthese gravity waves. This is a generalization of geo-strophic adjustment, which is a theoretical simplifica-tion of a generally more complex process. The role ofsynoptic-scale imbalance in generating mesoscale grav-ity waves were further examined most recently inPlougonven and Zhang (2007). However, as noted inLane et al. (2004), without a sophisticated wave sourceanalysis it is often difficult to determine unambiguouslywhether mesoscale structures, such as jets and upper-level fronts, are the source of the gravity waves or aresponse to some other forcing that also generates thewaves.
The ray-tracing technique has been widely used toinvestigate gravity wave sources and the influence ofthe background atmosphere on the spatial and tempo-ral variability of gravity wave activity (e.g., Jones 1969;Lighthill 1978). Dunkerton and Butchart (1984) devel-oped a simple ray-tracing model for gravity waves andfound that longitudinal asymmetry in the backgroundflow led to “forbidden” regions into which stationarygravity waves with horizontal wavelengths of 50 � 200km could not propagate. Eckermann (1992) developeda numerical ray-tracing model to trace gravity waves ina realistic zonal-mean atmosphere. Marks and Ecker-mann (1995) extended the ray-tracing formalism to in-clude zonal variability and to accommodate internalgravity waves of all frequencies in a rotating, stratified,compressible, and three-dimensional atmosphere.
The purpose of the present study is threefold. First,the characteristics of mesoscale gravity waves simulatedby Z04 are examined using a two-dimensional Fourierdecomposition method. Second, potential sources ofthe above gravity waves are identified using a four-dimensional ray-tracing numerical model and the Fou-rier decomposition. Finally investigated is the influenceof the four-dimensional varying background flow (i.e.,the propagating media) on gravity wave characteristicssuch as frequency and wavelength as well as on grouppropagation trajectories.
The present paper is arranged as follows: Section 2gives a brief introduction of the ray-tracing model andbackground data resources used in this study. An over-view of the characteristics of mesoscale gravity wavessimulated in Z04 is revisited in section 3. Section 4describes wave identification and characteristics fromthe 2D Fourier spectral decomposition. Section 5 pre-sents the results of ray tracing and reverse ray tracingthe gravity waves. The impacts of initial gravity waveparameters on the ray-tracing results are analyzed insection 6. Finally, conclusions and discussion are givenin section 7.
2. The ray-tracing model
The Gravity Wave Regional or Global Tracer(GROGRAT) model developed in Marks and Ecker-mann (1995) and Eckermann and Marks (1997) is usedin this study to track the propagation and amplitudeevolution of gravity waves. GROGRAT computesgravity wave group trajectories through gridded nu-merical representations of the background atmosphere,using a fully nonhydrostatic dispersion relation contain-ing both rotation and density stratification, accountingfor refraction due to three-dimensional spatial gradi-ents and time variations in the background atmosphere.Wave amplitudes are tracked along ray paths using asomewhat simplified form of the wave action continuityequation that accounts only for vertical compression/dilation of wave action densities (Marks and Ecker-mann 1995). More general wave action conservationcalculations using spatial ray methods require multiplerays or extra so-called derived ray equations can befound in Broutman et al. (2001).
GROGRAT has been used by many investigators totrace gravity waves through different gridded numericalrepresentations of the atmosphere (e.g., Guest et al.2000; Broutman et al. 2001; Gerrard et al. 2004). For theWentzel–Kramers–Brillouin (WKB) assumptions usedin deriving the ray-tracing equations to be valid, thespatial derivatives of the background atmospheric pa-rameters must vary smoothly during numerical integra-
JULY 2008 L I N A N D Z H A N G 2403
Unauthenticated | Downloaded 04/02/22 03:58 PM UTC

tion. The following parameter (hereafter referred to asWKB index),
� �1
m2��m
�z ��� 1
cgzm2
dm
dt �, �1�
is introduced to ensure the validity of the WKB ap-proximations, where m is vertical wavenumber, Cgz isvertical group velocity, and a given ray integration isterminated if � � 1 [see (5) of Marks and Eckermann(1995); Broutman (1984)].
3. Overview of gravity waves simulated in Z04
This study further examines the source mechanismsand characteristics of the gravity waves initiated from adeveloping baroclinic jet-front system simulated in thecontrol experiment (CNTL) of Z04. The idealizedsimulation in Z04 uses the fifth-generation Pennsylva-nia State University–National Center for AtmosphericResearch Mesoscale Model (MM5). Three two-way-nested model domains (D1, D2, and D3) respectivelyuse 90-, 30-, and 10-km horizontal grid spacing, and 60vertical layers are used with 360-m vertical spacing. D1is configured in the shape of a channel 27 000 km long(x direction) and 8010 km wide (y direction), and D2(D3) is a rectangular subdomain 9300 (3100) km longand 4500 (2500) km wide centered at x � 6150 (17 000)km and y � 2850 (6700) km within D1 (D2). Radiativetop boundary conditions are employed for all modeldomains, and moist processes, surface fluxes, and fric-tion are all neglected in the simulations. For this study,GROGRAT uses as its background atmosphere the 30-km (D2) output of the control simulation of Z04, butthe simulated data are coarsened to 60-km (0.5-km)horizontal (vertical) grids. This coarsened output is fur-ther smoothed using a five-point smoother to reducethe smaller-scale background variability though theoverall ray-tracing results are hardly changed with the30-km unsmoothed model output.
The idealized mesoscale simulations of Z04 were ini-tialized with a balanced two-dimensional (2D) channelbaroclinic jet (his Fig. 1) and a balanced three-dimensional (3D) initial perturbation derived from po-tential vorticity (PV) inversion (Davis and Emanuel1991). Subsequent evolution of the potential tempera-ture and pressure at the surface and the jet stream levelin MM5 simulated the life cycle of a typical extratrop-ical cyclone with clear signals of mesoscale gravitywaves at upper levels in the vicinity of the jet-frontsystem persisting for at least 12–24 h (Z04). Figure 1shows a snapshot of the surface cyclone, upper-tropospheric (8 km) jet stream and low-stratospheric
(13 km) divergence–convergence flow pattern at 114 h,the primary time on which the current study focuses.
As shown in Fig. 1c, there are several regions of pro-nounced gravity wave activity at 13 km. The waves of
FIG. 1. The control experiment (CNTL) of Z04, showing simu-lated (a) surface potential temperature (thin line, every 8 K) andsea level pressure (thick line, every 10 hPa); (b) 8-km pressure(thick line, every 5 hPa), potential temperature (thin line, every8 K), and winds (maximum of 50 m s�1, values greater than 40shaded, every 5 m s�1); and (c) 13-km pressure (thick line, every2 hPa), horizontal divergence (thin line—solid and shaded, posi-tive; dashed, negative; every 2 � 10�6 s�1), and wind vectors(maximum of 25 m s�1) valid at 114 h. The inner rectangular boxdenotes the location of all subsequent figures. The distance be-tween tick marks is 300 km.
2404 J O U R N A L O F T H E A T M O S P H E R I C S C I E N C E S VOLUME 65
Unauthenticated | Downloaded 04/02/22 03:58 PM UTC

primary focus in Z04 are those with a predominanthorizontal wavelength of �150 km propagating north-northeastward in the exit region of the upper-tropo-spheric jet streak just downstream of the trough andupstream of the ridge. Aside from the above group,there are two other groups of waves with an apparentorigin near the surface: one is in the deepest troughregion penetrating directly through the jet streaksabove the (“bent back”) surface occluded front, and theother is far to the south of the jet stream above thesurface cold front. Although some of the surface fron-tally forced gravity waves may propagate vertically allthe way to the upper atmosphere, direct model outputand imbalance diagnosis suggest the jet-exit-regiongravity waves are spontaneously generated by the flowimbalance of the upper-tropospheric jet-front systemswithout direct connection to the surface gravity waves.The surface gravity waves originating directly below thejet-exit region are believed to encounter critical levels(and thus dissipate) in the lower troposphere duringtheir vertical propagation. The mesoscale gravity wavesin the exit region of the upper-level jet streaks are con-sistent with those of past observational studies (Uccel-lini and Koch 1987).
Although spontaneous balance adjustment throughthe continuous production of flow imbalance from thedeveloping baroclinic wave may lead to the continuousradiation of gravity waves, direct or indirect forcing bythe surface fronts cannot be fully ruled out in Z04. Thespectral decomposition and ray tracing techniques arethus employed in this study to further differentiate thegravity waves originating at upper levels from thoseoriginating near the surface.
4. Wave identification and characteristics from 2Dspectral decomposition
The 2D Fourier decomposition is employed here todecompose waves in the 30-km D2 output into threedistinct scales: the smaller-scale component with hori-zontal wavelengths (Lh) less than 210 km, the interme-diate-scale component with Lh between 210 and 600km, and the medium-scale component with Lh greaterthan 600 km. The spectral decomposition is obtainedsimply through inversed Fourier transfer of all the 2DFourier coefficients within a selected range of horizon-tal wavelengths (zeroing out all other beyond the speci-fied range). The spectral analysis is performed on asubset of D2 output with areal coverage of 7500 by 4200km (area encompassed by Fig. 1). Note that the 30-kmD2 output has direct feedback from the 10-km D3simulation through two-way nesting.
Figure 2 shows the horizontal distribution of the
original and decomposed 13-km vertical velocity at114 h. As expected, the large-scale component (Fig. 2d)shows clear large-scale descent (ascent) upstream(downstream) of the trough and the jet maximum.There are three clear packets of near-monochromatic,smaller-scale waves (Lh 210 km): one is in the im-mediate exit region of the jet streak (wave packet 1 orWP1; Fig. 2b), another is in the deep trough regioncutting cross the jet streak (wave packet 3 or WP3; Fig.2c), and the third is to the far south of the jet streamdirectly above surface cold front (bottom center of Fig.1c). The spectral decomposition also reveals clear sig-nals of medium-scale (210 Lh 600 km) gravitywaves propagating northeastward (wave packet 2 orWP2; Fig. 2b) in the immediate exit region of the jetstreak and to the right of WP1. Although all thesewaves were discussed in Z04, only the jet-exit-regiongravity waves (superposition of WP1 and WP2) wereexamined in detail therein. Since WP2 waves (Lh � 350km) are barely separable from the shorter WP1 waves(Lh �150 km) within the original field without spectralfiltering, they were not identified separately in Z04.Results from spectral decomposition performed in D2are qualitatively similar to those performed directlywith the 10-km D3 output of the same simulation inWang and Zhang (2007).
Spectral decomposition allows for better estimationof the propagating characteristics of each wave packet.The horizontal wavelengths of WP1, WP2, and WP3along the center of the wave packets at 13 km are re-spectively �150, 350, and 140 km. Meanwhile, their cor-responding ground-based phase speeds averaged from108 to 114 h are respectively �2.5, 6.0, and �8.0 m s�1,and the wave vector azimuths are respectively 90°, 55°,and 270° (with respect to 0° due east). The shorter-scalewaves above the surface fronts have a horizontal wave-length �100 km and are always phased tied with thesurface cold front (not shown).
5. Source analyses with ray tracing
In this section, GROGRAT—introduced in section2—is employed to track the origin and propagation ofthe different lower-stratospheric gravity wave packetsidentified above. The 6-hourly saved 30-km D2 outputwas ingested into the ray-tracing model to account forthe true 4D (time and space) background variations inthe ray tracing. Three locations at 13 km and 114 halong the center of each wave packet (denoted by dotsin Figs. 2b,c) are selected as the endpoints of differentray paths from which the ray-tracing model is inte-grated backward in time (also called reverse ray tracingor backtraced). The input parameters for the initial rays
JULY 2008 L I N A N D Z H A N G 2405
Unauthenticated | Downloaded 04/02/22 03:58 PM UTC

of each wave group (WP1, WP2, and WP3) are esti-mated from the 2D spectral decomposition (Table 1).Three additional backtraced rays (denoted by dia-monds in Fig. 2c) are computed for WP2 to the east ofcenter of the wave packet.
a. WP1: The shorter-scale gravity waves of Lh �150 km in the jet-exit region
The three backtraced rays launched from WP1 (seeFig. 2b) are denoted as A, B, and C. It is found that allthree rays can be traced back to the surface level (rayintegration is stopped after rays pass below 1 km). Thevalidity of the WKB index (1), which is essential for theray-tracing analysis of gravity waves, is examined first.Figure 3 gives the vertical profiles of the WKB index,the vertical gradient of horizontal winds (u and ), andthe vertical gradient of the square of buoyancy fre-quency along the center-ray path of each group. It is
found that the WKB index has local peaks right abovethe jet streaks (due to large vertical wind shear) and inthe lower troposphere (due to large variation of staticstability) but is always smaller than unity, and thus theWKB approximation remains valid throughout thebackward ray integration [Fig. 3a; Eq. (1)].
Although all three rays from WP1 are launched ini-tially at the same time (114 h) and height (13 km), andthey can all be traced back to the surface level, the timeit takes to propagate through the background atmo-sphere is different for different rays. The southernmostray C reaches the bottom of the integration domain(1 km) in a slightly shorter period (3.3 h) than rays Aand B (Table 1), mostly due to differences in the lowertroposphere.
Next examined are the positions of the rays at differ-ent levels and the projection of the rays onto the 2DFourier decomposition of the shorter-scale component
FIG. 2. The CNTL of Z04 simulated 13-km vertical velocity (every 0.0012 m s�1; positiveshaded) valid at 114 h for (a) total and the spectral components at different scales for (b)smaller-wavelength Lh 210 km, (c) medium-wavelength 210 Lh 600 km, and (d)larger-wavelength Lh � 600 km. Initial backtraced ray positions from WP1 and WP3, whoseray positions are shown in Fig. 4, are denoted in (b) and for WP2 in (c). The 8-km wind speeds(thick lines; �40 m s�1, every 5 m s�1) are plotted to denote the position of the jet.
2406 J O U R N A L O F T H E A T M O S P H E R I C S C I E N C E S VOLUME 65
Unauthenticated | Downloaded 04/02/22 03:58 PM UTC

(Lh 210 km) plotted at the closest integer hour to thetime the three rays intercept the given levels (Fig. 4).Despite gradually shifting from the center to the rightside of the shorter-scale component area (Fig. 4) as theypropagated backward in time and downward from 114h and 13 km, respectively (Fig. 2b), the rays of WP1generally coincide well with the shorter-wave (�150km) signals throughout the troposphere. At 1 km, boththe filtered shorter-scale component and the rays ofWP1 are right atop of the occluded surface fronts (Fig.4d). This suggests the possibility that shorter-scale WP1of Lh � 150 km in the jet-exit region may originatefrom the lower troposphere near the surface. Whilegravity wave emission from surface fronts has long been
recognized as possible in the literature (e.g., Snyder etal. 1993), this process is not obvious in the direct crosssections of the original model output (Fig. 6c of Z04)and filtered shorter-wave fields (Fig. 10 of Wang andZhang 2007) because these are not strictly 2D front-forced gravity waves. Along the aforementioned crosssections, the surface, frontally forced gravity waves di-rectly below the jet-exit-region waves are found to en-counter a critical level and dissipate before they reachthe jet-stream levels.
To further explore the possibility that the shorterhorizontal scale, upper-level waves originate near thesurface, 11 different forward-integrated rays of shorterscale gravity waves are launched at 108 h all along the
TABLE 1. The starting and termination height (H), time (T), horizontal and vertical wavelength (Lh, Lz), ground-based group velocity inx, y, z directions (cgx, cgy, cgz), and absolute intrinsic frequency (|�*| ) of the three groups of backtraced rays denoted in Figs. 2b,c.
Ray group WP1 WP2 WP3
Ray label A B C D E F G H I
H (km) Start 13End 0.9 0.9 0.8 3.4 2.9 2.8 0.5 1.0 0.8
T (h) Start 114End 109.2 110.2 110.7 95.1 96.9 100.8 107.5 108.1 107.6
Lh (km) Start 150 350 140End 255 195 158 570 551 608 160 116 106
Lz (km) Start 2.4 2.6 2.8 2.6 2.9 2.8 5.0 5.0 4.9End 6.5 9.0 6.9 1.7 1.9 2.7 14.1 9.1 5.4
cgx (m s�1) Start 8.6 9.3 9.67 6.7 5.7 7.0 17.1 18.3 19.6End �38.9 �27.0 �12.4 9.1 8.7 13.4 �5.5 4.2 4.7
cgy (m s�1) Start 2.8 3 2.93 5.6 5.3 5.8 �7.52 �7.5 �7.5End 7.9 6.6 4.8 8.9 8.0 7.3 �11.7 �27.1 �35.6
cgz (m s�1) Start 0.13 0.14 0.17 0.06 0.08 0.06 0.53 0.54 0.53End 0.38 0.70 0.54 0.01 0.01 0.01 0.79 0.68 0.37
|�*| (10�4 s�1) Start 3.46 3.69 4.05 1.90 2.01 1.90 6.93 7.02 7.10End 3.74 4.80 4.81 1.06 1.09 1.17 3.90 5.06 4.80
FIG. 3. Vertical profiles of (a) the WKB index �, and vertical shears of (b) zonal and (c) meridional winds (s�1), and (d) buoyancyfrequency (10�7 m�1s�2) of the three backtraced rays from WP1 (denoted in Fig. 2b) during their backward (and downward)integration.
JULY 2008 L I N A N D Z H A N G 2407
Unauthenticated | Downloaded 04/02/22 03:58 PM UTC

surface occluded fronts. The initial horizontal wave-length, ground-based horizontal phase speed and wavevector azimuth (derived from the filtered short-wavefields) are respectively �156 km, �4.0 m s�1, and �90°for the seven rightmost rays, and �156 km, �6.0,m s�1and �150° for other four rays. The maximumaltitude of all these surface-originating, shorter-waverays shown in Fig. 5a confirm that not all shorter wavesemitted from the surface fronts can propagate into theupper atmosphere (defined here as the 13-km level).Termination of all these rays is due to encounteringcritical layers. The rays from the region of strongestshorter-wave activity (ray 2 to ray 6 from left to right inFig. 5) terminate in the low-to-middle tropospherewhile the rays near the right edge of the strong shorter-wave activity are somewhat similar to the reverse rays(A, B, and C) from WP1 discussed earlier. This againsuggests that WP1 may originate from near-surface
frontal boundaries. However, neither the backward norforward ray tracing can rule out the possibility thatthese shorter waves may completely or partially origi-nate at upper levels. This is because both the forwardand backtraced rays pass through the upper tropo-spheric jet-exit region of maximum imbalance (Z04)and the wave energy source can be anywhere along theray paths.
To examine the possible excitation of the shorter-scale gravity waves by the upper- tropospheric jet, threeshorter-scale forward rays are launched at 9 km and 108h in the jet-exit region (Fig. 6a). The initial horizontalwavelength, ground-based horizontal phase speed andwave vector azimuth are 160 km, 3.5 m s�1, and 90°,respectively. These rays are integrated with both anegative (upward) and a positive (downward) wave-number in the vertical direction. For the upward-propagating rays, the horizontal wavelength, vertical
FIG. 4. Positions of different backtraced rays from WP1 and WP3 (initial positions at 13 kmand 114 h denoted in Fig. 2b) during their downward integration and the smaller-wavelength(Lh 210 km) spectral component of vertical velocity (positive shaded) at (a) 11, (b) 8, (c)6, and (d) 1 km valid at the averaged time to the closest integer hour that the three rays ofWP1 arrived at that level with every 0.002 m s�1 for (a)–(c) and 0.004 m s�1 for (d). The 8-kmwinds �40 m s�1 (thick, every 10 m s�1) at 111 h and 1-km potential temperature (thin line,every 4 K) at 110 h are plotted in (d) to denote the position of the jet and the surface fronts.
2408 J O U R N A L O F T H E A T M O S P H E R I C S C I E N C E S VOLUME 65
Unauthenticated | Downloaded 04/02/22 03:58 PM UTC

wavelength, and intrinsic frequency at 13 km are re-spectively �134 km, 1.6 km, and 2.7 � 10�4 s�1. Thesecharacteristics are qualitatively similar to those of WP1.Projection of the ray positions onto the correspondingfiltered short-wave fields in Fig. 6 further confirms thepossibility that WP1 originates from the upper-tropo-spheric jet-front system as hypothesized in Z04. On theother hand, the downward-propagating rays terminatebefore reaching the surface due to critical-level filter-ing.
b. WP2: The medium-scale gravity waves of Lh �350 km in the jet-exit region
Here, the three backtraced rays (D, E, and F), whosepositions at 13 km and 114 h are denoted with dots inFig. 2c, are launched from WP2. The ray paths of these
medium-scale gravity waves (WP2) differ significantlyfrom those of WP1 (cf. Figs. 6 and 9). With longerwavelengths, the gravity waves along the rays of WP2have an intrinsic frequency close to the inertial fre-quency, which is much smaller than that of WP1. Noneof the rays (D, E, or F) can be traced backward to thesurface level; they all terminate at �3.0 km in the lowertroposphere where the vertical group velocity is nearlyzero (we used a threshold of 0.0001 m s�1 defaulted inGROGRAT) due to a critical level (Table 1).
The ray paths (D, E, and F) of the medium-scalewaves are also projected onto the intermediate-scalecomponent of the spectral decomposition in Fig. 7. Therays of WP2 correspond well with the filtered interme-diate-scale wave signals at or above the upper-tropo-spheric jet-front systems (Figs. 7a,b), but the rays no
FIG. 6. Positions of the three 150-km rays during their forward (and upward) integration andthe smaller-wavelength (Lh 210 km) spectral component of vertical velocity (every 0.001m s�1; positive shaded) at (a) 9 km and 108 h (initial positions) and (b) 13 km and 113 h (theaveraged time to the closest integer hour that the three rays arrived at that level). The 8-kmwind speeds (thick line; �40 m s�1, every 5 m s�1) at 108 h are plotted to denote the positionof the jet.
FIG. 5. The 3D display of the ray paths of all forward rays launched at 108 h from the surfacefronts with initial wavelengths of (a) 150 and (b) 350 km. The 1-km potential temperature at108 h is shaded to denote the position of the surface fronts.
JULY 2008 L I N A N D Z H A N G 2409
Unauthenticated | Downloaded 04/02/22 03:58 PM UTC

longer overlap with the strong filtered signals below thejet streams (Figs. 7c,d). At the same time, another threerays launched on the southeastern edge of WP2 (also at13 km and 114 h, denoted with diamonds in Fig. 2c)integrated backward may reach the surface level, buttheir near-surface locations are far away from the sig-nificant medium-scale wave activity associated with thesurface occluded fronts (Fig. 7d). The above backwardray tracing of WP2 thus suggests that the medium-scalegravity waves in the jet-exit region most likely originatefrom the upper-level jet-front systems.
The ray analyses above indicate that there are twopackets of medium-scale gravity waves in the exit re-gion of the upper-level jet streaks at 9 km and 108 h.One of these appears to propagate to the north andupward and the other propagates to the northeast anddownward (Fig. 8a). Two sets of three rays are launchedalong the center of each packet at 9 km and 108 h, and
the ray-tracing model is then integrated forward in time(initial positions for upward rays Fig. 8a and for down-ward rays in Fig. 9a). The initial horizontal wavelength,ground-based horizontal phase speed and wave vectorazimuth are respectively �400 km, 3.0 m s�1, and 90°for the upward propagating packet. Subsequent projec-tion of the ray paths onto the filtered intermediate-scale component shows good agreement between theray-tracing and spectral analysis of the wave signals(Fig. 8b), but the averaged horizontal wavelength of therays at 13 km is �260 km, which is much smaller thanthe typical �350-km horizontal wavelength of WP2 atthis level. Meanwhile, the initial horizontal wavelength,ground-based horizontal phase speed, and wave vectorazimuth are chosen to be �500 km, 5.8 m s�1, and 25°for the downward-propagating packet. Figure 9 showsthat the rays for the downward-propagating waves alsoalign well with the filtered medium-scale waves, but
FIG. 7. Positions of the six rays from WP2 (initial position at 13 km and 114 h denoted inFig. 2c) during its backward (and downward) integration and the medium-wavelength (210 Lh 600 km) spectral component of vertical velocity (positive shaded) at (a) 11, (b) 8, (c) 6,and (d) 1 km valid at the averaged time to the closest integer hour that the three rays arrivedat that level with every 0.002 m s�1 for (a)–(c) and 0.004 m s�1 for (d). The 8-km wind speeds(thick lines; �40 m s�1, every 5 m s�1) at 111 h and 1-km potential temperature (thick, every4 K) at 102 h are plotted in (d) to denote the positions of the jet and the surface fronts.
2410 J O U R N A L O F T H E A T M O S P H E R I C S C I E N C E S VOLUME 65
Unauthenticated | Downloaded 04/02/22 03:58 PM UTC
downward rays will later stall in the mid-to-lower tro-posphere. Both the upward and downward rayslaunched from the jet-exit region further demonstratethat the upper-tropospheric jet-front system is the mostlikely source region for the medium-scale gravity waves(e.g., WP2).
Since there are also apparent medium-scale gravitywaves in the filtered intermediate-scale componentnear the surface (not shown), 11 medium-scale rays arealso launched from the surface frontal regions. Theselonger-scale rays have the same initial positions asthose shorter-scale rays discussed in section 4a (see Fig.5a). The initial horizontal wavelength, ground-basedhorizontal phase speed, and wave vector azimuth arerespectively �300 km, 6.0 m s�1, and 80° for the sevenrays located right of the occluded surface fronts and�300 km, �6.0 m s�1, and 150° for the other four raysto the left. Similar to the propagating upward gravitywaves with shorter horizontal wavelengths, not all thewaves launched from the surface front can propagateinto the upper atmosphere. However, three rays atthe extreme right end of the group and another at theother leftmost end can propagate to the 13-km level(Fig. 5b). The locations of five rays near the right edgeof wave activity coincide approximately with the gravitywave packets at different heights (not shown). Thespectral decomposition in combination with forward/backward ray-tracing analyses suggest that the upperjet-frontal systems (where there is maximum imbal-ance) are the most likely source of WP2, but contribu-tions from the surface frontal systems cannot be en-tirely ruled out.
c. WP3: The shorter-scale gravity waves of Lh �140 km in the deep trough region
Similarly, the three backtraced rays labeled as G, H,and I are launched from WP3, and their positions at 13km and 114 h are denoted with dots in Fig. 2a. The raytrajectories of these gravity waves in WP3 all reach thesurface level (Fig. 4), but differ significantly from therays in WP1 and WP2. The backtraced rays graduallyshift to the left during their downward propagationwithout any significant change in wave vector azimuthat or above 5 km (Figs. 4a–c). Below 5 km, the ray pathsquickly rotate so that they are aligned across the oc-cluded fronts to the west of the surface cyclone (Fig. 4d)by the time they reach the surface. The ray paths ofWP3 also agree well with the forward shorter-wave raypath launched from the extreme west end of the surfaceoccluded fronts discussed in section 5a (Fig. 5). Theseresults show that the gravity waves in WP3 most likelyoriginate from the surface frontal systems.
6. Ray-tracing sensitivity
Horizontal wavelength and ground-based phasespeed are two important initial wave parameters inbacktraced gravity waves. Since there are inaccuraciesin the estimations of the horizontal wavelength andground-based phase speed in section 4, the sensitivity ofthe ray-tracing results to initial parameters of the threeupper-level wave packets (WP1, WP2, and WP3) is ex-amined. Here, the backward ray tracing is performed asin section 4 with three rays for each packet with the
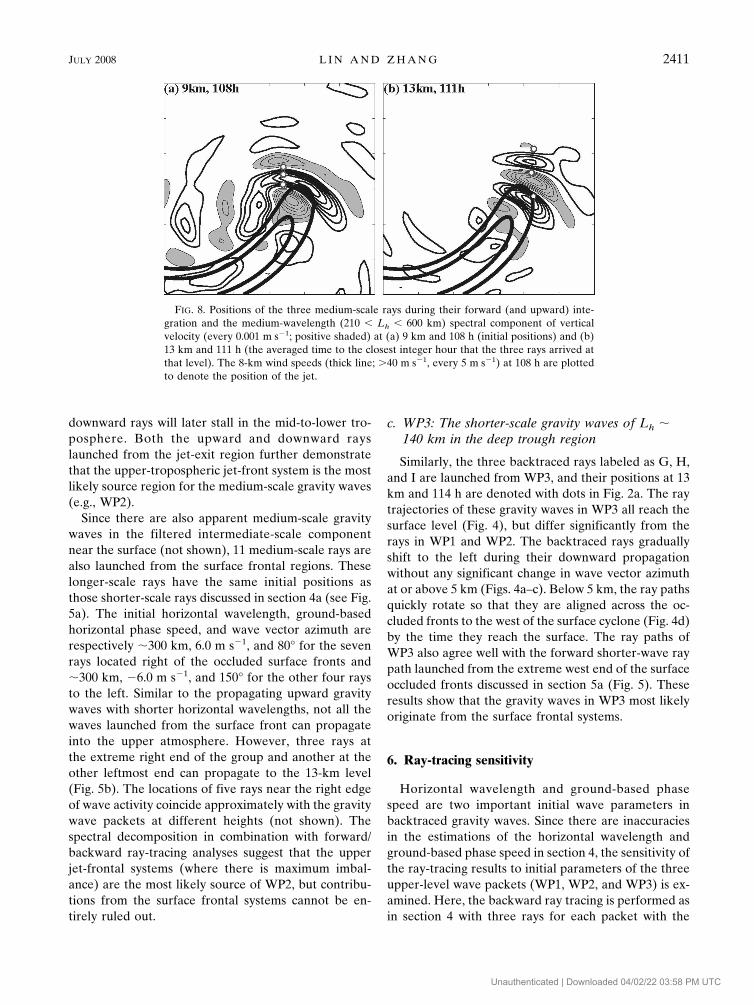
FIG. 8. Positions of the three medium-scale rays during their forward (and upward) inte-gration and the medium-wavelength (210 Lh 600 km) spectral component of verticalvelocity (every 0.001 m s�1; positive shaded) at (a) 9 km and 108 h (initial positions) and (b)13 km and 111 h (the averaged time to the closest integer hour that the three rays arrived atthat level). The 8-km wind speeds (thick line; �40 m s�1, every 5 m s�1) at 108 h are plottedto denote the position of the jet.
JULY 2008 L I N A N D Z H A N G 2411
Unauthenticated | Downloaded 04/02/22 03:58 PM UTC

same initial position and phase speed and direction.However, for each of the rays the initial horizontalwavelengths in WP1 and WP3 vary from 100 to 200 km,and they vary from 300 to 400 km for WP2. For sim-plicity, hereafter we only show the evolution of the rayslocated in middle of each group (i.e., B for WP1, E forWP2, and H for WP3).
In Fig. 10, the differences in the profiles of the ver-tical group velocity and horizontal wavelength are dueto the use of different horizontal wavelengths in thebacktraced rays (B of WP1, E of WP2, and H of WP3).The rays with shorter initial horizontal wavelengthscorrespond to a larger vertical group velocity, espe-cially in the vicinity of upper-tropospheric jet streaks.Although the evolution of vertical group velocity, hori-zontal wavelength (Figs. 10a,b,e,f), and other waveproperties are sensitive to the initial wavelength, theshorter-scale rays (B from WP1 and H from WP3) will
all reach the bottom of the model domain. Also, despitethe larger variations of wave properties in WP2 due todifferent initial horizontal wavelengths, each of the raysterminates at similar altitude (2–4 km) due to critical-level filtering before reaching the surface (Figs. 10c,d).
In addition to the above tests of sensitivity to hori-zontal wavelength, the sensitivity of the ray tracing tothe initial estimate of the ground-based phase speeds isalso tested. Phase speeds are changed from 1.0 to 4.0m s�1 for ray B (WP1), from �6.0 to �8.0 m s�1 for H(WP3), and from 4.0 to 8.0 m s�1 for E (WP2), while theother initial input parameters are kept the same as insection 5. Despite slight changes in their horizontal po-sition along the downward path (not shown), the intrin-sic frequency and vertical group velocity of each ray areboth largely insensitive to the difference in initial phasespeed (not shown).
Variations in the background flow are shown to be
FIG. 9. Tracing of the three forward-tracing 350-km rays during their downward integrationand the medium-wavelength (210 Lh 600 km) spectral component of vertical velocity(positive shaded) for (a) initial position at 9 km and 108 h, and for subsequent positions at (b)8, (c) 7, and (d) 6 km valid at the averaged time to the closest integer hour the three raysarrived at that level. Contour intervals are every 0.002 m s�1 for (a), (b) and 0.004 m s�1 for(c), (d). The 8-km wind speeds (thick line; �40 m s�1, every 5 m s�1) at 108 h are plotted todenote the position of the jet.
2412 J O U R N A L O F T H E A T M O S P H E R I C S C I E N C E S VOLUME 65
Unauthenticated | Downloaded 04/02/22 03:58 PM UTC

significant in the ray paths, and since the time resolu-tion of model output for the above ray-tracing experi-ments is rather coarse (6 h), another set of ray-tracingsensitivity experiments is performed by updating thebackground fields every 3 h. Comparison of the groupvelocity profile for rays representing WP1, WP2, andWP3 shows that changing the data interval from 6 to 3h makes almost no noticeable difference in the raypaths (not shown). This further indicates that thechange in the background is much slower than thevariations of the gravity waves (a further assurance thatthe WKB assumption is valid). No significant changesin ray paths are found when even higher resolutionmodel output (in both time and space) is used (notshown).
7. Summary and discussion
Using a two-dimensional Fourier decomposition anda four-dimensional ray-tracing technique, this study in-vestigates the group propagation characteristics andpossible source mechanisms of mesoscale gravity waves
simulated in the idealized baroclinic jet-front system ofZ04.
The two-dimensional Fourier decomposition success-fully separates the simulated gravity waves from thecomplex background flow in the troposphere and lowerstratosphere. Four distinct groups of gravity wavesidentified from the decomposition are investigated.One is a northward-propagating wave packet with ahorizontal wavelength of �150 km in the immediateexit region of the jet streak (WP1), and another has ahorizontal wavelength of �140 km and a horizontalwave vector veering from northward to southward inthe deep trough region cutting across the jet streak(WP3). The third has a horizontal wavelength of �350km and propagates northeastward (WP2), also in theimmediate exit region of the jet streak but to the rightof WP1. The medium-scale gravity waves in WP2 arebarely separable from WP1 in the original field exam-ined in Z04. The fourth group to the far south of the jetright above the surface cold front with horizontal wave-lengths of �100–150 km is clearly generated by thesurface fronts.
FIG. 10. Sensitivity of (top) vertical group velocity (10�2 m s�1) and (bottom) horizontalwavelength (km) of the backtraced rays to the use of different initial horizontal wavelengths:(a), (d) 100, 150, and 200 km for ray B; (b), (e) 300, 350, and 400 km for ray E; and (c), (f)100, 140, and 200 km for ray H.
JULY 2008 L I N A N D Z H A N G 2413
Unauthenticated | Downloaded 04/02/22 03:58 PM UTC

Ray-tracing analysis suggests that the medium-scalegravity waves (WP2) originate from the upper-tropo-spheric jet-front system (where there is maximum im-balance), though contributions from the surface frontscannot be completely ruled out. The shorter-scale grav-ity waves (WP3) in the deep trough region penetratingacross the jet streak most likely initiate from the surfacefrontal system. The jet-exit-region, northward-propa-gating, shorter gravity waves (WP1), on the other hand,may originate from either the upper-tropospheric jet-front system or the surface frontal system.
Ray-tracing analysis also reveals a very strong influ-ence of the spatial and temporal variability of the com-plex background flow (and associated background de-formation) on the characteristics of gravity waves asthey propagate. Nevertheless, our ray-tracing analysesand spectral decomposition suggest the “wave captur-ing” theory proposed by Bühler and McIntyre (2005)and applied in Plougonven and Snyder (2005) appearsto be insufficient to explain the gravity wave patterns inthe jet-exit region, since 1) these mesoscale waves ob-viously have different wave characteristics and aspectratios at this same region and 2) significant verticalgroup propagation of the rays will propagate the wavesaway before the background deformation has sufficienttime to “capture” the waves. Strong variations in thewave characteristics and background flow as well ascollocation of waves with different characteristics willcertainly lead to difficulties in using individual sound-ing-based hodograph methods to accurately retrievethe gravity wave properties (e.g., Eckermann 1996;Zhang et al. 2004).
It is also worth noting that, for both forward andbackward ray tracing examined in this study, the gravitywave parameters such as horizontal wavelengths fromthe ray-tracing analysis are slightly less than those es-timated directly from the 2D spectral decomposition.The positioning of the rays, especially those of longerwaves, may also be slightly shifted from that derivedfrom the 2D decomposition. These discrepancies maycome from the omission of both horizontal and verticalshears in the ray calculation and the rapid spatial varia-tion of the background environment despite the satis-faction of the WKB criteria in the ray-tracing analysis.
Acknowledgments. Thanks are due to Steve Ecker-mann for providing codes and help on the GROGRATmodel. Discussions with and comments from Ecker-mann, Tim Dunkerton, Chris Snyder, Todd Lane, CraigEpifanio, and Riwal Plougonven are helpful. We arealso grateful to Shuguang Wang for his help on figures,and to Jason Sippel and Wang for their proofreading ofearlier versions of the manuscript. Most of this study
was conducted during YL’s sabbatical visit at TexasA&M University. The research was supported by theNSF Grants ATM-0203238 and ATM-0618662 and bythe China 973 Project under Grant 2004CB418304.
REFERENCES
Broutman, D., 1984: The focusing of short internal waves by aninertial wave. Geophys. Astrophys. Fluid Dyn., 30, 199–225.
——, J. W. Rottman, and S. D. Eckermann, 2001: A hybridmethod for analyzing wave propagation from a localizedsource, with application to mountain waves. Quart. J. Roy.Meteor. Soc., 127, 129–146.
Bühler, O., and M. E. McIntyre, 2005: Wave capture and wave-vortex duality. J. Fluid Mech., 534, 67–95.
Davis, C. A., and K. A. Emanuel, 1991: Potential vorticity diag-nosis of cyclogenesis.. Mon. Wea. Rev., 119, 1929–1952.
Dunkerton, T. J., and N. Butchart, 1984: Propagation and selec-tive transmission of inertial gravity waves in a sudden warm-ing. J. Atmos. Sci., 41, 1443–1460.
Eckermann, S. D., 1992: Ray-tracing simulation of the globalpropagation of inertia gravity waves through the zonally av-eraged middle atmosphere. J. Geophys. Res., 97, 15 849–l5 866.
——, 1996: Hodographic analysis of gravity waves: Relationshipsamong Stokes parameters, rotary spectra, and cross-spectralmethods. J. Geophys. Res., 101, 19 169–19 174.
——, and C. J. Marks, 1997: GROGRAT: A new model of theglobal propagation and dissipation of atmospheric gravitywaves. Adv. Space Res., 20, 1253–1256.
Fritts, D. C., and M. J. Alexander, 2003: Gravity wave dynamicsand effects in the middle atmosphere. Rev. Geophys., 41,1003, doi:10.1029/2001RG000106.
Gerrard, A. J., T. J. Kane, S. D. Eckermann, and J. P. Thayer,2004: Gravity waves and mesospheric clouds in the summermiddle atmosphere: A comparison of lidar measurementsand ray modeling of gravity waves over Sondrestrom,Greenland. J. Geophys. Res., 109, D10103, doi:10.1029/2002JD002783.
Griffiths, M., and M. J. Reeder, 1996: Stratospheric inertia-gravitywaves generated in a numerical model of frontogenesis. I:Model solutions. Quart. J. Roy. Meteor. Soc., 122, 1153–1174.
Guest, F. M., M. J. Reeder, C. J. Marks, and D. J. Karoly, 2000:Inertia-gravity waves observed in the lower stratosphere overMacquarie Island. J. Atmos. Sci., 57, 737–752.
Holton, J. R., and M. J. Alexander, 2000: The role of waves in thetransport circulation of the middle atmosphere. AtmosphericScience across the Stratopause, Geophys. Monogr., Vol. 130,Amer. Geophys. Union, 21–35.
Hooke, W. H., 1986: Gravity waves. Mesoscale Meteorology andForecasting, P. S. Ray, Ed., Amer. Meteor. Soc., 272–288.
Jones, W. L., 1969: Ray tracing for internal gravity waves. J. Geo-phys. Res., 74, 2028–2033.
Koch, S. E., and Coauthors, 2005: Turbulence and gravity waveswithin an upper-level front. J. Atmos. Sci., 62, 3885–3908.
Lane, T. P., J. D. Doyle, R. Plougonven, M. A. Shapiro, and R. D.Sharman, 2004: Observations and numerical simulations ofinertia gravity waves and shearing instabilities in the vicinityof a jet stream. J. Atmos. Sci., 61, 2692–2706.
Lighthill, M. J., 1978: Waves in Fluids. Cambridge UniversityPress, 504 pp.
2414 J O U R N A L O F T H E A T M O S P H E R I C S C I E N C E S VOLUME 65
Unauthenticated | Downloaded 04/02/22 03:58 PM UTC

Marks, C. J., and S. D. Eckermann, 1995: A three-dimensionalnonhydrostatic ray-tracing model for gravity waves: Formu-lation and preliminary results for the middle atmosphere. J.Atmos. Sci., 52, 1959–1984.
O’Sullivan, D., and T. J. Dunkerton, 1995: Generation of inertia-gravity waves in a simulated life cycle of baroclinic instability.J. Atmos. Sci., 52, 3695–3716.
Plougonven, R., and C. Snyder, 2005: Gravity waves excited byjets: Propagation versus generation. Geophys. Res. Lett., 32,L18802, doi:10.1029/2005GL023730.
——, and F. Zhang, 2007: On the forcing of inertia–gravity wavesby synoptic-scale flows. J. Atmos. Sci., 64, 1737–1742.
Snyder, C., W. C. Skamarock, and R. Rotunno, 1993: Frontal dy-namics near and following frontal collapse. J. Atmos. Sci., 50,3194–3211.
Uccellini, L. W., and S. E. Koch, 1987: The synoptic setting and
possible source mechanisms for mesoscale gravity waveevents. Mon. Wea. Rev., 115, 721–729.
Wang, S., and F. Zhang, 2007: Sensitivity of mesoscale gravitywaves to the baroclinicity of jet-front systems. Mon. Wea.Rev., 135, 670–688.
Zhang, F., 2004: Generation of mesoscale gravity waves in upper-tropospheric jet-front systems. J. Atmos. Sci., 61, 440–457.
——, S. E. Koch, C. A. Davis, and M. L. Kaplan, 2001: Waveletanalysis and the governing dynamics of a large-amplitudegravity wave event along the east coast of the United States.Quart. J. Roy. Meteor. Soc., 127, 2209–2245.
——, S. Wang, and R. Plougonven, 2004: Potential uncertaintiesin using the hodograph method to retrieve gravity wave char-acteristics from individual soundings. Geophys. Res. Lett., 31,L11110, doi:10.1029/2004GL019841.
JULY 2008 L I N A N D Z H A N G 2415
Unauthenticated | Downloaded 04/02/22 03:58 PM UTC