tracking ghg emissions in a booming city -urban atmospheric monitoring in recife, brazil
TRANSCRIPT

2nd ICOS science conference, September 27th, 2016, Helsinki, Finland
Tracking GHG emissions in a booming city - urban atmospheric monitoring in Recife, Brazil
Work conducted/supported: F.R. Vogel, J. Staufer, G. Broquet, F. Baron, L. Bregonzio-Rozier, P.R. Amaral, L. Nunes, S. Souza, L.R. Oliveira, V. Felix, L. Zanutto, F. Velay-
Lasry, M. Chiappero and P. Ciais
Thanks to the LSCE groups (RAMCES, ATC, SATINV and MOSAIC) for their support
Presenting author: F.R. Vogel

The future of urban emissions
The urban population will rise…
… but will the per capita emissions rise – stagnate – decrease?

2nd ICOS science conference, September 27th, 2016, Helsinki, Finland
Relevance of urban scale for GHGs
Cities are major sources of greenhouse gases (and pollutants)
Cities are active stakeholders and have ambitions reduction target and mitigation effort
Development of techniques within many projects and now also experience with routinely operated monitoring network and inversion

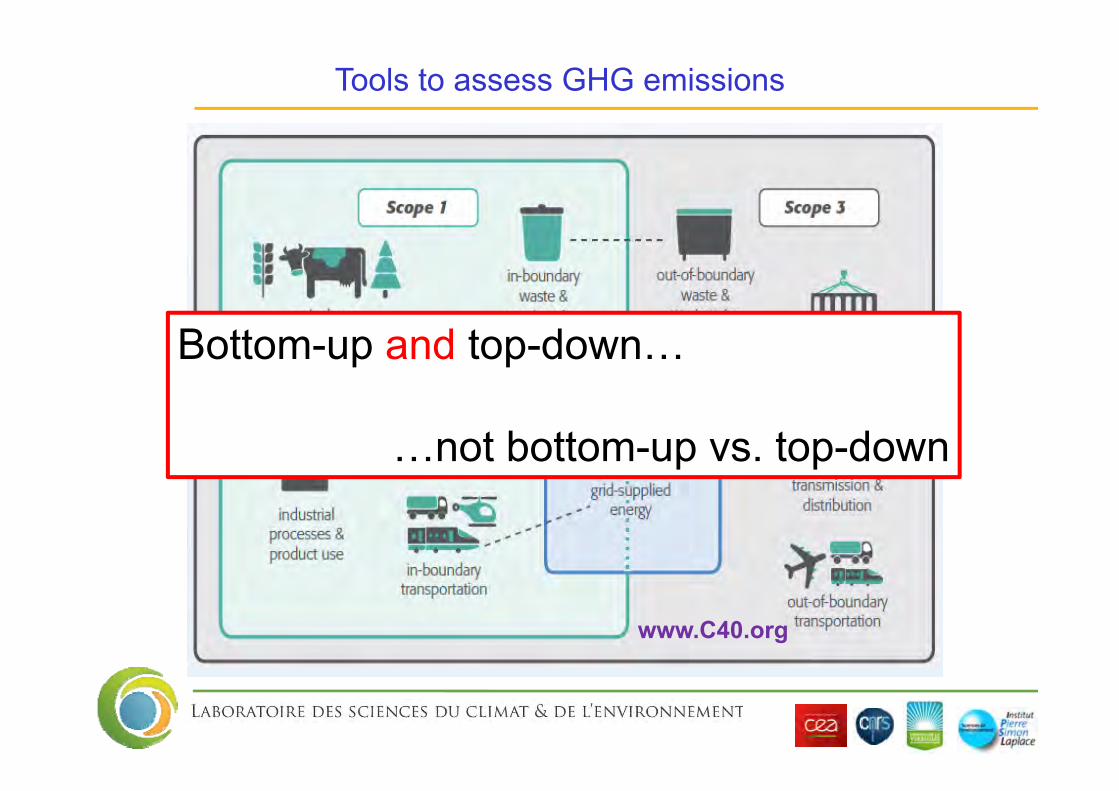
Tools to assess GHG emissions
www.C40.org
Tools to assess GHG emissions
www.C40.org
Bottom-up and top-down…
…not bottom-up vs. top-down

Inversion system simplified
Emission inventory/model Transport model Observation system

Paris, France
Recife, Brasil
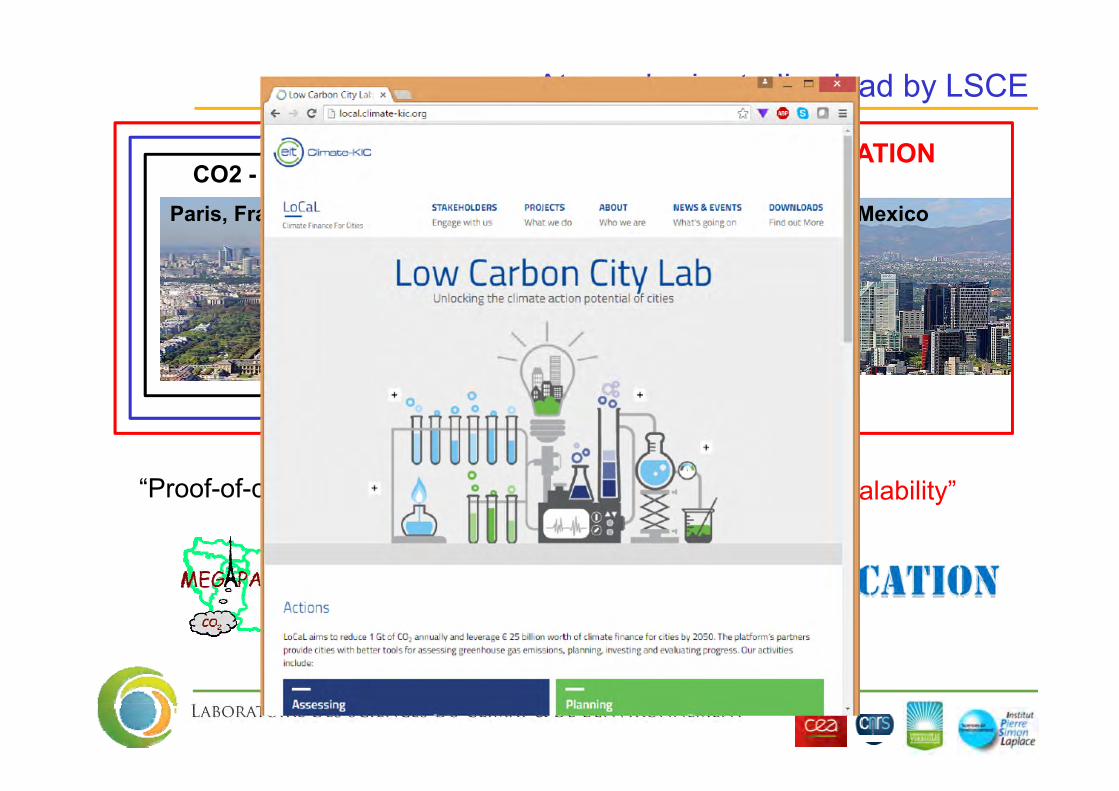
Atmospheric studies lead by LSCE
Mexico City, Mexico
CO2 - MEGAPARIS CarboCountCity LOCATION
“Proof-of-concept” “Demonstration” “Scalability”
Paris, France
Recife, Brasil
Atmospheric studies lead by LSCE
Mexico City, Mexico
CO2 - MEGAPARIS CarboCountCity LOCATION
“Proof-of-concept” “Demonstration” “Scalability”

Paris, France
Toronto, Canada
Recife, Brasil
Atmospheric studies lead by LSCE
Shenzhen, China
Mexico City, Mexico
Frankfurt, Germany
CO2 - MEGAPARIS CarboCountCity LOCATION
Key “hands-on” scientific collaborations (e.g. PhD students, SOFIE, LoCal)

2nd ICOS science conference, September 27th, 2016, Helsinki, Finland
Key figures:
Tropical city – 8o3’S, 24o54’W Inhabitants 1.6M (city), 3.8M (metro), 6th largest city in Brazil High density (7000-8000/km2) similar to Istanbul 1%/a growth since 1980 ca. –> 300k-400k/decade
RECIFE
Exporting CarboCountCity to South America

2nd ICOS science conference, September 27th, 2016, Helsinki, Finland
Emission inventories for cities - towards common techniques
Toronto, Canada, 0.02ox0.02o
Based on air quality inventoryCollaboration LSCE, ECCC,UoToronto
Existing inventories for ParisAIRPARIF, IER and TNOHere AIRPARIF 2km x 2km

2nd ICOS science conference, September 27th, 2016, Helsinki, Finland
Emission inventories for cities - towards common techniques
8.54%
0.37%1.72%
34.67%
1.04%2.30%0.20%
50.61%
0.54%
Emissions by fuel %LPG - Residential Sector
LPG - Industrial Sector
LPG - Commercial Sector
Fuel Oil - Industrial Sector
Diesel -Industrial/Agriculture Sector
Diesel -Commercial/InstitutionalSector
Sector Power Source tCO2 EmissionsResidential Natural Gas 3,151.97Residential Liquefied Petroleum Gas 131,810.54Commercial Natural Gas 8,391.53Commercial Liquefied Petroleum Gas 26,616.05Commercial Diesel 35,518.47Industrial Natural Gas 781,408.76Industrial Diesel 16,119.09Industrial Fuel Oil 535,354.37Industrial Liquefied Petroleum Gas 5,649.94

2nd ICOS science conference, September 27th, 2016, Helsinki, Finland
Industrial Consumption by Sector (2013 year)
Natural Gas Diesel Oil Fuel Oil LPG106
m3 %103
m3 %103
m3 %103
m3 %CEMENT 35 0.3% 80 5.9% 18 0.6% 0 0.0%PIG-IRON AND STEEL 1,159 10.5% 44 3.2% 42 1.5% 31 1.8%IRON-ALLOYS 25 0.2% 0 0.0% 64 2.3% 0 0.0%MINING/PELLETIZATION 720 6.5% 467 34.3% 212 7.6% 62 3.7%NON-FERROUS/OTHER METALLURGICAL 1,070 9.7% 0 0.0% 1,200 42.9% 72 4.3%
CHEMICAL 2,315 20.9% 27 2.0% 443 15.8% 31518.8%
FOODS ANDBEVERAGES 781 7.1% 306 22.5% 207 7.4% 305
18.2%
TEXTILES 355 3.2% 7 0.5% 48 1.7% 51 3.0%PAPER AND PULP 919 8.3% 161 11.8% 318 11.4% 98 5.8%
CERAMICS 1,538 13.9% 29 2.1% 130 4.6% 26715.9%
OTHERS 2,148 19.4% 240 17.6% 116 4.1% 47928.5%
TOTAL INDUSTRIAL11,06
5 100% 1,361 100% 2,798 100% 1,680 100%
Emission inventories for cities - towards common techniques
Industrial sources in the Recife area

2nd ICOS science conference, September 27th, 2016, Helsinki, Finland
Emission inventories for cities - towards common techniques
41.73%21.83%
3.40% 5.96%
Road Traffic - Emissions by fuel %
GasolineDiesel
EthanolNatural Vehicular Gas - NVG
Road map of Recife
Power Source tCO2 EmissionsGasoline 833.496,29Diesel 436.062,53Ethanol 67.977,76Natural Vehicular Gas 119.095,22

2nd ICOS science conference, September 27th, 2016, Helsinki, Finland
Emission inventories for cities - towards common techniques
Recife, Brazil,1km x 1km,based on IPCC and GPCCollaboration LSCE, ARIA tech.
5.52 MtCO2
Toronto, Canada, 0.02ox0.02o
Based on air quality inventoryCollaboration LSCE, UoToronto
Existing inventories for ParisAIRPARIF, IER and TNO

2nd ICOS science conference, September 27th, 2016, Helsinki, Finland
Emission inventories for cities - towards common techniques
Recife, Brazil,1km x 1km,based on IPCC and GPCCollaboration LSCE, ARIA tech.
5.52 MtCO2 +/- ???
Toronto, Canada, 0.02ox0.02o
Based on air quality inventoryCollaboration LSCE, UoToronto
Existing inventories for ParisAIRPARIF, IER and TNO
2nd ICOS science conference, September 27th, 2016, Helsinki, Finland
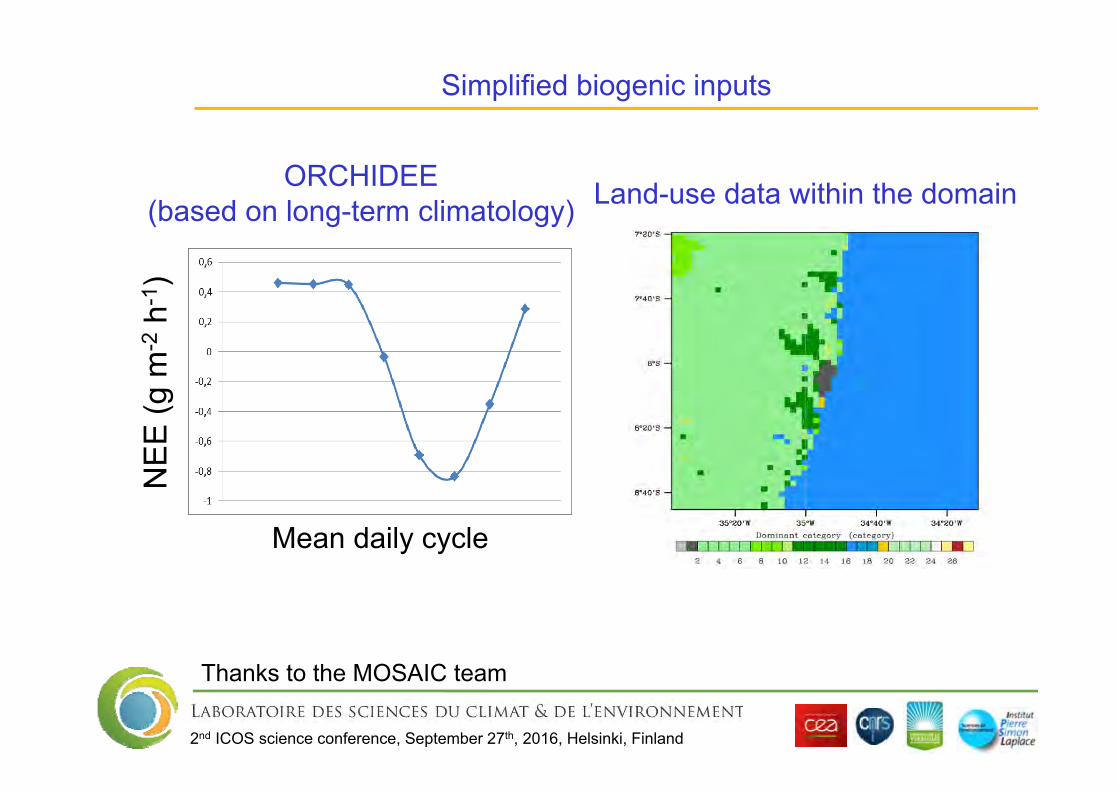
Simplified biogenic inputs
Land-use data within the domainORCHIDEE (based on long-term climatology)
Thanks to the MOSAIC team
NEE
(g m
-2h-
1 )
Mean daily cycle
2nd ICOS science conference, September 27th, 2016, Helsinki, Finland
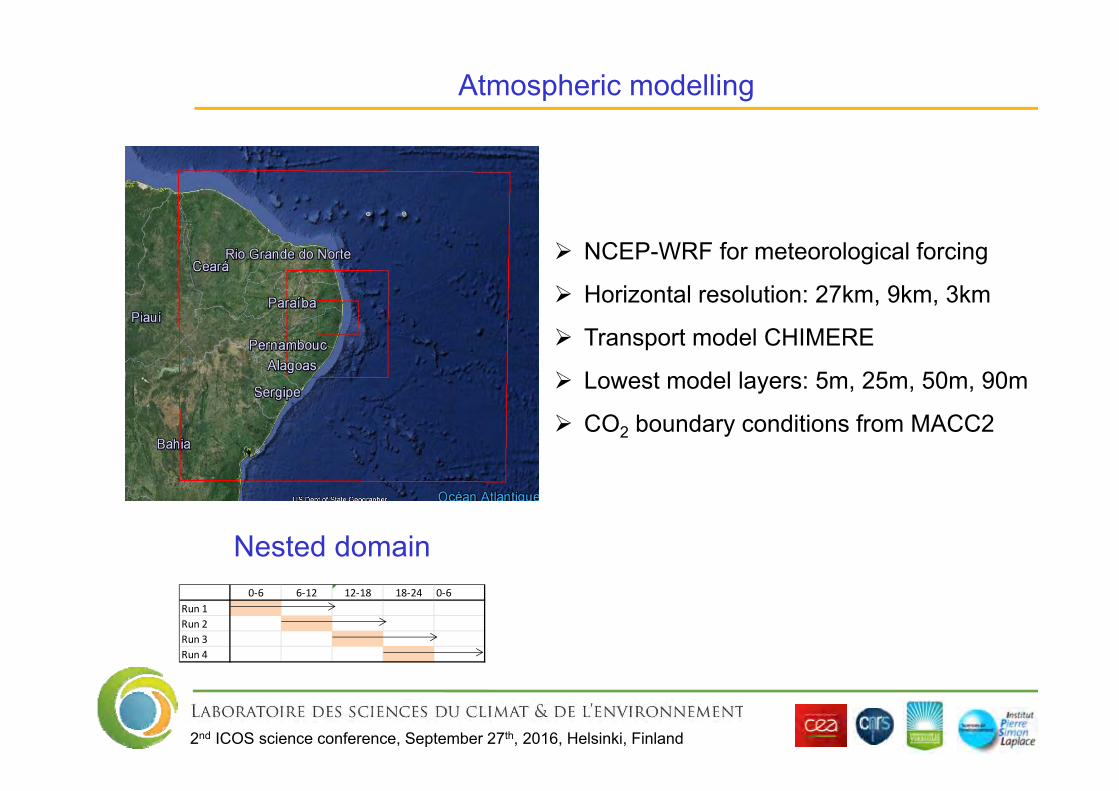
Nested domain0‐6 6‐12 12‐18 18‐24 0‐6
Run 1Run 2Run 3Run 4
Atmospheric modelling
NCEP-WRF for meteorological forcing
Horizontal resolution: 27km, 9km, 3km
Transport model CHIMERE
Lowest model layers: 5m, 25m, 50m, 90m
CO2 boundary conditions from MACC2

2nd ICOS science conference, September 27th, 2016, Helsinki, Finland
Atmospheric modelling

2nd ICOS science conference, September 27th, 2016, Helsinki, Finland
Wind roses as tool to design observational network

Recife urban monitoring program

Recife urban monitoring program

Recife urban monitoring program
23:00 01:00 03:00 05:00 07:00 09:00 11:00 13:00380
400
420
440
460
480
500
520
540
CO
2 (pp
m)
UTC (HH:mm)
LAFEPE site
Weekly calibrations using 3 reference gases (390ppm to 510ppm)
Daily target measurements
Performance CO2 repeatability better than 0.1ppm

Recife urban monitoring program

Recife urban monitoring program
Dona Lindu“Coastal station”
Combine information of wind direction and concentration to understand source regions!

Lafepe
Dona Lindu
CO2 CH4 CO
Recife urban monitoring program

Lafepe
Dona Lindu
CH4
Recife urban monitoring program
Mangrove park Recife
Large span for potential Mangrove emissions:
4mgCH4m-2d-1 – 82mgCH4m-2d-1
Sotomayor et al. Puerto Rico
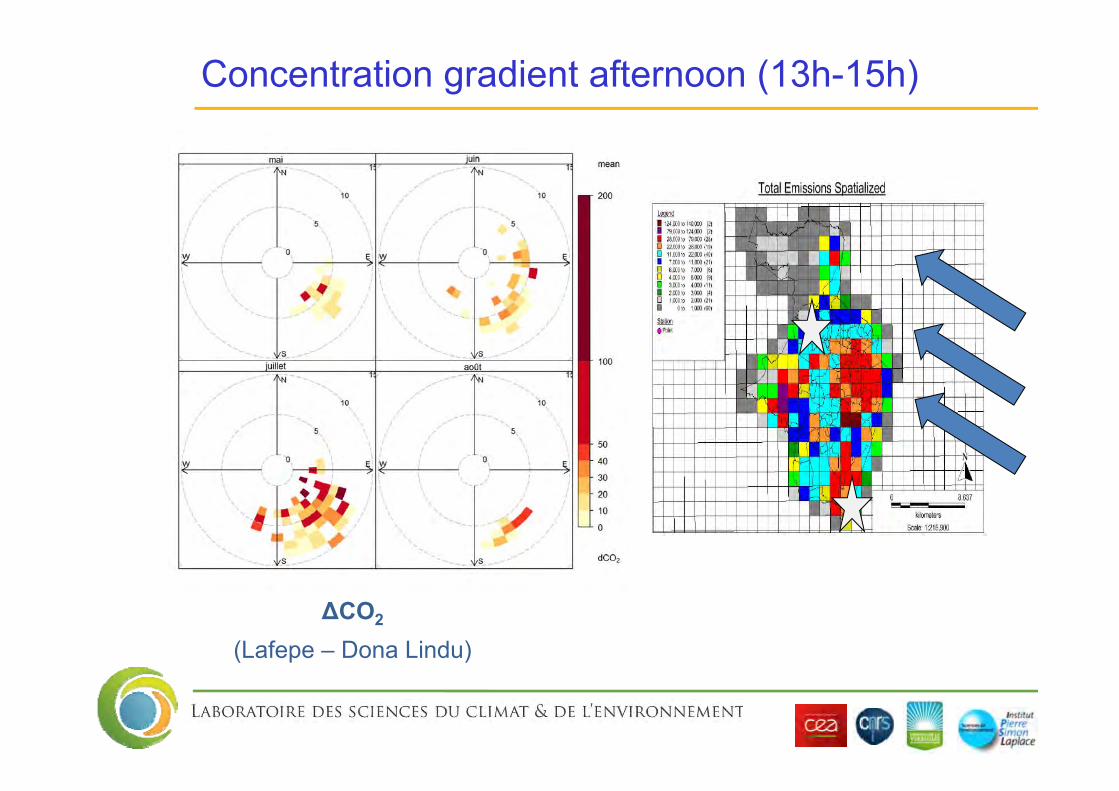
ΔCO2
(Lafepe – Dona Lindu)
Concentration gradient afternoon (13h-15h)

Inversion system simplified
Emission inventory/model Transport model Observation system

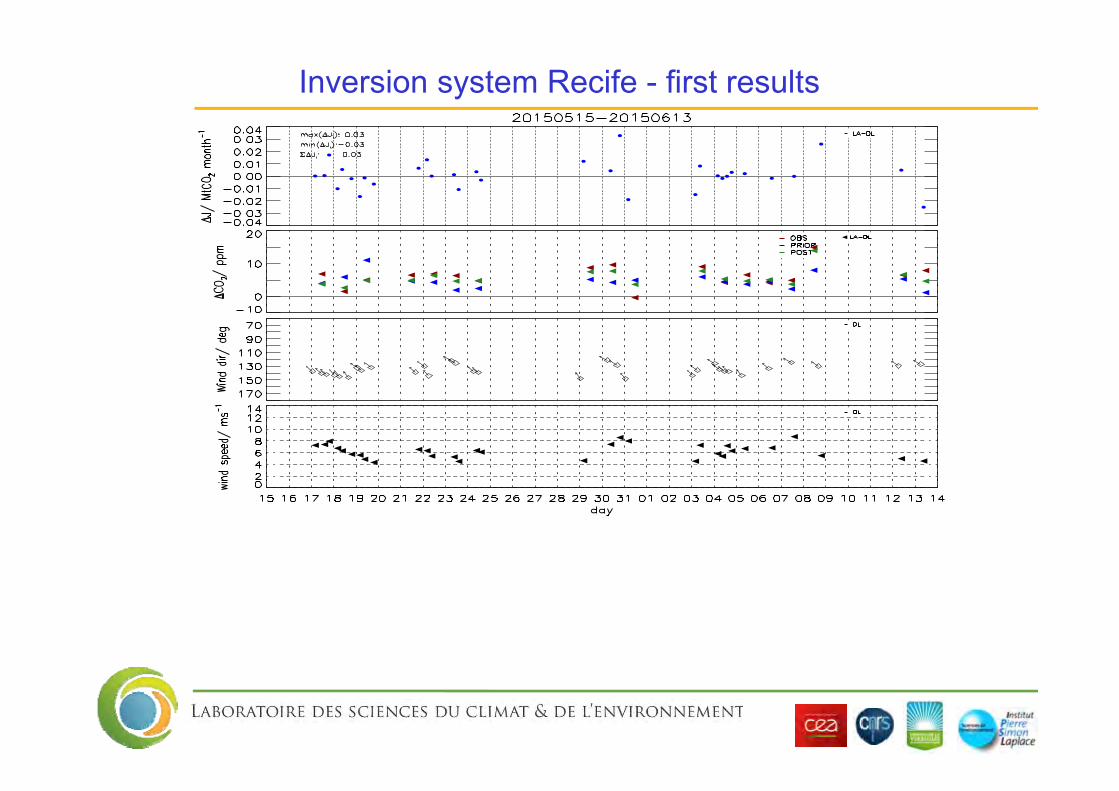
Inversion system Recife - first results
Definition of wind sectors and minimal wind speed
Data selected for the afternoon window
Identification of appropriate model level

Inversion system Recife - first results

Inversion system Recife - first results
No uncertainty reduction for biogenic CO2
No uncertainty reduction in the morning
Large uncertainty reduction during daytime
More balanced biosphere
More FFCO2 emissions
Inversion system Recife - first results

Inversion system Recife - first results
-0.4
-0.2
0.0
0.2
0.4
0.6
CO
2 flu
xes
(MtC
O2/m
onth
)
biogenic fossil fuel
Prioremissions
Referencesetup
RelaxedUncertainty (2x)

Inversion system Recife - first results
-0.4
-0.2
0.0
0.2
0.4
0.6
CO
2 flu
xes
(MtC
O2/m
onth
)
biogenic fossil fuel
Prioremissions
Referencesetup
RelaxedUncertainty (2x)
More sensitivity tests conducted for: intake height, assimilation time-window, correlation of fluxes, …

Summary
- Spatialized emission inventory constructed from statistical data
(cookbook to be released in 2016)
- Successfully installed network and trained local staff
- CO2 (and CO) concentrations in “expected” range and linked to sources
- Very high CH4 concentrations at both sites – Mangrove and canals
- Forward modelling completed (and automated)
- First inversion conducted and first results on fossil fuel CO2 emissions
and bio fluxes (more work planned for 2016)
- Project continuation within LOCATION and IG3IS core activities