tracking and visualizing student effort: evolution … · (2016). tracking and visualizing student...
TRANSCRIPT

(2016). Tracking and visualizing student effort: Evolution of a practical analytics tool for staff and student engagement . Journal of Learning
Analytics, 3(2), 165–193. http://dx.doi.org/10.18608/jla.2016.32.8
ISSN 1929-7750 (online). The Journal of Learning Analytics works under a Creative Commons License, Attribution - NonCommercial-NoDerivs 3.0 Unported (CC BY-NC-ND 3.0)
164
Tracking and Visualizing Student Effort: Evolution of a Practical
Analytics Tool for Staff and Student Engagement
Robin Nagy
Dean of Students, Redlands School Sydney, Australia
ABSTRACT: There is an urgent need for our educational system to shift assessment regimes from
a narrow, high-stakes focus on grades, to more holistic definitions that value the qualities that l ifelong learners will need. The challenge for learning analytics in this context is to deliver actionable assessments of these hard-to-quantify qualities, valued by both educators and learners. This practitioner report contributes to this by documenting the iterative refinement of a practical
approach for tracking student effort, deployed in successive versions over six years in secondary schools. This demonstrates how teachers can assess a student quality such as “effort” in a practical way, and the insights that visual analytics can provide as a basis for productive dialogue a mong staff and students. The engagement and professional development of teachers is critical to
embedding and sustaining novel analytics of this sort.
Keywords: Effort, mindset, resil ience, dispositional learning analytics , visualization, 21st century skil ls
1 INTRODUCTION: THE ACADEMIC OUTCOMES PARADOX
Every school’s goal includes delivering the best possible academic outcomes for their students; however,
a direct focus on academic achievement often falls short of delivering consistent improvement for all
students. Indeed, research studies have highlighted that “high-stakes” summative testing often has a
negative effect on student motivation for learning, and can widen the gap between higher and lower
achieving students (Harlen & Deakin Crick, 2003). One reason for this is the systemically induced increase
in student anxiety surrounding academic assessment, with a detrimental effect on performance in tests
and examinations for a proportion of students (McDonald, 2001), as well as a generally adverse effect on
student mental health and wellbeing. Another reason is that when a low-achieving student displays a
dramatic improvement in effort, there is rarely an immediate corollary of academic achievement in
assessments. This “lack of success” results in a de-motivational effect on students who have just invested
a great deal of effort without seeing their diligence reflected in systemic value (academic achievement).
Moreover, the short-term lack of causality between effort and achievement can compound students’
sense of fixed mindset and belief that they lack ability, and strengthen some students’ belief that diligence
has no effect on “smartness”; they “lose confidence in their own capacity to learn” (Black & Wiliam, 1998;
Harlen & Deakin Crick, 2003, p. 18).

(2016). Tracking and visualizing student effort: Evolution of a practical analytics tool for staff and student engagement . Journal of Learning
Analytics, 3(2), 165–193. http://dx.doi.org/10.18608/jla.2016.32.8
ISSN 1929-7750 (online). The Journal of Learning Analytics works under a Creative Commons License, Attribution - NonCommercial-NoDerivs 3.0 Unported (CC BY-NC-ND 3.0)
165
Driven by sociological expectation, schools tend to dwell on quantifying success in terms of academic
results alone. The result of this unidirectional focus on achievement is to undermine the development of
academic curiosity, persistence, and intellectual risk-taking, all of which are skills, identified in Costa and
Kallick’s (2009) Habits of Mind, necessary to be able to develop into independent lifelong learners and to
be able to tackle harder, more challenging problems. Moreover, Kellaghan, Madaus, and Raczek (1996)
conclude from their research that students motivated by high-stakes assessment are likely to have
performance rather than learning goals, and extrinsic rather than intrinsic motivation, leading them to
become “shallow” learners and develop superficial learning styles such as rote learning. When a school
does systemically report on effort, it is rarely more than a single five-point scale with little to no objectivity,
and there is usually a high correlation to students’ academic achievement due to the way in which
teachers are forced to report. For example, many schools traditionally report academic achievement on a
5-point scale from A (best) to E (worst) and effort on a similar scale from 1 (best) to 5 (worst) . It is easy
for a teacher to justify awarding a student A-1, B-2, C-3 and so on, but not so easy to justify say an E-1 due
to the inherent presumption that a student could have scored better in assessments with more effort.
Carol Dweck (2006) makes clear that focusing on praising intelligence and ability does not create success
and may in fact do the opposite.1 Other notable research on success by Angela Duckworth (Perkins-Gough,
2013) shows that “grit” (or persistence) is the single biggest indicator of success in the long term, much
more so than academic potential. Given the focus and reporting on academic results, it seems unsurprising
that schools have a tendency to foster those students who already have a growth mindset and self-
motivation, whereas those with a “fixed mindset” who lack this intrinsic perseverance are often convinced
that they are failures and lose all motivation to try (Dweck, 2006). This is summed up well by Schunk (1991)
who concludes, “learners who attribute success to effort, and who perceive ability to be changeable and
controllable are likely to deal with failure constructively, and to persevere with the learning task …
whereas learners who attribute failure to ability, which they perceive as stable and uncontrollable, are
likely to respond negatively to summative assessment.” The moderating influence on this concerning
picture is good teachers, who instinctively know the importance of building confidence and encouraging
effort and perseverance, but often they are not always helped systemically by school structures. It could
be argued that much of the value-added effect they have on “less able” students is in spite of, rather than
because of, school-wide systems.
The problem, concisely, is a paradox; rewarding academic success does not necessarily motivate all
students to achieve academic success. To use Andrew Martin’s (2010) terminology, this system benefits
those students who have an innate “academic buoyancy.” In order to create an environment where every
student maximizes their potential, schools need to shift the “success-focus” away from achievement
1 Recently, Dweck has also cri ticized the misinterpretation of her work, which has led to s tudents being offered empty praise for
“just trying” without a tangible l ink to developing the underlying competencies for learning. Dweck uses the analogy of the bra in as a muscle, which can be s trengthened and developed through appropriate academic exercise and persistence. Reporting that s imply praises effort falls short of developing a growth mindset unless it specifically tracks and highlights student progres s and improvement over time.

(2016). Tracking and visualizing student effort: Evolution of a practical analytics tool for staff and student engagement . Journal of Learning
Analytics, 3(2), 165–193. http://dx.doi.org/10.18608/jla.2016.32.8
ISSN 1929-7750 (online). The Journal of Learning Analytics works under a Creative Commons License, Attribution - NonCommercial-NoDerivs 3.0 Unported (CC BY-NC-ND 3.0)
166
alone, onto more nurturing and motivational indicators such as effort and incremental achievement.
Indeed, the Hobsons report into student feedback and progressive reporting showed that Australian
parents supported this notion, stating
Parents prefer reporting based on their child’s progression rather than measurement against a
benchmark (despite popular belief). This reflects the need for progressive reporting. (Hobsons,
2014, p. 6)
The report finds that parents are primarily interested in hearing about the development and progression
of their child before hearing about how they compare to others. Although rankings are viewed as
important, it is not parents’ principal concern. This concurs with my own anecdotal experience that most
parents’ overriding wish is that their child is trying as hard as they can, and this would seem to be not only
an instinctive approach to success, but also one backed up by Duckworth’s sound academic research
(Perkins-Gough, 2013).
We can learn much from techniques used by sportsmen and -women to improve performance. Sports
psychologists have long known that a direct performance focus often has a paradoxical eff ect on
achievement and that in order to improve performance, it is better to employ an indirect focus that often
concentrates on process rather than outcome. For instance, Jackson (2014) states, “…explicit monitoring
of motor skills has been shown to have a detrimental effect on skilled performers.” Smith and Kays (2010)
advise, “If you focus on outcomes (things you have no control over), you’re creating unnecessary anxiety.
Focus on the process and you increase the likelihood of positive results happening.”
In education, a focus on student effort rather than achievement is analogous to this indirect focus on
process rather than outcome. It ensures that the systemic value is placed on the underlying characteristics
of a successful student rather than the outcomes themselves. Indeed, there is plenty of evidence to
suggest that a focus on summative testing as an outcome-based reward system has a detrimental effect
on motivation for learning and inhibits the practice of formative assessment (Black & Wiliam, 1998 cited
in Harlen & Deakin Crick, 2003 p. 170). Once students feel that their diligence and attitude are being
recognized and rewarded in their own right, their anxiety surrounding examinations is reduced, and the
school “success-focus” implicitly encourages a “growth mindset” mentality in its students. Without an
explicit school-wide emphasis on process, students deduce that although effort may be encouraged, it is
achievement that counts; assessments intended as formative are nevertheless interpreted by students as
purely summative in purpose (Pollard, Triggs, Broadfoot, McNess, & Osborn, 2000).
The research by Dweck and Duckworth has already been acknowledged as the rationale for focusing on
effort. In the context of Learning Analytics, the approach described next is a form of Dispositional Learning
Analytic (Buckingham Shum & Deakin Crick, 2012; Deakin Crick, Huang, Ahmed-Shafi, & Goldspink, 2015),
but using teacher observation rather than student self-report as in their work. Such analytics are designed
explicitly to provoke change in students, by providing staff with deeper insight into a student’s progress,
leading to more effective coaching conversations around the visual analytic. In the context of design-

(2016). Tracking and visualizing student effort: Evolution of a practical analytics tool for staff and student engagement . Journal of Learning
Analytics, 3(2), 165–193. http://dx.doi.org/10.18608/jla.2016.32.8
ISSN 1929-7750 (online). The Journal of Learning Analytics works under a Creative Commons License, Attribution - NonCommercial-NoDerivs 3.0 Unported (CC BY-NC-ND 3.0)
167
based educational research, this approach is an example of an Improvement Science methodology (Bryk,
2015) in which the emphasis is on targeting an issue identified as a key driver for success, using analytics
to track variables as thoroughly grounded in research as possible, but equally important, rendered in a
practical form — for use by practitioners (not researchers) in authentic contexts (not artificial settings). 2
The case study context for this work is now introduced, before a documentation of the iterations leading
to the effort-tracking tool.
2 CASE STUDY 1: CRANBROOK SCHOOL, SYDNEY
Students’ academic effort is celebrated at Cranbrook through a termly “Headmaster’s List of Outstanding
Academic Attitude,” which specifically recognizes attitude and effort in class rather than achievement.
Originally this was based on students’ termly effort grades (1 to 5 scale) reported by teachers in each
subject, with the top 10% or so students in the school being included on the list, leading to House points
and privileges for senior students. The idea behind this system is that it runs alongside the annual
academic prizes but includes many hard-working students who may not be top achievers and would
otherwise go unrecognized, Cranbrook school being non-selective academically.
While at Cranbrook, the author developed a quantitative measure of student effort and conducted school-
wide “effort-tracking” over a period of five years. This was based on the aggregated “effort score” for
each student, calculated by averaging and scaling their effort grades across all subjects. At the start of a
new term, students received individual feedback via their pastoral tutor on their current effort percentile
within the year-group and within the whole school, as well as the breakdown of their effort score over
their academic subjects and whether or not there was an improvement or decline since the previous term.
It also highlighted if this was the student’s Personal Best effort score to date.
As well as identifying students on the “Headmaster’s List of Outstanding Academic Attitude,” the effort
tracking program also highlighted students at the bottom of the effort-range, as well as those who had
shown notable improvement or dramatic decline in effort over the past reporting period. This allowed
pastoral carers to have focused conversations with all students, which sometimes exposed other factors
affecting student motivation, such as family issues and other external influences. Nevertheless, there was
initially a high correlation between academic achievement and effort scores due to the way in which effort
was graded. Over time, the system for measuring effort became better defined, with two attitude
indicators recorded by academic subjects for each student, every term — one based on diligence and the
other on behaviour. This produced a better measure of effort and a weaker correlation with academic
achievement.
2 For the practitioner–researcher development program around this approach, see the Carnegie Foundation for the Advancement of Teaching: http://www.carnegiefoundation.org
(2016). Tracking and visualizing student effort: Evolution of a practical analytics tool for staff and student engagement . Journal of Learning
Analytics, 3(2), 165–193. http://dx.doi.org/10.18608/jla.2016.32.8
ISSN 1929-7750 (online). The Journal of Learning Analytics works under a Creative Commons License, Attribution - NonCommercial-NoDerivs 3.0 Unported (CC BY-NC-ND 3.0)
168
This was progress, but the attitude grades were limited in their scope and subjective in their distribution.
Clearly, there are difficulties in quantifying student effort consistently across all teachers and subjects.
One can be more confident in teachers’ grading across semesters within particular cohorts. Assuming
teachers are consistent in their own reporting, then “relative effort” for a given cohort is meaningful and
valid. A next step would be a consistent and accurate method to gauge and quantify student effort and
attitude on a whole (secondary) school basis. This is particularly important for tracking student effort on
a term-by-term basis over several years, as well as providing visibility to parents that students with
outstanding effort be accurately identified.
3 CASE STUDY 2: REDLANDS SCHOOL
At Redlands School, the author wanted to design such a system: capable of student tracking, incorporating
reliable effort indicators in all subjects and quick and easy for teachers to grade, whilst being as consistent
and objective as possible across all students and all subjects.
3.1 Prototype 1: Effort Criteria, Grading Interface and Output
The initial year-long effort tracking pilot originally had four criteria (below), each of which had a 5-point
scale (1 to 5 respectively for Unsatisfactory, Fair, Good, Very Good, and Outstanding) with the weighting
deliberately skewed to quantify four levels of “satisfactory” rather than defining levels of “unsatisfactory”:
Attitude and Behaviour
Diligence and Application
Engagement and Focus Persistence and Determination
Using four separate criteria and averaging effort scores across subjects ensured additional safeguards
against any individual anomalies in reporting and encouraged a better spread of data (particularly with a
5-point scale). To ensure as much consistency and objectivity as possible, the teacher grading was via four
separate input screens, one for each criterion, with the whole class graded on each screen using quick and
easy to use radio button selection as illustrated in Figure 1. This forced teachers to apply each criterion to
each student in turn, ensuring a better relative grading and consistency withi n the class. Anecdotal
evidence suggests that systems that force teachers to report on a single student at a time using different
subjective measures tend to elicit a high correlation between these grades. This is borne out by my
analysis of the original Redlands “Attitude to Learning” grades, which had a much greater correlation
between effort and achievement (0.84) than the results of the effort-tracking pilot (0.62), partly because
both attitude and achievement were recorded on the same screen for a single student. This was also true
of the Cranbrook system.

(2016). Tracking and visualizing student effort: Evolution of a practical analytics tool for staff and student engagement . Journal of Learning
Analytics, 3(2), 165–193. http://dx.doi.org/10.18608/jla.2016.32.8
ISSN 1929-7750 (online). The Journal of Learning Analytics works under a Creative Commons License, Attribution - NonCommercial-NoDerivs 3.0 Unported (CC BY-NC-ND 3.0)
169
Figure 1: Teacher input screen for effort grading on a given criterion (Engagement). Grading all
students on a single criterion at a time encourages the teacher to ensure relative consistency between
students.
Once all students had been graded, their effort scores for each subject (from 4 to 20) would be aggregated
over all subjects, including pastoral care period, and averaged over the total number of subjects. This
overall average “Effort Score” would then be used as the basis for ranking and tracking students’ effort as
well as for obtaining students’ effort percentiles within their year-group and within the whole secondary
school.
Initial teacher consultation led to the creation of an extensive rubric for each criterion, with twenty
separate descriptors, one for every grade in each criteria (see Figure 2). The criteria headings were also
condensed to single word descriptors to simplify their interpretation:
Behaviour
Diligence
Engagement Persistence
The output from this process was collated into Figures 3a and 3b, displaying students’ individual effort
grades across their subjects as well as groups of students’ overall average effort grades.

(2016). Tracking and visualizing student effort: Evolution of a practical analytics tool for staff and student engagement. Journal of Learning Analytics, 3(2), 165–193. http://dx.doi.org/10.18608/jla.2016.32.8
ISSN 1929-7750 (online). The Journal of Learning Analytics works under a Creative Commons License, Attribution - NonCommercial-NoDerivs 3.0 Unported (CC BY-NC-ND 3.0)
170
Effort Tracking Pilot – Criteria Rubric
Behaviour- Appropriate conduct and positive attitude that is conducive to learning, both for self and peers
Diligence- Due care and rigour applied in all learning situations and appropriate completion of set work
Engagement- The focus and active participation demonstrated by a student to maximise their learning potential.
Persistence- The resilience, motivation and determination demonstrated by a student leading them to take pride in, and responsibility for, their learning.
5 Outstanding 4 Very Good 3 Good 2 Fa i r 1 Unsatisfactory
Behaviour Always conducts themselves
appropriately in class, which h elps maximise productivity and supports
a safe and engaging learning environment for others.
Avoids distraction Is sensitive to th e vi ews o f
peers and responds accordingly
Engages with te achers an d peers in a respectful and cons iderate manner
Never wi lfully d is rupts th e learning of others
Displays a positive a tti tu de to learning at all times.
Regularly s trives to conduct themselves in an appropriate manner.
Regularly avoids dis traction
Is regularly sens i tive to the views of peers and responds accordingly
Engages on a regular bas is with teachers a nd
peers in a respectful a nd cons iderate manner
Rarely dis rupts the learning of others
Displays a pos i tive atti tude to learning
Mostly s trives to conduct themselve s in an appropriate manner.
Mostly avoids dis traction
Is mostly sens i tive to the views of peers an d responds accordingly
Mostly engages with teachers and peers in a
respectful and cons iderate manner
Sometimes disrupts the learning of others
Usual ly displays a pos i tive atti tude to
learning
Occas ional ly s trives to conduct themselves in an appropriate manner.
Occas ional ly avoids dis traction
Is occasionally s ens i tive to the views of peers and responds accordingly
Occas ionally e n gages w ith teachers and peers in a
respectful and co ns iderate manner
Regularly dis rupts the learning of others
Sometimes displays a pos itive attitude to learning
Rarely s trives to conduct themselves in an appropriate manner.
Rarely avoids distraction Is seldom sens i tive to the
views of peers and respon ds accordingly
Rarely engages with teachers
and peers in a respectful and cons iderate manner
Constantly dis rupts the learning of others
Seldom displays a p os i tive atti tude to learning.
Di l igence Is extremely conscientious and cons istently puts much effo rt an d
care into both class and homework. Concerted effort i s appl ied in
every s i tuation Shows a genuine commitment to
independent learning, w ith th e creation of a s tudy plan tha t supports their learning.
Appl ication in class supports their understanding and
maximises their learning outcomes.
Regularly shows that effort and care i s put into both cl ass an d
homework. Effort i s applied regularly i n
s i tuations Regularly shows a
commitment to independent learning that supports th eir learning.
Regular application in class supports their learning
outcomes.
Mostly shows that effort and care i s put into both class and
homework. Effort i s usually a ppl ied i n
s i tuations
On most occas ions they
show a commitment to
independent learning th at
supports their learning.
Appl ication in class usu ally
supports their learning
outcomes.
Occas ionally shows that ef fort and care is put into both cl ass
and homework. Effort i s not always applied in
s i tuations Commitment to independent
learning is sporadic
Occas ional ly appl ies themselves in class
Rarely shows that effort and care i s put into both class and
homework. Effort i s rarely appl ied in
s i tuations Commitment to independ ent
learning is seldom present
Rarely applies th emselves in class
Figure 2 (part 1): Initial effort criteria rubric.

(2016). Tracking and visualizing student effort: Evolution of a practical analytics tool for staff and student engagement. Journal of Learning Analytics, 3(2), 165–193. http://dx.doi.org/10.18608/jla.2016.32.8
ISSN 1929-7750 (online). The Journal of Learning Analytics works under a Creative Commons License, Attribution - NonCommercial-NoDerivs 3.0 Unported (CC BY-NC-ND 3.0)
171
5 Outstanding 4 Very Good 3 Good 2 Fair 1 Unsatisfactory
Engagement Always proactively strives for a high level of
personal focus and involvement in class. This
may include some or all of the following:
Appropriately participates in class discussions and asks questions.
Actively listens to instruction and follows all directions in class.
Instigates class discussion and listens and responds to the views of
others. Takes detailed and effective notes,
completes thorough research and works collaboratively to use class
time most effectively.
Works independently and collaboratively to maximise
potential and is always on task.
Regularly strives for
personal focus and
involvement in class.
Participates in class discussions and asks
questions. Regularly listens to
instructions. Is involved in class
discussions Takes very good notes.
Regularly works independently and collaboratively and is generally on task.
Mostly strives for personal
focus and involvement in
class.
Sometimes participates in class
and asks questions Mostly listens to
instructions and is involved in class
discussions
Takes good notes.
Mostly works independently and
collaboratively and is
usually on task.
Occasionally strives for
personal focus and
involvement in class.
Occasionally participates in class and asks
questions Sometimes listens to
instructions and is involved in class
discussions
Takes notes when instructed.
Works when directed but easily drifts off task.
Rarely strives for personal
focus and involvement in
class.
Rarely participates unless directly asked
to Is a passive learner
Does not demonstrate good listening skills
Does not take adequate notes.
Appears to take little pride or interest in class.
Is often off task.
Persistence Always demonstrates the necessary
perseverance in order to develop deep
interest and creativity in their learning both in
and out of school.
Takes a great deal of pride in their work.
Takes calculated risks to advance
learning and thinks laterally. Shows responsibility for own actions
and accompanying consequences.
Always demonstrates determination and resilience.
Reacts well to criticism and sees mistakes as opportunities to learn.
Sees difficulties as challenges to be overcome rather than obstacles.
Is always self-motivated and works independently.
Regularly demonstrates the
necessary perseverance in
order to develop interest
and creativity in their
learning both in and out of
school.
Takes pride in their work.
Often takes risks and thinks laterally.
Demonstrates determination and
resilience. Overcomes challenges.
Regularly works independently
Mostly demonstrates the
necessary perseverance in
order to develop interest
and some creativity in their
learning both in and out of
school.
Takes some pride in their work.
Takes some risks and thinks laterally.
Sometimes demonstrates
determination and resilience.
Sometimes overcomes challenges
Mostly works independently
Occasionally demonstrates
perseverance in order to
develop some interest in their
learning both in and out of
school.
Takes occasional pride in their work.
Occasionally overcomes challenges and shows
determination.
Sometimes works independently.
Rarely demonstrates
perseverance in order to
develop interest in their
learning both in and out of
school.
Takes no pride in their work.
Gives up easily. Does not demonstrate
independent work habits.
Needs constant directions.
Figure 2 (part 2): Initial effort criteria rubric.

(2016). Tracking and visualizing student effort: Evolution of a practical analytics tool for staff and student engagement . Journal of Learning
Analytics, 3(2), 165–193. http://dx.doi.org/10.18608/jla.2016.32.8
ISSN 1929-7750 (online). The Journal of Learning Analytics works under a Creative Commons License, Attribution - NonCommercial-NoDerivs 3.0 Unported (CC BY-NC-ND 3.0)
172
Figure 3a: Initial effort tracking output (single student).
Figure 3b: Initial effort tracking output (tutor group summary).
Following the first term of effort grading, all teachers were consulted via a survey and through direct
discussions to determine their reactions to the initial process and structure of the effort-tracking pilot.
There was widespread positive reaction for the ease of data entry via the radio-button screens and
the efficiency and speed of the reporting input. Some of the critical feedback included reducing the
number of effort criteria, developing departmental interpretations of the effort rubric, and simplifying
the size and extent of the rubric. It was envisaged that with further refinement, pastoral tutors would
be able to conduct beginning of term conversations with each student in their tutor group, based on
the effort data from the previous term.
Applying correlation analysis between each pair of criteria, the correlation coefficients ranged
between 0.65 and 0.77 (see Table 1) affirming a predictable positive correlation between each pair
(2016). Tracking and visualizing student effort: Evolution of a practical analytics tool for staff and student engagement . Journal of Learning
Analytics, 3(2), 165–193. http://dx.doi.org/10.18608/jla.2016.32.8
ISSN 1929-7750 (online). The Journal of Learning Analytics works under a Creative Commons License, Attribution - NonCommercial-NoDerivs 3.0 Unported (CC BY-NC-ND 3.0)
173
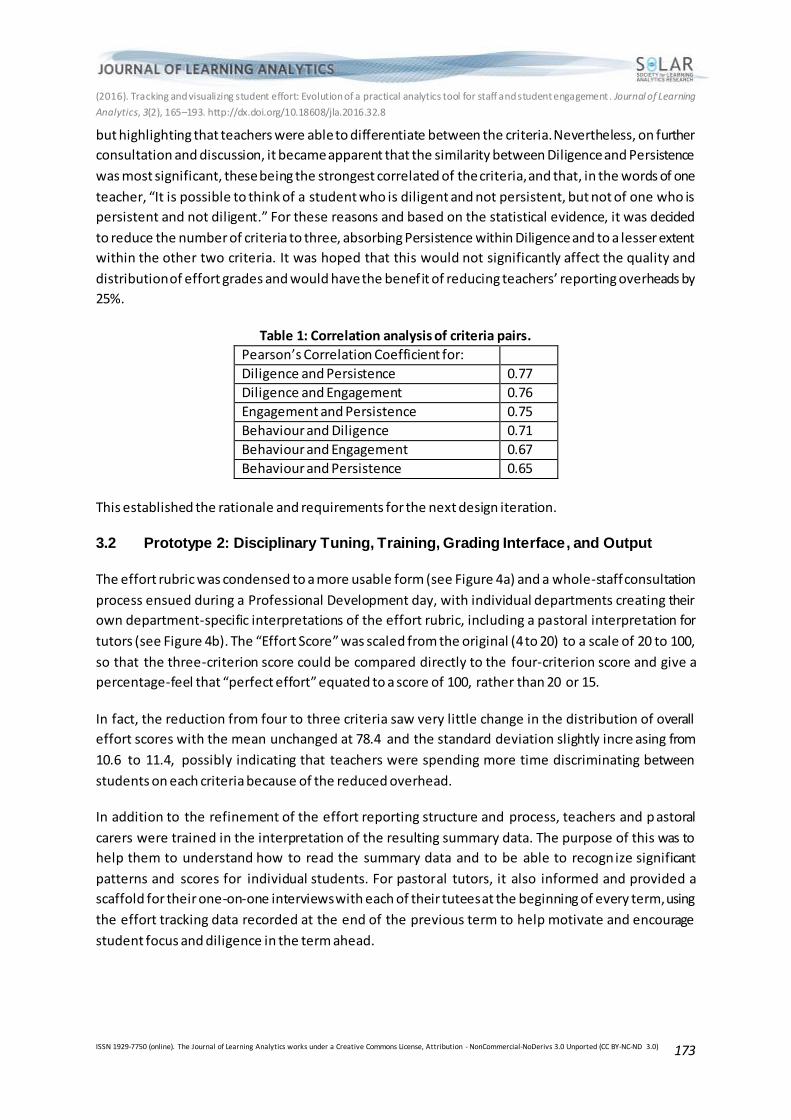
but highlighting that teachers were able to differentiate between the criteria. Nevertheless, on further
consultation and discussion, it became apparent that the similarity between Diligence and Persistence
was most significant, these being the strongest correlated of the criteria, and that, in the words of one
teacher, “It is possible to think of a student who is diligent and not persistent, but not of one who is
persistent and not diligent.” For these reasons and based on the statistical evidence, it was decided
to reduce the number of criteria to three, absorbing Persistence within Diligence and to a lesser extent
within the other two criteria. It was hoped that this would not significantly affect the quality and
distribution of effort grades and would have the benef it of reducing teachers’ reporting overheads by
25%.
Table 1: Correlation analysis of criteria pairs.
Pearson’s Correlation Coefficient for: Diligence and Persistence 0.77
Diligence and Engagement 0.76
Engagement and Persistence 0.75
Behaviour and Diligence 0.71
Behaviour and Engagement 0.67
Behaviour and Persistence 0.65
This established the rationale and requirements for the next design iteration.
3.2 Prototype 2: Disciplinary Tuning, Training, Grading Interface, and Output
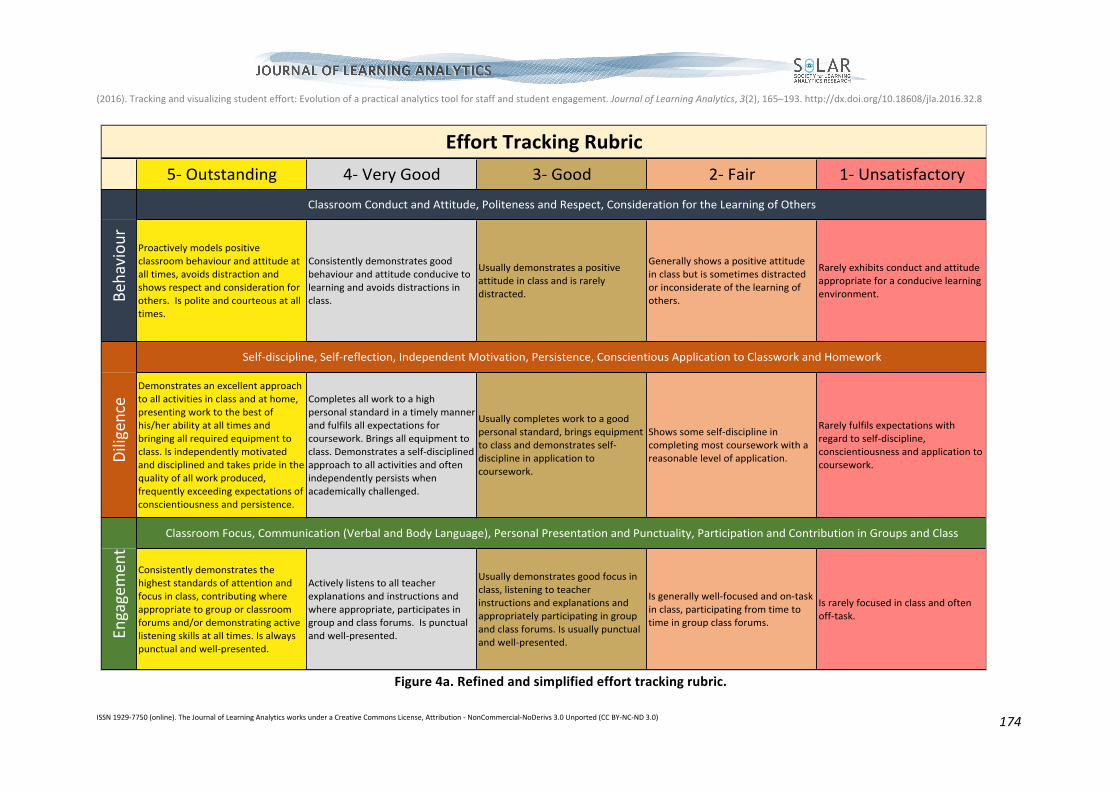
The effort rubric was condensed to a more usable form (see Figure 4a) and a whole-staff consultation
process ensued during a Professional Development day, with individual departments creating their
own department-specific interpretations of the effort rubric, including a pastoral interpretation for
tutors (see Figure 4b). The “Effort Score” was scaled from the original (4 to 20) to a scale of 20 to 100,
so that the three-criterion score could be compared directly to the four-criterion score and give a
percentage-feel that “perfect effort” equated to a score of 100, rather than 20 or 15.
In fact, the reduction from four to three criteria saw very little change in the distribution of overall
effort scores with the mean unchanged at 78.4 and the standard deviation slightly incre asing from
10.6 to 11.4, possibly indicating that teachers were spending more time discriminating between
students on each criteria because of the reduced overhead.
In addition to the refinement of the effort reporting structure and process, teachers and p astoral
carers were trained in the interpretation of the resulting summary data. The purpose of this was to
help them to understand how to read the summary data and to be able to recognize significant
patterns and scores for individual students. For pastoral tutors, it also informed and provided a
scaffold for their one-on-one interviews with each of their tutees at the beginning of every term, using
the effort tracking data recorded at the end of the previous term to help motivate and encourage
student focus and diligence in the term ahead.
(2016).Trackingandvisualizingstudenteffort:Evolutionofapracticalanalyticstoolforstaffandstudentengagement.JournalofLearningAnalytics,3(2),165–193.http://dx.doi.org/10.18608/jla.2016.32.8
ISSN1929-7750(online).TheJournalofLearningAnalyticsworksunderaCreativeCommonsLicense,Attribution-NonCommercial-NoDerivs3.0Unported(CCBY-NC-ND3.0)
174
Figure4a.Refinedandsimplifiedefforttrackingrubric.
5"#Outstanding 4"#Very#Good 3"#Good 2"#Fair 1"#Unsatisfactory
Proactively#models#positive#classroom#behaviour#and#attitude#at#all#times,#avoids#distraction#and#shows#respect#and#consideration#for#others.##Is#polite#and#courteous#at#all#times.
Consistently#demonstrates#good#behaviour#and#attitude#conducive#to#learning#and#avoids#distractions#in#class.
Usually#demonstrates#a#positive#attitude#in#class#and#is#rarely#distracted.
Generally#shows#a#positive#attitude#in#class#but#is#sometimes#distracted#or#inconsiderate#of#the#learning#of#others.
Rarely#exhibits#conduct#and#attitude#appropriate#for#a#conducive#learning#environment.
Demonstrates#an#excellent#approach#to#all#activities#in#class#and#at#home,#presenting#work#to#the#best#of#his/her#ability#at#all#times#and#bringing#all#required#equipment#to#class.#Is#independently#motivated#and#disciplined#and#takes#pride#in#the#quality#of#all#work#produced,#frequently#exceeding#expectations#of#conscientiousness#and#persistence.
Completes#all#work#to#a#high#personal#standard#in#a#timely#manner#and#fulfils#all#expectations#for#coursework.#Brings#all#equipment#to#class.#Demonstrates#a#self"disciplined#approach#to#all#activities#and#often#independently#persists#when#academically#challenged.
Usually#completes#work#to#a#good#personal#standard,#brings#equipment#to#class#and#demonstrates#self"discipline#in#application#to#coursework.
Shows#some#self"discipline#in#completing#most#coursework#with#a#reasonable#level#of#application.
Rarely#fulfils#expectations#with#regard#to#self"discipline,#conscientiousness#and#application#to#coursework.
Consistently#demonstrates#the#highest#standards#of#attention#and#focus#in#class,#contributing#where#appropriate#to#group#or#classroom#forums#and/or#demonstrating#active#listening#skills#at#all#times.#Is#always#punctual#and#well"presented.
Actively#listens#to#all#teacher#explanations#and#instructions#and#where#appropriate,#participates#in#group#and#class#forums.##Is#punctual#and#well"presented.
Usually#demonstrates#good#focus#in#class,#listening#to#teacher#instructions#and#explanations#and#appropriately#participating#in#group#and#class#forums.#Is#usually#punctual#and#well"presented.
Is#generally#well"focused#and#on"task#in#class,#participating#from#time#to#time#in#group#class#forums.
Is#rarely#focused#in#class#and#often#off"task.
Effort&Tracking&RubricBe
haviou
rDiligence
Engagemen
t
Classroom#Conduct#and#Attitude,#Politeness#and#Respect,#Consideration#for#the#Learning#of#Others
Self"discipline,#Self"reflection,#Independent#Motivation,#Persistence,#Conscientious#Application#to#Classwork#and#Homework
Classroom#Focus,#Communication#(Verbal#and#Body#Language),#Personal#Presentation#and#Punctuality,#Participation#and#Contribution#in#Groups#and#Class

(2016).Trackingandvisualizingstudenteffort:Evolutionofapracticalanalyticstoolforstaffandstudentengagement.JournalofLearningAnalytics,3(2),165–193.http://dx.doi.org/10.18608/jla.2016.32.8
ISSN1929-7750(online).TheJournalofLearningAnalyticsworksunderaCreativeCommonsLicense,Attribution-NonCommercial-NoDerivs3.0Unported(CCBY-NC-ND3.0)
175
Figure4b.Pastoralinterpretationofefforttrackingrubric.!
Effort&Tracking&Rubric&–&Pastoral&Interpretation&
&& 59&Outstanding& 49&Very&Good& 39&Good& 29&Fair& 19&Unsatisfactory&
Behaviour&
Always&maintains&an&excellent&
standard&of:&&
• Punctuality&
• Appearance&
• Respect&for&peers&and&
staff&
• Initiative&to&assist&peers&
and&staff&
Always&maintains&an&excellent&
standard&of:&&
• Punctuality&
• Appearance&
• Respect&for&peers&and&
staff&
Usually&maintains&a&high&standard&of:&&
• &Punctuality&
• Appearance&
• Respect&for&peers&and&staff&
Generally&maintains&an&
acceptable&standard&of:&&
• Punctuality&
• Appearance&
• Respect&for&peers&
and&staff&
Does¬&maintain&an&acceptable&standard&of:&&
• Punctuality&
• Appearance&
• Respect&for&peers&and&staff&
Diligence&
Without&teacher&reminders,&always&
maintains&an&excellent&standard&of:&&
• Organisation&
• Usage&of&Diary&and&
Locker&
• Planning&and&Goal9
Setting&
Always&maintains&an&excellent&
standard&of:&&
• Organisation&
• Usage&of&Diary&and&
Locker&
Usually&maintains&a&high&standard&of:&&
• &Organisation&
• Usage&of&Diary&and&Locker&
Generally&maintains&an&
acceptable&standard&of:&&
• Organisation&
• Usage&of&Diary&
and&Locker&
Does¬&maintain&an&acceptable&standard&of:&&
• Organisation&
• Usage&of&Diary&and&Locker&
Engagement&
Always&maintains&an&excellent&
standard&of:&&
• Participation&in&tutor&
activities&
• Participation&in&the&
wider&life&of&the&school&
• Academic&rigor&
• Service&
Always&maintains&an&excellent&
standard&of:&&
• Participation&in&tutor&
activities&
• Participation&in&the&
wider&life&of&the&school&
• Academic&rigor&
&
Usually&maintains&a&high&standard&of:&&
• Participation&in&tutor&
activities&
• Participation&in&the&wider&life&
of&the&school&
• Academic&rigor&
&
Generally&maintains&an&
acceptable&standard&of:&&
• Participation&in&
tutor&activities&
• Participation&in&
the&wider&life&of&
the&school&
• Academic&rigor&
&
Does¬&maintain&an&acceptable&standard&of:&&
• Participation&in&tutor&activities&
• Participation&in&the&wider&life&of&the&school&
• Academic&rigor&

(2016). Tracking and visualizing student effort: Evolution of a practical analytics tool for staff and student engagement . Journal of Learning
Analytics, 3(2), 165–192. http://dx.doi.org/10.18608/jla.2016.32.8
ISSN 1929-7750 (online). The Journal of Learning Analytics works under a Creative Commons License, Attribution - NonCommercial-NoDerivs 3.0 Unported (CC BY-NC-ND 3.0)
176
Figure 5: Whole school effort list.
Each term, a whole-school list was produced with columns indicating the effort score from previous
terms, school and year-group percentiles, and the improvement made since the previous term (see
Figure 5). This list also included academic cohort percentile, based on an aggregated rank over all
subjects and latterly an overall “academic score,” which is in development as a single number from 40
to 100 and will be described in more detail in Section 3.5. Following teacher feedback and correlation
analysis, it was decided to condense the year-group and whole-school effort percentile data to a single
percentile in the summary data due to the extremely high positive correlation between the two
(0.9966). Clearly, it is important that this correlation coefficient be monitored from term to term to
ensure that using a single percentile remains a valid indicator.
The Effort List in Figure 5 was created (by the author) in Microsoft Excel, making use of conditional
formatting options to highlight students’ significant statistics such as a substantial improvement or
decrease in effort score from one term to the next. These highlighted statistics are designed to assist
pastoral tutors in selecting pertinent information to help shape their one-on-one discussions with
students. Typically, red is used for concern and green for positive accomplishment.
A visualization tool developed (by the author) for student intervention and analysis is the use of a
three-dimensional motion chart (bubble-chart, implemented in Google Sheets) that shows the
progress of student effort–achievement paths on a two-dimensional plane as time elapses. Figures 6a
and 6b display all secondary school students, with girls in blue and boys in green, at two separate
times of the year. The position of a single student is determined by his or her effort on the horizontal

(2016). Tracking and visualizing student effort: Evolution of a practical analytics tool for staff and student engagement . Journal of Learning
Analytics, 3(2), 165–192. http://dx.doi.org/10.18608/jla.2016.32.8
ISSN 1929-7750 (online). The Journal of Learning Analytics works under a Creative Commons License, Attribution - NonCommercial-NoDerivs 3.0 Unported (CC BY-NC-ND 3.0)
177
scale and achievement on the vertical scale, and this position can be traced over the course of the
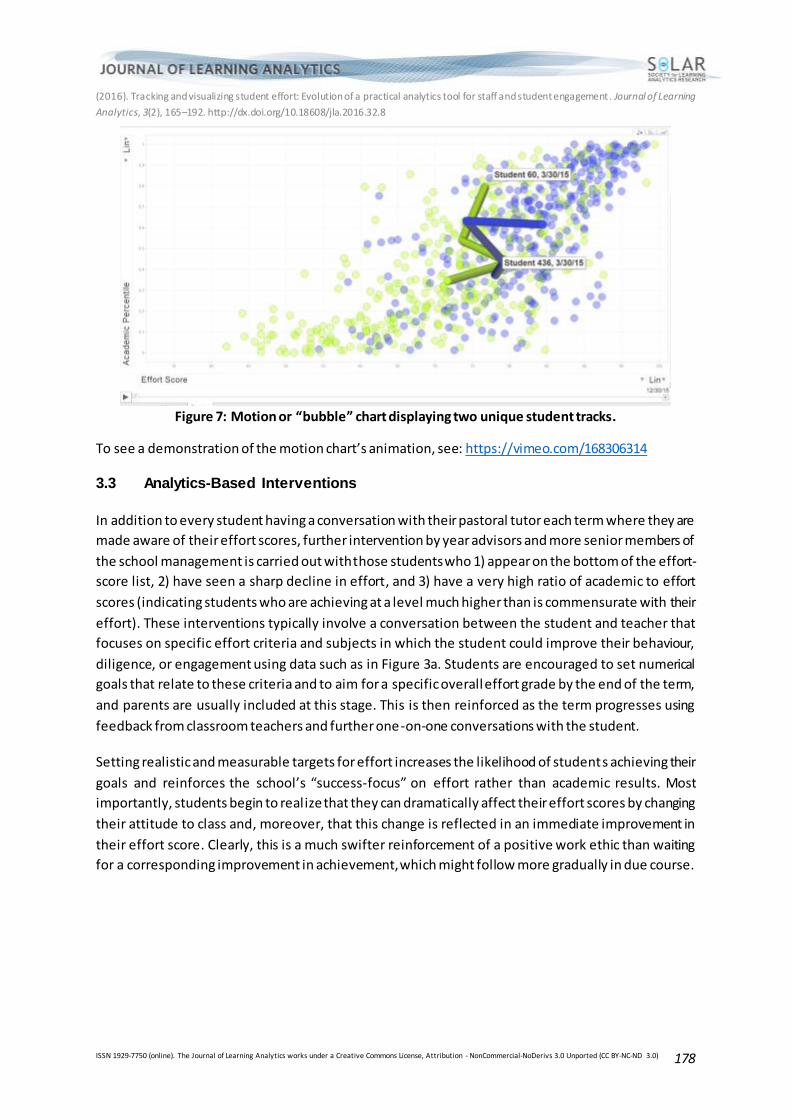
year to reveal a unique student track, as can be seen in Figure 7. Being able to select and watch the
path of a single student while conducting a one-on-one interview about their effort is an extremely
persuasive method of encouraging student motivation and self -reflection. All students have shown
great interest in observing and analyzing their track.
Figure 6a: Motion or “bubble” chart displaying all student effort and achievement (Term 1, 2015).
Figure 6b: Motion or “bubble” chart displaying all student effort and achievement later in the year
(Term 3, 2015).
(2016). Tracking and visualizing student effort: Evolution of a practical analytics tool for staff and student engagement . Journal of Learning
Analytics, 3(2), 165–192. http://dx.doi.org/10.18608/jla.2016.32.8
ISSN 1929-7750 (online). The Journal of Learning Analytics works under a Creative Commons License, Attribution - NonCommercial-NoDerivs 3.0 Unported (CC BY-NC-ND 3.0)
178
Figure 7: Motion or “bubble” chart displaying two unique student tracks.
To see a demonstration of the motion chart’s animation, see: https://vimeo.com/168306314
3.3 Analytics-Based Interventions
In addition to every student having a conversation with their pastoral tutor each term where they are
made aware of their effort scores, further intervention by year advisors and more senior members of
the school management is carried out with those students who 1) appear on the bottom of the effort-
score list, 2) have seen a sharp decline in effort, and 3) have a very high ratio of academic to effort
scores (indicating students who are achieving at a level much higher than is commensurate with their
effort). These interventions typically involve a conversation between the student and teacher that
focuses on specific effort criteria and subjects in which the student could improve their behaviour,
diligence, or engagement using data such as in Figure 3a. Students are encouraged to set numerical
goals that relate to these criteria and to aim for a specific overall effort grade by the end of the term,
and parents are usually included at this stage. This is then reinforced as the term progresses using
feedback from classroom teachers and further one-on-one conversations with the student.
Setting realistic and measurable targets for effort increases the likelihood of students achieving their
goals and reinforces the school’s “success-focus” on effort rather than academic results. Most
importantly, students begin to realize that they can dramatically affect their effort scores by changing
their attitude to class and, moreover, that this change is reflected in an immediate improvement in
their effort score. Clearly, this is a much swifter reinforcement of a positive work ethic than waiting
for a corresponding improvement in achievement, which might follow more gradually in due course.

(2016). Tracking and visualizing student effort: Evolution of a practical analytics tool for staff and student engagement . Journal of Learning
Analytics, 3(2), 165–192. http://dx.doi.org/10.18608/jla.2016.32.8
ISSN 1929-7750 (online). The Journal of Learning Analytics works under a Creative Commons License, Attribution - NonCommercial-NoDerivs 3.0 Unported (CC BY-NC-ND 3.0)
179
3.4 Reflections on the data
It is very clear that girls’ distribution of effort scores is significantly higher than boys’, although the
differential appears to widen in the middle secondary years and narrow once again in the senior
secondary years. This can be seen in the Appendix, in Figures 9a to 9f for Years 7 to 12 respectively
(Term 1, 2015), and overall in Figures 6a and 6b (Terms 1 and 3, 2015). However, the disparity in
achievement distributions, although also significant, appears much less pronounced. This can be seen
graphically in Figures 6a and 6b by looking at the vertical distributions of the two colours rather than
the horizontal distribution.
Mathematically this is borne out by the relative positions of the academic mean in all year-groups, as
can be seen in Table 2 (Term 4, 2015), with boys still below girls academically, but by a far less
pronounced margin than with effort. The standard deviation is also wider for boys in all years for effort
and, in all but Year 9, for academic achievement, although the difference in the spread of effort
distributions between boys and girls is more pronounced than the difference in the spread of
achievement data.
These results suggest that perhaps teachers are grading boys’ effort more harshly than girls ’, or
perhaps the type of engagement seen by girls is superficially more focused but does not necessarily
translate into academic results. Another more controversial interpretation would be that boys do not
need to try as hard as girls do, but it seems unlikely that this is the case. Further analysis is required
and this will feed back into a dialogue with teachers’ interpretations of the effort rubric and what
“effort” looks like in class.
Table 2: Summary statistics for academic effort and achievement data (Term 4, 2015).
Effort Mean Effort SD Academic Mean Academic SD
Year 7 77.3 11.6 74.5 10.6
Y7 Boys 72.0 11.7 71.5 11.2
Y7 Girls 82.6 8.8 77.4 9.1
Year 8 77.8 11.4 74.8 9.3
Y8 Boys 72.4 12.0 71.8 9.2
Y8 Girls 83.6 7.1 78.1 8.2
Year 9 78.0 10.4 74.7 10.3
Y9 Boys 74.4 10.8 72.0 9.5
Y9 Girls 81.6 8.6 77.5 10.4
Year 10 78.0 12.8 75.2 9.4
Y10 Boys 72.3 13.2 72.7 9.7
Y10 Girls 84.1 9.1 78.0 8.2
Year 11 76.9 11.8 75.3 9.1
Y11 Boys 72.9 11.8 72.3 8.7
Y11 Girls 82.2 9.4 79.2 8.1
Overall 77.6 11.7 74.9 9.8
Boys 72.8 12.0 72.0 9.7
Girls 82.8 8.6 78.0 8.9

(2016). Tracking and visualizing student effort: Evolution of a practical analytics tool for staff and student engagement . Journal of Learning
Analytics, 3(2), 165–192. http://dx.doi.org/10.18608/jla.2016.32.8
ISSN 1929-7750 (online). The Journal of Learning Analytics works under a Creative Commons License, Attribution - NonCommercial-NoDerivs 3.0 Unported (CC BY-NC-ND 3.0)
180
3.5 Towards an Aggregate Achievement Score
In order to provide a consistent, dependent variable on which to base effort–achievement analysis, it
is necessary to develop an academic achievement score that is invariant to fluctuations in the level of
difficulty of individual assessment tasks. To this aim, the author has developed a weighted and
normalized “achievement score” based entirely on standard deviation. Broadly, a student’s
achievement in every assessment is measured by his or her z-score (number of standard deviations
from the cohort mean) and multiplied by the individual assessment weighting. The sum of all these
weighted deviations from the mean is calculated for each student and then normal ized by dividing by
the total weighting of all the student’s assessments. The resulting figure is a weighted standardized
and normalized measure of the student’s deviation from the mean, which can then be translated into
a score by multiplying by a “spread-variable” and adding an “average-offset” adjustment. This method
gives an academic score comparable between students of different cohorts provided that the ability
range of each cohort is broadly similar and assuming a normal distribution of scores. By manipulating
the two “spread-variable” and “average-offset” variables, it can be ensured that this “academic score”
ranges from about 40 to 100 in order to be in line with effort score and other common indicators such
as the ATAR.3 This “academic score” is still in its infancy but already appears to be a reliable relative
indicator of academic achievement.
3.6 Staff Reactions
It has been described how staff have been engaged in consultation around successive iterations of the
tool. In this section, the author reflects on some of the ongoing challenges that this approach presents.
In the initial staff consultation, different criteria were discussed to ensure the best overall description
of student effort without undue overlap between criteria. Many staff suggested criteria such as
“Independence,” “Organization,” and “Risk Taking,” but these were not adopted due to the difficulty
in accurately reporting on every student in these aspects of their character. Moreover, there were
vibrant debates between staff on the semantics of criteria descriptors: would “focus” be a better
descriptor than “engagement”? Perhaps “respect” would be better than “behaviour”? In the end,
there were many possible combinations of criteria that could have provided similar overall coverage
and discrimination of student effort, but a decision had to be made to adopt a particular collection of
criteria. This was made with due reference to the comments of all staff in the consultation process,
which also improved staff “buy-in” of the resulting refinement of the tool.
One member of staff expressed concern about being able to reflect the rubric from term to term
accurately and asked whether it was possible to pre-fill the teacher input screens with the previous
term’s grades for each student so as to be able to better ensure consistency of reporting by teachers
from term to term. Clearly, there appears to be some merit in this idea at first, but on further
reflection, it was dismissed due to the overwhelming likelihood that it would encourage teachers to
3 The Australian Tertiary Admission Rank (ATAR) i s a number from 0 to 99.95 representing an academic ranking; it is
administrated by the Australian University Admissions Centre (UAC) and “provides a measure of a student’s overall academic achievement in relation to that of other students and helps universities rank applicants for selection into their courses.” See http://www.uac.edu.au/atar/ for more details.

(2016). Tracking and visualizing student effort: Evolution of a practical analytics tool for staff and student engagement . Journal of Learning
Analytics, 3(2), 165–192. http://dx.doi.org/10.18608/jla.2016.32.8
ISSN 1929-7750 (online). The Journal of Learning Analytics works under a Creative Commons License, Attribution - NonCommercial-NoDerivs 3.0 Unported (CC BY-NC-ND 3.0)
181
develop a “fixed mindset” with respect to their students both in terms of the relative ease of not
changing grades as well as an inherent inertia towards radically re-assigning them. It was felt that any
teacher who wished to be diligent in maintaining consistency of their distribution of grades could keep
copies of previous terms’ grades and use these to inform their current reporting.
Although many staff supported and liked reporting on a single effort criterion at a time, one member
preferred to be able to see all effort criteria awarded in a single screen to ensure consistency. This
was dismissed for the same reasons as the previous concern, believing that this would lead to a much
higher correlation between criteria; this was borne out by the correlation analysis mentioned earlier
in this article.
3.7 Software Implementation Practicalities
The practicalities of implementing the effort tracking system to capture data each term, via the
desired single-criterion screens for a whole class, proved challenging, and are worth reporting since
these are the sorts of obstacles that will beset almost any analytics project that must co-exist with
legacy systems.
Initial conversations with the school’s database supplier proved fruitless, partly due to the
semesterized nature of the current system, and it was decided to run the entire effort-tracking pilot
outside this system using a Google Sheets Script developed specifically for this purpose. Although the
implementation of the “Effort Input Script” was successful and demonstrated proof of concept, it
developed through three distinct versions with several staff requests implemented, such as the option
to print after submission of grades.
Due to the data being hosted in the cloud and the need for staff to access the entire Google Sheet
simultaneously, there were initially problems with some of the input data not being properly
transferred to the master sheet. This was due to the initial design of the user interface, written in
JavaScript, which referenced a local copy of the data to improve input speed and performance. In the
first version of the “Effort Grading Script,” some of the data from the local copy did not correctly
transfer to the remote master sheet due to Internet dropout, inconsistent access to the Google sheet,
and other individual user issues. Further refinement in the script then resulted in unacceptable delays
due to all data being checked for accuracy every time there was a single change in input. Final ly, a
compromise was reached with the master sheet being checked with the local copy only after each
input screen. Although there were still occasional lapses in the transfer of data, the resulting version
3 script allowed for swift data entry and an acceptable compromise in accuracy in terms of the amount
of follow-up with teachers for missing grades. Nevertheless, it is seen as essential that this reporting
eventually becomes absorbed within the current structure of the school’s database system,
particularly if the effort grading becomes part of the school’s official reporting to parents.
In investigating what reports to parents may be possible for a single student, box -and-whisker
diagrams were produced for each of a student’s subjects, displaying the range of effort grades
awarded for each criteria as well as an overall distribution for the class (displayed on a 1
(Unsatisfactory) to 5 (Outstanding) scale for comparison with individual criteria). The student’s
performance was highlighted on each box-and-whisker diagram with a black diamond, as can be seen

(2016). Tracking and visualizing student effort: Evolution of a practical analytics tool for staff and student engagement . Journal of Learning
Analytics, 3(2), 165–192. http://dx.doi.org/10.18608/jla.2016.32.8
ISSN 1929-7750 (online). The Journal of Learning Analytics works under a Creative Commons License, Attribution - NonCommercial-NoDerivs 3.0 Unported (CC BY-NC-ND 3.0)
182
in Figure 8a. Note that in each of these specific diagrams the range of values is from 2 (Fair) to 5
(Outstanding).
Figure 8a: Possible subject-specific Effort Report using box-and-whisker diagrams.
However, this proposed reporting highlighted teachers who were more egalitarian in their reporting
of effort or who perhaps displayed less knowledge of their students’ individual characteristics. This
might be indicative of subjects in which teachers saw particular classes only occasionally, especially if
reporting at the end of Term 1. For an extreme example, see Figure 8b: Data has been manipulated to
assign all students the same grade for each criteria.
Figure 8b: Manipulated subject-specific Effort Report with all students awarded the same grade (4
– Very Good).
Clearly, it would be undesirable to send a report to parents such as the one in Figure 8b and it is
necessary to ensure that this does not happen. This might be addressed through staff awareness (by
alerting staff that their distribution of grades will become visible to parents if this sort of reporting is
implemented). Furthermore, it may be appropriate for certain subjects to grade effort on a less-
frequent basis due to the relative frequency of their classes. In the effort pilot, it was decided to adopt
this approach with one subject in which all secondary students in years 7 to 10 were taught by a team
of two teachers once per week. In consultation with this department, it was decided that effort
grading would take place for a single year-group each term, with year 10 in term 1, year 9 in term 2,
and years 8 and 7 in terms 3 and 4 respectively. This would ensure that teachers knew their students
well at the time of reporting (the older students would have been taught in previous years) and that
there were reasonable reporting overheads each term. This “stratified” reporting also ensured that

(2016). Tracking and visualizing student effort: Evolution of a practical analytics tool for staff and student engagement . Journal of Learning
Analytics, 3(2), 165–192. http://dx.doi.org/10.18608/jla.2016.32.8
ISSN 1929-7750 (online). The Journal of Learning Analytics works under a Creative Commons License, Attribution - NonCommercial-NoDerivs 3.0 Unported (CC BY-NC-ND 3.0)
183
while this subject played a role in a student’s effort grade over the course of a year, it only contributed
25% compared to other subjects that occurred more frequently and were therefore more significant.
The issue of how relatively significant each subject should be in the creation of an overall effort score
is ongoing. With the exception of the example above, all subjects currently count equally towards a
student’s effort score; however, there may be subjects where a student has more than one teacher
or where a senior student has extension units with the same teacher. All these factors throw up
further decisions and refinements into obtaining a single score for student effort, one comparable
across all cohorts and year-groups. Furthermore, this relative weighting of subjects is perhaps even
more contentious in the creation of an academic score. Should certain subjects such as Mathematics
and English be weighted above other subjects? Certainly, this appears to be the case in the creation
of a student’s ATAR by the University Admissions Centre (UAC). What about the relative academic
weighting in situations where students study different levels of the same subject, such as in senior
years where at least three levels of Mathematics are offered? Indeed, if we are to use the (year 12)
ATAR as a model on which to base a single academic score for students of all years, it then places an
onerous responsibility to reflect the correct weighting of subjects all the way down to year 7. However,
will this result in undesirable consequences such as early tactical subject selection? If the ATAR is not
used as a model for creating the academic score, there may be a discrepancy between what students
have been expecting from the school-assigned academic score and subsequent rank, and what they
receive at the end of their schooling from UAC. Clearly, many questions remain in addressing and
refining the method before arriving at what will surely be a compromise between accuracy and
necessity. Nevertheless, much of the purpose and strength of student tracking is in the progression
and monitoring of student progress together with the conversations it generates between students,
teachers, and parents, rather than on the raw data itself.
Importantly, the results of the effort-tracking pilot have also raised staff awareness regarding the
behaviours teachers seek in students. Are teachers’ expectations of students encouraging quiet and
co-operative behaviour? Does such behaviour manifest the best learning outcomes? Are sociologically
instilled teacher expectations of student behaviour biased towards “feminine” characteristics at the
expense of nurturing male patterns of engagement and learning? The results of this study appear to
lend support to some of these suggestions. There certainly appears to be plenty of scope for further
research.
3.8 Student Reactions
In our experience to date, sharing this effort/achievement tracking data in the context of a student
mentoring conversation generates tremendous interest, especially when the data is broken down to
reveal the make-up of effort scores for each term. Students are fascinated to learn of the whole-school
distribution of effort and achievement, and how they fit into that picture, highlighted so clearly in
their motion track.
Part of the motivational effect of reviewing data from a previous term or year with a student is that
there is a natural disconnect between the timing of the conversation and the “snapshot” of the
student, which took place in the past. For teenagers, there is an inherent assumption that they will be
older, wiser, and more mature after even a few weeks.

(2016). Tracking and visualizing student effort: Evolution of a practical analytics tool for staff and student engagement . Journal of Learning
Analytics, 3(2), 165–192. http://dx.doi.org/10.18608/jla.2016.32.8
ISSN 1929-7750 (online). The Journal of Learning Analytics works under a Creative Commons License, Attribution - NonCommercial-NoDerivs 3.0 Unported (CC BY-NC-ND 3.0)
184
At the beginning of a new term, a student is typically fresher and more willing to evaluate prior
performance and effort critically with a view to believing themselves capable of improving their
behaviour, diligence, and engagement in the term ahead. It is important that all such conversations
be positively framed with a view to building self-motivation and helping to scaffold a plan for the term
ahead with specific numerical goals for a student’s effort, broken down by subject and/or criteria. Just
as with the dispositional analytics approach of Buckingham Shum and Deakin Crick (2012), it is also
imperative that the student “owns” the effort grades from a previous term. To this end, having shared
the breakdown of effort score, it is vital to ask the question, “Do you feel that this is an accurate
reflection of your efforts as they were at the end of last term?” Most students broadly agree with their
teachers’ effort grading, sometimes believing that their teachers have been a bit generous in some
subjects. In fact, by emphasizing the tracking aspect of the data, it is usually motivating for a low-effort
student to know that he or she can easily improve their score in the upcoming term.
In the role of Dean of Students, the author has recently conducted several one-on-one conversations
with students at the lower end of the school’s effort scores in years 9 to 12. The student is told that
the purpose of the meeting is not a punitive one, but rather a way of supporting and helping them to
improve their poor effort score from the previous term. Conversations usually start by looking at the
student’s effort scores over the past year and the breakdown of the previous term’s effort score using
the data in Figure 3a.
In the one-on-one meeting, both parties analyze whether there are specific subjects of concern and/or
specific criteria in which the student could improve. Conversations may then turn to discussing what
“engagement” looks like from a teacher’s perspective or strategies for ensuring behaviour is
maintained in class, such as sitting away from “trouble” and not shouting out. If diligence is the main
problem, discussions centre on organizational skills and producing a home timetable to try to improve
self-discipline. At this point, students generally wish to see their “motion track” against the backdrop
of the rest of the school and their data point is selected in the motion chart and the sequence played
of the previous year’s data with their track highlighted (as in Figure 7). It is explained that the
horizontal scale is the effort and the scale on which they can make an immediate impact. It is often
useful to discuss why the achievement rise and fall appears to lag behind the effort.
The final stage of the conversation is for the student to come up with some specific targets for the
term ahead. This can be in specific criteria and/or specific subjects and it is important to have an
overall goal that should be achievable, but also a significant improvement. It is useful in setting this
overall effort goal for students to see themselves graphically against the backdrop of all other
students. One student said at this point, “Can I actually achieve 75?” The author’s response was,
“Absolutely. This is effort we are talking about, not academic achievement. You can achieve any score
in effort provided you are showing your teachers that you mean business, by behaving in class,
completing all work on time, and demonstrating engagement skills such as ‘active listening,’
participation, and seeking help. Clearly let’s not set too high a target initially , as it is not that easy to
change your habits and maintain them for a whole term, but by all means select something that you
feel you can achieve this term.” The student often finds it easier to set this target by looking at their
own historical data track set against that of other students (Figure 7), which emphasizes the usefulness
of this particular visualization tool.

(2016). Tracking and visualizing student effort: Evolution of a practical analytics tool for staff and student engagement . Journal of Learning
Analytics, 3(2), 165–192. http://dx.doi.org/10.18608/jla.2016.32.8
ISSN 1929-7750 (online). The Journal of Learning Analytics works under a Creative Commons License, Attribution - NonCommercial-NoDerivs 3.0 Unported (CC BY-NC-ND 3.0)
185
Following the meeting, the student’s teachers and parents are informed about what was discussed
and what targets the student set. Teachers are encouraged to explicitly recognize any change they see
in the student’s attitude and effort and asked for further feedback a few weeks later before holding a
subsequent meeting with the student. Helping the student break the term down into smaller periods
allows for short-term success and for teachers to change their mindset about the student. More
importantly, students feel empowered to influence their own progress. At this point, the author
sometimes quotes Stephen Covey: “Sow a thought, reap an action; sow an action, reap a habit; sow
a habit, reap a character; sow a character, reap a destiny” (1989, p. 46).
3.9 Reflections on the “Hawthorne Effect”
The staff and student feedback is encouraging for the effectiveness of utilizing effort-tracking data to
motivate and re-focus students. However, to what extent this is due to the inherent methodology and
emphasis on effort instead of academic achievement is open to question, as there is no doubt a large
“Hawthorne effect.” The “Hawthorne effect” is well known to psychologists and describes the way in
which the novelty of being research subjects changes the behaviour of the subjects of that research.
It is quite possible that the methodology described here capitalizes greatly on the “Hawthorne effect”
producing positive results for students who might otherwise find it difficult to re -engage with their
studies. However, under the constraints of this work to date, it has not been possible to run what
might be regarded in a more controlled experimental paradigm as a control group.
3.10 Student Self-Assessment of Effort
In the latest implementation of this tool, students were asked to grade their own effort using the same
interface as teachers, based on the same three criteria as before. There were no clear rubrics
provided, but instead, the following descriptions:
Behaviour: This is your classroom conduct and attitude, politeness and respect, and consideration for the learning of others.
Diligence: This is how conscientious you are in class and at home. Do you always complete all work? Do you work beyond this? Do you always complete your work to the best of your ability?
Engagement: This is your classroom focus and communication (verbal and body language), active listening skills, punctuality, participation, and contribution to class.
Following this process, individual student grades were sent to each student, together with their
teachers’ grades for comparison. They were also given a random ized number and the link to an
anonymized bubble-chart of the type shown in Figure 7, where they could see their effort and
achievement “motion-track” set against the backdrop of the whole school. Follow-up discussions took
place between students and pastoral carers and between students and subject teachers.
Students were surveyed shortly after this process to canvas their views on the effort grading and
tracking process and nearly 200 students responded (over a quarter of those invited). The student
survey results demonstrated a clear overall endorsement of the effort tracking process with 90% of
students expressing a desire to continue the self-assessment grading on a termly basis together with
teacher grading. Over 70% of students found the comparison of self -grading with teacher grading
useful or very useful and nearly 80% reported that they were motivated to improve their effort score

(2016). Tracking and visualizing student effort: Evolution of a practical analytics tool for staff and student engagement . Journal of Learning
Analytics, 3(2), 165–192. http://dx.doi.org/10.18608/jla.2016.32.8
ISSN 1929-7750 (online). The Journal of Learning Analytics works under a Creative Commons License, Attribution - NonCommercial-NoDerivs 3.0 Unported (CC BY-NC-ND 3.0)
186
the following term. Students were encouraged to state any strategies they were planning to use in
order to improve their effort score and many of these responses were specific and targeted at
improvement in learning processes, demonstrating reflection of habits of mind, and skills associated
with lifelong learning.
In this first trial, 94% of all students attempted to grade themselves with 3% of these not completing
all criteria. One of the main reasons was technical accessibility issues with Google Docs rather than
apathy, and it is hoped that future self-grading will include all students. Once all effort grading had
been completed, the results of both the self-assessment and teachers’ grades were shared with
students and teachers and the discrepancies between the student and teacher grading were
highlighted and analyzed. Overall, on average, students and their teachers graded almost identically,
although there were wide fluctuations for individual students. Boys’ grading showed an average
discrepancy with their teachers of -0.1, 0.0, and 0.0 for Behaviour, Diligence, and Engagement
respectively (on the 5-point scale described in Section 3.1) whilst girls were a little more critical of
their own efforts, having average discrepancies of -0.4, -0.2, and -0.3 respectively, as can be seen in
Table 3. This degree of overlap is one form of validation of the teacher observation methodology and
tool, namely that staff assessments have validity in students’ eyes. Moreover, student –teacher
discrepancies draw attention to potential conversations. Students with very low (or indeed, inflated)
self-esteem become more visible, and interventions can be considered.
Table 3: Discrepancy between student self-grading and teacher grading (Term 1, 2016) .
Behaviour Diligence Engagement
Whole School Average -0.2 -0.1 -0.1
Whole School Standard Deviation 1.0 1.0 1.1
Whole School % Identical 62% 62% 58%
Whole School % off by more than 1 grade 13% 13% 15%
Girls Average -0.4 -0.2 -0.3
Girls Standard Deviation 1.0 1.0 1.0
Girls % Identical 64% 64% 60%
Girls % off by more than 1 grade 12% 12% 15%
Boys Average -0.1 0.0 0.0
Boys Standard Deviation 1.1 1.1 1.1
Boys % identical 61% 61% 57%
Boys % off by more than 1 grade 14% 14% 15%
(2016). Tracking and visualizing student effort: Evolution of a practical analytics tool for staff and student engagement . Journal of Learning
Analytics, 3(2), 165–192. http://dx.doi.org/10.18608/jla.2016.32.8
ISSN 1929-7750 (online). The Journal of Learning Analytics works under a Creative Commons License, Attribution - NonCommercial-NoDerivs 3.0 Unported (CC BY-NC-ND 3.0)
187
4 CONCLUSIONS AND FUTURE DIRECTIONS
Based on educational research into the centrality of making learning dispositions visible to students,
this practitioner report has described the iterative development of a practical approach to effort
tracking, suitable for use by busy high school teachers. This has been developed to track and feed back
to both educators and students how student effort appears to be changing over terms and semesters,
in order to scaffold more effective student–tutor conversations. A visual analytics technique using
animated bubble charts has proven an engaging way to present such data, as evidenced by student
survey results, with students making comments such as:
I really appreciate the effort tracking “bubble chart.” I thought it was really interesting seeing
my improvement only over the last term; it would be amazing see over the whole school year!
The engagement and professional development of teachers is central to ensuring that such initiatives
are sustainable and trusted by staff. Moreover, the strength of this tool lies in the formative aspect of
effort assessment, implicit in the student tracking model and regularly reinforced by informed, high
quality student–teacher conversations following each successive effort grading period (typi cally
termly).
The use of student tracking data to influence student motivation and achievement appears to be an
exciting outcome of this project, as is the potential use of the achievement score data to justify value-
added benefit and extrapolation of current results to final ATARs. However, there is always a danger
that effort tracking could be used counter-productively as just another summative assessment of
student performance, merely increasing the pressure on students rather than seeking to develop
intrinsic motivation in them. It is for this reason that schools need to be circumspect about using this
data in an ethical manner to redirect the “success-focus” away from high-stakes testing in order to
provide a positive impact on student motivation and lifelong learning skills.
Perhaps the most exciting aspect of this implementation of data analysis is the direct positive effect
on student motivation and encouraging a “growth mindset” as part of the school “success-focus.” It
appears that it may provide a means of lessening the impact of high-stakes summative assessment on
student motivation, which has negative impacts on intrinsic motivation for learning (Harlen & Deakin
Crick, 2003). In an educational era of ever-burgeoning assessment, with systemic emphasis on
performance goals, Harlen and Deakin Crick’s review (of the impact of testing on students’ motivation
for learning) identified the need for increased emphasis on learning goals and for providing feedback
to students in relation to these goals. In particular, Duckworth, Fielding, and Shaughnessy (1986) and
Roderick and Engel (2001) stressed the importance of using assessment to convey a sense of learning
progress to students and helping to show low-achieving students how to direct their efforts in order
to support their self-efficacy. The effort-tracking model developed here, provides schools with a
structured means of achieving this aim, and promises to support students’ development of qualities
associated with effective lifelong learning by acting alongside, but as a moderating influence on
statutory high-stakes summative assessment regimes.
At present, our confidence in the approach is based on what staff and students are feeding back from
their experiences of the project. This evidence indicates that the initial one -year pilot effort-tracking
project at Redlands School has been very successful, both in terms of the interest generated from

(2016). Tracking and visualizing student effort: Evolution of a practical analytics tool for staff and student engagement . Journal of Learning
Analytics, 3(2), 165–192. http://dx.doi.org/10.18608/jla.2016.32.8
ISSN 1929-7750 (online). The Journal of Learning Analytics works under a Creative Commons License, Attribution - NonCommercial-NoDerivs 3.0 Unported (CC BY-NC-ND 3.0)
188
students, teachers, and parents as well as the relatively quick and easy reporting methodology by
teachers. Harlen and Deakin Crick (2002) identify a key question in their review: “What actions in what
circumstances would increase the positive, and decrease the negative i mpact on students of
summative testing and assessment?” It is imperative that any implementation of this tool seeks to do
just that, in working alongside the school’s academic assessment program. As Harlen and Deakin Crick
state, “For continued learning, the motive needs to be intrinsic, the reward being in the process of
learning and in the recognition of being in control of, and responsible, for one’s own learning” (2002,
p. 2).
So far, the effort-tracking tool has produced interesting data and findings that deserve further
investigation and research, and has more scope for refinement and development over the coming
years. Future work should establish a more formal evidence base, but to date has been beyond the
scope of this practitioner-initiated program. Other future possibilities include more detailed analysis
of “motion tracks” on the “bubble” chart in Figure 7, including categorizing typical tracks and assessing
whether they correlate to particular types of students. Other avenues might introduce additional tools
for self-report dispositional analytics, such as CLARA (Deakin Crick et al., 2015; CLARA, 2016), which
could provide additional insights into student resilience and agency, and further enrich student–tutor
interviews.
REFERENCES
Black, P., & Wiliam, D. (1998). Assessment and classroom learning. Assessment in Education, 5(1), 7–
74. http://dx.doi.org/10.1080/0969595980050102
Bryk, A. (2015). Learning to improve: How America’s schools can get better at getting better. Boston:
Harvard Education Press.
Buckingham Shum, S., & Deakin Crick, R. (2012). Learning dispositions and transferable competencies:
Pedagogy, modelling and learning analytics. Proceedings of the 2nd International Conference
on Learning Analytics and Knowledge (LAK ʼ12), 92–101.
http://dx.doi.org/10.1145/2330601.2330629
Costa, A. L., & Kallick, B. (2009). Habits of mind across the curriculum: Practical and creative strategies
for teachers. Alexandria, VA: Association for Supervision and Curriculum Development.
Covey, S. R. (1989). The 7 Habits of Highly Effective People: Powerful Lessons in Personal Change. New
York: Free Press.
CLARA (2016). Crick Learning for Resilient Agency: Learning Emergence LLC. [Web site]. Retrieved from
http://clara.learningemergence.com
Deakin Crick, R., Huang, S., Ahmed-Shafi, A., & Goldspink, C. (2015). Developing resilient agency in
learning: The internal structure of learning power. British Journal of Educational Studies, 63(2),
121–160. http://dx.doi.org/10.1080/00071005.2015.1006574
Duckworth, K., Fielding, G., & Shaughnessy, J. (1986). The relationship of high school teachers’ class
testing practices to pupils’ feelings of efficacy and efforts to study . Portland, OR: University of
Oregon.
Dweck, C. S. (2006). Mindset: The new psychology of success. New York: Random House.
Jackson, R. C. (2014). Concentration. In R.C. Eklund, G. Tennenbaum (Eds.), Encyclopedia of sport and
exercise psychology (Vol.1), (pp. 159—161). Thousand Oaks, CA: Sage Publications.

(2016). Tracking and visualizing student effort: Evolution of a practical analytics tool for staff and student engagement . Journal of Learning
Analytics, 3(2), 165–192. http://dx.doi.org/10.18608/jla.2016.32.8
ISSN 1929-7750 (online). The Journal of Learning Analytics works under a Creative Commons License, Attribution - NonCommercial-NoDerivs 3.0 Unported (CC BY-NC-ND 3.0)
189
Harlen, W., & Deakin Crick, R. (2002). A systematic review of the impact of summative assessment and
tests on students’ motivation for learning. In: Research Evidence in Education Library. London:
EPPI-Centre, Social Science Research Unit, Institute of Education.
Harlen, W., & Deakin Crick, R. (2003). Testing and motivation for learning. Assessment in Education,
10(2), 169–207. http://dx.di.org/10.1080/0969594032000121270
Hobsons. (2014). Student Feedback and Progressive Reporting (Report). Melbourne: Hobsons
Australia Pty Ltd. Retrieved from http://www.bps.sa.edu.au/__files/f/16997/Hobsons
student feedback and progressive reporting June14.pdf
Kellaghan, T., Madaus, G., & Raczek, A. (1996). The use of external examinations to improve student
motivation. Washington, DC: AERA.
Martin, A. J. (2010). Building classroom success: Eliminating academic fear and failure. London:
Continuum.
McDonald, A. (2001). The prevalence and effects of test anxiety in school children. Educational
Psychology, 21, 89–101. http://dx.doi.org/10.1080/01443410020019867
Perkins-Gough, D. (2013, September). Educational leadership: The significance of grit — A
conversation with Angela Lee Duckworth. Educational Leadership, 71(1), pp. 14–20. Retrieved
from http://www.ascd.org/publications/educational-leadership/sept13/vol71/num01/The-
Significance-of-Grit@-A-Conversation-with-Angela-Lee-Duckworth.aspx
Pollard, A., Triggs, P., Broadfoot, P., McNess, E., & Osborn, M. (2000). What pupils say: Changing policy
and practice in primary education. London: Continuum.
Roderick, M., & Engel, M. (2001). The grasshopper and the ant: Motivational responses of low
achieving pupils to high stakes testing. Educational Evaluation and Policy Analysis, 23, 197–
228.
Schunk, D. (1991). Self-efficacy and academic motivation. Educational Psychologist, 26, 207–231.
http://dx.doi.org/10.1080/00461520.1991.9653133
Smith, L. H., & Kays, T. M. (2010). Sports psychology for dummies “cheat sheet.” Mississauga, ON: John
Wiley & Sons Canada.

(2016). Tracking and visualizing student effort: Evolution of a practical analytics tool for staff and student engagement . Journal of Learning
Analytics, 3(2), 165–192. http://dx.doi.org/10.18608/jla.2016.32.8
ISSN 1929-7750 (online). The Journal of Learning Analytics works under a Creative Commons License, Attribution - NonCommercial-NoDerivs 3.0 Unported (CC BY-NC-ND 3.0)
190
APPENDIX: DISTRIBUTION OF EFFORT GRADES BASED ON GENDER AND
YEAR-GROUP (TERM 1, 2015).
Figure 9a: Distribution of Year 7 Boys’ and Girls’ Effort Grades (Term 1, 2015).
Figure 9b: Distribution of Year 8 Boys’ and Girls’ Effort Grades (Term 1, 2015).

(2016). Tracking and visualizing student effort: Evolution of a practical analytics tool for staff and student engagement . Journal of Learning
Analytics, 3(2), 165–192. http://dx.doi.org/10.18608/jla.2016.32.8
ISSN 1929-7750 (online). The Journal of Learning Analytics works under a Creative Commons License, Attribution - NonCommercial-NoDerivs 3.0 Unported (CC BY-NC-ND 3.0)
191
Figure 9c: Distribution of year 9 boys’ and girls’ effort grades (Term 1, 2015).
Figure 9d: Distribution of year 10 boys’ and girls’ effort grades (Term 1, 2015).

(2016). Tracking and visualizing student effort: Evolution of a practical analytics tool for staff and student engagement . Journal of Learning
Analytics, 3(2), 165–192. http://dx.doi.org/10.18608/jla.2016.32.8
ISSN 1929-7750 (online). The Journal of Learning Analytics works under a Creative Commons License, Attribution - NonCommercial-NoDerivs 3.0 Unported (CC BY-NC-ND 3.0)
192
Figure 9e: Distribution of year 11 boys’ and girls’ effort grades (Term 1, 2015).
Figure 9f: Distribution of year 12 boys’ and girls’ effort grades (Term 1, 2015).