track substructure characterization using gpr
TRANSCRIPT

Track Substructure Characterization Using 500 MHz and 2 GHz Ground Penetrating Radar: Results from over 250 Miles of Track in
Wyoming and Alaska
Roger Roberts1, Imad Al-Qadi2, and Erol Tutumluer3 1Geophysical Survey Systems Inc
12 Industrial Way Salem, NH 03079
Ph. 603-681-2057, Fax 603-889-3984 [email protected]
2Dept. of Civil and Environmental Engineering, MC-250
205 N. Matthews Ave. University of Illinois at Urbana-Champaign
Urbana, IL, 61801 Ph. (217) 265-0427, Fax (217) 333-1924
3Dept. of Civil and Environmental Engineering 1205 Newmark CE Lab., MC 250
205 N. Matthews Ave. University of Illinois at Urbana-Champaign
Urbana, IL, 61801 Ph. (217) 333-8637, Fax (217) 333-1924
Word Count: 3741 + 15 figures x 250 words/figure = 7491

ABSTRACT
In July and August, 2007, a configuration of ground penetrating radar (GPR) antennas mounted
on a hi-rail vehicle was used to assess the ballast condition and characterize the subballast and
subgrade along over 250 miles of track in Wyoming and Alaska. The GPR setup utilized 2 GHz
horn antennas mounted over the shoulders and a 500 MHz horn antenna mounted between the
rails. The 2 GHz data were processed to assess the ballast fouling condition on the shoulders.
The 500 MHz data were obtained with the intent of mapping the subballast/subgrade interface
and anomalous features typically associated with perched water or the water table. Twenty
ground truth holes were dug at each location and samples were extracted typically at 6-in. depth
increments through the ballast layer and in most instances into the subballast and subgrade. The
maintenance concerns associated with the Alaska Railroad track were focused on frost
susceptible sections. Whereas ballast fouling associated with coal dust was the major
maintenance priority of the track in Wyoming. These two structurally different railroads,
exhibiting different substructure maintenance requirements, were effectively characterized using
one GPR setup. Good correlation was also observed between the processed GPR data and
available ground truth.
INTRODUCTION
Ground penetrating radar (GPR) has been used for over 30 years in attempts to characterize the
earth’s subsurface. The varied uses of the technique include the detection of utilities, buried
bodies, voids, rebar in concrete, and buried barrels. The technique has even been used in the
Disney TV show “MythBusters” in an attempt to locate Jimmy Hoffa’s body in Giants Stadium –

without success. The method is commonly used to inspect transportation infrastructure to
calculate pavement thickness and assess the condition of concrete bridge decks. There are a
number of types of GPR antennas that suit particular tasks. The antennas popular in
transportation infrastructure assessment are the air-launched variety. These antennas can collect
the necessary information without being in contact with the ground, a major advantage for
vehicles driving on public roads.
GPR has also been used to assess the condition of railroads. One of the first railroad
investigations was performed by GSSI back in 1985 [1]. The Federal Railroad Administration
has been partially funding a GPR project beginning in 2001 that has led to the development of
tools focusing on the practical assessment of railroad track condition and contributed to the
recent popularity of GPR inspection of track [2]. The data discussed in this paper was obtained
as part of Phase IV of this project. One of the goals of the FRA project is to advance the state-
of-the-art in track substructure characterization using GPR technology. Attainment of this goal
required development of new equipment, new processing methodology, and collection of a
considerable amount of GPR data and ground truth from different track structural conditions.
The objectives of the investigations described in this paper were to: (1) characterize the
ballast fouling extent; (2) assess the accuracy of the ballast fouling calculation based on GPR
data; (3) characterize the subballast and subgrade layering; and (4) detect anomalies that may be
related to track structural problems.
GPR data and ground truth data were obtained on track jointly operated by BNSF and UP
in the Orin Subdivision and the Alaska Railroad in July and August, 2007. These two tracks were
quite different in terms of their construction. The climactic conditions at these locations are also

very different. The subsequent sections of this paper are divided into: (1) description of GPR
data collection and ground truth (2) analysis of the Wyoming data; (3) analysis of the Alaska
data; and (4) discussion of the conclusions that can be drawn from the investigations.
GPR DATA COLLECTION AND PROCESSING
The GPR data were obtained using a combination of different frequency air-launched horn
antennas mounted on the backend of a hi-rail vehicle. Two 2 GHz antennas were mounted on the
shoulders approximately 6 inches from the edge of the ties and a 500 MHz antenna was mounted
between the rails, as shown in Figure 1.
2 GHz Horn Antenna Data Processing
The 2 GHz horn antenna data were processed to calculate the extent of shoulder fouling. The
data processing methodology for the 2 GHz data, shown in Figure 2, was based on the amplitude
of the scattering from void space in clean ballast [3]. This methodology is a departure from the
traditional approach of mapping layer interfaces. An important advantage of the scattering
amplitude approach is that it can use scattering energy that arrives continuously from the surface
to the bottom of the ballast to provide inner-layer information related to fouling and moisture.
Whereas the layer tracking approach relies on the presence of or absence of reflections in the
data, which are only useful for inferring the condition of the ballast above the layer reflection if a
layer reflection exists, and the entire ballast section from top to bottom, if there is no layer
reflection [4]. The scattering amplitude approach was tested on over 238 km (148 miles) of track
with good success on tracks in Colorado, Wyoming, Nebraska, and Massachusetts [5].
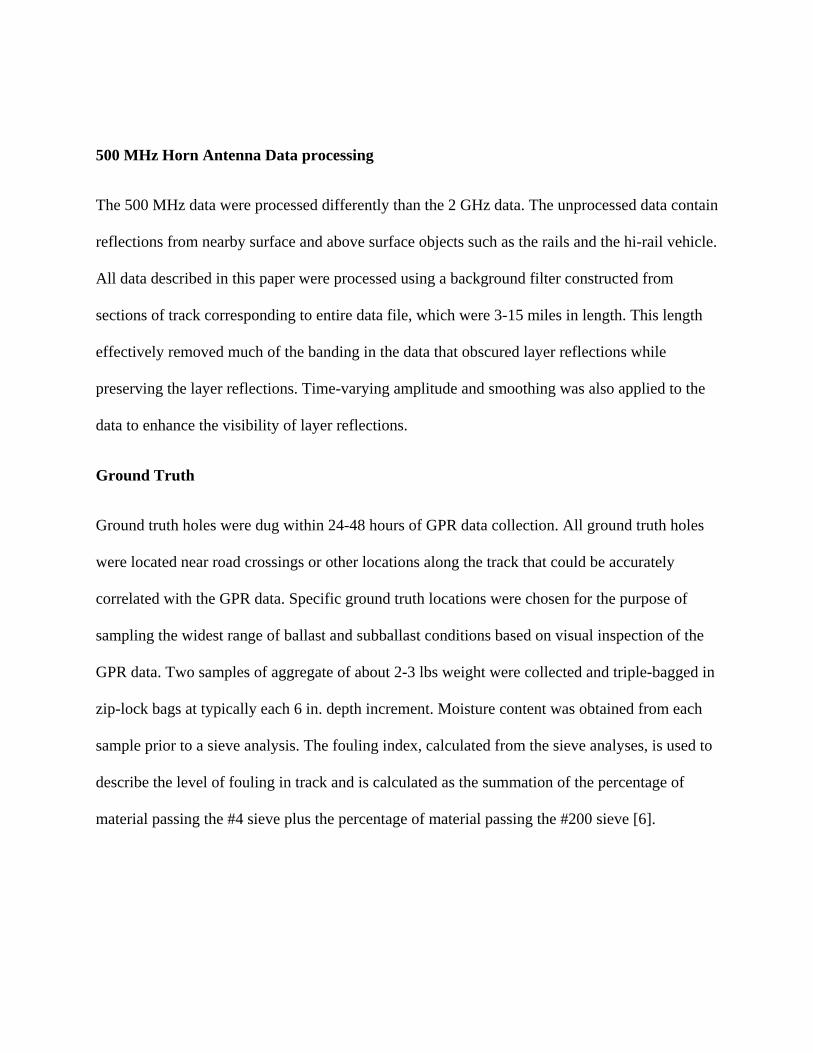
500 MHz Horn Antenna Data processing
The 500 MHz data were processed differently than the 2 GHz data. The unprocessed data contain
reflections from nearby surface and above surface objects such as the rails and the hi-rail vehicle.
All data described in this paper were processed using a background filter constructed from
sections of track corresponding to entire data file, which were 3-15 miles in length. This length
effectively removed much of the banding in the data that obscured layer reflections while
preserving the layer reflections. Time-varying amplitude and smoothing was also applied to the
data to enhance the visibility of layer reflections.
Ground Truth
Ground truth holes were dug within 24-48 hours of GPR data collection. All ground truth holes
were located near road crossings or other locations along the track that could be accurately
correlated with the GPR data. Specific ground truth locations were chosen for the purpose of
sampling the widest range of ballast and subballast conditions based on visual inspection of the
GPR data. Two samples of aggregate of about 2-3 lbs weight were collected and triple-bagged in
zip-lock bags at typically each 6 in. depth increment. Moisture content was obtained from each
sample prior to a sieve analysis. The fouling index, calculated from the sieve analyses, is used to
describe the level of fouling in track and is calculated as the summation of the percentage of
material passing the #4 sieve plus the percentage of material passing the #200 sieve [6].

ORIN SUBDIVISION DATA ANALYSIS
The Orin subdivision is located in Eastern Wyoming and is subjected to high tonnage trains
carrying coal from numerous local mines. The open boxcars of these trains are heaped with coal.
A portion of the coal piled above the top of the boxcar is often blown off as the train traverses
from the mine.
Ground penetrating radar data were obtained from July 23-26 at selected locations
between MP 0 and MP62 in the Orin Subdivision. There was significant rainfall in Gillette the
evening of July 25 and during the day July 26. The precipitation recorded at Gillette, Wyoming
Airport on the 25th and 26th was 0.29 and 0.43 in., respectively. On July 26th, most of the data
were obtained while it was raining. The rainfall was fortuitous in that it permitted data collection
under moist conditions. Historical precipitation records at Gillette airport indicate relatively dry
conditions with no rainfall events greater than 0.1 in. in the two weeks prior to data collection.
Gillette Airport is between approximately 12-62 miles from the data location area. Given that
there can be local variations in weather, it is likely, but not certain, that the moisture condition in
the ballast over the data collection area on July 23 and was much drier than after the rainfall on
the evening of July 25th and during data collection on July 26th.
The ground truth samples typically revealed well defined ballast and subballast layers.
One example of a ground truth location is shown in Figure 3. The top of the subballast layer
shown in Figure 3 was typically observed between 18-25 in. below the top of the ties. In areas
where there was clean ballast, the moisture contrast between the clean ballast and the subballast
was substantial. Correspondingly, there was typically a significant layer reflection in the GPR
data associated with the interface between the ballast and subballast.

The subgrade layer was sampled in only two of the 20 ground truth holes. At both
locations the subballast layer was approximately 10-12 in. in thickness. The ballast fouling
material was often visually identifiable as coal dust. Figure 4 shows one location near Donkey
Creek Junction where there was a 4 in. thick layer of coal dust just beneath to top of the ballast
that was not identifiable from the surface.
2 GHz Data
In Figure 5(a) the fouling depth obtained from GPR data analysis is compared with the fouling
index for each sample depth at each ground truth location. There is good agreement between the
GPR-predicted fouling depth and a fouling index greater than 20.
Experience indicates that as the fouling depth approaches the bottom of the ties, the
potential for track instability increases substantially. Given this, fouling within several inches of
the tie base would warrant attention [7]. Closer examination of Figure 5(a) shows that 9 out of
20 of the ground truth locations with a calculated GPR fouling depth have significant fouling in
the 12 in. below the top of the tie. In 7 out of those 9 instances, the GPR predicted fouling depth
was less than 12 in. Likewise, for the 10 instances where the onset of significant fouling is below
12 in., the GPR predicted fouling is greater than 12 in. in each case.
There is an obvious correlation between percent moisture and fouling index. As the
fouling index increases, the capacity to store moisture also increases. The calculated fouling
depth is compared to the percent moisture in the samples at the ground truth locations in Figure
5(b). There is a strong correlation between calculated fouling depth and the first sample
exhibiting moisture greater than 2%.

The percent moisture versus fouling index is plotted for all the ground truth samples in
Figure 5(c). There is a clear trend in increasing moisture with increasing fouling index. There is
also a wide range in moisture content, even at low fouling indexes.
Repeat data were obtained along several sections of track with one dataset prior to the
July 25-26 rainfall and the other datasets obtained during or within several hours following the
rainfall. The GPR-predicted fouling depth is compared between two datasets containing different
moisture content in Figure 6. The average GPR-calculated fouling depth along the section shown
in Figure 6 was 16.2 in. versus 12.5 in. for data obtained soon after the rainfall event.
500 MHz Data
A layer reflection was often observed in the Wyoming 500 MHz data at 10-25 in. depth. Areas
where this reflection is most visible often correspond to the cleanest ballast. At ground truth
locations where the subballast thickness could be measured, there was typically a reflection
between the subballast and subgrade interface. Exceptionally clean ballast is observed at the
ground truth location shown in Figure 7. There was a significant moisture contrast between the
ballast and subballast layers as shown in Figure 7(c). There was apparently very little moisture
contrast between the subballast and subgrade layers at the location of the ground truth hole. The
500 MHz data, shown in Figure 8, contains reflections that are in good agreement with the
locations of the layer interfaces mapped at the ground truth hole.
Layer reflections were also detectable in areas where the surface was significantly fouled.
Figure 9 shows the ground truth from a hole located on track Main 1 measured 1420 ft south of
the crossing at MP 37.8. The near-surface at this location was heavily fouled as shown in the
pictures, Figures 9(a)-(b), and the fouling index plot, Figure 9(c).

The processed 500 MHz GPR data corresponding to ground truth in Figure 8 is shown in
Figure 10. It is noteworthy that there was no discernable reflection from the ballast-subballast
interface. This is not uncommon for scenarios where there is significant fouling, which lowers
the dielectric contrast at the interface between the ballast and subballast. The depth of the
subballast-subgrade interface reflection interpreted from the GPR data, using a dielectric
constant of 8.7 for the depth calculation, corresponds well with the location observed in the
ground truth hole.
Most of the 500 MHz reflections observed in the data from Wyoming were from the
ballast-subballast and subballast-subgrade interfaces. Reflections from other, deeper, layers were
not common. However, there was a segment on track Main 2 from MP 8 to MP 14.2 where
numerous reflections extending beyond 6 ft in depth were observed. A segment of processed data
from MP 8 to MP 10 is shown in Figure 11.
ALASKA RAILROAD DATA ANALYSIS
GPR data were collected on the Alaska Railroad on August 13-15 along most of the track
between MP 115 and 203. Wood ties supported the rails under most of the data collection route.
Regularly scheduled ballast cleaning is not performed on the track. The greatest concern from a
track stability standpoint is frost heaving due to excess moisture in the track substructure. There
was significant rainfall event one evening between data collection days. Rainfall records were
obtained from two private weather stations located within 4 miles of the track between MP 154
and MP160. The weather stations recorded 0.29 and 0.5 in. of rainfall on the evening of August
14th. There was existing moisture in the ballast layer prior to the rainfall on the evening of

August 14th. One of the local weather stations reported approximately 0.5 in. of rainfall 10 days
prior to data collection. No prior rainfall data were available from the other weather station.
Ground truth holes were dug concurrent with the data collection. The most distinctive
feature observed in most ground truth holes was a layer of blue-gray stone varying from 18-24
in. in depth. This stone layer typically yielded a lower fouling index and correspondingly lower
moisture content than the ballast above and subballast or subgrade below.
2 GHz Data
The processed GPR data indicated that the shoulder ballast was fouled along most of the data
collection route. Pre-processed and fully processed 2 GHz data are presented in [8]. In Figure
12(a) the fouling depth obtained from GPR data analysis is compared with the fouling index for
each sample depth at each ground truth location. There is, in general, good agreement between
the GPR-predicted fouling depth and the onset of significant fouling.
Close examination of Figure 12(a) reveals that 8 out of 20 of the ground truth locations
have significant fouling less than 12 in. below the top of the tie. In 7 out of those 8 instances, the
GPR predicted fouling depth was less than 12 in. Likewise for the 12 instances where the onset
of significant fouling is 12 in. or greater, the GPR predicted fouling is greater than 10 in. in
seven cases and 9 in. or greater in 3 out of the remaining 5 cases. The calculated fouling depth is
compared to the percent moisture in the samples at the ground truth locations in Figure 12(b).
There is good correlation between calculated fouling depth and the first sample exhibiting
moisture greater than 2%.

The percent moisture is plotted with fouling index for all the ground truth samples in
Figure 12(c). There is a clear trend in increasing moisture versus increasing fouling index. There
is a nearly linear trend between moisture content and fouling up to fouling indexes 50 and
greater. This is quite different than the relationship observed from the Wyoming samples.
Repeat data were obtained along sections of track prior to the August 14th evening
rainfall and the day following the rainfall. The GPR-predicted fouling depth is compared
between the repeat datasets in Figure 13. The average GPR-calculated fouling depth along the
section shown in Figure 13 was 10.5 in. versus 10.6 in. for data obtained soon after the rainfall
event. There was evidently very little sensitivity in the GPR-calculated fouling depth to the
previous evening’s precipitation event.
500 MHz Data
A layer reflection was often observed in the 500 MHz data at 15-25 in. depth. A comparison
between the 500 MHz data and ground truth indicates this reflection is likely associated with a
moisture increase at the bottom of a blue-gray stone layer. A good example of this layer
reflection is shown in Figure 14. A shallow reflection less than 25 in. in depth was generally
most prominent in the data from MP 115-132, which corresponds to a section of track with
generally clean ballast. This is anticipated because there would be a greater moisture contrast
between clean ballast and subballast.
There were numerous sections of 500 MHz data that contained high subballast or
subgrade reflections at depths 3-7 ft. These high amplitude reflections are typically associated
with a material change that traps moisture. One example of these high amplitude regions is

shown in Figure 15(a) below. Figure 15(b) shows the location of the high amplitude reflections
overlaid on Google Earth. The figure reveals a lake located close to the track.
DISCUSSION
The 2 GHz data obtained on the shoulders of the Alaska and Orin Subdivision railroads
compared favorably with available ground truth. The GPR predicted fouling depth generally
corresponded to ballast depths where the fouling index was greater than 20. There was also an
observed relationship between the GPR-predicted fouling depth and percent moisture. Both
increasing percent moisture and increasing fouling contribute to greater GPR wave attenuation,
which results in a lower calculated fouling depth.
Plots of the percent moisture versus fouling index from the Alaska samples showed a
nearly linear correlation. This type of trend was also observed in ballast samples obtained at the
Transportation Technology Center Inc (TTCI) [3]. The Alaska and TTCI samples contained a
moisture content that rarely exceeded 15x (i.e. fifteen times) the fouling index for fouling
indexes greater than 20. The maximum percent moisture between fouling indexes of 20 and 30
did not exceed 4% at those other locations. This is in great contrast to the Wyoming samples.
There were several Wyoming samples with fouling indexes between 20 and 30 that possessed
percent moisture over 8%. Although compositional analyses were not performed on the
Wyoming samples, it is likely that the cause for this is the high absorption ability of coal dust
[9]. The higher absorption capacity of coal dust would likely influence the GPR-calculated
fouling depth depending on the precipitation. The observed differences between GPR-calculated
fouling depth prior to and immediately following the rainfall in Wyoming are also likely tied to
coal dust fouling considering that there was very little sensitivity to precipitation observed in the

Alaska data. The effects of precipitation will be more clearly understood once a large enough
database of repeat GPR data is obtained and compared to known precipitation histories and
ballast fouling material composition at the data collection areas.
The 500 MHz data obtained in Wyoming often contained identifiable layer reflections
associated with well-constructed ballast and subballast layers. Whereas the 500 MHz data from
Alaska revealed numerous localized anomalous high amplitude reflections and rarely a
subballast-subgrade reflection.
SUMMARY
Over 250 miles of GPR data were obtained on two railroad corridors located in distinct
geological sections with contrasting track structure and climate. Twenty ground truth holes were
hand dug on each track. Samples from the holes were analyzed for moisture content and fouling
index. The 2 GHz GPR data obtained on the shoulders were processed to calculate the fouling
depth. There was good agreement between the GPR-calculated fouling depth and ground truth.
Repeat data obtained with different moisture conditions revealed little sensitivity to recent
precipitation in the Alaska data and noticeable differences in the Wyoming data. The high
moisture capacity of the coal dust fouling the ballast is likely the reason for the sensitivity to
precipitation observed in the Orin Subdivision data. The processed 500 MHz data at both
locations revealed identifiable layer reflections within the track substructure that correlated with
the ballast-subballast interface, the subballast-subgrade interface, or revealed suspected high
moisture areas in the subgrade.

ACKNOWLEDMENTS
This work could not have been performed without the generous help of numerous individuals
from BNSF and Alaska Railroad. At BNSF, Hank Lees, Mark Meyer, and Mike Kline made key
contributions in obtaining both the GPR and ground truth. In Alaska, Steve Pfeiffer and Lloyd
Tesch coordinated the data collection. Other Alaska railroad employees assisted in the data
collection and mobilization. James Meister and Wei Xie from the University of Illinois collected
the Alaska ground truth samples. Ted Sussmann from Volpe Center assisted in the Alaska GPR
and ground truth data collection. The ground truth samples were analyzed for moisture content
and aggregate size distribution by Zach Dombrow and Hai Huang from the University of Illinois.
This research was partially funded by Federal Railroad Administration Project DTFR53-
05-D-00200.
REFERENCES
[1] Railway Track & Structures Magazine, June 1985.
[2] Hyslip, J.P., Olhoeft, G.R., Smith, S.S., and Selig, E.T., 2005, Ground Penetrating Radar for
Track substructure Evaluation, FRA/ORD-05/04, Federal Railroad Administration, 48p.
[3] Roberts, R., Al-Qadi, I., Tutumluer, E., Boyle, J., and Sussmann, T., 2006, “Advances in
Railroad Ballast Evaluation Using 2 GHz Horn Antennas”, Proc. 11th International
Conference on Ground Penetrating Radar, June 19-22, 2006, Columbus, OH.
[4] Roberts, R., Al-Qadi, I., Tutumluer, E., Schutz, A., 2007, Characterizing Railroad Ballast
Using GPR: Recent Experiences in the United States, International Workshop on Advanced
Ground Penetrating Radar, June 27-29, 2007, Naples, Italy.

[5] Roberts, R., Al-Qadi, I., Tutumluer, E., Kathage, A., 2007, Ballast Fouling Using 2 GHz
Horn Antennas – GPR and Ground Truth Comparison from 238 Km of Track, Railway
Engineering 2007, London, UK, June 20-21, 2007.
[6] Selig, E.T. and J.M. Waters, 1994, “Track Geotechnology and Substructure Management,”
Thomas Telford Publications, London.
[7] [7] Wenty, R., 2007, Rehabilitation of Ballast and Subgrade, Proc. 2007 AREMA Annual
Conference, Chicago, Illinois, September 9-12, 2007.
[8] Roberts, R., Al-Qadi, I., Tutumluer, E., 2008, Railroad Structure Characterization using GPR
in Alaska: A Case History, Proc. 12th International Conference on Ground Penetrating Radar,
June 16-19, 2008, Birmingham, UK.
[9] Tutumluer, E., Dombrow, W., Huang, H., 2008, Laboratory Characterization of Fouled
Ballast Behavior, Proc. 2008 AREMA Annual Conference, Salt Lake City, Utah, September
21-24, 2008.

Figure 1. GPR data collection setup. A 500 MHz antenna was mounted between the rails. Two-
GHz horn antennas were mounted on the shoulders.

2 GHz Horn Data Interpretation:Concentrate on Scattering from Voids
Clean Ballast
Mostly Clean Ballast
Fouled Ballast or Subballast
Subgrade
Ballast Cross-section Color Transform of processed data
ScatteringAmplitudeEnvelope
Figure 2. Two GHz horn antenna data processing approach which utilitzes the information
provided by scattering from the voids within clean ballast.

Coal Dust
Figure 3. Typical ground truth hole from the Orin Subdivision track. The pink material at
bottom of hole is the top of the subballast. A thin layer of coal dust is observed at the top of the
subballast.

(a) Surface at Donkey Creek Junction (b) Coal dust just beneath top of ballast
Figure 4. Donkey Creek Junction ground truth location exhibiting no fouling based on surface
inspection, but a 4 in. thick layer of coal dust just beneath the top of the ballast.

(a) GPR-predicted fouling depth vs. fouling depth (b) GPR-predicted fouling depth vs. percent moisture
(c) Percent moisture vs. Fouling Index for each sample
Figure 5. Examination of the relationship between GPR predicted fouling depth, percent
moisture, and fouling index: (a) comparison of GPR-predicted fouling depth versus fouling
index; (b) comparison of GPR-predicted fouling depth versus percent moisture; and (c) percent
moisture versus fouling index.

Figure 6. Comparison of GPR-calculated fouling depths from MilePost 44-48 on main track 2
prior to and following rainfall (0.3 -0.5 in).

(a) Location of ground truth (b) Cross-section of hole
(c) Plot of Fouling index (red) and percent moisture (blue) for each ground truth sample.
Visual Measurements: Ballast thickness: 24” Coal dust in ballast 21‐24” Subballast thickness: 11.5”
Figure 7. Ground truth of hole dug on track Main 3 at MP 52 +286 ft.

(a) Processed 500 MHz GPR data at core location. Note, ground truth hole dug on shoulder and 500 MHz data obtained between rails.
(b) Interpreted 500 MHz GPR data at core location. Relative permittivities used for ballast and subballast layers were 4 and 6.5, respectively.
Ground Truth Location
Figure 8. 500 MHz GPR data: (a) processed and (b) interpreted at a ground truth location on
track Main 3, MP 52+236 ft. Mapped layers in (b) are in good agreement with the actual
locations of the ballast-subballast and subballast-subgrade interfaces.

(a) Ground truth location (b) Ground truth hole
(c) Plot of Fouling index (red) and percent moisture (blue) for each ground truth sample.
Visual Measurements: Ballast thickness: 18.5” Subballast thickness: 10”
Figure 9. Ground truth at hole dug on track Main 1 at the crossing at MP37.8 + 1420 ft.

(a) Processed 500 MHz GPR data at core location. Note, ground truth hole dug on shoulder and 500 MHz data obtained between rails.
(b) Interpreted 500 MHz GPR data at core location. Relative permittivitiy used for ballast and subballast layers was 8.7.
Ground Truth Location
Ground Truth Location
Figure 10. Processed (a) and interpreted (b) 500 MHz GPR data at ground truth location on track
Main 1, crossing at MP37.8 + 1420 ft south. Mapped layers in (b) are in good agreement with the
actual locations of the ballast-subballast and subballast-subgrade interfaces.

Figure 11. Processed 500 MHz data from MP 8.0 – 10.0 on track Main 2. Reflections from layers
along this segment extend beyond 1.8 m (6 ft) in depth. A relative permittivity of 6.25 was used
to calculate depth from two-way travel time.

(a) GPR-predicted fouling depth vs. fouling depth (b) GPR-predicted fouling depth vs. percent moisture
(c) Percent moisture vs. fouling index for each sample
Figure 12. Examination of the relationship between GPR predicted fouling depth, percent
moisture, and fouling index: (a) comparison of GPR-predicted fouling depth versus fouling
index; (b) comparison of GPR-predicted fouling depth versus percent moisture; and (c) percent
moisture versus fouling index.

Figure 13. Comparison of GPR-calculated fouling depths from MilePost 44-48 on main track 2
prior to and following rainfall (0.3 -0.5 in).

(a) Picture of ground truth location (b) Sieve and moisture analyses of samples
(c) Processed 500 MHz data. Note the strong reflection at 50‐65 cm (20‐25 in) depth.
Sample location (sample obtained outside edge of ties and 500 MHz data obtained between rails)
Reflection likely associated with bottom of blue‐gray stone
Figure 14. Comparison between 500 MHz data and ground truth at one location.
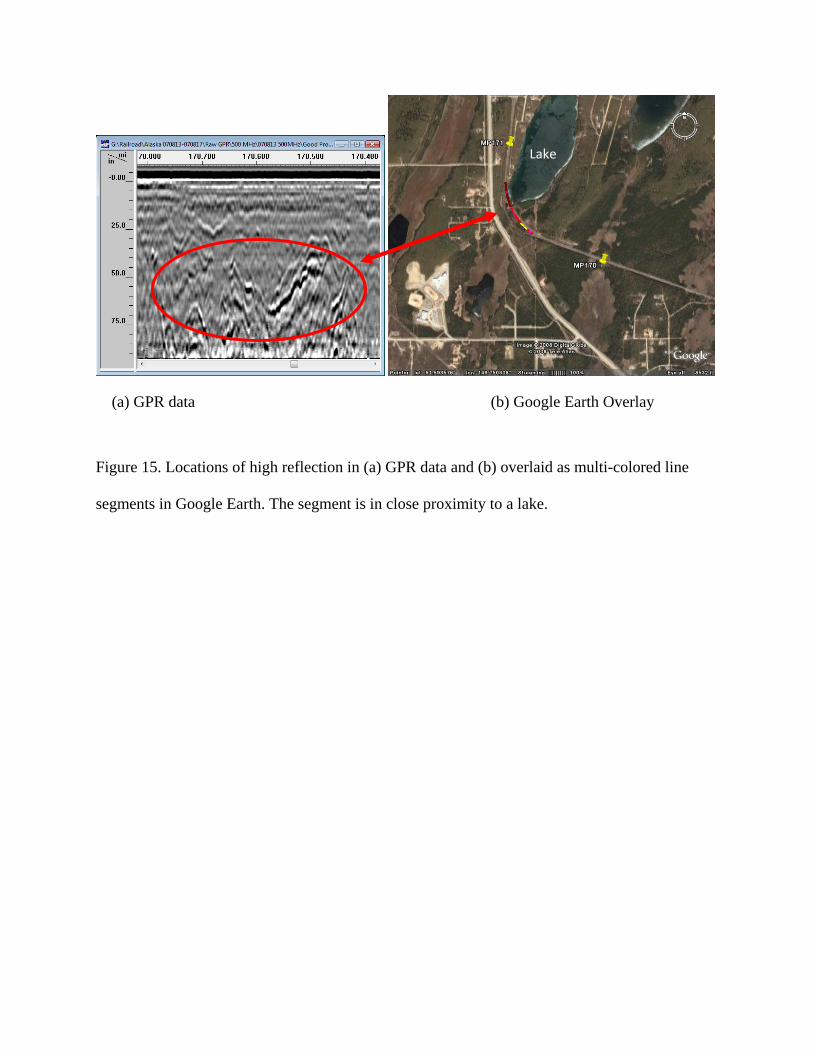
Lake
(a) GPR data (b) Google Earth Overlay
Figure 15. Locations of high reflection in (a) GPR data and (b) overlaid as multi-colored line
segments in Google Earth. The segment is in close proximity to a lake.