tracer investigation of ground water direction and flow velocity in the field of drainage system...
TRANSCRIPT

TRACER INVESTIGATION OF TRACER INVESTIGATION OF GROUND WATER DIRECTION AND GROUND WATER DIRECTION AND FLOW VELOCITY IN THE FIELD OF FLOW VELOCITY IN THE FIELD OF DRAINAGE SYSTEM INTERACTIONDRAINAGE SYSTEM INTERACTION
Wojciech Sołtyk, Andrzej Dobrowolski,Wojciech Sołtyk, Andrzej Dobrowolski,
Robert Zimnicki, Andrzej OwczarczykRobert Zimnicki, Andrzej Owczarczyk
Institute of Nuclear and Chemistry Technology, Department of Nuclear Methods of Process
Engineering, Dorodna 16 street, 03-195 Warsaw, Poland

AbstractAbstract
The multiwell tracer technique has been used for
determination of groundwater flow direction and velocity in
selected regions of drainage barrier around the salt dome Dębina
localized between two lignite exploited deposits in fields Bełchatów
and Szczerców. The uranine water solutions has been used as a
tracer. Twelve experiments have been carried out in the period
2002 – 2004. The depth of injection wells was from 180 to 345
meters, distance between injection point and observation pumped
wells was from 32 to 235 m. Observation time in individual
experiments differs from 990 to 1730 hours.

Any study of ground water usually needs determination of flow direction and velocity.
Two well mode tracer experiments are one of the possible resolution of the problem [1, 2]. The salt dome “Dębina” has divided the “Bełchatów” lignite deposit into two parts. The first, Bełchatów Field, which is actually being exploited, and second – Szczerców Field just started to be prepared for future exploitation (Fig.1).
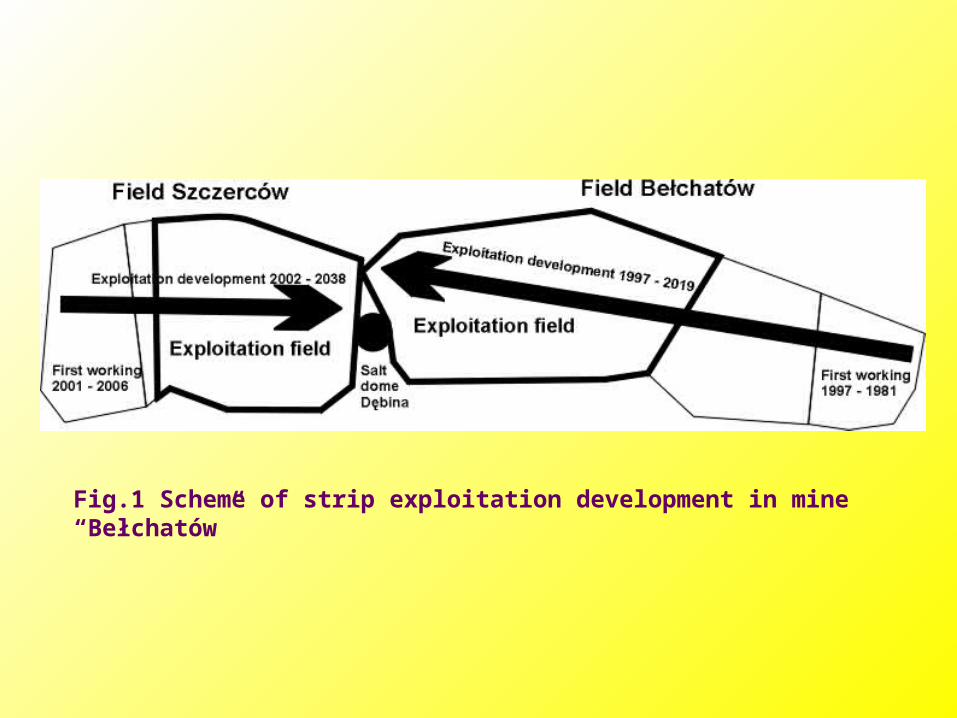
Fig.1 Scheme of strip exploitation development in mine “Bełchatów”

The salt dome drainage protection barrier
consists of 40 wells (250 m deep) localized around the
salt deposit. The system has been successfully exploited
since 1992. The main aim of the system is the
elimination of ground water flow through the salt
deposit sphere to avoid its dissolution and to prevent
contamination of mine ground waters by brines.
The basic condition of the system is to keep the
depression at the stable level.

The existing barrier fulfilled very well its aims during the past 10 years. At present, when simultaneously with the Bełchatów Field exploitation, preparation works of the Szczerców Field have begun, the efficiency of depression protection barrier of salt dome should to be increased (probably by a second ring of pumping wells localized outside the actually working barrier). Therefore, before starting the design process and build-up a new drainage system, an investigation on aquifer characteristic should be performed. The main problem is to determine hydrological conditions in the south-west part of the salt dome foreland as well as to estimate necessary input data for actualization of the hydrogeological model of the region.

The aqueous solution of uranine has been used as
tracer in all experiments. The injection piezometers and
observation pumped wells have been chosen on the basis of
the existing system of protection barrier around the salt
dome “Dębina” (Fig.2).
The tracer has been injected strictly to the filtrated
zone of each investigated wells (32 – 375 m below ground
level). After uranine injection has been done the well was
filled with 0.4 – 2.5 m3 of water causing the tracer to
investigate the aquifer strata. The observations of tracer
appearance in the samples taken from neighboring wells was
carried out during the period from 40 to 72 days.

Uranine injectionUranine injection
1. Injection of uranine solution strictly to filtrated area of
piezometer ( 32 - 375 m below ground level ),
2. Filling the piesometer with water - forsing the tracer to
penetrate the investigating aquifer area,
3. Taking samples from neighbourning pumping wells
( experimented period 40 - 72 days ),
4. Florimetric measurements

Fig.2 Localization of experiments
0
2
0
3
0
0
vx4
1
exp
xv4
1,
vxttD
tt
ttDt
tDE
0
;1
vx t
t
Pe
D
0
00
)(
)(
dttC
dttCt
t
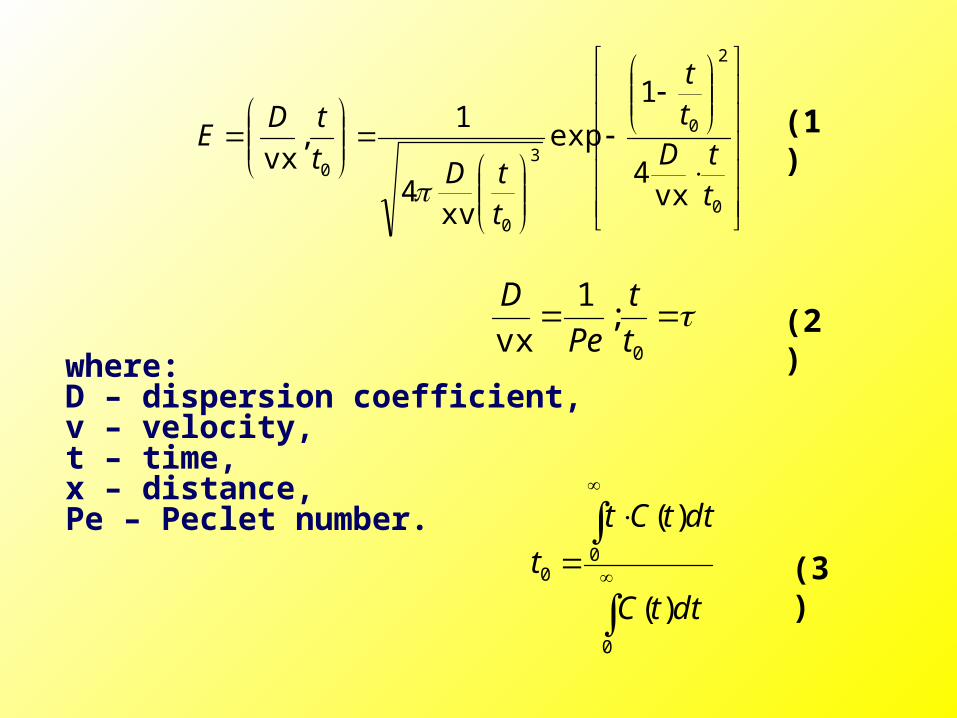
where:D – dispersion coefficient,v – velocity,t – time,x – distance,Pe – Peclet number.
(1)
(2)
(3)


Experiment 1Experiment 1
0,0
10,0
20,0
30,0
40,0
50,0
60,0
70,0
0 240 480 720 960 1200 1440 1680 1920
Time [ h ]
Con
cen
trat
ion
[a.
u.] 35 SD-2
Background
Fig.3 Tracers concentration changes in well 35SD-2 experimental and model curves

Fig.4 Concentration of the tracer in the well 35SD-2

Experiment 2Experiment 2
Fig.5 Concentration changes in the well 24SD experimental and model curves

ConclusionConclusion
So, the individual interpretation of
the obtained tracer response curves enables to
determine the mechanism of water transport, its
velocity and direction as well as longitudinal
dispersion coefficient.