trace analysis of dioxins and dioxin-like pcbs using - diva
TRANSCRIPT

Trace analysis of dioxins and dioxin-like PCBs using comprehensive two-dimensional gas chromatography
with electron capture detection
av
Conny Danielsson
Akademisk avhandling
som med vederbörligt tillstånd av rektorsämbetet vid Umeå Universitet för avläggande av filosofie doktorsexamen vid Teknisk-Naturvetenskapliga
fakulteten i Umeå, framlägges till offentligt försvar vid Kemiska Institutionen, hörsal KB3B1, KBC-huset, fredagen den 19 Januari, 2007, klockan 10.00.
Avhandlingen kommer att försvaras på engelska.
Fakultetsopponent: Dr. Jean-Marie Dimandja, Department of Chemistry, Spelman College, Atlanta, GA, USA.
Department of Chemistry, Environmental Chemistry Umeå University
Umeå 2007

UMEÅ UNIVERSITY DOCTORAL DISSERTATION Department of Chemistry SE-901 87 Umeå University January 2007 Conny Danielsson
Trace analysis of dioxins and dioxin-like PCBs using comprehensive two-dimensional gas chromatography with electron capture detection
Abstract Polychlorinated dibenzo-p-dioxins (PCDDs) and dibenzofurans (PCDFs), two groups of struc-turally related chlorinated aromatic hydrocarbons, generally referred to as “dioxins” are of great concern due to their extreme toxicity and presence in all compartments of the environment. Since they occur at very low levels, their analysis is complex and challenging, and there is a need for cost-efficient, reliable and rapid analytical alternatives to the expensive methods in-volving use of gas chromatography high-resolution mass spectrometry (GC-HRMS). It is im-portant to routinely monitor food and feed items to detect contaminations at an early stage. For the regulation of dioxins and dioxin-like PCBs in food and feed according to current legis-lation, large numbers of samples have to be analysed. Furthermore, soils at many industrial sites are also contaminated with dioxins and need remediation. In order to optimize the cost-efficiency of reclamation activities it is important to acquire information about the levels and distribution of dioxins in the contaminated areas. The aim of the studies underlying this thesis was to investigate the potential of comprehen-sive two-dimensional gas chromatography with a micro-electron capture detector (GC × GC-µECD) as a cost-effective method for analysing dioxins and dioxin-like PCBs in food, feed, fly ash and contaminated soils. Quantification studies of dioxins and dioxin-like PCBs were con-ducted and results were compared with GC-HRMS reference data. Generally, there was good agreement between both the congener-specific results and data expressed as total toxic equiva-lents (TEQs). The developed GC × GC-µECD method meets the European Community (EC) requirements for screening methods for control of dioxins and dioxin-like PCBs in food and feed. The presented results also indicate that GC × GC-µECD has potential to be used as a routine method for the congener-specific analysis of 2,3,7,8-PCDD/Fs and dioxin-like PCBs in matrices such as food and feed, fly ash and soil. However, to fully exploit the potential of the GC × GC-µECD technique, it should be combined with a fast and cost-efficient sample preparation procedure. Therefore, a number of certified reference materials (CRMs) were extracted using a new shape-selective pressurized liquid extraction technique with integrated carbon fractionation (PLE-C), and the purified extracts were analysed for PCDD/Fs using GC × GC-µECD. The results compared well with the certified values of a fly ash and a sandy soil CRM, but they were much too high for a com-plex clay soil CRM. It was concluded that this combination of techniques was very promising for screening ash and highly permeable soils. Further assessments and method revisions are still required before GC × GC-µECD can be used on a routine basis, and available software packages need to be refined in order to accelerate the data-handling procedures, which currently restrict the sample throughput.
Key words: Comprehensive two-dimensional gas chromatography, GC × GC, µECD, PCDDs, PCDFs, dioxins, dioxin-like PCBs, Pressurized liquid extraction, PLE, PLE-C, food, feed, fly ash, soil Language: English ISBN: 91-7264-234-3 Number of pages: 43 + 6papers

Trace analysis of dioxins and dioxin-like PCBs using comprehensive two-dimensional gas chromatography
with electron capture detection
Conny Danielsson
Department of Chemistry, Environmental Chemistry Umeå University
Umeå 2007

Department of Chemistry, Environmental Chemistry Umeå University SE-901 87 Umeå, Sweden
Copyright © 2006 by Conny Danielsson
ISBN 91-7264-234-3 Printed in Sweden by Solfjädern offset, Umeå 2006

i
CONTENTS
LIST OF PAPERS ii
LIST OF ABBREVIATIONS iii
1. INTRODUCTION 1
2. DIOXINS 5
3. PCBs 9
4. ANALYSIS 13
Introduction to POP analysis 13
Extraction, clean-up and fractionation 14
GC-separation and detection 17
5. COMPREHENSIVE TWO-DIMENSIONAL GAS CHROMATOGRAPHY 20
General principle of GC × GC 20
Modulators and detectors for GC × GC 24
Analysis of dioxins and dioxin-like PCBs using GC × GC 26
Quantification and Calibration 30
Quality of GC × GC-µECD data 31 6. CONCLUSIONS AND FUTURE PROSPECTS 33 ACKNOWLEDGEMENTS 34 REFERENCES 35

ii
LIST OF PAPERS This thesis is based on the following papers, which will be referred to by their respective roman numerals.
I. Mikael Harju, Conny Danielsson and Peter Haglund. Comprehensive two-dimensional gas chromatography of the 209 PCBs.
Journal of Chromatography A, 1019 (2003) 111-126 II. E. Maria Kristenson, Peter Korytár, Conny Danielsson, Minna Kallio, Menno
Brandt, Jani Mäkelä, Rene J.J. Vreuls, Jan Beens and Udo A.TH.Brinkman. Evaluation of modulators and electron-capture detectors for comprehensive two-dimensional GC of halogenated organic compounds. Journal of Chromatography A, 1019 (2003) 65-77
III. Peter Korytár, Conny Danielsson, Pim E.G. Leonards, Peter Haglund, Jacob De Boer and Udo A.Th. Brinkman.
Separation of seventeen 2,3,7,8-substituted polychlorinated dibenzo-p-dioxins, and dibenzofurans and twelve dioxin-like polychlorinated biphenyls by comprehensive two-dimensional gas chromatography with electron captive detection.
Journal of Chromatography A, 1038 (2004) 189-199 IV. Conny Danielsson, Karin Wiberg, Sture Bergek, Peter Korytár, Udo.A.Th. Brink-
man and Peter Haglund. Trace analysis of polychlorinated dibenzo-p-dioxins, dibenzofurans and WHO poly-chlorinated biphenyls in food and feed using comprehensive two-dimensional gas chromatography with electron capture detection Journal of Chromatography A, 1086 (2005) 61-70
V. Conny Danielsson, Karin Wiberg and Peter Haglund. Congener-specific analysis of polychlorinated dibenzo-p-dioxins and dibenzofurans in
fly ash using comprehensive two-dimensional gas chromatography with electron cap-ture detection. Manuscript
VI. Conny Danielsson, Erik Spinnel and Peter Haglund. Analysis of dioxins in soil and fly ash using pressurized liquid extraction with an inte-grated carbon trap followed by comprehensive two-dimensional gas chromatography with electron capture detection. Manuscript Published papers are reproduced with kind permission from their respective journals.
iii
LIST OF ABBREVIATIONS
1D First dimension 2D Second dimension Ah Aryl hydrocarbon ASE Accelerated solvent extraction CALUX Chemically activated luciferase gene expression CRM Certified reference material CV Coefficient of variation DDT Dichlorodiphenyltrichloroethane DIAC Dioxin Analysis by using Comprehensive Gas Chromatography DIFFERENCE Dioxins in Food and Feed – Reference Methods and New Certified Reference Materials EC European Community µECD micro Electron capture detector FID Flame ionization detector GC Gas chromatography GC × GC Comprehensive two-dimensional gas chromatography HRMS High resolution mass spectrometry LMCS Longitudinally modulating cryogenic system LOD Limit of detection LRMS Low resolution mass spectrometry IS Internal standard MAE Microwave-assisted extraction MDGC Multi dimensional gas chromatography MS Mass spectrometry m/z Mass to charge OECD Organization for Economic Co-operation and Development PBDD Polybrominated dibenzo-p-dioxin PBDF Polybrominated dibenzofuran PCB Polychlorinated biphenyl PCDD Polychlorinated dibenzo-p-dioxin PCDF Polychlorinated dibenzofuran PLE Pressurized liquid extraction PLE-C Pressurized liquid extraction with integrated carbon trap POP Persistent organic pollutant SEPA Swedish environmental protection agency SFE Super-critical fluid extraction TEF Toxic equivalence factor TEQ Toxic equivalent TOF-MS Time of flight mass spectrometry TWI Tolerable weekly intake US EPA United States Environmental Protection agency

1
1. INTRODUCTION More than 30,000 chemicals are produced and handled annually in quantities > 1 tonne in Europe; and a vast number of other substances are formed in combustion processes or as by-products when manufacturing chemicals. Some chemicals are highly reactive and can cause acute toxicity in living organisms at very low concentrations. However, such substances often have a relatively short lifetime in the environment and they primarily pose a threat to organisms liv-ing close to the source. Other compounds, like persistent organic pollutants (POPs), have been shown to be persistent, bioaccumulative and hazardous to living organisms. Despite their low vapour pressure, they can be transported long distances and become a global threat to our environment, potentially causing long-term chronic toxicity. Compounds that are lipophilic are particu-larly problematic as they tend to accumulate in fatty tissues of man and wild life and some of them even increase in concentration up through the food chain, a process known as biomagnification (Sijm et al., 1992). Environmental pollutants originating from anthropogenic activities became a public concern in the 1960s when Rachel Carson published Silent spring, referring to the si-lence in spring because no birds were singing – they had been poisoned by pes-ticides used for crop protection. Later that decade, in 1966, high levels of a new class of POPs, the polychlorinated biphenyls (PCBs), were found during chromatographic analysis of DDT and related compounds in samples from the Swedish environment (Jensen, 1966). PCBs had been produced worldwide since the late 1920s, but had never been intentionally released to the environ-ment. They were extensively used for various purposes, e.g. as dielectric fluids in capacitors and transformers, since they were resistant to high temperatures and had good insulating properties, and they must have reached the environ-ment through spillage and leakage during production and use of PCB-containing products and goods. During the same period it was realized that POPs may also be unintentionally produced during the combustion and manu-facture of various chemicals. Of these POPs, the polychlorinated dibenzo-p-dioxins (PCDDs) and dibenzofurans (PCDFs), two groups of structurally re-lated chlorinated aromatic hydrocarbons, commonly referred to as “dioxins”, are of greatest concern. A number of incidents during the late 1950s and 1970s were found to be associated with dioxins. In the US an incident known as “chick oedema disease” came to public attention in 1957 when millions of broilers died after ingesting contaminated feed (Higginbotham et al 1968; Fire-
2
stone et al., 1973). Nine years later, in 1966, it was shown that dioxins were responsible for the poisoning (Cantrell et al., 1969). Simultaneously, a dioxin-contaminated herbicide formulation “agent orange” was used by the US mili-tary in the Vietnam war to remove the leaves from trees that would otherwise have provided cover for the enemy (Boffey et al., 1971). In 1968, more than 1800 Japanese were afflicted by a disease named “Yusho” (Kuratsune et. al., 1996). Yusho means “oil disease” and it was later shown that all of the sick people had consumed the same batch of rice oil, which was contaminated by PCBs and other related substances. Many of the affected individuals showed symptoms like changes in skin and mucous membranes, increased discharges from their eyes and numbness of their limbs. Dioxins and furans can be formed as by-products in the production of PCBs and it was later postulated that poly-chlorinated dibenzofurans rather than PCBs were the causal agents of the dis-ease (Yao et al., 2002). A year after the Yusho incidence a factory in Seveso, Italy, that produced dioxin-contaminated phenoxyacetic acids exploded and dioxins were spread to the surrounding environment (Ramondetta and Re-possi, 1998). During the following weeks thousands of animals died, but in humans acute symptoms seemed to be limited to a few hundred cases of chloracne. In 1979, ten years after the Yusho incident an almost identical disas-ter with PCB-contaminated rice oil occurred in Taiwan called the Yu-Cheng incident, in which about 2000 people were intoxicated (Hsu et al., 1994). At about the same time dioxins were discovered in fly ash from Dutch and Swiss municipal waste incinerators (Olie et al., 1977; Buser et al., 1978). After the abovementioned incidents and discoveries of dioxins in fly ash the sources, formation pathways, environmental occurrence and toxicity of dioxins were thoroughly investigated. Most of the POPs were found to occur at very low levels in the environment (parts per quadrillion to parts per billion). Therefore, their analysis is complex, challenging and expensive, especially for dioxins, which today may cost as much as €1000 per sample. A method that expensive is only useful for limited studies. Hence, there is a need for cost-efficient, reliable and rapid analytical methods for measuring dioxins in the environment as well as in food and feed. This was evident during the dioxin crises in Belgium in 1999, where PCBs and dioxins were found in feed in-tended for farm animals. A company accidentally mixed transformer oil into animal fat from slaughterhouses and 60-80 tonnes of contaminated fat with 40-50 kg of PCBs and about 1 g of dioxins were produced (van Larebeke et al., 2001). The contaminated fat was then used in the production of 500 tons of animal feed, mainly for chickens. In Belgium more than 1500 farms used the contaminated feed, but farms in the Netherlands, France and Germany were also affected. During the crises the samples were initially analyzed for PCBs

3
instead of dioxins since they were cheaper and more rapid to analyze (Erickson et al., 1999). Only samples with high PCB levels were subjected to dioxin analysis. However, this approach assumes that the ratio between analysed PCBs and the dioxin content in the sample is relatively constant, which was not al-ways the case (Covaci et al., 2002). At the end of 1999, more than 55000 PCB and 500 PCDD/F analyses had been carried out and the cost of the crisis has been estimated to have been more than two billion euros (Focant et al., 2004). However, it should be noted that the dioxin crisis in Belgium was only one of many dioxin incidents in recent years. Elevated levels of dioxins were found in ball clay used for American catfish and poultry feed in 1997 (Hayward et al., 1999; Ferrario and Byrne., 2002) and, the following year, high dioxin levels were detected in milk products in Germany and were traced back to dioxin-contaminated citrus pulps from Brazil, used in feed for ruminants on a large scale (Malisch., 2000). In 2000, elevated levels of dioxins were found in a German survey programme (Llerena et al., 2003). The source of contamination was a pre-mixed animal feed additive. One of the feed ingredients was choline (vitamin B4) chloride dispersed on pine sawdust, which was contaminated with pentachlorophenol and dioxins. The choline chloride originated from Spain, where the production was immediately stopped. Thus, it is important to routinely monitor food and feed items to detect con-taminations at an early stage and to recall the contaminated products from the market. For efficient monitoring it is important to use methods that are reliable and sufficiently cost-effective to allow the required number of analyses. In an effort to meet this demand, in 2001 the European Community (EC) initiated two projects within its ‘Growth programme’, called DIAC (Dioxin Analysis by using Comprehensive Gas Chromatography) and DIFFERENCE (Dioxins in Food and Feed – Reference Methods and New Certified Reference Materials). The objectives of both of these projects were to develop and validate alternative methods for analysing PCDD/Fs and dioxin-like PCBs (also referred to as WHO-PCBs). Most of the investigated techniques were dedicated screening or confirmation methods, but one of them, comprehensive two-dimensional gas chromatography (GC × GC) could potentially be used as both a screening method and a congener-specific analytical method. It was consequently evalu-ated for all dioxins and PCBs for which the EC has set maximum levels for food and feeding stuff (Commission regulation No 199/2006), i.e. 17 PCDD/Fs and 12 dioxin-like PCBs. If it proved to be robust and reliable, it would be quite versatile since it could be used to screen for highly contami-nated samples and, at the same time, provide a congener-pattern that could be used in source identification.

4
Another screening method, the CALUX bio-assay, was tested within the DIFFERENCE project and was found to increase the number of samples that could be analysed. Only positive samples, i.e. those that exceeded the maxi-mum levels, would then have to be analysed with a confirmatory technique. In 2004 this approach was used in a Dutch food screening program and pork from some farms was found to have elevated dioxin levels. The source was later shown to be contaminated bakery waste used as feed for the pigs (Hoogen-boom et al., 2004). Thus, properly used, the screening approach can be very useful. The aim of the studies underlying this thesis was to investigate the potential of comprehensive two-dimensional gas chromatography with a micro electron capture detector (GC × GC-µECD) as a cost-effective method for analysing dioxins and dioxin-like PCBs in various matrices. In paper 1 the focus is on PCBs and on the chromatographic separation of dioxin-like PCBs from bulk CBs. Papers II and III respectively report evaluations of the potential of several modulators to improve PCB and dioxin analyses and several combinations of columns to separate dioxins and dioxin-like PCBs in GC × GC-µECD analy-ses. Paper IV describes the analysis of various matrices by GC × GC-µECD and compares the results with those obtained by gas chromatography - high resolution mass spectrometry (GC-HRMS), which served as a reference method. Paper V describes a GC × GC-µECD analysis and assignment of all tetra-octa-CDD/Fs in fly ash, and quantification of a certified reference mate-rial. Finally, in the study reported in Paper VI selective pressurized liquid ex-traction with integrated carbon trap (PLE-C) was used as a rapid extrac-tion/clean-up technique to complement the GC × GC-µECD determination of fly ash and dioxin-contaminated soils.

5
2. DIOXINS
Polychlorinated dibenzo-p-dioxins (PCDDs) and dibenzofurans (PCDFs), also known as dioxins, constitute two classes of structurally related planar tricyclic aromatic hydrocarbons. Due to their hydrophobic character, and resistance to metabolic degradation, they tend to accumulate in fatty tissues in living organ-isms, and to bind to organic matter in the environment.
12
4
3
6
7
8
9
O
OClx Cly1
2
4
3
6
7
8
9
O
OClx Cly
Clx Cly
46 O
12
37
89
Clx Cly
46 O
12
37
89
Figure1. General structures of PCDDs (left) and PCDFs (right). The PCDDs and PCDFs can be substituted with up to eight chlorines. The PCDDs consists of 75 congeners (2 mono-CDDs, 10 di-CDDs, 14 tri-CDDs, 22 tetra-CDDs, 14 penta-CDDs, 10 hexa-CDDs, 2 hepta-CDDs, and octa-CDD) and there are 135 possible congeners of PCDFs (4 mono-CDFs, 16 di-CDFs, 28 tri-CDFs, 38 tetra-CDFs, 28 penta-CDFs, 16 hexa-CDFs, 4 hepta-CDFs, and octa-CDF). The name of each congener is based on the degree and position of chlorine atoms e.g. 2,3,7,8-tetra-CDD. The numbers relate to the positions of the sub-tituents, while Greek prefixes (mono-octa) are used to indicate the degree of chlorination. All congeners are more or less lipophilic and bioaccumulative, but some of them are relatively easy to degrade. The position and degree of chlori-nation affects the rate and degree of metabolism. Fully laterally chlorinated PCDD/Fs (2,3,7,8-substituition) lack adjacent hydrogen atoms and are there-fore highly resistant to metabolism. Consequently, 2,3,7,8-substituted PCDD/Fs are usually the only congeners present in living organisms. The bio-accumulation potential of chlorinated aromatic hydrocarbons generally in-creases with the degree of chlorination. However, in some cases, the most highly chlorinated molecules are bioaccumulated less than expected. This may be due to size-limitations in cell membrane diffusion processes, or to their low water solubility limiting passage over intestinal walls. The seven 2,3,7,8-substituted PCDDs and ten 2,3,7,8-PCDFs are not only the most resistant to

6
metabolism, they are also the most toxic PCDD/F congeners. All 2,3,7,8-substituted PCDD/Fs show similar toxic properties, and the most toxic conge-ner is 2,3,7,8-TCDD. The toxic responses to dioxin exposure include chloracne, carcinogenicity, immunotoxicity, and the induction of diverse ad-verse effects in reproductive, developmental and endocrine systems. The 2,3,7,8-PCDD/Fs and non- and mono-ortho chlorinated tetra- through hepta-PCBs (described in chapter 3) exhibit similar effects and usually occur together in the environment, which complicates the evaluation of the risks they pose. To facilitate risk assessment, the concept of toxic equivalence factors (TEFs) has been developed (Safe, 1990; Van den Berg et al., 1998). TEFs can be used to establish total toxic equivalence (TEQ) values for PCDD/F mixtures present in various matrices, such as animal tissues, soils, sediments and com-bustion emissions. The TEQ is the sum of products of the individual congener concentrations and TEFs. All substances that are included in the TEF system must fulfil the following criteria: they must have structural similarities to diox-ins, bind to the Aryl hydrocarbon (Ah)-receptor and induce Ah-receptor-mediated biochemical and toxic responses. Furthermore, the compounds have to be persistent and accumulate in the food chain and the total toxicity of all the congeners has to be additive. To date, the seventeen 2,3,7,8-PCDD/Fs, four non-ortho and eight mono-ortho PCBs have been incorporated in the TEF concept. The TEF-values for both dioxins and dioxin-like PCBs have recently been re-examined and an updated TEF-scheme has been suggested (Table 1; Van den Berg et al., 2006). Generally, the TEFs of 2,3,7,8-PCDD/Fs decrease with their degree of chlorination. However, it is not easy to predict the biological effects of PCDD/Fs and WHO-PCBs on the human body, since their associated effects have been shown to be highly species-specific. The lethal dose of 2,3,7,8-tetra-CDD (TCDD) is low for guinea pigs (0.6-2.0 µg/kg); intermediate for monkeys (70 µg/kg), but rather high for hamsters (1157-5000 µg/kg) (Kociba et.al, 1982). It is therefore possible that the TEFs for humans will change in the future as more data become available. The toxic response to 2,3,7,8-substituted dioxins is mediated by a common mechanism of action involving binding to the Ah-receptor (Poland et al., 1976). The bonding between the ligand and the Ah-receptor initiates a chain of reactions leading to interactions between the Ah-receptor complex and DNA in the cell nucleus that inter alia result in the induction of a liver enzyme called cytochrome P450 1A1. The function of the Ah-receptor is not as yet fully un-derstood.

7
Table 1. WHO-TEF values for PCDDs and PCDFs Compound WHO-TEF, 1998 WHO-TEF, 2005
2,3,7,8-TCDD 1 1 1,2,3,7,8-PeCDD 1 1 1,2,3,4,7,8-HxCDD 0.1 0.1 1,2,3,6,7,8-HxCDD 0.1 0.1 1,2,3,7,8,9-HxCDD 0.1 0.1 1,2,3,4,6,7,8-HpCDD 0.01 0.01 OCDD 0.0001 0.0003 2,3,7,8-TCDF 0.1 0.1 1,2,3,7,8-PeCDF 0.05 0.03 2,3,4,7,8-PeCDF 0.5 0.3 1,2,3,4,7,8-HxCDF 0.1 0.1 1,2,3,6,7,8-HxCDF 0.1 0.1 1,2,3,7,8,9-HxCDF 0.1 0.1 2,3,4,6,7,8-HxCDF 0.1 0.1 1,2,3,4,6,7,8-HpCDF 0.01 0.01 1,2,3,4,7,8,9-HpCDF 0.01 0.01 OCDF 0.0001 0.0003 Dioxins can be formed in combustion processes, such as municipal solid waste incineration, accidental fires and backyard burnings (Olie et al., 1977; Buser et al., 1978; Lemieux et al., 2000; Lemieux et al., 2004). Dioxins have also been identified in paper products, pulp and waste from the chlorine bleaching proc-ess and organochlorine chemicals such as PCBs and chlorophenols (Kuehl et al., 1987; Hagenmaier and Brunner, 1987; Rappe et al., 1987). Since dioxins are formed during incineration processes long-range air transport is an impor-tant distribution route, and despite their low vapour pressure, dioxins have been shown to travel relatively long distances in the atmosphere and have been identified in all compartments of the environment. High levels of dioxins can also be found in soil, which has a large capacity for storing dioxins. Soil is considered the major environmental repository (Alcock and Jones, 1996; Kjeller et al., 1991). High levels of dioxins can, for example, be found in soils at industrial sites, such as former wood treatment sites where chlorophenols contaminated with dioxins were used for wood preservation. The cost of comprehensively surveying the quantities and distribution of diox-ins at a contaminated sawmill site has been estimated to be €100,000-200,000 (SEPA, 2005).
8
The fate of dioxins in the environment is determined by their physicochemical properties. In the aquatic environment, dioxins and other hydrophobic com-pounds accumulate in sediments and living organisms. High levels of PCBs and dioxins can, thus, been found in fish and fish-eating predators like seals and eagles (Riget et al., 2005; Bignert et al., 1989; Koistinen et al., 1997; Svensson et al., 1991). The European Community (EC) has proposed a tolerable weekly intake (TWI) of 14 pg WHO-TEQ/kg body weight for dioxins and dioxin-like PCBs, and exposure estimates indicate that a considerable proportion of the population have a dietary intake exceeding the TWI. The major source of POPs in hu-mans is generally dietary intake, which has been estimated to contribute more than 90% of the total exposure (Liem et al., 2000). In Europe in general, and Scandinavia in particular, fish constitute a major proportion of the dietary in-take and, hence, fish consumption is a very important dioxin exposure route. To decrease human exposure, maximum levels of dioxins in food and feed have been set by the EC (Commission regulation No 199/2006). The maximum levels in fish are exceeded for herring in the Baltic Sea (Council regulation (EC) 2375/2001, 2001; Isosaari et al., 2006). However, exclusion of fatty fish from the diet may have a negative effect on human health and thus fish with higher levels than the maximum levels may be consumed within Sweden and Finland for a transitional period, provided that consumers are informed with dietary recommendations.
9
3. PCBs
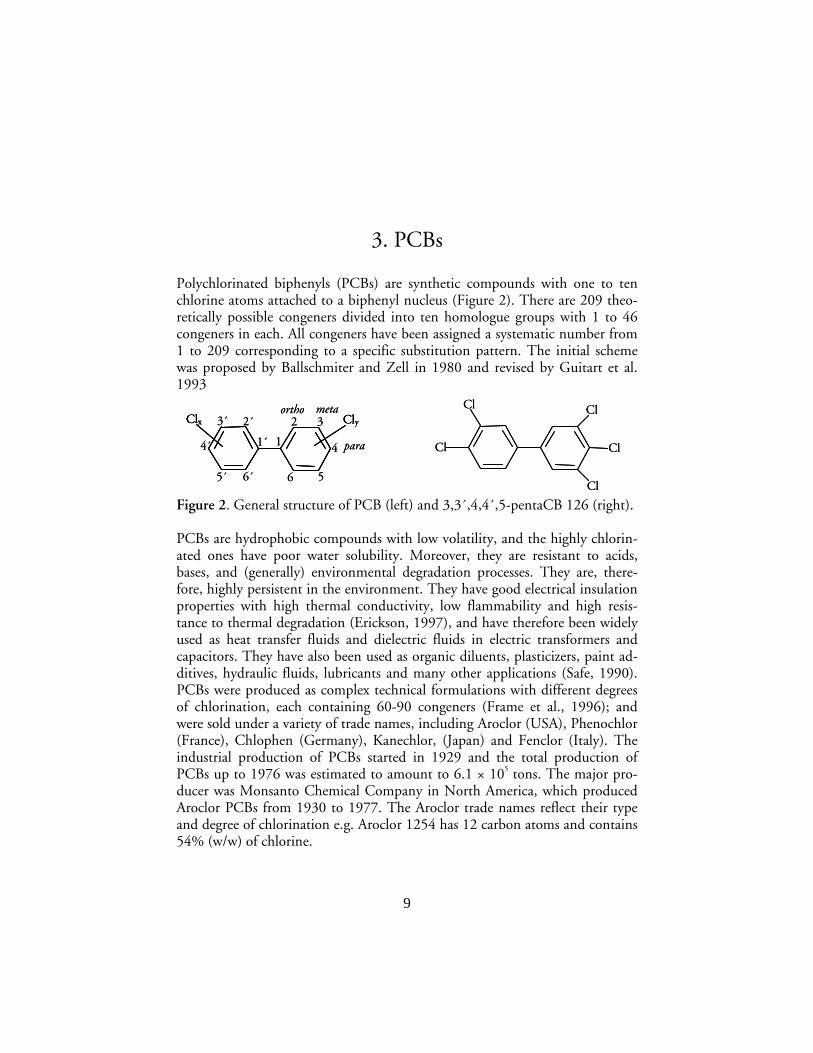
Polychlorinated biphenyls (PCBs) are synthetic compounds with one to ten chlorine atoms attached to a biphenyl nucleus (Figure 2). There are 209 theo-retically possible congeners divided into ten homologue groups with 1 to 46 congeners in each. All congeners have been assigned a systematic number from 1 to 209 corresponding to a specific substitution pattern. The initial scheme was proposed by Ballschmiter and Zell in 1980 and revised by Guitart et al. 1993
Figure 2. General structure of PCB (left) and 3,3´,4,4´,5-pentaCB 126 (right). PCBs are hydrophobic compounds with low volatility, and the highly chlorin-ated ones have poor water solubility. Moreover, they are resistant to acids, bases, and (generally) environmental degradation processes. They are, there-fore, highly persistent in the environment. They have good electrical insulation properties with high thermal conductivity, low flammability and high resis-tance to thermal degradation (Erickson, 1997), and have therefore been widely used as heat transfer fluids and dielectric fluids in electric transformers and capacitors. They have also been used as organic diluents, plasticizers, paint ad-ditives, hydraulic fluids, lubricants and many other applications (Safe, 1990). PCBs were produced as complex technical formulations with different degrees of chlorination, each containing 60-90 congeners (Frame et al., 1996); and were sold under a variety of trade names, including Aroclor (USA), Phenochlor (France), Chlophen (Germany), Kanechlor, (Japan) and Fenclor (Italy). The industrial production of PCBs started in 1929 and the total production of PCBs up to 1976 was estimated to amount to 6.1 × 10⁵ tons. The major pro-ducer was Monsanto Chemical Company in North America, which produced Aroclor PCBs from 1930 to 1977. The Aroclor trade names reflect their type and degree of chlorination e.g. Aroclor 1254 has 12 carbon atoms and contains 54% (w/w) of chlorine.
Clx Cly
1
2´ 2
1´
3´ 3
4´
5´ 6´
4
56
metaortho
para
Clx ClyClx Cly
1
2´ 2
1´
3´ 3
4´
5´ 6´
4
56
metaortho
para Cl
Cl
ClCl
Cl Cl
Cl
ClCl
Cl
10
During synthesis, congeners with chlorines in either the 2,5- or 2,4-positions are preferentially produced. PCBs with such substitution patterns, e.g. PCBs 138, 153 and 180, are therefore highly abundant in technical PCB formula-tions and the environment. Conversely, congeners that lack chlorines in ortho position, the dioxin-like PCBs, are produced in small amounts and occur at low levels in the environment. The PCBs used were mostly kept in closed systems. However, with time many of the systems broke down or were damaged by fire, but the PCBs often sur-vived and reached the environment through leakage and spillage from the vari-ous products. Furthermore, PCBs could also enter the environment through volatilization from landfills containing transformers and capacitors, and through combustion processes. The combustion products may be even more harmful than the original materials. Combustion of PCB or chlorobenzene products (such as some dielectric fluids) may produce PCDFs and PCDDs. PCBs in the environment usually originate from the commercial technical mix-tures and approximately 150 congeners have been identified at significant levels in these PCB-mixtures (Frame et al., 1996). However, the relative congener levels in the environment are not the same as in the technical mixtures. Some PCBs in technical products are easy degradable and can hardly be found in the environment, while other PCBs become more prominent higher up in the food chain. The reason for this is that the persistence of the congeners differs. Less chlorinated congeners are more readily degradable than more highly chlorin-ated PCBs. Their persistence is also dependent on the positions at which the biphenyl is chlorinated. The PCB congeners that dominate in organisms high up in the food chain lack adjacent hydrogen substituents. Generally, PCBs with high degree of chlorination are more difficult to metabolize than less chlo-rinated PCBs and thus they are over-represented in such organisms, e.g. seals (Jenssen, 1996; Blomkvist et al., 1992). The PCBs are ubiquitous environmental contaminants and have been found in all compartments of the ecosystem, including soils, air, water, sediments, wild-life and humans (Harrad et al., 1994; Iwata et al., 1993; Tanabe et al., 1987). As for the dioxins, the primary human exposure pathway appears to be through consumption of contaminated foods, particularly fish, meat and poultry prod-ucts. The toxicity of a PCB is dependent not only on the number of chlorines pre-sent in the biphenyl structures, but also on the positions of the chlorines. PCBs with many chlorines in ortho-position induce phenobarbital-type responses, while PCBs that lack chlorine atoms in the ortho-position but have chlorine

11
atoms in both para-positions (4 and 4') and at least one in meta- position (3, 5, 3', 5'), can rotate freely around the phenyl-phenyl (1,1’ bond). This means that they can exhibit structural resemblance to the dioxins, i.e. a relatively planar structure (coplanar PCBs), and may hence induce methylcholanthrene-type responses and dioxin-like toxicity (Safe, 1994). Most PCB congeners do not exhibit dioxin-like toxicity but have a different toxicological profile. The di-oxin-like PCBs (also referred to as WHO-PCBs): CBs 77, 81, 126, 169, 105, 114, 118, 123, 156, 157, 167 and 189 have been assigned WHO-TEF values (Table 2; Van den Berg et al., 2006) Table 2. WHO-TEF values for dioxin-like PCBs PCB # compound WHO-TEF, 1998 WHO-TEF, 2005 non-ortho PCBs 77 3,3´,4,4´-tetraCB 0.0001 0.0001 81 3,4,4´,5-tetraCB 0.0001 0.0003 126 3,3´,4,4´,5-pentaCB 0.1 0.1 169 3,3´,4,4´,5,5´-hexaCB 0.01 0.03 mono-ortho PCBs 105 2,3,3´,4,4´-pentaCB 0.0001 0.00003 114 2,3,4,4´,5-pentaCB 0.0005 0.00003 118 2,3´,4,4´,5-pentaCB 0.0001 0.00003 123 2´,3,4,4´,5-pentaCB 0.0001 0.00003 156 2,3,3´,4,4´,5-hexaCB 0.0005 0.00003 157 2,3,3´,4,4´,5´-hexaCB 0.0005 0.00003 167 2,3´,4,4´,5,5´-hexaCB 0.00001 0.00003 189 2,3,3´,4,4´,5,5´-heptaCB 0.0001 0.00003
The TEFs of most dioxin like-PCBs are considerably lower than those of the most toxic dioxins. However, since the PCBs are generally present at higher concentrations, they can still contribute significantly to total TEQs. The most toxic PCB congener is PCB 126, which often makes the largest contribution to the total TEQ. For example, PCB 126 alone contributed as much as 40% and 60%, respectively, of the total TEQs in fish oil and eel extracts analyzed in the study described in Paper IV. PCBs cause many different biochemical and toxi-cological responses in humans and wildlife. Reported effects include (inter alia), cancer formation and liver damage. However, the reported effects differ and seem to depend on the objectives and design of each study (Safe, 1994). Further, both additive and non-additive (antagonistic) effects have been ob-

12
served for mixtures of PCBs, and it is therefore difficult to assess their total dioxin-like toxicity. In 1973, the OECD (Organization for Economic Co-operation and Develop-ment) issued recommendations for the management of PCBs. A key suggestion was that the discharge of PCBs into the environment should be reduced by restricting their use to closed systems. The OECD also called for stringent con-trol and documentation of the production, import, export and removal of these compounds. Consequently, the use and production of PCBs are severely re-stricted or banned in many countries. For example, Sweden restricted their use nationally in 1972, and the USA stopped their production in 1977. However, no decline in PCB levels in biota was observed until the early 1990s (Bignert et al., 1998). Since then, their levels in the environment and biota have been re-duced by 50%. Nowadays PCBs can reach the environment through discharges from sludge, spillage and improper disposal of PCB-containing products. Dis-carded transformers and lubricating oils remain common sources of recurring PCB pollution. PCB fluids have also, on several occasions, been accidentally introduced into food products (van Larebeke et al., 2001).

13
4. ANALYSIS Introduction to POP analysis
To better understand the fate and effects of toxic substances, and to protect ourselves and the environment, we need to develop reliable analytical methods for measuring levels of hazardous compounds like POPs. Qualitative analysis provides information on the types of compounds that are present in a sample (characterization and identification), and quantitative analysis provides infor-mation about the amounts of selected analytes. The quantitative analysis of dioxins is particularly challenging due to their low levels and the presence of much higher levels of numerous potentially interfering compounds in envi-ronmental samples. In developing such trace-analysis methods, the individual steps, i.e. sampling, sample pre-treatment, sample preparation, separation, in-strumental determination and data evaluation, have to be carefully optimized, since all errors introduced throughout the procedure contribute to the total measurement uncertainty. It is also important to develop a sound quality con-trol protocol, including (inter alia), background control using blank samples, recovery standards for control of losses, replicate analyses for precision control, and use of certified reference materials (CRMs) for accuracy control. In addition, screening methods for food/feed control and efficient mapping of dioxins in contaminated soil also have to be cost-efficient, reliable and fast. Screening approaches often generate less accurate (semi-quantitative) results, but at lower cost than fully quantitative analyses. Validated screening methods affording high sample-throughputs could be used to identify samples with sig-nificantly elevated dioxin levels, e.g. samples with dioxin levels 30-40% above the maximum levels. Screening methods should be specifically designed to avoid false negatives. The false negative rate should be under 1% and the rate of false positives should be low enough to make use of a screening tool advan-tageous. The EC requirements for such methods, and for confirmatory (GC-HRMS) methods, which are used to validate positive samples, can be found in the European Commission (EC) directive 2002/70/EC. In recent years many attempts have been made to develop faster and automated extraction techniques to reduce the costs of dioxin analysis. A review consider-ing advances in analytical techniques for PCDD/Fs and dioxin-like PCBs has recently been published (Reiner et al., 2006) and another recent review has

14
addressed developments related to the automatic extraction and clean-up of biological samples (Focant et al. 2004). Of particular interest in this context are super-critical fluid extraction (SFE; Hawthorn, 1990; Mannila et al., 2002), microwave-assisted extraction (MAE; Eljarrat et al., 1998), and finally pressur-ized liquid extraction (PLE), which was used in the studies reported in Paper VI and described later in this chapter. Alternative detection techniques have also been developed. Bioanalytical meth-ods like CALUX (chemically activated luciferase gene expression) assays can be used to asses the total biological toxicity of a mixture (Windal et al., 2005), expressed as bioassay-TEQ. The greatest advantage of CALUX is its ability to analyze many samples in parallel. However, the data obtained provide no in-formation on congener profiles. Other approaches that have been investigated, and can provide congener-specific data comparable to GC-HRMS, include GC-low resolution (LR) MS-MS (Eppe et al., 2004), GC × GC – time-of-flight (TOF)-MS (Focant et al., 2004) and GC × GC-µECD, which will be discussed in detail in the following chapters of this thesis. Comparisons be-tween alternative determinations methods have been comprised (Focant et al., 2005; Van Loco et al., 2004). Although the new extraction and detection techniques have been proved to generate satisfactory results – for example the United States Environmental Protection agency (US EPA) approved a PLE method in 1995 (US EPA method 3545) – Soxhlet extraction is still widely used and only GC-HRMS is allowed as a confirmatory method for official EC control of dioxin levels in food and feed. Thus, further studies are needed to convince routine laborato-ries to abandon the traditional techniques in favour of new cost- and time-efficient alternatives. As well as thorough method development, optimization and performance assessments, such studies should also address investment and operating costs, the level of automation, and the possibility to include the ex-traction technique in the laboratory accreditation framework. Extraction, clean-up and fractionation
The purpose of an extraction is to efficiently extract the analytes from the sam-ple matrix. An efficient extraction requires effective desorption of the analytes from the matrix surface followed by rapid transfer of the analytes to the bulk of solvent. A close to ideal extraction is also selective, i.e. recovers nearly the full amounts of the desired analytes while co-extracting small amounts of interfer-ing compounds. In such cases, the extract can be subjected directly to instru-mental determination without further clean-up.
15
The most commonly used extraction technique for dioxins, at least for solid samples like soil, sediments and fly ashes, is Soxhlet extraction (US EPA 1994. Method 1613). The Soxhlet apparatus was introduced as early as 1879 by Pro-fessor von Soxhlet (Leipzig, Germany). The device re-circulates heated extrac-tion solvent from a round-bottom flask through the sample, which is placed in a glass or cellulose thimble in the upper part of the equipment. The solvent vapour is condensed in a cooler positioned above the extraction thimble, and solvent drips down onto the sample and leaches analytes from the sample ma-trix. As the solvent fills the extractor it also fills a siphon tube, and when the tube is full, the solvent in the upper part of the extractor is drained into the round-bottom flask. The solvent is then heated again and the cycle continuous. This process requires relatively large quantities of organic solvents and is time-consuming. In the studies described in Papers V and VI Soxhlet extractions were used to obtain reference values for dioxins in fly ash and soil. Solid samples can also be mixed with a desiccant, like sodium sulphate, and extracted at room temperature in an open gravity-fed glass column using or-ganic solvent. This is a common technique for extracting dioxins from biologi-cal samples. Like Soxhlet extraction, it requires large amounts of solvent and is time-consuming. Paper I reports the use of open columns to extract PCBs from a seal blubber sample. Pressurized liquid extraction (PLE) is a modern alternative extraction tech-nique, which was introduced by Dionex Inc. (Sunnyvale, CA, US) in 1995 under the trademark ´accelerated solvent extraction´ (ASE; Richter et al., 1996). The sample is placed in an extraction cell made of stainless steel, often mixed with a desiccant, and the cell is heated, filled with extraction solvent and pressurized. The analytes are then extracted from the solvent as it passes through the extraction cell. The elevated temperature increases diffusion rates, the solubility of the analytes and, hence, accelerates the extraction compared to Soxhlet and open column extraction. The high pressure can also facilitate ex-tractions from samples where the analytes are trapped in matrix pores. Another advantage of PLE, compared to Soxhlet extraction, is that it is easy to integrate sample clean-up within the extraction procedure, thereby saving time and costs. Recently, a number of papers have been published concerning strategies for the extraction and clean-up of POPs from food and feed using selective PLE (Bjorklund et al., 2006; Van Loco et al. 2004; Wiberg et al., 2007). They describe the use of various fat retainers, such as acidic alumina and sulphuric acid-impregnated silica, in the extraction cell. Wiberg et al. concluded that the results were of equivalent quality to those obtained by classical extraction and

16
clean-up techniques for fish oil and vegetable oil. Another paper describes the design and use of inserts that fit into ASE 300 cells, allowing a small amount of carbon material to be integrated within the extraction cell for simultaneous extraction and shape-selective fractionation of PCBs and PCDD/Fs (Sporring et al. 2003). This set-up has also been used in combination with chemically activated fluorescent gene expression (CAFLUX) cell-based bioassay detection to determine the bioassay-TEQs of fish oil and fish meal samples (Nording et al., 2005). In the study presented in Paper VI, a similar procedure was developed using ASE 200 cells (without any inserts) packed with a commercially available acti-vated carbon (Norit SA 4 PAH HF; Amersfort, the Netherlands) to extract and clean-up dioxins from soil and fly ash samples. In that study, the dioxin meas-urements were made using GC × GC-µECD. However, if traditional (non-selective) extraction techniques are used, the sam-ple extracts require extensive clean-up prior to the instrumental determination. Biogenic material, fat and other possible interfering compounds have to be removed to decrease chemical noise and avoid interfering compounds coeluting in the instrumental analysis. Open column absorption chromatography on sorbents such as silica, alumina and Florisil are widely used for cleaning-up extracts for analysis of POPs. The majority of procedures for dioxin analyses are based on techniques presented by Smith and Stalling (Smith et al., 1984). These involve use of multi-layer silica columns to remove lipids and other oxi-dizable components, sometimes followed by an alumina column fractionation. This results in a fraction enriched in non-polar persistent compounds that has to be further purified using activated carbon fractionation, which separates the PCDDs, PCDFs, and planar PCBs, from the bulk of the PCBs and other po-tentially interfering compounds. The carbon is usually mixed with celite due to the very strong retention properties of activated carbon and to obtain a suitable porosity. In the studies described in Papers IV, V, and VI, sample clean-up was per-formed as follows. First, samples were passed through a multilayer silica col-umn containing, from the bottom: glass wool, 36% KOH-silica (w/w), neutral silica, 40% H2SO4-silica (w/w) and Na2SO4. The next step was fractionation by activated carbon (AX-21) mixed with Celite in the proportions 7.9/92.1(w/w). The extracts were transferred to the carbon column by 3 x 1 ml n-hexane and eluted with 30 ml n-hexane (fraction 1) followed by 40 ml n-hexane/DCM, 1/1 (v/v; fraction 2) and then back-flushed with 40 ml toluene (fraction 3). Most of the PCBs eluted in fraction 1, the mono-ortho PCBs in fraction 2,

17
then dioxins and non-ortho PCBs in fraction 3. During the extraction, clean-up and solvent reduction steps, significant losses of analytes can occur, but the losses can be accounted for by using internal standards (IS), which also can compensate for variations in injection volumes, instrument responses, etc. An ideal IS should behave like the target analytes throughout the analytical proce-dure. Preferably, a stable isotope analogue of each analyte should be used. Thus, when using GC-HRMS for analyzing dioxins the isotope-dilution tech-nique is the obvious choice. When developing methods that can give precise and accurate congener-specific determinations of 2,3,7,8-substituted PCDD/Fs at very low levels, it is essential to use 13C-labelled standards of all 2,3,7,8-substituted PCDD/Fs and to assess their accuracy using appropriate (CRMs). Since the ECD cannot differentiate 13C-labelled standards from natural ana-logues other internal standards have to be used for GC × GC- µECD. For the analysis of biological samples, non-2,3,7,8-substituted PCDFs are suitable since they do not normally occur in such samples. Two ISs, 1,2,3,4-TCDD and 1,2,3,6,7,9-HxCDD, have been used in analyses of fish oil, vegetable oil, eel, and milk with good results (Paper IV). However, since these compounds may be present in abiotic samples, alternative ISs had to be found for analyses of abiotic matrices. The ISs evaluated in Paper VI were, 2,7/2,8-dibromodibenzo-p-dioxin (2,7/2,8-DiBDD), 2,3,7,8-tetrabromodibenzo-p-dioxin (TBDD) and 2,3,7,8-tetrabromodibenzofuran (TBDF). The results showed that it is not straightforward to resolve all of these compounds from interfering matrix con-stituents. In future analyses of matrices with high levels of interfering sub-stances, such as complex soil samples, I would recommend the use of addi-tional ISs, e.g. other PBDD/Fs, to ensure that there is always an adequate number of ISs that are free of interferences. GC-separation and detection
In GC an aliquot of the sample is injected, vaporized, and then carried through a capillary column by an inert gas like helium or hydrogen. The separation on the capillary column is based on differences in the partitioning of analytes be-tween the gaseous mobile phase and a liquid phase with a high boiling point on the inner wall of the column. Today, diverse column phases are available, rang-ing from low-bleed non-polar methylpolysiloxane phases, through moderately polar phases, to very polar cyanopropylpolysiloxane and shape-selective phases based on cyclodextrins or liquid crystals. After the separation on the capillary column, the compounds in the eluent reach the detector, which responds by generating a concentration-proportional signal. The electron capture detector is a type of ionization detector that is widely used in analyses of environmental pollutants like pesticides and PCBs (Poole and
18
Poole, 1991). In contrast to other types of ionization detector, a decline in the detector background current is measured rather than an increase in the number of ions or electrons generated. It is especially sensitive to halogenated, or-ganometallic, and nitrogen-containing compounds. A radioactive foil made of 63Ni emits β--irradiation (beta electrons), which ionizes the make-up gas mole-cules (commonly N2 or 5-10% methane in argon), thereby forming a plasma of positive ions, radicals and thermal electrons. Following the application of a potential to the detector cell the thermal electrons are extracted and measured. This yields a background current that constitutes the baseline for all measure-ments. When an electron-capturing compound enters the cell it captures ther-mal electrons, and reduces the detector current. Modern ECD systems operate with a pulsed voltage, i.e. in the frequency modulated mode and, rather than quantifying the cell current, the detector current is fixed to a reference current value, and the frequency of the pulses is changed so that the difference between the cell current and the reference current is zero. Since the pulse frequency is the variable measure, the analyte concentration is proportional to the pulse frequency. The ionization cell must be small since the peak volumes may be within the 10-100 µl range. The sizes of currently available ECDs are unfortunately too large (100-400 µl), and thus cause additional band broadening. In Paper II it was concluded that the only commercially available ECD that was suitable for GC × GC analysis was the Agilent µECD, which has a cell volume of 150 µl, so this detector was used in all studies included in this thesis. However, in comparison with Flame ionization detectors (FID) relatively large post-column band broadening was still observed (Papers II and IV). The influence of the dead volume could be reduced by adding extra make-up gas at the end of the column. However, there is trade-off between sensitivity and band broadening. The development of an ECD with an even smaller cell volume would be a ma-jor advance for GC × GC-ECD techniques, since it would further increase the peak capacity. However, the most common type of detector for dioxin analysis is the mass spectrometer (MS). An MS instrument can be dived into three main compo-nents: an ion source which creates ions, a mass analyzer and a detector (Throck Watson, 1997). MS systems generate a high vacuum, 10-5 to 10-8 torr, to avoid collisions between molecules. In the ion source the molecules become ionized after impacts with (in most cases) electrons (EI). The energy of the collisions and the analytes molecular stability determine the proportions of the molecular ions (M+) and the various fragment ions that are formed. In the mass analyzer, the ions are separated according to their mass to charge ratios (m/z).

19
There are several different types of mass analyzers. Sector analyzers are used in most GC - high-resolution MS (GC-HRMS) instruments for dioxin analysis. In these instruments, the ions are separated using alternating magnetic and electrostatic fields. Initially the ions are accelerated and focused, then passed through a magnetic field that curves their path. Heavy ions have a stronger tendency to continue along their original trajectory than lighter ones, so the flight path of the lighter ones bends more. Next, the ions that exit the first sec-tor along its central axis pass through an electrical field filter in which ions of too high or low velocity are removed, thereby increasing the mass resolution. Properly adjusting the field strengths ensures that only ions of a predetermined m/z reach the detector. There are also a number of low-resolution mass spectrometers with different working principles. Quadrupole analysers consist of four parallel metal rods to which oscillating radio frequency voltages and direct current fields are applied. Ions are introduced at one end of the assembly, in the centre of the rods, and only those with the selected m/z can pass through the quadrupole filter. Ion traps operate on a similar principle to quadrupoles, although the ions are sepa-rated in three dimensions rather than two. The mass analyzer consists of a ring electrode separating two hemispherical electrodes. A mass spectrum is obtained by changing the electrode voltages to eject the ions from the trap according to their m/z ratios. Furthermore, the ion trap has the ability to perform multiple mass spectrometry sequences (MS/MS), thereby increasing the selectivity or the amount of structural information obtained for a given molecule. In a TOF-MS, all of the ions are briefly accelerated, and the times it takes the various ions to reach the detector are measured to determined their m/z ratio and abun-dance. These systems are very fast, since no alternating fields are used, and therefore highly suitable for GC × GC applications. For all kinds of mass analyzers, the ion current is finally amplified and detected using an electron- or photomultiplier system.

20
5. COMPREHENSIVE TWO-DIMENSIONAL GAS CHROMATOGRAPHY (GC × GC)
Introduction
Comprehensive two-dimensional chromatography (GC × GC) was invented and developed by John B. Phillips and co-workers in the late 1980s. The first paper that attracted wider interest in the technique within the field of analytical chemistry presented a two-dimensional chromatogram of a petroleum sample (Liu and Phillips, 1991). Liu and Phillips applied a conductive paint with low thermal mass to a fused-silica GC capillary column, which facilitated quick heating and cooling, and used this as a thermal modulator interface between two serially connected GC columns. By applying an electric pulse to the painted thick-film column section the interface was heated and the trapped material, from the first dimension column effluent, was desorbed and trans-ferred into the second dimension column. The process was continuously re-peated and a comprehensive two-dimensional gas chromatogram was obtained. In the following years, there were intense discussions regarding the principles of the new technique and the opportunities it provided (Phillips and Xu, 1995). In addition, there were further developments of the systems, leading to new, more robust modulator interfaces (Phillips et al., 1999). The majority of the first applications were related to petrochemical analysis (Blomberg et al., 1997; Gaines et al., 1999; Purch et al., 2002). However, in recent years the technique has matured and the research has broadened to encompass the development of detectors and GC columns with greater resolution and diverse properties, and the technique has been applied to analyze more diverse compounds and matri-ces. The evolution of the technique and all the new applications has been exten-sively reviewed (Dallüge et al., 2003; Adahchour et al., 2006). General principle of GC × GC
Although one-dimensional GC provides better peak-resolution than most other chromatographic techniques its resolution is still insufficient to separate indi-vidual analytes in complex matrices, such as petroleum, fish and other foods, soils and various types of oils.

21
Compared to one-dimensional GC the heart-cut technique or multidimen-sional gas chromatography (MDGC) provides better resolution for selected parts of a chromatogram, but the number of heart-cuts, and thus the number of analytes that can be transferred to a second column for further separation is limited (Schomburg, 1995; De Boer et al., 1995). Hence, when large numbers of analytes have to be determined or a complex mixture has to be thoroughly characterized use of the MDGC technique is correspondingly complex and time consuming. In GC × GC, all material that elutes from the first dimension (1D) column is transferred to the second dimension (2D) column. To maximise the separation, two columns with different separation mechanisms for the analytes of interest are required. Traditionally, a non-polar column has been used for the 1D, which separates the analytes according to their volatility, followed by a short, narrow polar, semi- polar or shape- selective column for the 2D, which sepa-rates the components based on specific interactions with the column’s station-ary phase. The separation of the complete sample in two, more or less orthogo-nal, dimensions results in much higher peak capacities than in one-dimensional GC, thereby improving the separation both between analytes and between the analytes and sample matrix components. The key element of a GC × GC in-strument is the modulator, which accumulates and focuses fractions eluting from the first dimension column and re-injects them rapidly as narrow bands into the second dimension column. For optimal first dimension separation these fractions should not be longer than a quarter of the 1D peak width (Seeley, 2002). Each fraction results in a separate 2D chromatogram, the size of which can be adjusted by altering the modulation period (also known as modu-lation time). The length of the modulating period is commonly between 2-8 seconds. The separation on the first column is usually conducted under normal GC conditions with ordinary column dimensions e.g. 30 m × 0.25 mm i.d. × 0.25 µm film. The separation on the second column has to be very fast to avoid rapidly moving components of one injected pulse catching up and eluting be-fore the last components of the previous pulse. This is commonly called “wrap around”. To avoid this phenomenon short, narrow columns, with dimensions of ca. 0.5-2m × 0.1-0.15 mm i.d. × 0.1 µm are required. Due to the focusing provided by the modulator and the very fast 2D separations, the peaks gener-ated in GC × GC are very narrow, typically 50-600 ms. The focusing effect also results in a signal enhancement compared to 1DGC, which improves the detectability. The enhancement of the signal is dependent on the width of the 1D peak, the number of modulations over the 1D peak and the retention on the 2D column. The result of a GC × GC analysis is a long sequence of short 2D chromatograms, the number of which is determined by the length of the

22
analysis, the data acquisition rate and the modulating period (Figure 3). In order to visualise GC × GC data they are usually transformed into a data ma-trix, which can then be plotted in a 2D plane, in which one dimension shows the retention times of analytes in the first separation, the other dimension shows their retention times in the second separation and the intensities of the signals are shown by contours and/or colour coding (Figure 4). Figure 3. Data conversion for visualization of GC × GC chromatograms The optimization procedure of a GC × GC system is more complex than for ordinary 1DGC. First, a suitable pair of column phases has to be combined and then the columns have to be optimized in length, inner diameter and phase thickness compared to each other. Changes in temperature and gas flows will effect the separation in both dimensions in different ways and parameters as modulation period and temperature could also be altered to obtain different results (Haglund et al., 2001; Ong et al., 2002)
Example. 50 min at 50Hz = 150000 data points
Number of rows = modulating period x acquisition rate
Number of columns (2D chromatograms) =data points
modulating period x acquisition rateNumber of columns (2D chromatograms) =
data points
modulating period x acquisition rate
1D
2D
A modulation period 0f 6 seconds generates a data matrix with 500 columns and 300 rows
Data conversion
signalTime signalTime
Unconverted data

23
Figure 4. 1DGC chromatogram (upper), GC × GC chromatogram (middle) GC × GC colour plot (lower).
17 17.2 17.4 17.6
Hz
0
2000
4000
6000
8000
C
CC
A
AAB
B D
DD
E E
17.00 17.12 17.25 17.37 17.50 17.62
3.5
3.0
2.5
2.0
1.5
1.0
0.5
0.0
AE
BC
D
4.0
17 17.2 17.4 17.6 17.8
Hz
300
400
500
600
700
800
900C
A
B
D E
17 17.2 17.4 17.6 17.8
Hz
300
400
500
600
700
800
900C
A
B
D E
17 17.2 17.4 17.6
Hz
0
2000
4000
6000
8000
C
CC
A
AAB
B D
DD
E E
17 17.2 17.4 17.6
Hz
0
2000
4000
6000
8000
C
CC
A
AAB
B D
DD
E E
17.00 17.12 17.25 17.37 17.50 17.62
3.5
3.0
2.5
2.0
1.5
1.0
0.5
0.0
AE
BC
D
4.0
17 17.2 17.4 17.6 17.8
Hz
300
400
500
600
700
800
900C
A
B
D E
17 17.2 17.4 17.6 17.8
Hz
300
400
500
600
700
800
900C
A
B
D E
17 17.2 17.4 17.6 17.8
Hz
300
400
500
600
700
800
900C
A
B
D E
17 17.2 17.4 17.6 17.8
Hz
300
400
500
600
700
800
900C
A
B
D E

24
Modulators and detectors for GC × GC
The first commercial modulator was a thermal modulator named the sweeper. A capillary with a thick film of stationary phase was used to accumulate the effluent from the first column and reinjection was performed by heating the capillary with a moving (sweeping) slotted heater (Phillips et al., 1999). The main disadvantage with a standard sweeper system was its limited applicability since the maximum elution temperature that could be used was 230°C, al-though the system could be modified to extend the range of applications to some degree (Frysinger and Gaines, 2000). In addition, the installation and optimization of the system was quite complex. Nevertheless, the sweeper had been used in approximately 30% of the studies reviewed in 2003 (Dallüge et al., 2003). Today, no thermal modulators are commercially available since they have been superseded by cryogenic modulators. The first cryogenic modulator was the longitudinally modulating cryogenic system (LMCS; Marriott and Kinghorn, 1997), which was utilized in all studies underlying this thesis. The LMCS consists of a 3 cm long cold-trap fed with a continuous flow of carbon dioxide to accumulate the solutes eluting from the first dimension column. When the trap is moved along the column (upstream) the cooled capillary is exposed to the ambient oven temperature and the trapped solutes desorb (Fig-ure 5). Figure 5. The longitudinally modulating cryogenic system, with the cold trap in the “trap” position (left) and “release” position (right) Developments in recent years have resulted in numerous types of cryogenic jet modulators with either carbon dioxide or nitrogen as coolants and a number of valve-based modulators all described in the review by Adahchour et al., 2006 part II.

25
Schematics of the LMCS and other cryogenic modulators can be found in Pa-per II, in which the thermal sweeper and the LMCS were evaluated together with a number of cryogenic jet modulators for the modulation of high-boiling halogenated compounds. Each modulator was optimized for the modulation of n-alkanes, chlorinated alkanes, PCBs and fluorinated polycyclic aromatic hy-drocarbons. Peak widths were measured at half height and the resolution was compared using two PCBs that coeluted in the second dimension. The modu-lators were also evaluated in terms of practical aspects like ease of operation, optimization, column exchange and installation into the GC. For the whole range of applications it was concluded that all the cryogenic modulators were suitable, and performed better than the thermal sweeper. Among the cryogenic modulators it was observed that the carbon dioxide modulators gave narrower peaks than the nitrogen cooled KT2001 and also had a wider application range. In addition, it was shown that the LMCS was not as effective as the other cryogenic modulators for the most volatile analytes, but for analyzing PCBs it was concluded that the performance of all of the cryogenic modulators was comparable. Moreover, the LMCS has been described as not very robust and GC columns may break, due to ice formation at high flows of carbon diox-ide at low oven temperatures and erratic movement of the trap. However, in my opinion the LMCS is a robust modulator for dioxin analysis and it has been used in our laboratory since 2001 without a single column breaking due to ice formation or erratic trap movement. An advantage of the LMCS is that the flow of carbon dioxide can be regulated, which is useful when performing ultra-trace analyses of dioxins and PCBs. The effects of temperature and the flow of carbon dioxide cooling have been studied using the LMCS and it has been shown that the trap temperature has a major influence on the shape and width of the modulated peaks, and that the optimal modulating temperature depends on both the analyte and the wall thickness of the capillary column (Haglund et al., 2002). For these reasons, a thin-wall col-umn with the dimensions 0.15 m × 0.1 mm × 0.1µm 007-1 (dimethyl polysi-loxane; Quadrex Woodbridge, CT, USA) was mounted between the first- and second-dimension columns as a modulation capillary in all experiments de-scribed in Papers I and III-VI. Because of the narrowness of the peaks obtained with GC × GC the detection system used has to acquire date rapidly in order to generate sufficient data points across each modulated peak. Suitable detectors for GC × GC are there-fore fast detectors like flame ionisation detectors (FID), electron capture detec-tors (ECD) and time of flight mass spectrometers (TOF-MS). In the early days of the GC × GC technique the FID was the detector of choice and the lack of

26
sensitivity was not a problem, since all applications were related to petrochemi-cal analyses. The detector cell volume should be as small as possible to avoid post-column band broadening. The detector that contributes least to band broadening is the FID, for which the volume is limited by the flame volume, ca. 10-20 µl (Tijssen et al., 1987). However, due to the high sensitivity that is required for dioxin analysis the FID is not appropriate. As well as different modulators, various ECD models were evaluated in Paper II, and it was con-cluded that the cell volume is a key determinant of the suitability of ECD sys-tems for GC × GC applications.. Hence, the Agilent µECD, which has a cell volume of 150 µl is the only ECD that is suitable for trace analysis of dioxins and PCBs. It was found that the signal output of the Agilent µECD was 100 Hz instead of 50 Hz, as specified by the manufacturers. The only mass spec-trometer that can acquire data sufficiently rapidly to be suitable as a detector under normal GC × GC conditions is the TOF-MS, which has been used in a number of applications, including analyses of petrochemical samples, essential oils, pesticides (Dallüge et al., 2003) and, more recently, PCBs and PCDD/Fs (Focant et al., 2004). In the period 2000-2002 only six studies were published in which TOF-MS instruments were used as detectors for GC × GC. In con-trast, in both 2004 and 2005 about 20 papers described analyses in which GC × GC-TOF-MS was used. The suitability of quadrupole-MS instruments as detectors for GC × GC has also improved recently as new rapid scanning sys-tems have been developed that allow scanning rates of up to 10 000 Da/s (Korytár et al., 2005; Adahchour et al., 2005). In selected ion monitoring (SIM) mode, acquisition rates of 90 Hz have been reported in cases where only one ion was monitored. Analysis of dioxins and dioxin-like PCBs using GC × GC
The use of GC × GC to analyze organohalogens, including the dioxins and dioxin-like PCBs, has increased, and two recent reviews of such applications have been published (Korytár, et al 2006; Panic and Gorecki, 2006). Initial studies of PCBs focused mainly on the separation of components in standards and technical mixtures, and on identifications in a few biological matrices (Haglund et al., 2001; De Geus et al., 2002; Korytár et al., 2002) The first attempts to analyze dioxins and dioxin-like PCBs were presented as early as 1996 when Grainger et al. used a sweeper for modulation of a mixture of non-ortho PCBs and a set of PCDD/Fs using an HRMS as detector. They attained a very short separation time of only 18 minutes and an impressive limit of detection (LOD) for TCDD of only 335 attograms, showing the po-tential of the technique (Grainger et al., 1996; Grainger et al., 1998).
27
In a study conducted in 2001 a shape-selective liquid crystal column (LC-50) was used as the first dimension column and a BPX-5 as the second dimension column for a very fast separation of planar non- and mono-ortho PCBs in Chlophen A50 (Haglund et al., 2001). The non-ortho PCBs were most strongly retained by the LC-50 column followed by mono-, di- and, multi-ortho PCBs. Consequently, the LC-50 retains planar compounds particularly strongly. However, use of the LC-50 column as the first dimension column in a column combination in attempts to quantify trace levels of dioxins and di-oxin-like PCBs may be problematic due to the high bleeding of the LC-50 column, which will result in increased LODs In 2002 an HP-1 × HT-8 column set was utilized for the separation of a mix-ture of 90 PCBs and the seventeen 2,3,7,8-substituted PCDD/Fs (Korytár et al., 2002). An ordered structure appeared (based on degree of chlorination) in the GC × GC chromatogram obtained using this column combination, in which 16 of the 17 PCDD/Fs and 11 of the 12 dioxin-like PCBs were sepa-rated from all other congeners. However, the coeluting pair, PCB 169 and 1,2,3,7,8-PeCDD, is problematic since the latter is a very important congener in biological samples due to its significant contribution to the total TEQ value. Using this column set, the cited authors also identified eight of the 12 dioxin-like PCBs in a cod liver sample. In Paper I a DB-XLB column (60m × 0,18mm × 0.18µm) was evaluated to-gether with five different second dimension columns for the separation of the 209 PCBs. Of the 209 possible PCB congeners, 181 could be separated on a DB-XLB × LC-50 column set (Rs ≥ 0.5), and all 12 dioxin-like PCBs were separated from the other PCBs. However, it should be mentioned that even with Rs > 1 it could be difficult to quantify the dioxin-like PCBs in real sam-ples accurately since the concentrations of dioxin-like PCBs can be several or-ders of magnitudes lower than those of the most prominent PCBs. The DB-XLB alone can separate 117 PCBs. Thus, a significant improvement in the number of separated congeners was achieved using GC × GC compared with one-dimensional gas chromatography. Furthermore, when the DB-XLB was used in conjunction with a 2.25m BPX-70 column, 194 of the 209 PCBs could be separated using a very low temperature ramp. This separation is sig-nificantly better, but the analysis time was more than twice as long as when DB-XLB × LC-50 was used (4 h versus 90 min). In seal blubber 64 PCBs were identified and seven of the 64 were dioxin-like PCBs. Among the non-ortho PCBs, only PCB 77 could be identified. However, a single injection of dioxin-like PCBs after a pre-fractionation step on active carbon would have increased the prospects for detecting dioxin-like PCBs.

28
A similar study of the 209 PCBs has been performed by Focant et al. (2004) in which the performance of other combinations of columns and a TOF-MS was investigated. The best column combination was found to be HT-8 × BPX-50, which separated 192 congeners whereof 188 chromatographically separated, including all the dioxin-like PCBs within 146 min. In Paper III, seven first dimension and eight second dimension columns were evaluated in order to find the best column combination for the analysis of the 17 toxic PCDD/Fs and 12 dioxin-like PCBs. The results showed that all 29 target compounds could be separated from each other using three column combinations: DB-XLB × 007-65HT, DB-XLB × VF-23ms and DB-XLB × LC-50. Their ability to separate the target analytes from interfering matrix components was also assessed using a spiked milk extract, and DB-XLB × LC-50 proved to be the best column set for this application. Instrumental LODs of the µECD were investigated and were found to be in the range of 30-150 fem-togram for the selected analytes. In the study reported in Paper IV, the 17 toxic PCDD/Fs and 12 dioxin-like PCBs in four matrices were quantified using GC × GC- µECD. Herring oil, vegetable oil, spiked cow’s milk and an eel extract were analyzed by GC × GC- µECD in two laboratories, and by GC-HRMS in four laboratories to generate reference data. One of the two “GC × GC- µECD laboratories” used DB-XLB × LC-50 columns, and the other VF-1 × LC-50. For the WHO-PCB data there was generally good agreement between the GC × GC- µECD data from both laboratories and the GC-HRMS data. The agreement was also good for dioxin data obtained using the DB-XLB × LC-50 column set, but there were problems in quantifying the dioxins with the VF-1 × LC-50 column set due to interferences. The coefficients of variation (CV) for GC × GC-µECD were slightly higher than those for GC-HRMS, but mainly for the congeners with concentrations close to the detection limits. The WHO-TEQ data obtained with the DB-XLB × LC-50 column set were also in good agreement with the data generated by GC-HRMS. A related study was conducted, by Focant et al. (2004) using an Rtx-Dioxin 2 × Rtx-500 column combination for the analysis of PCDD/Fs and dioxin-like PCBs in fly ash, vegetation and fish using TOF-MS with isotope dilution (GC × GC-IDTOFMS). The Rtx-500 phase proved to be able to separate the bulk matrix from the target analytes in the second dimension. However, it was not able to separate some critical congeners, e.g. PCB 126 from TCDD. PCB 126 and TCDD also coelute from the DB-XLB column, but they can be easily re-solved using LC-50. The peaks in the second dimension were as narrow as 100
29
ms, and the GC × GC-IDTOFMS provided 5-10 fold stronger signal intensi-ties than ordinary GC × GC-ID-TOF-MS. However, the instrumental LOD for TCDD was 0.5 pg, which is still too high for trace analysis of dioxins in matrices such as food items. In a subsequent study, an Rtx-500 × BPX-50 column combination was used for the analysis of PCDD/Fs and dioxin-like PCBs in fish, milk and pork using GC × GC-IDTOFMS (Focant et al., 2005). For the dioxins present in con-centrations > 0.4 pg/g fat (1.1 pg injected) the GC × GC-IDTOFMS showed comparable performance to GC-HRMS. However, when the levels were closer to the LODs the CVs for the TOF-MS were as high as 90%. Nevertheless, the TEQ results still compared relatively well, since there was generally good agreement for the main TEQ contributors. In Paper IV we claimed that the TOF-MS is not sufficiently sensitive for trace analysis of dioxins. However, a rather impressive LOD of 200 femtograms for TCDD was subsequently re-ported for the TOF-MS system used in this study (Pegasus 4D Leco, St, Jo-seph, MI, USA); only 4-5 fold higher than the LOD we obtained with our GC × GC-µECD method. Unfortunately, however, the instrumental detection limits for these systems seems to vary between instruments since the almost identical instrument at our department has LODs for dioxins at least 5-fold higher than those reported by Focant et al., despite careful tuning by an experi-enced Leco specialist. It should also be noted that the TOF-MS dual-channel plate detector loses sensitivity over time. In the study described in Paper V, a GC × GC-µECD method for analyzing 2,3,7,8-substituted PCDD/Fs in complex matrices containing non-2,3,7,8-substituted PCDD/Fs was developed. The 136 tetra- through octa-CDD/Fs were identified and assigned using both DB-XLB × LC-50 and BPX-DXN × LC50. The DB-XLB × LC-50 column set was able to separate 15 of 17 conge-ners and was selected for further evaluation and quantification of a certified fly ash sample. To achieve a comparable chromatographic separation with conven-tional GC-MS, injections on (at least) two columns with differing polarity, such as DB-5 and SP 2330, is required. In Paper VI, the method developed in paper V was further validated by analysis of three certified reference materials (CRMs; one fly ash and two soil samples). The method developed for determining 2,3,7,8-substituted PCDD/Fs in com-plex matrices involved time- and cost-efficient pressurized liquid extraction with an integrated carbon trap (PLE-C) and GC × GC-µECD analysis. GC × GC-µECD results obtained for two of the three samples (BCR 490 and CRM 529) analyzed agreed relatively well with the certified values for individual con-

30
geners and for TEQs. However, the other material, a complex clay soil sample with low levels of dioxins (CRM 530), proved to be too difficult to analyze using the GC × GC-µECD method, and it was not possible to obtain accurate values of its dioxin contents Quantification and Calibration
As concluded in all the studies discussed above involving quantification with GC × GC-µECD, the lack of robust software increases the time required for data handling, and associated costs. Thus, single-point calibration is preferred to multi-point calibration since it saves time. However, in the study described in Paper IV, single-point calibration was used with good results. The perform-ance was well above the EC criteria for screening methods. Hence, at least when GC × GC-µECD is used as a screening tool, single-point calibration provides sufficient accuracy. In the investigations reported in Papers V and VI, multi-level (5-point) calibration was used. Calibration solutions with a wide range of concentrations were used since the samples to be analyzed were ex-pected to contain wide-ranging concentrations of target analytes. However, linear regression analysis of the resulting calibration data would be strongly biased by the most highly concentrated standard, and, hence, the regression coefficient (r2) would be very close to 1. Regression analysis was therefore per-formed using log-transformed concentration values, which should provide a better assessment of the linearity of the system. The analysis resulted in r2 val-ues in the range 0.994-0.999 for the 17 PCDD/Fs, and it was concluded that the system gives linear responses over the tested range and that quantification using a single-point calibration was justified. Software packages used for GC × GC quantification must be able to automati-cally identify second dimension peaks, and integrate their peak areas (or rather volumes). At present, three software packages are commercially available for GC × GC: GC Image by Zoex Corp. (Lincoln, NE, USA), ChromaTOF (Leco) and HyperChrom by Thermo Finnigan (Milan, Italy). However, only one, GC Image, is sold separately. The other two are only supplied with Leco and Thermo Finnigan GC × GC instruments, respectively. According to my knowledge, all of these packages perform well for isolated peaks with large ar-eas/volumes, but there are problems with assigning and integrating less intense peaks in samples with high backgrounds, and components that partly coelute in the first dimension. Manual corrections are often required by the user. Thus, it is really important that the peak editing procedure is fast and user-friendly.

31
Quality of GC × GC -µECD data
Compared to most other GC × GC applications the separation of dioxins from their isomers requires relatively strong retention in the second dimension, espe-cially when analyzing abiotic samples like soil and ash that contain non-2,3,7,8-chlorinated dioxins. Hence, the peaks become very broad, from 400 ms for early eluting congeners, up to more than a second for late eluting conge-ners, such as OCDD and OCDF. Because of the chromatographic band broadening and the additional column band broadening in the µECD, the gain in sensitivity is often no more than 3- to 5-fold, as compared to standard GC-ECD analysis. Furthermore, column and septa bleed, and carrier gas impuri-ties, are all modulated and give rise to system peaks that can interfere in the analysis. The strong retention by the LC-50 also generates wrap arounds for most dioxins and (thus) increases the risk for coelution of matrix constituents. However, at the moment it is impossible to avoid wrap arounds and simulta-neously achieve the desired separation of the dioxins. The development of bet-ter µECD detectors, with less band broadening, and better shape-selective col-umns could improve the situation. Although the basic instrument sensitivity and linearity of the GC × GC-µECD system has been shown to be sufficient, see above, it is more relevant to evalu-ate its performance using samples spiked with known (low) levels of dioxins and WHO-PCBs. In the DIFFERENCE project, vegetable oil fortified with levels close to the EC maximum levels (0.75 pg PCDD/F-WHO-TEQ/g oil) has been analyzed and the LOD of the GC × GC-µECD method was estab-lished to be 0.5 pg total PCDD/F-WHO-TEQ/g oil. The EC requirements for confirmatory methods are that the LOD has to be at least one-fifth of the level of interest (maximum or action level) and according to that criterion the GC × GC-µECD can, in principle, be used. Generally, there is good agreement between the GC × GC-µECD and GC-HRMS results presented in Papers IV and VI, although a slight tendency for GC × GC-µECD to overestimate the analyte concentrations was observed. Furthermore, if GC × GC-µECD is considered a screening method, a small overestimation is not as bad as underestimations, since false positive results are much better than false negatives. The presented results show that GC × GC -µECD also has potential for routine congener-specific analysis of 2,3,7,8-PCDD/Fs and dioxin-like PCBs in matrices such as food and feed, fly ash and soil. Unfortunately, current EC legislation does not allow the use of techniques other than GC-HRMS as confirmatory methods for official control of food

32
and feed samples. This might however change in the future if evidence is ac-cumulated showing that GC × GC-µECD produces data with quality close to that of GC-HRMS data.

33
6. CONCLUSIONS AND FUTURE PROSPECTS
GC × GC-µECD has been shown to be a promising technique for the analysis of dioxins and dioxin-like PCBs in both biotic and abiotic samples. The DB-XLB × LC-50 column combination effectively separates the 29 target analytes both from each other and from interfering matrix constituents in biotic matri-ces. GC × GC-µECD with the DB-XLB × LC-50 column combination meets EC performance requirements for screening methods for controlling dioxins and dioxin-like PCBs in food and feedstuffs. It also has potential to serve as a con-firmatory method, but such use would require changes to EC legislation, since current EC directives do not allow the use of techniques other than GC-HRMS for confirming levels exceeding the EC maximum limits of dioxins in food and feed. Furthermore, the GC × GC-µECD technique in combination with PLE-C integrated extraction and fractionation has been shown to be a cost-effective alternative to traditional dioxin analysis based on Soxhlet extraction and GC-HRMS for the analysis of dioxins in fly ashes and contaminated soils. The larg-est cost- and time-saving is achieved through the use of the PLE-C technique, but a significant reduction can also be anticipated through the use of GC × GC-µECD since only one injection is required on the DB-XLB × LC-50 col-umn set, in contrast to the minimum of two for GC-HRMS in order to obtain reliable data for all 2,3,7,8-substituted PCDD/Fs. Further evaluation and (possibly) method revisions are needed before GC × GC-µECD can be used on a routine basis. For biotic samples, a similar PLE-C method to that used for the abiotic samples should be investigated, and the available software packages need to be evaluated to find ways to accelerate the data handling procedures, which currently limit sample throughputs. Development of an ECD with a smaller cell volume than the current µECD would also increase the potential of the GC × GC technique, as would the development of low-bleed shape-selective columns, since they would both in-crease the peak capacity and lower the detection limits. In order to convince routine laboratories to consider the new cost- and time-efficient methods as an alternative to GC-HRMS, and to change the EC legis-lation regarding confirmatory methods, more evidence has to be presented showing that GC × GC-µECD procedures generate data with quality close to or equal to that of GC-HRMS data.

34
ACKNOWLEDGEMENTS Ett riktigt stort tack vill jag börja med att ge till min handledare Peter H som väldigt ofta, har väldigt mycket att göra, men ändå vädigt ofta, nästan alltid, hittar tid att hjälpa en när man behöver. Sedan så har jag haft turen att även mina biträdande handledare varit ena riktiga hejare på att ställa upp. Först Magnus J och sedan Karin W. Även ni får det riktigt stora tacket. En till som ska ha Connys stora tack är Micke H. Lite trubbig var du allt ibörjan att få igång snacket me när vi stod vid våran fina nya modulator och jag ställde frågor om hur det funka o va du pyssla me. Då fick jag vara nöjd bara det kom lite mummel ifrån dig var tjugonde minut, men det blev ju bättre med det sen, mycket bättre, stort tack för allt du lärde mig om vår gas kromatograf. Sedan vill jag tacka all övrig personal på det som en gång var miljökemi. Ett speciellt tack till .....njaaaa vänta nu. Jag tror jag ska dela ut ett till Connys stora tack. Det går till....* trumvirvel *.......... Erik Spinnel för hans metodutveckling / strul med ASE me kolfälla under den tid jag var frånvarande och sedan för hjälp på lab. Så då återgår jag till där jag var.. alltså ett speciellt tack till Rickard, Ylva, Sture för trevliga och ibland givande diskussioner om: co-eluerande furaner, mystiska händelser som utspelar sig på en viss ö, hur man delar upp sektioner i en kappa, ski-go guls kapacitet i aggressiv snö, choklad, stålmannen etc. och alla möjliga och omöjliga analytiska problem. Så då tror jag att jag lämnar jobbet tänkte jag ju säga....men.. I must acknowledge all members of the DIAC group and especially Peter Korytár. It has been very nice working with you. Så raskt över till vänner. Tack alla vänner för att ni finns och speciellt tack till de som stöttat oss när vi haft det som svårast, stort tack Håkan, Elin, världens bästa ”föräldragrupp”, Niklas, Henke, Micke mfl. Så då fortsätter vi med Familj. Både jag och min fru är otroligt lyckligt lottade när det gäller att ha föräldrar som ställer upp. Stort tack till Louise och Roger för all er hjälp och såklart till min älskade mamma och pappa, ni ställer upp i alla väder. Hannie, ditt tålamod är fantastiskt. Tack för all den förståelse du visat när jag har haft mycket med jobb genom att alltid (oftast) vara på gott humör, nu har vi lite tid att ta igen va? Jag vet inte vilket superlativ jag ska dra till med, känns lite fånigt med ett stort tack, det räcker som inte riktigt till. Tack Oliwer för att du är en sådan kämpe och den goaste och gladaste kille som finns. Jag är världens stoltaste pappa. Ni två betyder allt för mig. Nu ska jag skynda mig iväg..och sen hem..sova lite ..och sen pussa och krama på er hela julen.

35
REFERENCES
Adahchour M. Beens J, Vreuls RJJ, Brinkman UAT. 2006, Recent develop- ments in comprehensive two-dimensional gas chromatography (GC X GC) I. Introduction and instrumental set-up. Trends in Analytical Chemistry 25(5): 438-454 Adahchour M. Beens J, Vreuls RJJ, Brinkman UAT. 2006, Recent develop- ments in comprehensive two-dimensional gas chromatography (GC X GC) II. Modulation and detection. Trends in Analytical Chemistry 25(6): 540-553 Adahchour M. Beens J, Vreuls RJJ, Brinkman UAT. 2006, Recent develop- ments in comprehensive two-dimensional gas chromatography (GC X GC) III. Applications for petrochemicals and organohalogens. Trends in Analytical Chemistry 25(7): 726-741 Adahchour M. Beens J, Vreuls RJJ, Brinkman UAT. 2006, Recent develop- ments in comprehensive two-dimensional gas chromatography (GC X GC) IV. Further applications, conclusions and perspectives. Trends in Analytical Chemistry 25(8): 821-840 Adahchour M, Brandt M, Baier HU, Vreuls RJJ, Batenburg AM, Brinkman UAT 2005, Comprehensive two-dimensional gas chromatography coupled to a rapid-scanning quadrupole mass spectrometer: principles and applications. Journal of Chromatography A 1067 (1-2):245-254 Alcock RE, Jones KC. 1996, Dioxins in the environment: A review of trend data. Environmental science and technology. 30(11): 3133-3143
Ballschmiter K, Zell M. 1980, Analysis of polychlorinated biphenyls ( PCB ) by glass capillary gas chromatography. Composition of technical Aroclor- and Clophen- PCB mixtures. Fresenius' Zeitschrift fuer Analy tische Chemie 302(1): 20-31 Blomberg J, Schoenmakers PJ, Beens J, Tijssen R. 1997, Comprehensive two- dimensional gas chromatography (GC x GC) and its applicability to the characterization of complex (petrochemical) mixtures. Journal of High Resolution Chromatography 20(10) : 539-544 Blomkvist G, Roos A., Jensen S, Bignert A, Olsson M. 1992. Concentrations
of SDDT and PCB in seals from Swedish and Scottish waters. Ambio 21: 539-545 BignertA, Olsson M, Persson W, Jensen S, Zakrisson S, Litzen K, Eriksson U, Haggberg L, Alsberg T. 1998. Temporal trends of organochlorines in
Northern Europe, 1967-1995. Relation to global fractionation, leakage from sediments and international measures. Environmental Pollution 99
(2): 177-198 Bignert A, Olsson M, Bergqvist PA, Bergek S. Rappe C. Dewit C,
36
Jansson B. 1989, Polychlorinated Dibenzo-Para-Dioxins (PCDD) and Dibenzo-Furans (PCDF) in Seal Blubber. Chemosphere, 19 (1-6): 551-556 Björklund E, Sporring S, Wiberg K, Haglund P, von Holst C, 2006. New
strategies for extraction and clean-up of persistent organic pollutants from food and feed samples using selective pressurized liquid extraction, Trends in Analytical Chemistry 25(4): 318-325 Boffey PM, 1971, Herbicides in Vietnam: AAAS Study Finds Widespread Devastation Science 171 :43-47 Buser H-R, Bosshardt H-P, Rappe C. 1978, Identification of polychlorinated dibenzofurans isomers in fly ash and PCB pyrolyses. Chemosphere 7: 165-172 Cantrell JS, Webb NC, Mabis AJ. 1969, Identification and crystal structure of a hydropericardium-producing factor: 1,2,3,7,8,9-hexachlorodibenzo-p- dioxin. Acta Crystallographica, Section B: 150-156 Carson R. 1962, Silent Spring. Houghton Miffin, Boston, MA, USA. Commission Directive 2002/70/EC. Establishing requirements for the determination levels of dioxins and dioxin-like PCBs in feedingstuffs Official journal of the European Communities. L209:15-21 Commission Regulation No 199, 2006. setting maximum levels for certain contaminants in foodstuffs regards dioxins and dioxin-like PCBs. Offi cial journal of the European Union. L 32:34-38 Council Regulation No 2375, 2001 setting maximum levels for certain contaminants in foodstuffs Official journal of the European Communities. L 321:1-5 Covaci A, Ryan JJ, Schepens P. 2002, Patterns of PCBs and PCDD/PCDFs in chicken and pork fat following a Belgian food contamination incident. Chemosphere (47): 207-217 Dallüge J. Beens J, Brinkman UAT. 2003, Comprehensive two-dimensional gas chromatography: a powerful and versatile analytical tool. Journal of Chromatography A, 1000 (1-2): 69-108 Dallüge J, van Rijn M, Beens J, Vreuls RJJ, Brinkman UAT. 2003 Comprehensive two-dimensional gas chromatography with time-of- flight mass spectrometric detection applied to the determination of pesticides in food extracts Journal of Chromatography A 965 (1-2): 207-217 De Boer J, Dao QT, Wester PG, Bowadt S, Brinkman UAT. 1995, Determination of Mono-Ortho Substituted Chlorobiphenyls by Multidimensional Gas-Chromatography and Their Contribution to TCDD Equivalents. Analytica Chimica Acta 300: 155-165

37
De Geus HJ, de Boer J. Brinkman UAT. 2002, Comprehensive gas chromatography of high-boiling halogenated compounds, Chromatographia 55 (5-6):339-344 Eljarrat E, Caixach J, Rivera J. 1998, Microwave vs. Soxhlet for the extraction of PCDDs and PCDFs from sewage sludge samples. Chemosphere 36(10): 2359-2366 Eppe G, Focant JF, Pirard C, De Pauw E. 2004, PTV-LV-GC/MS/MS as screening and complementary method to HRMS for the monitoring of dioxin levels in food and feed. Talanta 63(5): 1135-1146 Erickson MD, 1997. Analytical Chemistry of PCBs (CRC, Boca Raton, Fla.) Erikson B.E, 1999, Dioxin food crisis in Belgium. Analytical Chemistry 71(15):541A-543A Ferrario J, Byrne C. 2002, Dibenzo-p-dioxins in the environment from ceramics and pottery produced from ball clay mined in the United States. Chemosphere 46:1297-1301 Firestone D. 1973, Etiology of chick edema disease. Environmental health perspectives. 5, 59-66 Focant JF, Pirard C, De Pauuw E. 2004, Automated sample preparation- fractionation for the measurement of dioxins and related compounds in biological matrices: a review. Talanta 63: 1101-1113 Focant JF, Sjodin A, Patterson DG. 2004, Improved separation of the 209 polychlorinated biphenyl congeners using comprehensive two- dimensional gas chromatography-time-of-flight mass spectrometry. Journal ofChromatography A 1040 (2):227-238 Focant J, Reiner EJ, MacPherson K, Kolic T, Sjodin A, Patterson DG, Reese, SL, Dorman FL, Cochran J. 2004, Measurement of PCDDs, PCDFs, and non-ortho-PCBs by comprehensive two-dimensional gas chromatog raphy-isotope dilution time-of-flight mass spectrometry (GC × GC- IDTOFMS). Talanta 63(5):1231-1240 Focant JF, Eppe G, Scippo ML, Massart AC, Pirard C, Maghuin-Rogister G, De Pauw E. 2005, Comprehensive two-dimensional gas chromatography with isotope dilution time-of-flight mass spectrometry for the measurement of dioxins and polychlorinated biphenyls in food stuffs-Comparison with other methods. Journal of Chromatography A 1086:45-60 Frame GM, Wagner RE, Carnahan JC, Brown Jr JF, May RJ, Smullen LA,
Bedard DL, 1996. Comprehensive, quantitative, congener-specific analyses of eight Aroclors and complete PCB congener assignments on
DB-1 capillary GC columns. Chemosphere 33(4):603-623 Frysinger GS, Gaines RB. 2000, Determination of oxygenates in gasoline by GC × GC. Journal of High Resolution Chromatography 23(3) 197:201
38
Gaines RB, Frysinger GS, Hendrick-Smith MS, Stuart JD. 1999, Oil spill source identification by comprehensive two-dimensional gas chromatog- raphy. Environmental Science & Technology 33(12): 2106-2112 Grainger J.1996, Analysis of environmental toxicant group components by time-compressed gas chromatography coupled with high resolution mass spectrometry and time of flight mass spectrometry. Organohalogen Compounds. 27 : 354-358 Grainger J, Dimandja, JMD, Green VE, Liu Z, Patterson Jr DG. 1998, Fast g as chromatography/ high resolution mass spectrometry and comprehensive two-dimensional gas chromatography/high resolution mass spectrometry analysis of chlorinated PCDDs, PCBs and PCDFs as multi group analysis. Organohalogen Compounds 35 :28A-28D . Guitart, Raimon; Puig, Pedro; Gomez-Catalan, Jesus.1993, Requirement for a standardized nomenclature criterium for PCBs: computer-assisted assignment of correct congener denomination and numbering. Chemosphere 27(8): 1451-1459. Hagenmaier H, Brunner H. 1987 Isomerspecific Analysis of Pentachlorophenol and Sodium Pentachlorophenate for 2,3,7,8- Substituted PCDD and PCDF at sub-ppb levels, Chemosphere 16(8-9): 1759-1764 Haglund P, Harju M, Ong R, Marriott P. 2001, Shape selectivity: A key factor in comprehensive two-dimensional gas chromatographic analysis of toxic PCBs. Journal of Microcolumn Separations 13(7) 306:311 Harrad SJ, Sewart AP, Alcock R, Boumphrey R, Burnett V, Duartedavidson R, Halsall C, Sanders G, Waterhouse K, Wild S.R, Jones KC. 1994, Polychlorinated-biphenyls (PCBs) in the British environment - sinks, sources and temporal trends. Environmental Pollution 85(2): 131-146 Hawthorne SB,1990. Analytical-Scale Supercritical Fluid Extraction. Analytical Chemistry 62(11):633A-636A, 638A-642A Hayward DG, Nortrup D, Gardner A, Clower MJr. 1999, Elevated TCDD in chicken eggs and farm-raised catfish fed a diet with ball clay from a southern United States mine. Environmental research section A 81:248- 256 Higginbotham GR, Huang A, Firestone D, Verrett J, Ress J, Campbell A.D. 1968, Chemical and toxicological evaluations of isolated and syn thetic chloro derivatives of dibenzo-p-dioxin Nature 220 702-703. Hoogenboom R, Bovee T, Portier L, Bor G, van der Weg G, Onstenk C, Traag W. 2004, The German bakery waste incident; use of a combined approach of screening and confirmation for dioxins in feed and food Talanta 63: 1249-1253
39
Hsu ST, Ma CI, Hsu SK, Wu SS., Hsu NH, Yeh C. 1985, Discovery and epi demiology of PCB poisoning in Taiwan: a four-year followup Environ mental Health Perspective. 59: 5-10. Isosaari P,Hallikainen A, Kiviranta H, Vuorinen P. J, Parmanne R, Koistinen J, Vartiainen T. 2006, Polychlorinated dibenzo-p-dioxins, dibenzofurans, biphenyls, naphthalenes and polybrominated diphenyl ethers in the edible fish caught from the Baltic Sea and lakes in Finland.
Environmental Pollution (141) : 213-225 Iwata H, Tanabe S, Sakal N, Tatsukawa R. 1993. Distribution of persistent organochlorines in the oceanic air and surface seawater and the role of ocean on their global transport and fate. Environmental Science & Technology 27(6): 1080-1098Jensen S. 1966, New Sci. 32, 612. Jenssen BM. 1996. An overview of exposure to, and effects of, petroleum oil and organochlorine pollution in grey seals (Halichoerus grypus).Science of the Total Environment 186:109-118 Kjeller LO, Jones KC, Johnston AE, Rappe C. 1991, Increases in the polychlorinated dibenzo-p-dioxin and dibenzo-p-furan content of soils and vegetation since the 1840s Koistinen J, Koivusaari J, Nuuja I, Vuorinen PJ, Paasivirta J, Giesy JP. 1997, 2,3,7,8-Tetrachlorodibenzo-p-dioxin equivalents in extracts of Baltic white-tailed sea eagles. Environmental toxicology and chemistry 16 (7): 1533-1544 Korytár P, Leonards PEG, de Boer J, Brinkman UAT. 2002, High-resolution separation of polychlorinated biphenyls by comprehensive two- dimensional gas chromatography. Journal of Chromatography A 958 (1-2):203-218 Korytár P, Parera J, Leonards PEG, de Boer J, Brinkman UAT.2005, Quadrupole mass spectrometer operating in the electron-capture negative ion mode as detector for comprehensive two-dimensional gas chromatography. Journal of Chromatography A 1067 (1-2):255-264 Korytár P, Haglund P, de Boer J, Brinkman UAT. 2006, Comprehensive two- dimensional gas chromatography for the analysis of organohalogenated micro-contaminants. Trends in Analytical Chemistry 25(4):373-396 Kosiba RJ, Schwtz BA. 1982, Toxicity of 2,3,7,8-tetrachlorodibenzo-p-dioxin
(TCDD). Drug metabolism reviews 13: 387-406 Kuehl DW, Butterworth BC, Devita WM, Sauer CP,1987,Environmental
Contamination by Polychlorinated Dibenzo-Para-Dioxins and Dibenzofurans Associated with Pulp and Paper-Mill Discharge
Biomedical and Environmental Mass Spectrometry.14(8):443-447 Kuratsune M, Yoshimura H, Hori Y, Okumura M. Masuda Y. 1996, Yusho: A Human Disaster Caused by PCBs and Related Compounds

40
Kyushu University Press, Fukuoka, Japan, 1-6. Lemieux PM, Lutes CC, Abott JA, Aldous KM. 2000, Emissions of Polychlorinated Dibenzo-p-dioxins and Polychlorinated Dibenzofurans from the Open Burning of Household Waste in Barrels. Environmental Science and technology, 34:377-384 Lemieux PM, Lutes CC, Santoianni DA. 2004, Emissions of organic air toxics from open burning: a comprehensive review. Progress in energy and combustion science 30 (1): 1-32 Liem AKD, Fürst P, Rappe C. 2000, Exposure of populations to dioxins and related compounds, Food Additives and Contaminants, 17:4 241-259 Liu ZY, Phillips JB. 1991, Comprehensive 2-Dimensional Gas Chromatogra phy Using An On-Column Thermal Modulator Interface. Journal of Chromatographic Science 29(6):227-231 Llerena JJ, Abad E, Caixach J, Rivera J.2003, An episode of dioxin contamina tion in feedings tuff: the choline chloride case Chemosphere 53 (6): 679- 683 Malisch R. 2000, Increase of the PCDD/F-contamination of milk, butter and meat samples by use of contaminated citrus pulp Chemosphere 40:1041- 1053 Mannila M, Koistinen J, Vartiainen T.2002, Development of supercritical fluid extraction with a solid-phase trapping for fast estimation of toxic load of polychlorinated dibenzo-p-dioxins-dibenzofurans in sawmill soil. Journal of Chromatography A 975(1): 189-198 Marriott PJ, Kinghorn RM. 1997, Longitudinally modulated cryogenic sys tem. A generally applicable approach to solute trapping and mobiliza tion in gas chromatography. Analytical Chemistry 69(13) 2582:2588 Nording M, Sporring S, Wiberg K, Björklund E, Haglund P,2005. monitoring dioxins in food and feedstuffs using accelerated solvent extraction with a novel integrated carbon fractionation cell in combina- tion with a CAFLUX bioassay. Analytical and Bioanalytical chemistry 381:1472-1475 Ong R, Marriott P, Morrison P, Haglund P.2002, Influence of chroma tographic conditions on separation in comprehensive gas chromatog raphy. Journal of Chromatography A. 962 (1-2):135-152 Olie K, Vermeulern PL, Hutzinger O. 1977, Chlorodibenzo-p-dioxins and chlorodibenzofurans are trace components of fly ash and flue gas of some municipal incinerators in the Netherlands. Chemosphere 6: 455-459 Panic O, Gorecki T. 2006, Comprehensive two-dimensional gas chromatog raphy (GC × GC) in environmental analysis and monitoring. Analytical and Bioanalytical Chemistry 386 (84): 1013-1023 Phillips JB, Xu J. 1995, Comprehensive multi-dimensional gas

41
chromatography. Journal of Chromatography A. 703: 327-334 Phillips JB, Gaines RB, Blomberg J, van der Wielen FWM, Dimandja JM, Green V. Granger J, Patterson D, Racovalis L, de Geus HJ, de Boer J, Haglund P, Lipsky J, Sinha V, Ledford EB. 1999, A robust thermal modulator for comprehensive two-dimensional gas chromatography. Journal of high resolution chromatography 22(1):3-10 Poland A, Glover E, Kende AS. 1976, Stereospecific, High Affinity Binding
of 2,3,7,8-Tetrachlorodibenzo-Para-Dioxin by Hepatic Cytosol – Evi dence That Binding Species Is Receptor for Induction of Aryl- Hydrocarbon Hydroxylase, Journal of Biological Chemistry 251(16):4936-4946 Poole CF, Poole SK,1991. Chromatography today. Elsevier Science B.V. The Netherlands Pursch M, Sun K, Winniford B, Cortes H, Weber A, McCabe T, Luong J, 2002, Modulation techniques and applications in comprehensive two- dimensional gas chromatography (GC × GC) Analytical and Bio- analytical Chemistry 373(6): 356-367 Ramondetta M, Repossi A. 1998, Seveso 20 years after.From dioxin to the oak wood. Fondazione Lombardia per l Ambiente, Rappe C, Andersson R, Bergqvist PA, Brohede C, Hansson M,
Kjeller LO, Lindstrom G, Marklund S, Nygren M, Swanson SE, Tysklind M, Wiberg K. 1987, Overview on Environmental Fate of Chlorinated Dioxins and Dibenzofurans - Sources, Levels and Isomeric Pattern in Various Matrices Chemosphere 16(8-9): 1603-1618 Reiner EJ, Clement RE, Okey AB, Marvin CH. 2006, Advances in analytical
techniques for polychlorinated dibenzo-p-dioxins, polychlorinated dibenzofurans and dioxin-like PCBs. Analytical and Bioanalytical Chemistry A. 386(4): 791-806
Richter BE, Jones BA, Ezzell JL. Porter NL, Avdalovic N, Pohl C. 1996, Accelerated solvent extraction: A technique for sample preparation Analytical Chemistry 68:1033-1039 Riget F, Vikelsøe J, Dietz R. 2005, Levels and temporal trends of PCDD/PCDFs and non-ortho PCBs in ringed seals from East Greenland. Marine Pollution Bulletin 50: 1523–1529 Safe S. 1990,Polychlorinated-biphenyls (PCBs), dibenzo-para-dioxins (PCDDs), dibenzofurans (PCDFs), and related compounds – environ- mental and mechanistic considerations which support the develop- ment of toxic equivalency factors (TEFs). Critical Reviews in Toxi- cology 21(1): 51-88 Safe SH. 1994, Polychlorinated Biphenyls (PCBs): Environmental impact,

42
Biochemical and toxic responses, and implications for risk assessment. Critical reviews in Toxicology. 24(2): 87-149 Schomburg G. 1995, 2-Dimensional Gas-Chromatography - Principles, In strumentation, Methods. Journal of Chromatography A 703: 309-325 Seeley JV. 2002, Theoretical study of incomplete sampling of the first dimen- sion in comprehensive two-dimensional chromatography. Journal of Chromatography A 962 (1-2): 21-27 Smith ML, Stalling DL and Johnson JL, 1984. Determination of part-per-
trillion levels of polychlorinated Dibenzofurans and Dioxins in Environmental Samples. Analytical Chemistry 56:1830-1842
Sporring S, Wiberg K, Björklund E, Haglund P. 2003, Combined extraction / clean-up strategies for fast determination of PCDD/Fs and WHO-PCBs
in food and feed samples using accelerated solvent extraction Organoha logen Compounds 60(1):1-4 Swedish Environmental Protection Agency (SEPA), 2005, Survey of sources of unintentionally produced substances, Report 5503 Sijm, DTHM, Seinen W, Opperhuizen A. 1992, Life-Cycle Biomagnification Study in Fish. Environ. Sci. Technol. 26. 2162-2174. Svensson BG, Nilsson A, Hansson M, Rappe C, Akesson B, Skerfving S. 1991 Exposure to dioxins and dibenzofurans through the consumption of fish. New England journal of medicine. 324:8-12 Tanabe S, Kannan N, Subramanian A, Watanabe S, Tatsukawa R.1987, Highly toxic coplanar PCBs - occurrence, source, persistency and toxic
implications to wildlife and humans. Environmental Pollution 47(2): 147-163 Throck Watson J,1997. Introduction to mass spectrometry. Lippincott-Raven
USA Tijssen R, Vandenhoed,N, Vankreveld ME. 1987, Theoretical Aspects and Practical Potentials of Rapid Gas-Analysis in Capillary Gas- Chroma tography. Analytical Chemistry 59(7):1007-1015 US EPA 1995. Method 3545: Pressurized fluid extraction, Tests methods for Evaluating solid wastes, EPA US EPA 1994. Method 1613: Tetra - Through Octa - Chlorinated Dioxins And Furans By Isotope Dilution HRGC/HRMS (Revision B). 821B94005a: Van den Berg M, Birnbaum L, Bosveld ATC., Brunstrom B, Cook P, Feeley
M, Giesy JP, Hanberg A, Hasegawa R, Kennedy S W, Kubiak T, Larsen JC, van Leeuwen FXR, Liem AKD, Nolt C, Peterson RE, Poellinger L, Safe S, Schrenk D, Tillitt D, Tysklind M, Younes M, Waern F,

43
Zacharewski T. 1998, Toxic equivalency factors (TEFs) for PCBs, PCDDs,PCDFs for humans and wildlife. Environmental Health Per spective.106: 775-792. Van den Berg M, Birnbaum LS, Denison M, De Vito M, Farland W, Feeley M,Fiedler H, Hakansson H, Hanberg A, Haws L, Rose M, Safe S, Schrenk D,Tohyama C, Tritscher A, Tuomisto J, Tysklind M, Walker N, Peterson, The 2005 World Health Organization Reevaluation of H uman and Mammalian Toxic Equivalency Factors for Dioxins and Di oxin-Like Compounds. Toxicological Sciences 93(2): 223–241 Van Larebeke N, Hens L, Schepens P, Covaci A, Bayens J, Everaert K, Bernheim JL, Vlietinck R, De Poorter G. 2001, Environmental. Health Perspective. 109(3): 265-273 Van Loco J, Van Leeuwen SPJ, Roos P, Carbonnelle S, de Boer J, Goeyens L,
Beernaert H. 2004, The international validation of bio- and chemical- analytical screening methods for dioxins and dioxin-like PCBs: the DIFFERENCE project rounds 1 and 2. Talanta 63 1169:1182
Wiberg K, Sporring S, Haglund P, Björklund E. 2007, Selective pressurized liquid extraction of polychlorinated dibenzo-p-dioxins, dibenzofurans and dioxin-like polychlorinated biphenyls from food and feed samples. Journal of Chromatography A 1138(1-2): 55-64 Windal I. Denison MS, Birnbaum LS, Van Wouwe N, Baeyens W, Goeyens L. 2005, Chemically activated luciferase gene expression (CALUX) cell
bioassay analysis for the estimation of dioxin-like activity: Critical parameters of the CALUX procedure that impact assay results. Environmental Science & Technology 39(19): 7357-7364
Yao Y, Takasuga T, Masunaga S, Nakanishi J. 2002, Detailed study on the levels of polychlorinated dibenzo-p-dioxins, polychlorinated dibenzo- furans and polychlorinated biphenyls in Yusho rice oil. Chemosphere 46: 1461–1469