tr99-02 january 1999 ieee computer graphics and ... · we describe several vision algorithms for...
TRANSCRIPT
MITSUBISHI ELECTRIC RESEARCH LABORATORIEShttp://www.merl.com
Computer Vision for Interactive ComputerGraphics
M. Roth, K. Tanaka, C. Weissman, W. Yerazunis
TR99-02 January 1999
Abstract
Computers looking through a camera at people is a potentially powerful technique to facili-tate human-computer interaction. The computer can interpret the users movements, gestures,and glances. Fundamental visual algorithms include tracking, shape recognition, and motionanalysis. We describe several vision algorithms for interactive graphics, and present variousvision controlled graphics applications which we have built which use them: vision-based com-puter games, a hand signal recognition system, and a television set controlled by hand gestures.Some of these applications can employ a special artificial retina chip for image detection orpre-processing.
IEEE Computer Graphics and Applications, May-June, 1998, pp. 42-53
This work may not be copied or reproduced in whole or in part for any commercial purpose. Permission to copy in whole or in partwithout payment of fee is granted for nonprofit educational and research purposes provided that all such whole or partial copies includethe following: a notice that such copying is by permission of Mitsubishi Electric Research Laboratories, Inc.; an acknowledgment ofthe authors and individual contributions to the work; and all applicable portions of the copyright notice. Copying, reproduction, orrepublishing for any other purpose shall require a license with payment of fee to Mitsubishi Electric Research Laboratories, Inc. Allrights reserved.
Copyright c©Mitsubishi Electric Research Laboratories, Inc., 1999201 Broadway, Cambridge, Massachusetts 02139

MERLCoverPageSide2

Computer Vision for Interactive Computer Graphics
W. T. Freeman�, D. Anderson�, P. Beardsley�,
C. Dodge�y, H. Kagez, K. Kyumaz, Y. Miyakez, M. Roth,
K. Tanakaz, C. Weissman�x, W. Yerazunis�
Appeared in IEEE Computer Graphics
and Applications, May-June, 1998, pp. 42-
53.
Abstract
Computers looking through a camera at people
is a potentially powerful technique to facilitate
human-computer interaction. The computer can
interpret the user's movements, gestures, and
glances. Fundamental visual algorithms include
tracking, shape recognition, and motion analysis.
For interactive graphics applications, these al-
gorithms need to be robust, fast, and run on in-
expensive hardware. Fortunately, the interactive
applications also make the vision problems easier:
they constrain the possible visual interpretations
and provide helpful visual feedback to the user.
Thus, some fast and simple vision algorithms can
�t well with interactive graphics applications.
We describe several vision algorithms for inter-
active graphics, and present various vision con-
trolled graphics applications which we have built
which use them: vision-based computer games, a
hand signal recognition system, and a television
set controlled by hand gestures. Some of these
applications can employ a special arti�cial retina
chip for image detection or pre-processing.
Keywords:
Human computer interface, computer vision, in-
teractive computer graphics.
1 Introduction
Vision can be a powerful interface device for com-
puters. There is the potential to sense body posi-
tion, head orientation, direction of gaze, pointing
commands, and gestures.
�MERL,a Mitsubishi Electric Research Lab, 201 Broadway,Cambridge, MA 02139. [email protected]
ypresent address: MIT Media Lab, 20 Ames St.,Cambridge, MA 02139
zMitsubishi Electric, Advanced Technology R&DCenter, 8-1-1, Tsukaguchi-Honmachi, AmagasakiCity, Hyogo 661, Japan
xpresent address: Epiphany Software, Belmont,CA
Such unencumbered interaction can make com-
puters easier to use. Applications could include
computer controlled games or machines, or a
more natural interface to the computer itself. In
a computer game application, rather than press-
ing buttons, the player could pantomime actions
or gestures, which the computer would then rec-
ognize. A CAD designer might use his hands
to manipulate objects in the computer. A user
of machinery or appliances might just have to
use hand gestures to give commands, a potential
bene�t to surgeons, soldiers, or disabled patients.
The vision based interactions could make the ma-
chine interaction more enjoyable or engaging, or
perhaps safer.
Interactive applications pose particular chal-
lenges. The response time should be very fast.
The user should sense no appreciable delay be-
tween when he or she makes a gesture or motion
and when the computer responds. The computer
vision algorithms should be reliable, work for dif-
ferent people, and work against unpredictable
backgrounds.
There are also economic constraints: the vision
based interfaces will be replacing existing ones
which are often very low cost. A hand-held video
game controller and a television remote control
each cost about $40. Even for added functional-
ity, consumers may not want to spend more.
Academic and industrial researchers have re-
cently been focusing on analyzing images of peo-
ple [4]. While researchers are making progress,
the problem is hard and many present day al-
gorithms are complex, slow or unreliable. The
algorithms that do run near real-time do so on
computers that are very expensive relative to the
hand-held interface devices.
Fortunately, interactive graphics applications
o�er particular advantages that make low-cost,
real-time vision control possible. The vision in-
put functions as part of a larger system that in-
cludes an interactive graphical display. This may
be a computer game, the control of a television
set, or control of objects in a virtual or real world.
The �rst advantage is that the application con-

text restricts the possible visual interpretations.
Perhaps, from the game context, we know that
the player is running, then the vision system may
need only to ascertain how fast the player is run-
ning. This is a much easier vision problem to
solve than a 3-d reconstruction of the player's
motion from scratch. Secondly, there is a human
in the loop. The user can exploit the immediate
visual feedback of the graphical display to change
their gesture, if necessary, to achieve the desired
e�ect. If a player is leaning to make a turn in a
game and sees that he isn't turning enough, he
can lean more.
There is a niche for fast, unsophisticated com-
puter vision algorithms which take advantage of
the simpli�cations that interactive graphics ap-
plications provide.
We have developed or applied various vision
algorithms suitable for interactive graphics ap-
plications. We will describe various fundamental
visual measurements, in order of increasing com-
plexity: large object tracking, shape recognition,
motion analysis, and small object tracking. We
have used these to make vision-based interfaces
for several computer games, and hand gesture
controllers for a toy robot, crane, and a televi-
sion set. We have developed a special image de-
tector/processor which can further reduce costs.
Some researchers have undertaken related
projects, including the Alive work at the MIT
Media Lab [3], and the pioneering work of [8]. It
is similar in spirit to a thrust of computer vision
research known as \active vision", which empha-
sizes real-time response to real vision problems
[1].
2 Large object tracking
In some interactive applications, the computer
needs to track the position or orientation of a
body or hand that is prominent in the visual
�eld of the camera. Relevant applications might
be computer games, or interactive machine con-
trol where the camera viewing conditions are con-
strained. In such cases, a description of the over-
all properties of the image may be adequate.
Image moments, which are fast to compute,
provide a very coarse summary of global av-
erages of orientation and position (see sidebar,
Image Moments). If the camera views a hand on a
uniform background, this method can distinguish
hand positions and simple pointing gestures, as
shown in Fig. 1 (a). We have implemented this
to control the motion of a toy robot, Fig. 1 (b).
The robot followed the direction that the hand
was pointing; tilting the hand perpendicular to
the camera caused the robot to stop.
We are able to calculate moments particularly
quickly using a low-cost detector/processor that
we have developed, called the arti�cial retina chip
(see sidebar, Artificial Retina). This chip com-
bines image detection with some low-level im-
age processing (named arti�cial retina by anal-
ogy with those combined abilities of the human
retina). The chip can compute various functions
useful in the fast algorithms for interactive graph-
ics applications.
An application area to which we have applied
several di�erent vision algorithms is interactive
computer games. As shown in Fig. 2, we replace
the handheld game keypad with a detector, a
processor, and interface hardware. The interface
hardware, controlled by the processor interpret-
ing detector images, issues commands which look
like keypad commands to the Sega Saturn game
machine.1
The ideal way to design a vision based inter-
active game is from scratch, building a game
on the particular advantages of the vision in-
terface (good analog adjustments; complex pose
con�gurations). As an easier preliminary step,
we selected existing games that we felt were
particularly well suited to a vision interface,
and designed a vision interface that was plug-
compatible with the existing keypad interface. A
disadvantage of this approach is that the game is
tuned for play on the keypad, and not all of the
keypad commands are easy to issue from vision
input; we omitted some. We developed interfaces
for three Sega Saturn games: Nights, Magic Car-
pet, both discussed in this section, and Decath-
lete, discussed in the section on motion analysis.
Part of the Sega Saturn game, Nights, involves
steering a sprite ying through a magical world.
We wanted the user to control the sprite by sim-
ple motions or pointing gestures.
We had the user position his hand close to the
camera, so that his hand became a large object
in the camera's �eld of view. To avoid the ef-
fects of stationary background clutter, the input
to the moments calculation may be a quantity
based on motion. To control the movement of
the sprite we calculated the center of mass of a
motion energy image, the absolute value of the
di�erence between successive video frames (see
Fig. 3). The response to pointing gestures is ro-
bust and immediate, allowing natural control of
1We thank Sega for providing game interfaceinformation.

the game character with easy gestures.
We applied the moments analysis hierarchi-
cally, over the image and its four quadrants, to
analyze body positions for control of the game
Magic Carpet (see Fig. 4). The player can steer
his magic carpet in any direction by leaning
or walking in the di�erent directions; he can
�re a spell by holding out his arm. Because
the player's motions match the ying carpet re-
sponse, the game control is intuitive and sim-
ple to learn. Both of the above systems require
some control over the background. The motion-
based method requires a stationary background;
the shape-based method requires a uniform back-
ground.
(a)
(b)
Figure 1: (a) Hand images and equivalentrectangles, having the same �rst and secondorder moments. We measure X-Y position,orientation, and projected width from therectangle. We used image moments to con-trol the motion of a toy robot, (b).

Display
Game machine
Imagedetector
ImageProcessor
Interfacelogic
Keypad substitute
Figure 2: System block diagram of interac-tive game machine.
(a) (b)
(c)(d)
Figure 3: (a) and (b): Two frames of camerainput. (c) Absolute value of temporal di�er-ence image (a - b). Its center of mass (arrow)controls direction of ight of sprite, (d).

Figure 4: A hierarchy of computed image moments was used to analyze the shape and orientationof the player for the game, Magic Carpet. The player controls the magic carpet ight by leaning orwalking. The player can raise his arm to �re a spell.

2.1 Sidebar: Image moments
Image moments [7] provide useful summaries of
global image information. The moments involve
sums over all pixels, and so are robust against
small pixel value changes.
If I(x; y) is the image intensity at position x,
y, then the image moments, up to second order,
are:
M00 =Xx
Xy
I(x; y) M11 =Xx
Xy
xy I(x; y)
M10 =Xx
Xy
x I(x; y) M01 =Xx
Xy
y I(x; y)
M20 =Xx
Xy
x2 I(x; y) M02 =Xx
Xy
y2 I(x; y)
(1)
We can �nd the position, xc, yc, orientation �,
and dimensions l1 and l2 of an equivalent rectan-
gle which has the same moments as those mea-
sured in the image [7]. Those values give a mea-
sure of the hand's position, orientation, and as-
pect ratio. We have:
xc =M10
M00
yc =M01
M00
(2)
De�ne the intermediate variables a, b, and c,
a =M20
M00
� x2c
b = 2(M11
M00
� xcyc)
c =M02
M00
� y2c : (3)
We have (c.f. [7]):
� =arctan(b; (a� c))
2(4)
and
l1 =
s(a+ c) +
pb2 + (a� c)2
2
l2 =
s(a+ c)�pb2 + (a� c)2
2(5)
The image moments can be calculated from
three projections of the image [7]. Let the verti-
cal, horizontal, and diagonal projections be
V (x) =Xy
I(x; y); (6)
H(y) =Xx
I(x; y); (7)
and
D(t) =Xs
I(t� sp
2;t+ sp
2): (8)
Then the image moments can be written as [7]:
M00 =P
x V (x)
M11 =P
t t2D(t) � M20
2� M02
2
M10 =P
x xV (x) M01 =P
y yH(y)
M20 =P
x x2 V (x) M02 =
Py y
2H(y):(9)
These equations replace the double sums
of Eq. 1 with single sums, which speeds
up the processing or accommodates process-
ing by fast, special hardware (see sidebar,
Artificial Retina Chip).

2.2 Sidebar: The arti�cial retinachip
We have developed an image detector which al-
lows programmable on-chip processing. By anal-
ogy with the fast, low-level processing that oc-
curs in the eye, we call the detector the arti�cial
retina (AR) chip [9]. Figure 5 shows the elements
of the AR chip: a 2-D array of variable sensitiv-
ity photodetection cells (VSPC), a random ac-
cess scanner for sensitivity control, and an out-
put multiplexer. On-chip image processing can
be realized by analog operation (addition or sub-
traction) of each VSPC's output current. The
VSPC consists of a pn photo-diode and a di�er-
ential ampli�er which allows for high detection
sensitivity. This structure also realizes nonde-
structive readout of the image, essential for the
image processing. We have built detector arrays
ranging in resolution from 32x32 to 256 x 256 pix-
els; a 32x32 detector array was adequate for the
game applications presented here. That chip size
is 6.5 by 6.5 square millimeters, with 150 by 150
micron sized pixels, using a 1 micron fabrication
process. On-chip image processing is obtained
from an input image at every time step.
The image processing of the arti�cial retina
can be expressed as a matrix equation. In Fig. 5,
the input image projected onto the chip is the
weight matrix W . All VSPC's have three elec-
trodes. A direction sensitivity electrode, con-
nected along rows, yields the sensitivity control
vector, S. The VSPC sensitivities can be set
to one of (+1; 0;�1) at each row. An output
electrode is connected along columns, yielding an
output photocurrent which is the vector product,
J = WS. The third electrode is used to reset the
accumulated photo-carriers.
By setting the sensitivity control vector, S, ap-
propriately, this hardware can read-out the raw
image or execute simple linear operations such as
local derivatives and image projections. Data ac-
quisition is not limited to video frame rates and
can range from 1 to 1000 Hz. This detector can
be manufactured on the same equipment used to
process DRAM's and thus may cost less to man-
ufacture than conventional CCD's.
We have integrated this detector/processor
chip into an inexpensive AR module, which con-
tains a low-resolution (32x32) AR detector chip,
support and interface electronics, and a 16 bit 10
MHz micro-processor. Taken together, the mi-
croprocessor and AR chip can perform general
image processing operations quickly. The mod-
ule is 8 x 4 x 3 cm, and the chip can be fabricated
(a)
(b)
Figure 5: (a) Schematic structure of the ar-ti�cial retina chip. An array of variable sen-sitivity photodetector cells allows image de-tection, linear �ltering, and projection. (b)Photomicrograph of the chip.
at a considerably lower cost than CCD's because
the chip fabrication is CMOS-based.
The arti�cial retina detector can perform the
horizontal and vertical image projections needed
for the image moment calculations, saving pro-
cessor time. The savings depend on the image
resolution and micro-processor speed. For the
10 MHz micro-processor of the AR module and
32x32 resolution, the calculations would take 10
msec per image on the microprocessor alone, but
only 0.3 msec per image using the microprocessor
and arti�cial retina chip.

3 Shape recognition
Most applications, such as recognizing a particu-
lar static hand signal, require a richer description
of the shape of the input object than image mo-
ments provide.
If the hand signals fall in a predetermined set,
and the camera views a close-up of the hand, we
may use an example-based approach, combined
with a simple method to analyze hand signals
called orientation histograms. These histograms
summarize how much of each shape is oriented in
each possible direction, independent of the posi-
tion of the hand inside the camera frame. The
computation involves taking spatial derivatives,
followed by a non-linearity and can be imple-
mented quickly using either conventional or spe-
cial hardware.
These example-based applications involved
two phases, training and running. In the train-
ing phase, the user shows the system one or more
examples of a particular hand shape. The com-
puter forms and stores the corresponding orienta-
tion histograms. In the run phase, the computer
compares the orientation histogram of the cur-
rent image with each of the stored templates and
selects the category of the closest match, or inter-
polates between templates, as appropriate. This
method is insensitive to small changes in the size
of the hand, but is sensitive to changes in hand
orientation. For greater robustness, the user may
show several examples and the computer can use
the closest matching example to the test image.
We have implemented several interactive
graphics applications which rely on orientation
histograms for hand gesture recognition [5]. Fig-
ure 6 shows a computer graphic crane that we
can control by hand signals. The system is �rst
trained on the hand signals for the commands up,
down, left, right, and stop, by having the user
show an example of each gesture. After training
the computer, the user can use those commands
to move around a crane under hand gesture con-
trol. A graphical display of the closeness of each
hand signal to the 5 trained categories gives the
user feedback for implementing consistent ges-
tures and helps to debug any miscategorizations.
We used the same recognition engine in an
interactive game of rock, scissors, paper, Fig-
ure 8. A computer graphic \robot hand" plays
the game against the user. This indicates when
the user should make the gesture, allowing simple
open loop capture of the video gesture.
Each of these systems, while simple and fast,
recognizes gestures under the constrained view-
ing conditions where the hand dominates the im-
age. We have showed these systems to many
users, most of whom can use them without prac-
tice. Generally, the system must be trained for
each user; in the run phase, the response is reli-
able and fast.
We have observed several conditions where the
user is not satis�ed with the gesture classi�ca-
tion, illustrated in Fig. 7. (a) and (b) show two
images which users feel should represent the same
gesture. However, their orientation histograms
are very di�erent, illustrated in (c). This prob-
lem can be addressed by providing multiple train-
ing images for the same gesture. Some di�er-
ent gestures have very similar orientation his-
tograms. (d) and (e) show an example of this,
with the histograms overlaid in (f). One must
choose a vocabulary of gestures that avoids such
confusable pairs. Finally, the hand must dom-
inate the image for this simple statistical tech-
nique to work. (g) and (h) show images where the
hand is a small part of the image. Even though
user has very di�erent hand positions, the ori-
entation histograms of the two images are very
similar, (i). This orientation histogram method
is most appropriate for close-ups of the hand. A
uniform background provides the best results.
The processing is fast on a conventional
general-purpose processor. One can also use spe-
cial hardware, such as the arti�cial retina chip
described above, for the low-level image process-
ing tasks, see sidebar (Arti�cial Retina).

TRAIN
up down left right stop
582.3333
1164.6667
1747
30
210
60
240
90
270
120
300
150
330
180 0
525
1050
1575
30
210
60
240
90
270
120
300
150
330
180 0
1029.6667
2059.3333
3089
30
210
60
240
90
270
120
300
150
330
180 0
663.6667
1327.3333
1991
30
210
60
240
90
270
120
300
150
330
180 0
218
436
654
872
1090
30
210
60
240
90
270
120
300
150
330
180 0
RUN
up
down
left
right
stop
533
1066
1599
30
210
60
240
90
270
120
300
150
330
180 0
Figure 6: Orientation histograms in an example-based hand gesture recognition system. Top: Train-ing images, with their orientation maps and orientation histograms. Middle: In the run phase, thecomputer compares the orientation histogram of the current image with those of the training images.Graph showing inverse distances gives user feedback on performance. Bottom: Here, the hand signalscontrol a toy crane.

(a) (b) (c)
(d) (e) (f)
(g) (h) (i)
Figure 7: Problem images for the orientation histogram based gesture classi�er. Users may feel that(a) and (b) represent the same gesture, but their orientation histograms are di�erent, shown overlaidin (c). A remedy is to provide training images of the gesture at various orientations.Sometimes small changes in the image can cause large semantic di�erences, while changing the orienta-tion histograms little. Users classify (d) and (e) as di�erent gestures, yet their orientation histogramsare nearly the same, (f). One has to construct a gesture vocabulary which avoids gestures with similarorientation histograms.Finally, for this simple statistical technique to work, the hand must dominate the image. If it does not,then even large changes in the hand pose can cause negligible changes to the orientation histogram (g){ (i).

Figure 8: Rock, scissors paper game, based on orientation histograms.

3.1 Sidebar: Orientation histograms
The desire for lighting and position invariance
motivates the orientation histogram representa-
tion. Figure 9 shows a comparison of a pixel rep-
resentation and an orientation representation for
a picture of a hand under two di�erent lighting
conditions. The pixel values of the hand vary
considerably with lighting; the orientation values
remain fairly constant. One can calculate the lo-
cal orientation using image gradients. The phase
angle of a complex number de�ned by horizontal
and vertical image pixel di�erences yields the lo-
cal orientation angle, �, as a function of position
x and y:
�(x; y) = arctan[I(x; y)�I(x�1; y); I(x; y)�I(x; y�1)](10)
We want gestures to be the same regardless
of where they occur within the camera's �eld of
view. We chose to achieve this translation in-
variance by the rather drastic step of ignoring
position altogether, and simply tabulating a his-
togram of how often each orientation element oc-
curred in the image. Clearly, this throws out in-
formation and some distinct images will be con-
fused by their orientation histograms. In prac-
tice, however, one can easily choose a set of train-
ing gestures with substantially di�erent orienta-
tion histograms from each other (e.g. Fig. 6).
We form a vector, �, of N elements, with the
ith element showing the number of orientation
elements �(x; y) between the angles 360�
N(i � 1
2)
and 360�
N(i+ 1
2):
�(i) =Xx;y
�1 if j�(x; y) � 360�
Nij < 360�
N
0 otherwise:
(11)
To reduce noise and allow interactions between
neighboring orientations, we average together ad-
jacent histogram bins. We used N = 36 bins for
the applications shown here. Simple Euclidean
distance, (�1 � �2)2, provides a distance mea-
sure between the two images with orientation his-
tograms �1 and �2. Figure 10 shows the orien-
tation histogram calculation for a simple image.
The resulting orientation histogram is very fast
to compute, and can be used as a feature vec-
tor to compare with previously analyzed train-
ing shapes. McConnell [10] proposed these as a
method to analyze the shapes of binary images;
we apply them to applications using grey scale
images [5].
(a) (b)
(c) (d)
Figure 9: Orientation maps, (c) and (d),are generally more robust to lighting changesthan are images of pixel intensities.
orientation histogram example
orientation angle
frequencyof occurence
(a) image
orientation angle
frequencyof occurence
(d)polar plot
(b) rawhistogram
(c) blurred
Figure 10: Simple illustration of orientationhistogram. An image of a horizontal edge(a) has only one orientation at a su�cientlyhigh contrast. Thus the raw orientation his-togram (b) has counts at only one orientationvalue. To allow neighboring orientations tosense each other, we blur the raw histogram,giving (c). (d) shows the same information,plotted in polar coordinates. We de�ne theorientation to be the direction of the inten-sity gradient, plus 90�.

4 Motion analysis
Often a person's motion signals the important in-
terface information to the computer. Computer
vision methods to analyze \optical ow" can be
used to sense movements or gestures.
We applied motion analysis to control the Sega
Saturn game, Decathlete. The game involves the
Olympic events of the decathlon. The conven-
tional game interface su�ers from the limitations
of the handheld control; to make the game ath-
lete run faster, the player must press a key faster
and faster. We sought to allow the user to pan-
tomime stationary versions of the athletic events
in front of the camera, by running or jumping in
place. We hoped this would add an extra dimen-
sion to the game and make it more engaging.
Figure 11 shows examples of the human-
computer interaction for the 110 meter hurdles.
The user runs in place to make the computer
character run; the character's speed is propor-
tional to how fast the player runs in place. To
jump over a hurdle, the player raises both hands
at the same time.
Recognition of these actions in a general con-
text would be very challenging. But knowing the
game context greatly simpli�es the visual recog-
nition. The graphics application tells us which
event the player is performing, and we only have
to choose between a few di�erent motions the
player should be performing, or to estimate tim-
ing or rate parameters. These are much easier
problems to solve. For the 110 meter hurdles,
the vision algorithm has to choose whether the
player is running, or raising his arms to jump
over a hurdle. If he is running in place, the algo-
rithm has to estimate how fast.
There are many methods to analyze optical
ow, but relative to our low-cost, high-speed re-
quirements, these can be too slow on conven-
tional machines. Our motion analysis does not
need to be detailed, but needs to be extremely
fast.
We have developed a fast \optical ow" algo-
rithm, which provides an approximation to the
screen velocity of moving points on the image
appropriate for the large-scale characteristics of
the optical ow. We use simple measurements
derived from the optical ow to estimate the rel-
evant motion parameters. For example, for the
110 meter hurdles, we track the frame averages
of the horizontal and vertical components of mo-
tion. The frequency of the alternation of the hor-
izontal velocity indicates how fast the player is
running in place. When the average vertical ve-
locity exceeds a threshold, that indicates a jump
command.
The impression on the player of this simple
processing is that the computer understands his
physical gestures. We have demonstrated this
game at various public venues, including at the
computer trade show Comdex, 1996. A station-
ary background was used, to give the most re-
liable recognition. We used the arti�cial retina
chip in detector mode. Players can almost al-
ways control the characters well on their �rst at-
tempts, and became immediately engaged in the
game itself.
4.1 Sidebar: Fast optical ow
For an approximation to the optical ow �eld,
we have developed a fast algorithm, which works
well for the coarse-scale analysis we use in inter-
active game applications. The algorithm classi-
�es the local motion of edges into various pos-
sibilities, then pools local estimates across ori-
entation and across space to estimate large-scale
optical ow.
The algorithm is as follows:
1. Subtract the current frame from the previ-
ous one, yielding a temporal di�erence im-
age.
2. For pixels where the temporal di�erence is
non-zero, enumerate the possible motion di-
rections consistent with the local image mea-
surements. Consider the the 1-d motion
shown in Fig. 14. From this example, we
derive two rules for motion direction estima-
tion:
(a) If the temporal di�erence is negative,
the motion direction is toward the adja-
cent pixel with higher luminance in the
current frame.
(b) If the temporal di�erence is positive,
the motion direction is toward the adja-
cent pixel with lower luminance in the
current frame.
3. Apply the 1-d direction estimation rules to
four orientations (vertical, horizontal, and
the two diagonals) at each pixel.
4. Treat each possible motion direction esti-
mate as a vector and average the possible
motion estimates at each pixel.
5. Finally, average the above ow estimate at
each pixel with the ow estimates of each of
its eight neighbors.
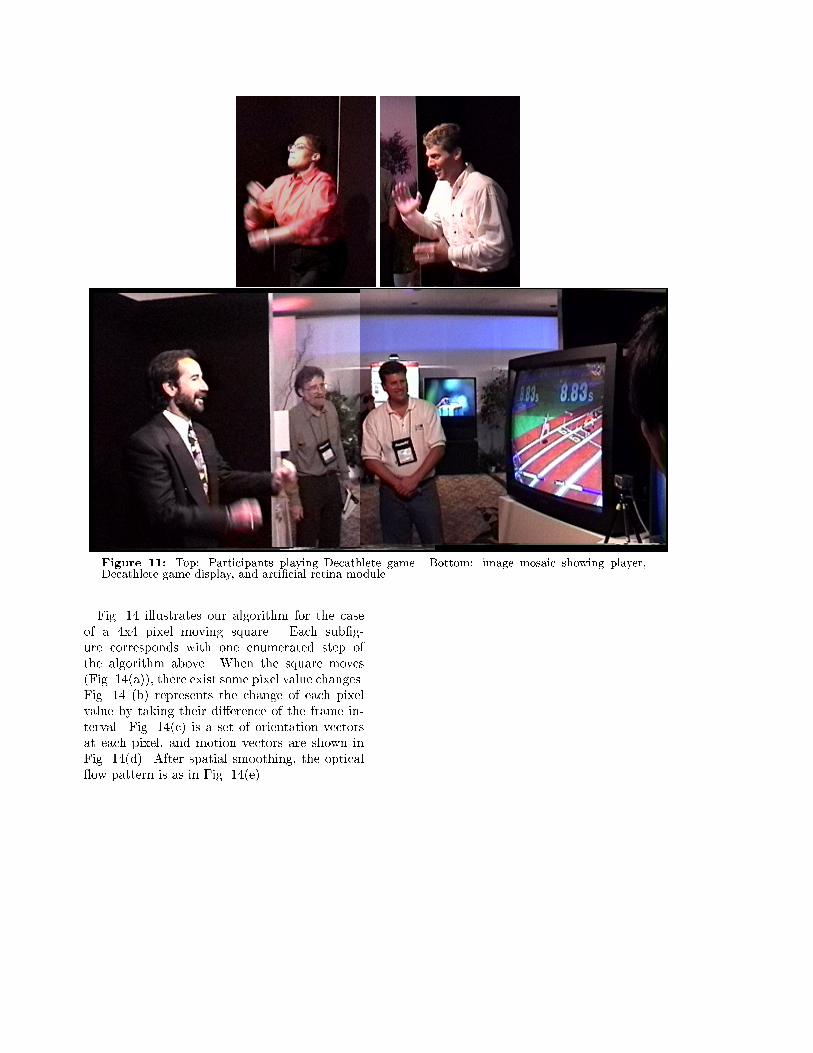
Figure 11: Top: Participants playing Decathlete game. Bottom: image mosaic showing player,Decathlete game display, and arti�cial retina module.
Fig. 14 illustrates our algorithm for the case
of a 4x4 pixel moving square. Each sub�g-
ure corresponds with one enumerated step of
the algorithm above. When the square moves
(Fig. 14(a)), there exist some pixel value changes.
Fig. 14 (b) represents the change of each pixel
value by taking their di�erence of the frame in-
terval. Fig. 14(c) is a set of orientation vectors
at each pixel, and motion vectors are shown in
Fig. 14(d). After spatial smoothing, the optical
ow pattern is as in Fig. 14(e)

artificialretinaimage
opticalflowfield vertical flow
history
horizontalflow
history
decath. event
decath. event
decath. event
decath. event
decath. event
decath. event
decath. event
decath. event
Figure 12: Visual display of analysis of Decathlete game.
Figure 13: Example of user playing another Decathlon event, the javelin throw. The computer'stiming of the set and release for the javelin is based on when the integrated downward and upwardmotion exceeds predetermined thresholds.

Figure 14: Fast motion estimation algorithm. Top: Showing how contrast direction and motiondirection interact to yield temporal di�erence pixel values (algorithm, step 2). Bottom: Steps in thealgorithm to calculate optical ow. (b), (c), (d), and (e) correspond to algorithm steps 1, 3, 4, and 5,respectively.

5 Small object tracking
The previous algorithms involved tracking or
characterizing objects that are large in the cam-
era frame. Many interactive applications also re-
quire tracking objects, such as the user's hand,
which comprise only a small part of the image.
We describe one such application, and our system
solution.
The target application is to control a televi-
sion set by hand signals, replacing a remote con-
trol. This application forces us to face two design
problems, one from the human's point of view,
and one from the computer's point of view. On
the human side, we want to give a broad set of
commands to the television set by hand signals,
yet we don't want to require an intensive train-
ing period before one can control the television.
On the machine side, recognition of a broad set
of hand gestures made within a complex, unpre-
dictable visual scene, such as a living room, is
di�cult, beyond the realm of present day vision
algorithms.
We addressed both these design constraints by
exploiting the ability of the television screen for
graphical feedback [6]. Our interface design is
simple (see Fig. 16). To turn on the television,
the user holds up his hand. Then a graphical
hand icon appears on the television screen, along
with graphical sliders and buttons for television
adjustments. The hand icon tracks the motions
of the user's hand. The user adjusts the vari-
ous television controls by moving the hand icon
on top of the on-screen controls. The graphical
displays and position feedback allows a rich in-
teraction using only simple actions from the user.
The method of moments and orientation his-
tograms of the previous sections aren't ad-
equate to track a small object through the
scene. We adopted a template-based tech-
nique, called normalized correlation (see sidebar:
normalized correlation). We examine the �t of
a hand template to every position in the ana-
lyzed image. The location of maximum correla-
tion gives the position of the candidate hand; the
value of that correlation indicates how likely the
image region is to be a hand.
To simplify the processing, we just used a sin-
gle template for the hand. This restricts the scale
and orientation changes allowed by the image of
the user's hand. The working range of the single
template system was 6 - 10 feet from the tele-
vision. To increase the processing speed, we re-
stricted the �eld of view of the television's camera
to 15� when initially searching for the hand, and
25� in tracking mode. We used a running tem-
poral average of the image in order to subtract
out stationary objects. Nonetheless, best results
are achieved when the background provides good
contrast with the foreground hand. To increase
robustness to lighting changes, we used an ori-
entation representation. Although the tracking
method is not adequate for unpredictable envi-
ronments like living rooms, under demonstration
conditions, it can work quite well. Other tracking
methods may improve performance [2].
The working demonstration allowed us to in-
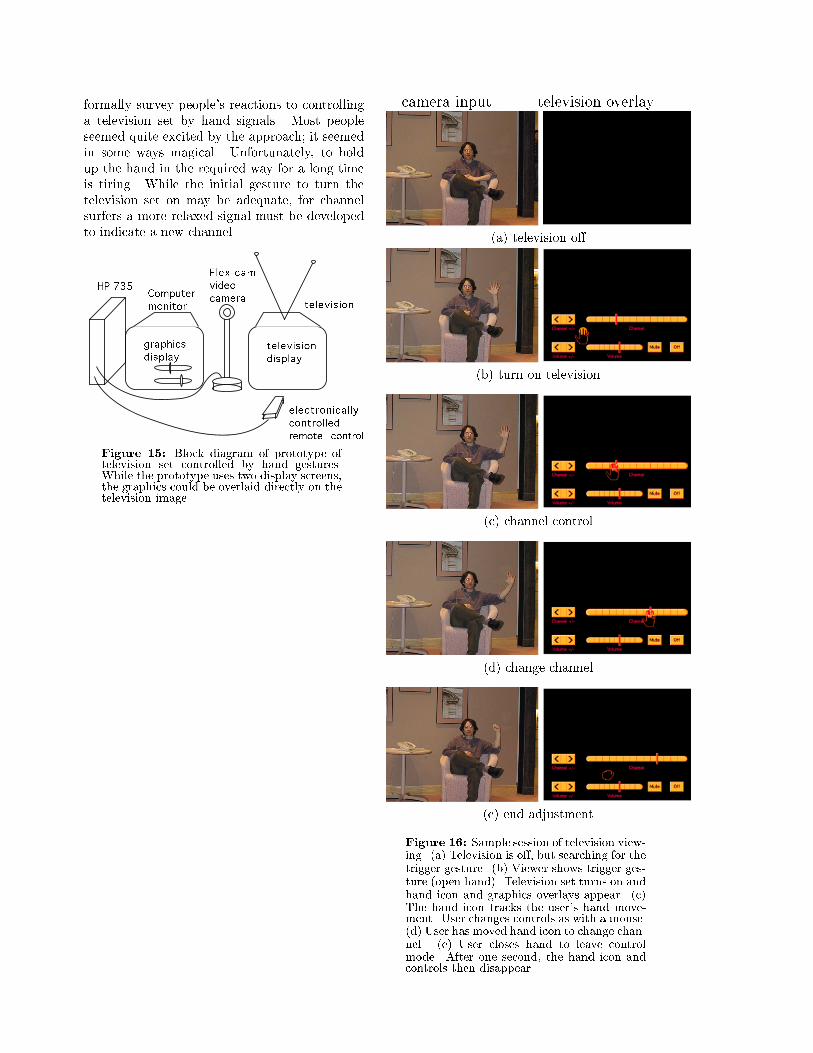
formally survey people's reactions to controlling
a television set by hand signals. Most people
seemed quite excited by the approach; it seemed
in some ways magical. Unfortunately, to hold
up the hand in the required way for a long time
is tiring. While the initial gesture to turn the
television set on may be adequate, for channel
surfers a more relaxed signal must be developed
to indicate a new channel.
Figure 15: Block diagram of prototype oftelevision set controlled by hand gestures.While the prototype uses two display screens,the graphics could be overlaid directly on thetelevision image.
camera input television overlay
(a) television o�
(b) turn on television
(c) channel control
(d) change channel
(e) end adjustment
Figure 16: Sample session of television view-ing. (a) Television is o�, but searching for thetrigger gesture. (b) Viewer shows trigger ges-ture (open hand). Television set turns on andhand icon and graphics overlays appear. (c)The hand icon tracks the user's hand move-ment. User changes controls as with a mouse.(d) User has moved hand icon to change chan-nel. (e) User closes hand to leave controlmode. After one second, the hand icon andcontrols then disappear.

Figure 17: For television set controlled by hand gestures. Under vision input, the hand icon tracksthe user's hand, allowing him to use his hand like a computer mouse.

5.1 Sidebar: Normalized correlation
To �nd instances of an intensity pattern within
another image, we can examine the correlation
between each small patch of the image, and the
target pattern. To remove e�ects due to large,
overall changes in brightness, we calculate what
is called the normalized correlation between ev-
ery point of the image and the target pattern.
Consider the M �N pixel target pattern to be
an MN dimensional vector, ~a. For each possible
placement of the target pattern within the image,
let the corresponding M �N pixels of the image
be an MN dimensional vector, ~b. The normal-
ized correlation for that particular o�set of the
target pattern within the image is simply the co-
sine of the angle between the vectors ~a and ~b:~a�~bp
(~a�~a)(~b�~b). Figure 18 shows the normalized cor-
relation between an image and a hand template.
Note the peak correlation intensity at the true
position of the hand.
(a)
(b) (c)
Figure 18: (a) Stored hand template. (b)Image to be analyzed. (c) Normalized corre-lation values at each pixel. The bright spot ofthe normalized correlation indicates the posi-tion of the best match.
6 Summary
Fast, simple vision algorithms and interactive
computer graphic applications �t together well at
a system level to accommodate human-computer
interaction based on computer vision. The de-
mands of the interactive application require ro-
bust, fast response with low-cost hardware. For-
tunately, the graphical application also simpli-
�es the problem by providing context to limit
the range of visual interpretations and provid-
ing user feedback. This allows for interfaces to
computer graphic applications based on simple
and fast vision algorithms, and possibly special,
low-cost hardware. Advances in algorithms, pro-
cessing power, and memory will continually im-
prove these vision-based interfaces which, over
time, may become commonplace.
References
[1] R. Bajcsy. Active perception. IEEE Pro-
ceedings, 76(8):996{1006, 1988.
[2] A. Blake and M. Isard. 3D position, atti-
tude and shape input using video tracking
of hands and lips. In Proc. SIGGRAPH 94,
pages 185{192, 1994. In Computer Graph-
ics, Annual Conference Series.
[3] T. Darrell, P. Maes, B. Blumberg, and A. P.
Pentland. Situated vision and behavior for
interactive environments. Technical Report
261, M.I.T. Media Laboratory, Perceptual
Computing Group, 20 Ames St., Cambridge,
MA 02139, 1994.
[4] I. Essa, editor. International Workshop on
Automatic Face- and Gesture- Recognition.
IEEE Computer Society, Killington, Ver-
mont, 1997.
[5] W. T. Freeman and M. Roth. Orientation
histograms for hand gesture recognition. In
M. Bichsel, editor, Intl. Workshop on auto-
matic face- and gesture-recognition, Zurich,
Switzerland, 1995. Dept. of Computer Sci-
ence, University of Zurich, CH-8057.
[6] W. T. Freeman and C. Weissman. Televi-
sion control by hand gestures. In M. Bichsel,
editor, Intl. Workshop on automatic face-
and gesture-recognition, Zurich, Switzer-
land, 1995. Dept. of Computer Science, Uni-
versity of Zurich, CH-8057.
[7] B. K. P. Horn. Robot vision. MIT Press,
1986.
[8] M. Krueger. Arti�cial Reality. Addison-
Wesley, 1983.
[9] K. Kyuma, E. Lange, J. Ohta, A. Hermanns,
B. Banish, and M. Oita. Nature, 372(197),
1994.
[10] R. K. McConnell. Method of and apparatus
for pattern recognition. U. S. Patent No.
4,567,610, Jan. 1986.