tr2005-159 november 2005 - mitsubishi electric … robust voice activity detector using an acoustic...
TRANSCRIPT

MITSUBISHI ELECTRIC RESEARCH LABORATORIEShttp://www.merl.com
A Robust Voice Activity Detector Using anAcoustic Doppler Radar
Rongqiang Hu, Bhiksha Raj
TR2005-159 November 2005
Abstract
This paper describes a robust voice activity detector using an acoustic Doppler radar device.The sensor is used to detect the dynamic status of the speaker’s mouth. At the frequenciesof operation, background noises are largely attenuated, rendering the device robust to externalacoustic noises in most operating conditions. Unlike the other non-acoustic sensors, the deviceneed not be taped to the speaker, making it more acceptable in most situations. In this paper,various fetures computed from the sensor output are exploited for voice activity detection. Thebest set of features is selected based on robustness analysis. A support vector machine classifier isused to make the final speech/non-speech decision. Experimental results show that the proposeddoppler-based voice activity detector improves speech/non-speech classification accuracy overthat obtained using speech alone. The most significant improvements happen in low signal-to-noise (SNR) environments.
IEEE Automatic Speech Recognition and Understanding Workshop (ASRU)
This work may not be copied or reproduced in whole or in part for any commercial purpose. Permission to copy in whole or in partwithout payment of fee is granted for nonprofit educational and research purposes provided that all such whole or partial copies includethe following: a notice that such copying is by permission of Mitsubishi Electric Research Laboratories, Inc.; an acknowledgment ofthe authors and individual contributions to the work; and all applicable portions of the copyright notice. Copying, reproduction, orrepublishing for any other purpose shall require a license with payment of fee to Mitsubishi Electric Research Laboratories, Inc. Allrights reserved.
Copyright c©Mitsubishi Electric Research Laboratories, Inc., 2005201 Broadway, Cambridge, Massachusetts 02139

MERLCoverPageSide2

A ROBUST VOICE ACTIVITY DETECTOR USING AN ACOUSTIC DOPPLER RADAR
Rongqiang Hu1, Bhiksha Raj2
1Georgia Institute of Technology,2Mitsubishi Electric Research Laboratories
ABSTRACT
This paper describes a robust voice activity detector using anacoustic Doppler radar device. The sensor is used to detect thedynamic status of the speaker’s mouth. At the frequencies of op-eration, background noises are largely attenuated, rendering thedevice robust to external acoustic noises in most operating condi-tions. Unlike the other non-acoustic sensors, the device need notbe taped to the speaker, making it more acceptable in most situ-ations. In this paper, various features computed from the sensoroutput are exploited for voice activity detection. The best set offeatures is selected based on robustness analysis. A support vectormachine classifier is used to make the final speech/non-speech de-cision. Experimental results show that the proposed doppler-basedvoice activity detector improves speech/non-speech classificationaccuracy over that obtained using speech alone. The most signifi-cant improvements happen in low signal-to-noise (SNR) environ-ments.
1. INTRODUCTION
Voice activity detectors (VAD) are used to demarcate regionsof conversational speech from silent or non-speech regions of aspeech signal. VADs are important to many speech processingapplications such as speech enhancement, speech coding, speechrecognition etc. Various VAD algorithms have been proposed inthe literature, that are based on zero crossing rates, spectral repre-sentatives (LPC, LSF, etc.), statistical speech and noise modeling[1], source separation, and decision-making based on a combina-tion of different features [2]. The algorithms perform well in quietor high SNR environments. But the performance drops dramati-cally as the level of background noise increases.
Conventional voice activity detectors work chiefly from mea-surements obtained from the speech signal. A recent trend hasbeen the use of measurements fromsecondarysensors in addi-tional to the primary speech recording, for the measurement ofspeech signals in the presence of strong background noise. Thesesensors typically provide measurements of one or more aspects ofthe speech production process such as a coarse measurement of thespeech signal itself, or measurements of glottal activity, as a proxyfor the actual speech and tend to be relatively immune to acousticnoise. These sensors typically do not provide enough informationabout the speech generation process to replace microphone sen-sors; instead, these sensors must be used in conjunction with amicrophone and additional signal processing in order to augmentthe acoustic speech signal for the purpose of speech enhancement,coding and recognition in high-noise environments. Secondarysensors have been shown to greatly improve the performance ofvoice activity detection in high noise environments.
Most current secondary sensors used for voice activity detec-tion, however, suffer the drawback that they require contact withthe speaker. Bone conduction microphones must be mounted on
a the jaw bone. Physiological microphones (P-mics), throat mi-crophones and the non-acoustic glottal electromagnetic sensors(GEMS) must all be mounted on the speaker’s face or throat. Thisrestricts their utility in most applications.
In this paper we propose the use of an entirely different va-riety of secondary sensor for voice activity detection - a Doppleracoustic radar. The Doppler radar consists of a high-frequency ul-tra sound emitter and an acoustic transducer that is tuned to thetransmitted frequency. The ultra-sound tone emitted from the sen-sor is reflected from the speaker’s face and undergoes a Dopplerfrequency shift that is proportional to normal velocity of the por-tion of the face that it is reflected from. The spectrum of the re-flected signal thus contains an spectrum of frequencies that rep-resent the motion of the speakers cheeks, lips, tongue, etc. Thevoicing state of the speaker (i.e. speech. vs. non-speech activity)is estimated using a support vector machine classifier on appropri-ate measurement derived from this reflected signal.
While the Doppler measurements are not as detailed as thoseobtained from secondary sensors such as P-mics or GEMS sen-sors, the measurements obtained from it are nevertheless adequatefor voice activity detection. Experiments conducted on spoken ut-terances collected in the presence of a variety of background noisesshow that the proposed VAD algorithm based on acoustic Dopplermeasurements results in significantly better voice activity detec-tion than that obtained from measurements of the speech signalalone. Additionally the proposed secondary sensor has the advan-tage that it need not be mounted on the speaker. In fact it is ef-fective even at a distance of 10-15cm from the speaker. It is alsofar more economical than cameras (which can also be used to de-rive useful secondary measurements from a distance) - an acousticDoppler radar setup can be constructed for less than $10.
The rest of the paper is arranged as follows: in Section 2 webriefly review the problem of voice activity detection, and the useof secondary sensors for the purpose. In Section 3 we describe theacoustic Doppler radar based secondary sensor. In Section 4 wepresent an analysis of the mutual information between the signalcaptured by the proposed Doppler sensor and the speech signal. InSection 5 we describe the features computed from the Doppler sig-nal. In Section 6 we review the Support Vector Machine classifierused for speech/non-speech detection. In Section 7 we describeour experimental evaluation of the proposed voice activity detec-tion algorithm and finally in Section 8 we present our conclusions.
2. VOICE ACTIVITY DETECTION USING SECONDARYSENSORS
Voice activity detection is the problem of determining whether anysegment of a speech recording occurs within a continuously spo-ken utterance or if it actually represents the bracketing non-speechregions. This has traditionally been performed using the recorded
speech signal itself. When the speaker is speaking, the recordedsignalY (f) (as represented in the frequency domain) is a mix-ture of speechS(f) and noiseN(f), i.e. Y (f) ∼= S(f) + N(f).When no speech is uttered, the sensor captures chiefly noise, i.e.Y (f) = N(F ). The goal of VAD is to determine whether speechis present or not from observations ofY (f).
The simplest VAD procedures are based on thresholding ofmeasurements such as zero crossings and energy. More sophisti-cated techniques (e.g. [1]) employ statistical models applied eitherto the signal itself, or to features derived from it, such as spec-tra, LPC residuals, etc. These algorithms perform very well inclean and low-noise environments. However, in real-world envi-ronments with high levels of noise they often perform poorly.
The use of secondary sensors to improve the noise robust-ness of VAD has become increasingly popular in recent times.These are sensors that obtain secondary measurements either ofthe speech signal, or of the underlying speech generation process.An important criterion for an effective secondary sensor is that itsmeasurements must be relatively immune to or independent of thebackground noise that affects the speech signal itself.
Most current research on secondary sensors for VAD is con-centrated on sensors whose measurements are linearly relatableto the speech signal. From a speech production perspective, thespeech signal can be modeled as
S(f) = G(f)V (f)R(f) (1)
whereG(f), V (f), andR(f) represent glottal excitation, the fre-quency response of the vocal cavity and lip radiation respectively.In most current research, measurements from the secondary sensorare required to be linearly relatable to one or more of the compo-nents on the right hand side of Equation 1. That is, the measure-ments must be of the formY (f) = H(f)S(f) in speech regions,whereH(f) represents a linear filter. Additionally, and more im-portantly, they must be relatively insensitive to the noise that cor-rupts the speech signal, i.e. in non-speech regionsY (f) ¿ N(f).
A variety of secondary sensors have been proposed that sat-isfy these conditions. Examples of such sensors are the physi-ological microphone (P-mic), which measures the movement ofthe tissue near the speaker’s throat, and the bone-conduction mi-crophone, which measures the vibration of bone associated withspeech production. In these sensorsH(f) is a low-pass filter.The signal captured in non-speech areas is significantly lower thanN(f). A second kind of secondary sensor seeks to provide a func-tion of the glottal excitation, e.g. the Electroglottograph (EGG)[3],and the glottal electromagnetic sensor (GEMS) [4]. In this case,X(f) ∼= G(f) during voiced speech, and the corrupting noise isnearly 0 in non-speech regions.
All of these secondary sensors have shown promise in manyspeech applications, such as voice activity detection, speech en-hancement and coding [5, 6, 7]. However, they typically re-quire that sensors be placed in direct contact with the talkersskin in a suitable location, making them uncomfortable to users.Also, the measurements they provide are not always perfectly lin-early relatable to speech. While the P-mic and bone-conductionmicrophone provide relatively noise-free measurements at low-frequencies, they do not capture speech-related information inhigher frequencies, and are unreliable in unvoiced regions. TheEGG and GEMS sensors approximate glottal excitation functionduring voiced speech, but they can not provide any measurementabout unvoiced speech. The high cost of these sensors also makesthem impractical in many applications.
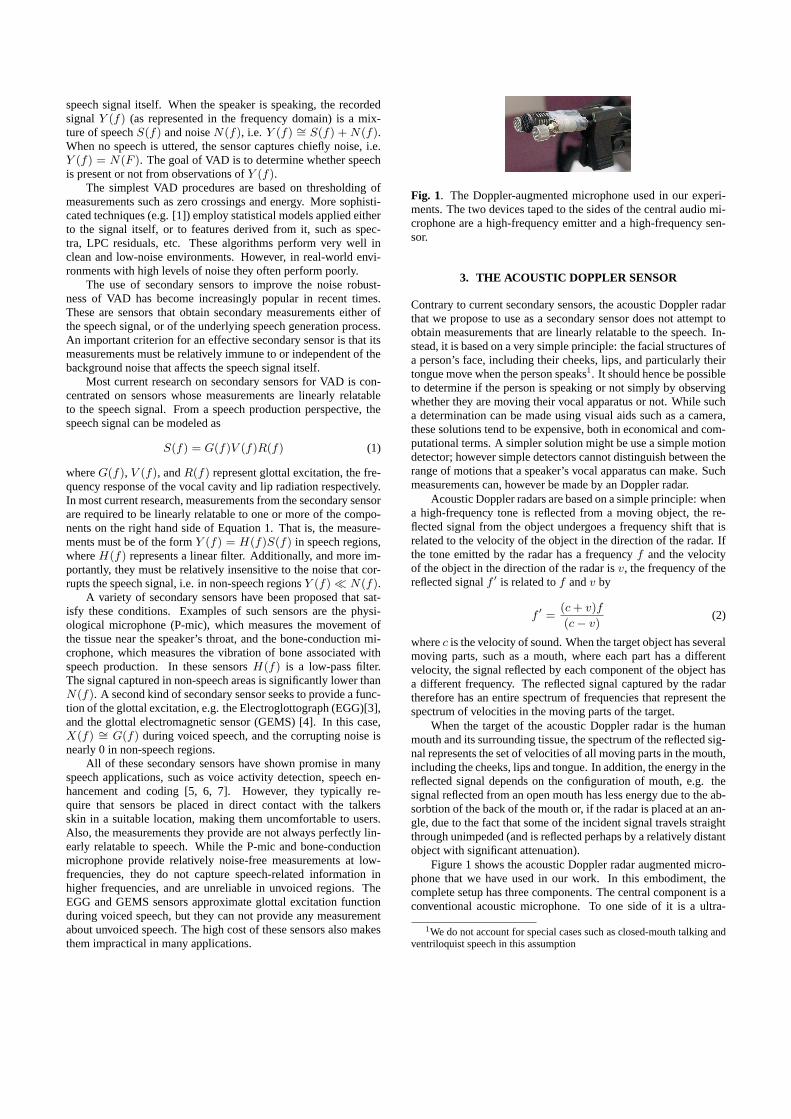
Fig. 1. The Doppler-augmented microphone used in our experi-ments. The two devices taped to the sides of the central audio mi-crophone are a high-frequency emitter and a high-frequency sen-sor.
3. THE ACOUSTIC DOPPLER SENSOR
Contrary to current secondary sensors, the acoustic Doppler radarthat we propose to use as a secondary sensor does not attempt toobtain measurements that are linearly relatable to the speech. In-stead, it is based on a very simple principle: the facial structures ofa person’s face, including their cheeks, lips, and particularly theirtongue move when the person speaks1. It should hence be possibleto determine if the person is speaking or not simply by observingwhether they are moving their vocal apparatus or not. While sucha determination can be made using visual aids such as a camera,these solutions tend to be expensive, both in economical and com-putational terms. A simpler solution might be use a simple motiondetector; however simple detectors cannot distinguish between therange of motions that a speaker’s vocal apparatus can make. Suchmeasurements can, however be made by an Doppler radar.
Acoustic Doppler radars are based on a simple principle: whena high-frequency tone is reflected from a moving object, the re-flected signal from the object undergoes a frequency shift that isrelated to the velocity of the object in the direction of the radar. Ifthe tone emitted by the radar has a frequencyf and the velocityof the object in the direction of the radar isv, the frequency of thereflected signalf ′ is related tof andv by
f ′ =(c + v)f
(c− v)(2)
wherec is the velocity of sound. When the target object has severalmoving parts, such as a mouth, where each part has a differentvelocity, the signal reflected by each component of the object hasa different frequency. The reflected signal captured by the radartherefore has an entire spectrum of frequencies that represent thespectrum of velocities in the moving parts of the target.
When the target of the acoustic Doppler radar is the humanmouth and its surrounding tissue, the spectrum of the reflected sig-nal represents the set of velocities of all moving parts in the mouth,including the cheeks, lips and tongue. In addition, the energy in thereflected signal depends on the configuration of mouth, e.g. thesignal reflected from an open mouth has less energy due to the ab-sorbtion of the back of the mouth or, if the radar is placed at an an-gle, due to the fact that some of the incident signal travels straightthrough unimpeded (and is reflected perhaps by a relatively distantobject with significant attenuation).
Figure 1 shows the acoustic Doppler radar augmented micro-phone that we have used in our work. In this embodiment, thecomplete setup has three components. The central component is aconventional acoustic microphone. To one side of it is a ultra-
1We do not account for special cases such as closed-mouth talking andventriloquist speech in this assumption
sound emitter that emits a 40Khz tone. To the other side is ahigh-frequency transducer that is tuned to capture signals around40Khz. The microphone and transmitter are well-aligned, andplaced directly pointed to the mouth. The dynamic status of themouth moving is measured by the device. It must be noted that thedevice also captures high-frequency harmonics from the speechand any background noise; however these are significantly attenu-ated with respect to the level of the reflected Doppler signal in moststandard operating conditions2. The device does not require con-tact with the skin. As may be inferred from Figure 1, the acousticDoppler was placed at exactly the same distance as the desktopmicrophone itself from the speakers, in our experiments. The costof the entire setup shown in the Figure is not significantly greaterthan that of the acoustic microphone itself: the high-frequencytransmitter and receiver both cost less than a dollar. The trans-mission and capture of the Doppler signal can be performed con-currently with that of the acoustic signal by a standard stereo soundcard. Since the high-frequency transducer is highly tuned and hasa bandwidth of only about 4Khz, the principle of band-pass sam-pling may be applied, and the signal need not be sampled at morethan 12Khz (although in our experiments we have sampled the sig-nal at 96Khz).
4. MUTUAL INFORMATION ANALYSIS OF THEDOPPLER SENSOR
In order to be effective, the measurements from the acousticDoppler sensor must be related to the underlying clean speech sig-nal. Stated otherwise, knowledge of the Doppler signal must re-duce the uncertainty in our knowledge of the speech signal. Thepredictability of the speech signal from the Doppler measurementcan be stated as the mutual information between the two signals.
The mutual information (MI,I(x, y)) between two variablesx andy is described as
I(x, y) = D[P (x, y) ‖P (x), P (y)] (3)
=
Zx,y
P (x, y) logP (x, y)
P (x)P (y)dxdy (4)
whereP (x) andP (y) are the densities ofx andy respectively, andP (x, y) is the joint density ofx andy. D denotes the Kullback-Leibler divergence, also known as the relative entropy. The MIcovers all kinds of linear and non-linear dependencies [8]. In casethe statistical distributions of the variables are unknown and onlya limited amount of samples of the variables are available for mea-surement, a non-parametric estimator is proposed in [9]. The al-gorithm approximates the mutual information arbitrarily closely inprobability by calculating relative frequencies on appropriate par-titions of the data space and achieving conditional independenceon the rectangles of which the partitions are made.
Reviewing the objectives of employing a secondary sensor inrobust speech processing , the qualification of a secondary sen-sor in robust speech processing can be summarized in informationtheoretic terms as follows:
• High dependency between the outputs of the secondary sen-sorX and clean speechS, i.e. I(X, S) is large.
2The system will however not work if there are any devices in the vicin-ity that specifically emit noise at 40Khz.
• High independence of the outputs of a secondary sensorXand noiseN ,i.e. I(X, N) is low.
In recordings obtained from high-noise environments, the secondcondition may also be stated as a requirement of lowI(X, Y ), i.e.of independence between the doppler and noisy speech measure-ments. Given these criteria, the robustness of a secondary sensorcan be represented as the normalized change of mutual informa-tion in noisy environments.
∆I(X, Y ‖SNR) =I(X, S)− I(X, Y ‖SNR)
I(X, S)(5)
The greater the value of∆I(X, Y ‖SNR) the more useful themeasurements of the sensor can be expected to be in processinghighly noisy speech.
The MI analysis of recordings from GEMS, P-mic and EGGsensors is listed in Table 1. The results confirm the observationsin [6, 7] that GEMS contains more secondary information aboutspeech than P-mics and EGG, and is also more robust than the oth-ers two. As described in section 2, P-mic recordings contain somelevel of acoustic noise. All of these sensors have been appliedto robust speech processing and have produced improved perfor-mance in voice activity detection and speech enhancement [7].
Table 1. Mutual Information between the sensor outputs andacoustic signals
Clean Environment GEMS P-mic EGGI(X,S) 0.272 0.075 0.091
Noise Office Tank Shoot Helicopter∆I(X, Y ) (23dB) (1dB) (13dB) (3dB)
GEMS 0.202 0.993 0.743 0.996P-Mic 0.280 0.693 0.027 0.640EGG 0.044 0.912 0.626 0.967
The MI between the Doppler radar and acoustic speech signalsis given in Table 2. The table analyses signals captured in the pres-ence of both stationary and non-stationary noises. The similaritybetween the numbers in Tables 1 and 2 indicate that the Dopplerradar sensor can provide effective secondary information for ro-bust speech processing in noisy environments.
Table 2. Mutual Information between the Doppler radar outputsand acoustic signals
Clean Environment Doppler RadarI(X,S) 0.097
Noise Office Car Babble Speech Music(22dB) (4dB) (5dB) (7dB) (5dB)
∆I(X, Y ) 0.041 0.938 0.959 0.680 0.835
5. FEATURE SELECTION
The motion of the mouth plays an essential role in speech produc-tion. In order to produce different sounds, a person must change

speech spectrogram
0 0.5 1 1.5 2 2.5 3 3.5
x 104
0
0.5
1
doppler radar spectrogram
0 0.2 0.4 0.6 0.8 1 1.2 1.4 1.6 1.8 2
x 105
0
0.5
1
50 100 150 200 250 300 350 400 450
0
0.5
1
voice activities
50 100 150 200 250 300 350 400 4500
0.02
0.04full−band energy
50 100 150 200 250 300 350 400 4500
2
4x 10
−3 low−band energy
50 100 150 200 250 300 350 400 4500
50
100peak frequency bin defference
Fig. 2. Example of features in music noise (SNR=12dB)
the configuration of their entire vocal apparatus, particularly themouth. This is true regardless of whether the sound is voiced orunvoiced. Sensors that measure voicing-based information fromthe vocal tract are only effective in detecting voiced speech. Forunvoiced sounds, such as unvoiced consonants, these sensors donot provide any information. Measuring the dynamic status of themouth, however, is effective in detecting both voiced and unvoicedsounds.
5.1. Parameter Extraction
In processing Doppler radar signals, two key features are consid-ered: reflected energy and peak reflected frequency. When a toneof frequencyf is reflected off a slowly moving object with veloc-ity v ¿ c, the reflected frequencyf ′ is given by the followingmodification of Equation 2:
f ′ =
�1 +
2v
c
�f (6)
When a speaker’s mouth is closed, there is no motion of themouth, i.e.v = 0. Hence, the observed frequencyf ′ = f . Whilespeaking, the mouth and tongue of the speaker move. The veloc-ity of the moving parts of the mouth are typically in the order of0.1m/s, although the peak velocity of the tongue can be signifi-cantly greater. Since our acoustic Doppler device emits a signalat 40KHz, the reflected frequencyf ′ will be in the neighbourhood
Table 3. Mutual Information of features with voice activity labelsClean Ef ∆Ef El ∆El Fp ∆Fp
I(A, L) 0.878 1.594 1.175 1.932 0.313 2.709Feature Office Car Babble Speech Music
∆I(A, L) (22dB) (4dB) (5dB) (7dB) (5dB)Ef 0.001 0.012 0.009 0.042 0.006
∆Ef 0.003 0.010 0.022 0.013 0.029El 0.002 0.007 0.016 0.038 0.056
∆El 0.005 0.019 0.039 0.051 0.078Fp 0.028 0.037 0.055 0.083 0.062
∆Fp 0.009 0.034 0.026 0.009 0.017
of 40020Hz. Although an entire spectrum of frequencies is re-flected from the various moving parts of the mouth, typically onefrequency dominates the rest. The actual observed peak frequencycan be calculated picking the highest peak from the Fourier trans-form of radar signals. The velocity of the vocal parts, and thereforethe observed peak frequency, vary significantly in time. Therefore,a very high resolution FFT is required in the frequency region(39900Hz-40100Hz) to calculate the accurate peak frequency, inorder to distinguish between different states of oral motion.
When the mouth is open, radar signals reach the “walls” ofthe mouth at various angles. The signals are reflected in many di-rections. Therefore, the received radar energy varies. This featurecan also be used to indicate the speaking status. Since there is, inactuality, an entire range of velocities in the vocal apparatus, the“interesting” signals exist in a frequency range of 39900-40100Hz.We therefore calculate the signal energy in this frequency band asa feature, which we denote as “full-band energy“.
In addition to the Doppler reflections, the high-frequencytransducer also captures high-frequency harmonics of the speechsignal, albeit at highly attenuated levels. Since this informationis present, we also choose to use it for voice activity detection.We therefore compute the signal energy in the frequency band(20000Hz-39900Hz) and designate it as “low-band energy”.
In addition to these basic features, we also compute differencefeatures that measure their deviation with time. Thus the followingset of parameters is extracted from the input doppler signal. Thesemeasurements are obtained once every 10ms, and are derived overa 100ms analysis window.
• Peak Frequency (Fp)
• The Peak Frequency Difference (∆Fp)
• Full-Band Energy (Ef )
• Low-Band Energy (El)
• The Full-Band Energy Difference (∆Ef )
• The Low-Band Energy Difference (∆El)
These features are independent of acoustic disturbance, thusimmune to background noise. Figure 2 shows examples of the se-lected feature, obtained from a signal recorded in noisy conditions.
5.2. Robustness Analysis
The robustness and estimation accuracy are the two most importantconsiderations for selecting features to detect voice activity. Asmentioned in the previous sections, mutual information is a usefultool to determine the dependency of two signals.

The dependency of the feature (A) and the correspondingvoice activity labels (L) is investigated using the mutual informa-tion (I(A, L)). The MI gives an indication of estimation accuracy.The variation of MI in different environments (∆I(A, L)) mea-sures the robustness of a feature. A lower value indicates greaterrobustness. Table 3 lists the MI results between the extracted fea-tures and voice activity labels in a variety of conditions.
From the results, we can conclude that the selected features arevery robust to background noise. Each of them will contributes tothe voice activity detection. Of the set, the peak frequency bindifference is the most effective feature.
6. SVM CLASSIFIER
We perform the actual speech/non-speech classification of eachanalysis frame of the signal using a support vector machine (SVM)classifier. Support vector machines are known to provide goodclassification performance in real-world classification problemswhich typically involve data that can only be separated using anonlinear decision surfaces [10, 11].
We use the kernel based variant of the SVM classifier, forwhich the decision function has the form
f(x) =
NXi=1
αidiK(x, xi) + b (7)
whereN is the number of support vectors, andK(x, xi) is thekernel function.K(x, xi), in this implementation, is a radial basisfunction (RBF).
K(x, xi) = exp{−Ψ(|x− xi|2)} (8)
Since the voice activity detection is a binary decision classi-fication problem, a soft margin classifier can be used to addressthe problem of nonseparable data. Slack variables [10] are used torelax the separation constraints:8<: xi • w + b ≥ +1− ξi, for di = +1
xi • w + b ≤ −1− ξi, for di = −1ξi ≥ 0,∀i
(9)
wheredi are the class assignments,w represents the weight vectordefining the classifier,b is a bias term, andξi are the slack vari-ables.
In our implementation, the support vectors are trained usingfeatures extracted from a training set with hand-labeled voice ac-tivity index. The binary class associated with each analysis frameis the corresponding voice activity index.
7. EVALUATION
A small corpus of simultaneous speech and acoustic Doppler radarsignals was recorded at Mitsubishi Electric Research Labs. Thecorpus includes two speakers speaking 30 TIMIT sentences underfive different noise environments: office, car, babble, competingspeech, and music. All signals were recorded in the presence ofbackground noise, i.e. the noise was not digitally added. Theboundaries of speech were hand labelled and the SNR was esti-mated from the RMS signal values in the speech and non-speechregions. The SNRs vary in a large range (-5dB to 30dB)
Two voice activity detectors were implemented based on theacoustic speech signals only. One was the prior speech presence
0.5 1 1.5 2 2.5 3 3.5 4 4.5 5 5.5
x 104
−1
0
1noisy speech waveform
speech spectrogram
0 0.5 1 1.5 2 2.5
x 104
0
0.5
1
50 100 150 200 250 300
0
0.5
1
1.5voice activities
doppler radar spectrogram
0 2 4 6 8 10 12 14 16
x 104
0
0.5
1
ground truthSVM−dopplerSVM−speech
Fig. 3. Illustration of voice activity detection in babble noise(SNR=0dB)
probability model with minimum statistics noise estimation, whichhas been shown to be effective in preserving weak speech cues.The other is an SVM classifier trained on the same database. Wesimplified this model using speech energy features only derivedfrom a bank of four Mel-scaled filters. A preliminary SVM clas-sifier combining the features from Doppler radar and speech wasalso tested.
Figure 3 and Figure 4 demonstrate the behavior of two SVMvoice activity detectors based on the feature computed from theoutput of the Doppler radar and speech respectively. The accuracyresults in a variety of noise environments are provided in Table 4.
Table 4 shows the frame-wise percentage accuracy ofspeech/non-speech classification on speech corrupted to varyinglevels by various noises. We observe that the SVM classifier,based on the features of the Doppler signal, is very robust in noisyenvironments, outperforming VAD classification based on speechalone in most cases. The robustness of the Doppler based VAD isapparent in that its performance degrades much more slowly withincreasing noise than VAD that is based on speech alone.
However in other situations the Doppler-based VAD is not asaccurate as that based on speech. The reason for this is simple -people often move their mouths before they begin speaking, andwill move their mouths and faces under other conditions as well.Also, the face and vocal apparatus remains relatively stationaryduring long vowels, giving the impression of vocal inactivity. Insuch situations, the Doppler radar by itself cannot determine ifspeech is present. However, in many of these situations cues tothe presence of speech are available from the audio signal. Thus,it may be expected that VAD performance can be further improvedif the Doppler measurements could be combined with those fromthe speech signal, for voice activity detection. This hypothesis isborne out by the results obtained when features from the speechand Doppler signals were combined in the SVM classifier: Ta-ble 4 shows that VAD performance obtained with a combinationof Doppler and speech signals is consistently superior to that ob-tained with either of the two signals alone.

0.5 1 1.5 2 2.5 3 3.5 4 4.5 5 5.5
x 104
−0.5
0
0.5noisy speech waveform
speech spectrogram
0 0.5 1 1.5 2 2.5
x 104
0
0.5
1
50 100 150 200 250 300 350
0
0.5
1
1.5voice activities
doppler radar spectrogram
0 2 4 6 8 10 12 14 16
x 104
0
0.5
1
ground truthSVM−dopplerSVM−speech
Fig. 4. Illustration of voice activity detection in music noise(SNR=0dB)
Table 4. Accuracy of voice activity detectorsNoise Min. Stat SVM SVM SVM
Type SNR model Speech Radar Comb.0dB 89.55 95.10 90.78 95.48
Office 10dB 90.47 95.47 90.37 95.2320dB 93.81 96.49 92.63 97.72AVG. 92.24 95.97 91.68 96.010dB 54.84 88.32 92.69 91.72
Car 10dB 67.45 90.21 92.22 93.0120dB 83.58 93.45 90.77 95.03AVG. 70.32 91.96 92.01 93.260dB 51.50 65.54 89.28 89.93
Babble 10dB 60.76 73.89 90.76 90.8020dB 73.04 88.96 93.29 94.01AVG. 65.84 78.90 91.95 92.430dB 57.02 57.53 93.37 91.59
Speech 10dB 62.72 73.34 92.99 92.8620dB 74.67 85.97 93.74 94.86AVG. 67.11 77.69 93.36 93.270dB 50.89 70.39 90.27 89.51
Music 10dB 54.32 77.92 93.13 93.8920dB 63.39 86.23 92.74 94.12AVG. 59.20 78.77 92.63 92.73
8. CONCLUSION
The proposed Doppler-radar-based VAD algorithm was observedto be very robust in all noisy environments, particularly whenDoppler measurements were combined with measurements of thespeech signal. Dramatic improvements are seen particularly in lowSNR conditions. The proposed Doppler radar based sensor thuspromises to be a highly effective secondary sensor for voice activ-ity detection.
The proposed acoustic Doppler radar provides data about themotion of the face - a measurement that is not directly obtainablefrom the speech signal itself. The information it provides is thuscomplementary to that obtainable from the speech signal. Hence,it may be expected that even if the basic speech signal based VADalgorithm were to be improved significantly, its performance couldbe further enhanced by combining it with the Doppler measure-ments. Additionally, the Doppler measurements may be comple-mentary to current secondary sensors such as GEMS and boneconduction sensors, and their performance may also be further im-proved by combining them with the Doppler sensor.
Finally, we have thus far only attempted to use the Dopplermeasurements to improve voice activity detection. It stands to rea-son that the improved voice activity detection can be translatedto improved signal enhancement as well. Doppler radar measure-ments may also be useful secondary features for automatic speechrecognition. We will address these issues in future research.
9. REFERENCES
[1] Saeed Gazor and Wei Zhang, “A soft voice activity detectorbased on a Laplacian-Gaussian model,”IEEE Transactionson Speech and Audio Processing, vol. 11, pp. 498–505, Sept.2003.
[2] S. G. Tanyer and H. Ozer, “Voice activity detection in non-stationary noise,”IEEE Transactions on Speech and AudioProcessing, vol. 8, pp. 478–482, July 2000.
[3] R. Baken, “Electroglottography,” inJ. Voice, 1992, pp. 98–110.
[4] G. C. Burnett, J. F. Holzrichter, T. J. Gable, and L. C.Ng, “The use of glottal electromagnetic micropower sen-sors (GEMS) in determining a voiced excitation function,”presented at the 138th Meeting of the Acoustical Society ofAmerica, Columbus, Ohio, Nov. 1999.
[5] L.C. Ng, G.C. Burnett, J.F. Holzrichter, and T.J. Gable,“Background speaker noise removal using combined EMsensor/acoustic signal signals,” presented at the 138th Meet-ing of the Acoustical Society of America, Columbus, Ohio,Nov. 1999.
[6] R. Hu and D. V. Anderson, “Single acoustic channel speechenhancement based on glottal correlation using non-acousticsensors,” inInternational Conference on Spoken LanguageProcessing, Jeju, Korea, Oct. 2004.
[7] D. Messing,Noise Suppression with Non-Air-Acoustic Sen-sors, Masters Thesis, MIT, Sept. 2003.
[8] T. M. Cover and J. A. Thomas,Elements of Information The-ory, Wiley, New York.
[9] G.A. Darbellay and Igor Vajda, “Estimation of the informa-tion by an adaptive partition of the observation space,”IEEETransaction on Information Theory, vol. 45, pp. 1315–1321,May 1999.
[10] V.N. Vapnik, Statistical Learning Theory, New York: Wiley,1998.
[11] Aravind Ganapathiraju, J. E. Hammake, and Joseph Picone,“Signal modeling techniques in speech recognition,”IEEETransactions on Speech and Audio Processing, vol. 81, pp.1215–1247, Sept. 1993.