tr-043 bioassay of emetine for possible … of. emetine. for possible carcinogenicity. ... a bioassa...
TRANSCRIPT

National Cancer InstituteCARCINOGENESISTechnical Report SeriesNo. 431978
BIOASSAY OF
EMETINE
FOR POSSIBLE CARCINOGENICITY
CAS No. 483-18-1
NCI-CG-TR-43
U.S. DEPARTMENT OF HEALTH, EDUCATION, AND WELFAREPublic Health ServiceNational Institutes of Health


BIOASSAY OF
EMETINE
FOR POSSIBLE CARCINOGENICITY
Carcinogenesis Testing Program Division of Cancer Cause and Prevention
National Cancer Institute National Institutes of Health Bethesda, Maryland 20014
U.S. DEPARTMENT OF HEALTH, EDUCATION, AND WELFARE Public Health Service
National Institutes of Health
DHEW Publication No. (NIH) 78-843


BIOASSAY OF EMETINE
FOR POSSIBLE CARCINOGENICITY
Carcinogenesis Testing Program Division of Cancer Cause and Prevention
National Cancer Institute National Institutes of Health
CONTRIBUTORS; This report presents the results of the bioassay of emetine for possible carcinogenicity, conducted for the Carcinogenesis Testing Program, Divison of Cancer Cause and Prevention, National Cancer Institute (NCI), Bethesda, Maryland. The bioassay was conducted by Southern Research Institute, Birmingham, Alabama, initially under direct contract to NCI and currently under a subcontract to Tracer Jitco, Inc., prime contractor for the NCI Carcinogenesis Testing Program.
The experiments;! design and doses were determined by Drs. D. P. Griswold1, J. D. Prejean1, E. K. Weisburger2, and J. H. Weisburger2»3. Ms. J. Belzer^ and Mr. I. Brown1 were responsible for the care of the laboratory animals. Data management and retrieval were performed by Ms. C. A. DominickA. Histopathologic examinations we:re performed by Drs. S. D. Kosanke^ and J. C. Peckhaml, and the diagnoses included in this report represent their interpretation. Reported neoplasms and treatment-related hyperplastic l€:sions were reviewed by Dr. J. F. Hardisty^, who also prepared the interpretive pathology summary included in this report.
Animal pathology tables and survival tables were compiled at EG&G Mason Research Institute^. The statistical analyses were performed by Dr. J. R. Joiner", using methods selected for the bioassay program by Dr. J. J. Gart'. Chemicals used in this bioassay were analyzed by Drs. W. J. Morris** and R. H. Iwamoto°, and the analytical results were reviewed by Dr. S. S. Olin^.
This report was prepared at Tracer Jitco" under the direction of Dr. Marshall St«;inberg, Director of the Bioassay Program; Drs. J.
iii

F. Robens and C. H. Williams, toxicologists; Dr. R. L. Schueler, pathologist; Ms. M. S. King and Mr W. D. Reichardt, technical writers; and Dr. E. W. Gunberg, technical editor, assisted by Ms. Y. E. Presley and Ms. P. J. Graboske.
The statistical analysis was reviewed by one or more members of the Mathematical Statistics and Applied Mathematics Section of NCI?: Dr. John J. Gart, Mr. Jun-mo Nam, Dr. Hugh M. Pettigrew, and Dr. Robert E. Tarone.
The following other scientists at the National Cancer Institute were responsible for evaluating the bioassay experiment, interpreting the results, and reporting the findings:
Dr. Kenneth C. Chu Dr. Cipriano Cueto, Jr. Dr. J. Fielding Douglas Dr. Dawn G. Goodman Dr. Richard A. Griesemer Mr. Harry A. Milman Dr. Thomas W. Orme Dr. Robert A. Squire9
Dr. Jerrold M. Ward
^Southern Research Institute, 2000 Ninth Avenue South, Birmingham, Alabama.
^Carcinogenesis Testing Program, Division of Cancer Cause and Prevention, National Cancer Institute, National Institutes of Health, Bethesda, Maryland.
^Now with the Naylor Dana Institute for Disease Prevention, American Health Foundation, Hammond House Road, Valhalla, New York.
^Experimental Pathology Laboratories, 17 Pine Street, Herndon, Virginia.
iv

EG&G Mason Research Institute, 1530 East Jefferson Street, Rockville, Maryland.
^Tracer Jitco, Inc., 1776 East Jefferson Street, Rockville, Maryland.
^Mathematical Statistics and Applied Mathematics Section, Biometry Branch, Field Studies and Statistics, Division of Cancer Cause and Prevention, National Cancer Institute, National Institutes oJ: Health, Bethesda, Maryland.
^Stanford Research Institute, Menlo Park, California.
%ow with the Division of Comparative Medicine, Johns Hopkins University, School of Medicine, Traylor Building, Baltimore, Maryland.
V


SUMMARY
A bioassay of emetine, an amebicide and anticancer drug, for possible carcinogenicity was conducted by administering the test material by intraperitoneal injection to Sprague-Dawley rats and B6C3F1 mice.
Groups of 35 rats of each sex were administered emetine at one of two doses, either 0.5 or 1 mg/kg body weight, three times per week for 52 weeks, and then observed for an additional 31 or 32 weeks. Control groups of each sex consisted of 10 untreated rats (untreated controls) and 10 rats injected with buffered saline (vehicle controls). Pooled-control groups, used for statistical evaluation, consisted of the vehicle-control rats of each sex for this study combined with 15 vehicle-control rats of each sex from a similar bioassay of another test chemical. All surviving rats were killed at 83 or 84 weeks.
Initially, groups of 35 mice of each sex were administered emetine at one of two doses, either 3.2 or 6.4 mg/kg body weight (mid- and high-dose), three times per week. Control groups of each sex consisted of 15 untreated mice (untreated controls) and 15 mice injected with buffered saline (vehicle controls). Due to high mortality rates in the initial treated groups, additional groups of 35 mice of each sex were later put on study at 1.6 mg/kg (low-dose), together with 10 untreated-control and 10 vehicle-control mice of each sex. The high-dose males were treated for 28 weeks and the mid- and high-dose females for 40 and 33 weeks, respectively. Mid- and low-dose male mice and low-dose female mice were treated for 52 weeks, and then observed for an additional 20 or 26 weeks. All surviving mice were killed at 78-83 weeks.
Emetine was toxic to male rats at the high dose, to both sexes of mice at the high and mid doses and to a lesser extent at the low dose, as shown by the low survival in these groups. Twenty-six percent of the high-dose male rats and 69% of the high-dose female rats, but none of the high- and mid-dose mice of either sex, survived to the end of the study. In the low-dose mice,
vii
30/35 males and 21/35 females lived at least 1 year, and the median time on study was 72 weeks for males and 59 weeks for females.
No tumors occurred at a statistically significant incidence in treated rats or mice compared with controls; however, it should be noted that in this study, treatment of both species was stopped at week 52 and the studies were terminated by week 83, which is earlier than in current bioassays where animals are treated until termination of the studies at 2 years. In addition, there was poor survival among the treated mice.
It is concluded that the results of this study do not allow evaluation of the possible carcinogenicity of emetine.
viii

TABLE OF CONTENTS
Page
I. Introduction * 1
II. Materials and Methods 3
A. Chemical 3 B. Dosage Preparation 4 C. Animals 4 D. Animal Maintenance 5 E. Subchronic Studies 7 F. Designs of Chronic Studies 9 G. Clinical and Pathologic Examinations 9 H. Data Recording and Statistical Analyses 14
III. Results - Rats 19
A. Body Weights and Clinical Signs (Rats) 19 B. Survival (Rats) 19 C. Pathology (Rats) 22 D. Statistical Analyses of Results (Rats) 24
IV. Results - Mice 27
A. Body Weights and Clinical Signs (Mice) 27 B. Survival (Mice) 27 C. Pathology (Mice) 33 D. Statistical Analyses of Results (Mice) 34
V. Discussion 37
VI. Bibliography 39
APPENDIXES
Appendix A Summary of the Incidence of Neoplasms in
Table Al Summary of the Incidence of Neoplasms in
Rats Treated with Emetine 43
Male Rats Treated with Emetine 45
Table A2 Summary of the Incidence of Neoplasms in Female Rats Treated with Emetine 48
ix

Page
Appendix B Summary of the Incidence of Neoplasms in Mice Treated with Emetine 51
Table Bl Summary of the Incidence of Neoplasms in Male Mice Treated with Emetine (Control Groups).... 53
Table B2 Summary of the Incidence of Neoplasms in Male Mice Treated with Emetine (Treated Groups).... 56
Table B3 Summary of the Incidence of Neoplasms in Female Mice Treated with Emetine (Control Groups).. 59
Table B4 Summary of the Incidence of Neoplasms in Female Mice Treated with Emetine (Treated Groups).. 62
Appendix C Summary of the Incidence of Nonneoplastic Lesions in Rats Treated with Emetine 65
Table Cl Summary of the Incidence of Nonneoplastic Lesions in Male Rats Treated with Emetine 67
Table C2 Summary of the Incidence of Nonneoplastic Lesions in Female Rats Treated with Emetine 70
Appendix D Summary of the Incidence of Nonneoplastic Lesions in Mice Treated with Emetine 73
Table Dl Summary of the Incidence of Nonneoplastic Lesions in Male Mice Treated with Emetine (Control Groups) 75
Table D2 Summary of the Incidence of Nonneoplastic Lesions in Male Mice Treated with Emetine (Treated Groups) 78
Table D3 Summary of the Incidence of Nonneoplastic Lesions in Female Mice Treated with Emetine (Control Groups) 82
Table D4 Summary of the Incidence of Nonneoplastic Lesions in Female Mice Treated with Emetine (Treated Groups) 85
Appendix E Analyses of the Incidence of Primary Tumors in Rats Treated with Emetine 89

Page
Table El Analyses of the Incidence of Primary Tumors in Male Rats Treated with Emetine 91
Table E2 Analyses of the Incidence of Primary Tumors in Female Rats Treated with Emetine 96
Appendix F Analyses of the Incidence of Primary Tumors in Mice Treated with Emetine 101
Table Fl Analyses of the Incidence of Primary Tumors in Male Mice Treated with Emetine 103
Table F2 Time-adjusted Analyses of the Incidence of Primary Tumors in Male Mice Treated with Emetine... 105
TABLES
Table 1 Design of Chronic Studies of Emetine in Rats 10
Table 2 Design of Chronic Studies of Emetine in Male Mice 11
Table 3 Design of Chronic Studies of Emetine in Female Mice 12
FIGURES
Figure 1 Growth Curves for Rats Treated with Emetine 20
Figure 2 Survival Curves for Rats Treated with Emetine 21
Figure 3 Growth Curves for Male Mice Treated with Emetine 28
Figure 4 Growth Curves for Female Mice Treated with Emetine 29
Figure 5 Survival Curves for Male Mice Treated with Erne tine 31
Figure 6 Survival Curves for Female Mice Treated with Emetine 32
xi

I. INTRODUCTION
Emetine (CAS 483-18-1; NCI C01605), an alkaloid derived from the
root of the tropical plant Cephaelis ipecacuanha, is used to
treat severe amebic intestinal infections, amebic hepatitis, and
amebic involvement of the lung, brain, skin, and other tissues
(Rollo, 1975). Clinical symptoms of toxicity due to emetine
include nausea, vomiting, diarrhea, muscle weakness, and
cardiovascular disturbance.
In experimental studies, emetine was cytotoxic to transplantable
mouse osteosarcoma in vitro but not in vivo (Morasca et al. ,
1974). In clinical studies, emetine was effective against non
specific granuloma (Grollman, 1966), and the analogue, dehydro
emetine, was effective against leukemia, Hodgkin's disease, and
rectal adenocarcinoma (Abd-Rabbo, 1966 and 1969; Wyburn-Mason,
1969). The drug has been shown to interfere with nucleic acid
and protein biosynthesis in HeLa and other mammalian cells
(Gilead and Becker, 1971; Grollman and Huang, 1973).
Emetine was tested in the carcinogenesis program in an attempt to
evaluate the carcinogenicity of certain drugs that are used in
humans over extended periods of time.
1


II. MATERIALS AND METHODS
A. Chemical
Emetine hydrochloride (6',7',10,11-tetramethoxyemetan dihydro
chloride) was supplied by the Drug Development Branch, Division
of Cancer Treatment (DCT), National Cancer Institute (NCI). The
chemical was obtained in a single batch (Lot No. 988-0800) from
Sigma Chemical Company, St. Louis, Missouri.
Analyses performed by Stanford Research Institute under contract
to the Drug Development Branch, DCT, NCI, confirmed the identity
and purity of this batch. Following United States Pharmacopeia
(USP) assay procedures, the batch was found to contain 11.5%
water, corresponding to a tetrahydrate, and approximately 1.5%
cephaeline (a precursor in the synthesis). Less than 0.1% of one
additional (unidentified) alkaloid was detected. These results
conform to USP specifications. In addition, elemental analyses
(C, H, N, Cl~) were correct for C29H4oN204'2HCl*4H20, the
molecular formula of emetine dihydrochloride tetrahydrate. Infra
red, ultraviolet, and nuclear magnetic resonance spectra also
were as expected for emetine hydrochloride, hereinafter called
emetine.
According to the USP, the chemical is affected by light.
Stanford Research Institute reported noticeable decomposition (by
3

thin-layer chromatography) of an aqueous solution (ca. 25 mg/ml)
after 1 week of exposure to ordinary illumination at room
temperature. Therefore, solutions we're prepared immediately
before injection.
The bulk chemical was stored at -20°C.
B. Dosage Preparation
Buffered saline solution (pH 6.9) was used as the vehicle for
intraperitoneal injection of the chemical. The drug and the
vehicle were mixed in a 10-ml glass Potter-Elvehjem tissue
grinder with a Teflon pestle. Fresh solutions were prepared
daily and administered immediately. The concentrations were 0.02
and 0.04% for rats and 0.016, 0.032, and 0.064% for mice.
C. Animals
Sprague-Dawley rats and B6C3F1 mice of both sexes, obtained from
Charles River Breeding Laboratories, Inc., Wilmington,
Massachusetts, through contracts of the DCT, NCI, were used in
this bioassay. On arrival at the laboratory, all animals were
quarantined for an acclimation period (rats for 5 days, mice in
the original study for 18 days, mice in the restarted study for
25 days), assigned to control and treated groups, and then
earmarked for individual identification.
4
D. Animal Maintenance
All animals were housed in temperature- and humidity-controlled
rooms. The temperature range was 20-24°C, and the relative
humidity was maintained at 40-60%. The room air was changed 15
times per hour and passed through incoming and exhaust fiberglass
roughing filters. In addition to natural light, illumination was
®provided by fluorescent light for 9 hours each day. Wayne Lab
Blox (Allied Mills, Inc., Chicago, 111.) and water were supplied
daily and were available ad libitum.
Rats were housed five per cage and mice seven per cage in solid
bottom stainless steel cages (Hahn Roofing and Sheet Metal Co. ,
Birmingham, Ala.). The bottoms of the rat cages were lined with
® Iso-Dri hardwood chips (Carworth, Edison, N.J.), and cage tops
were covered with disposable filter bonnets beginning at week 18.
®Mouse cages were provided with Sterolit clay bedding (Englehard
Mineral and Chemical Co., New York, N.Y.). Cages of restarted
groups of mice were provided with filter bonnets at week 75.
Bedding was replaced once per week; cages, water bottles,
feeders, and racks were sanitized once per week.
The rats and mice were housed in separate rooms. Control animals
were housed with their respective treated animals. Animals
treated with emetine were maintained in the same rooms as animals
of the same species being treated with the following chemicals:
5

RATS
Gavage Studies
cholesterol (p-(bis(2-chloroethyl)amino)phenyl)acetate (phenesterin) (CAS 3546-10-9)
estradiol bis((p-(bis(2-chloroethyl)amino)phenyl)acetate) (estradiol mustard) (CAS 22966-79-6)
Intraperitoneal Injection Studies
4'-(9-acridinylamino)methansulfon-m-aniside monohydrochloride (MAAM) (NSC 141549)
acronycine (CAS 7008-42-6) 5-azacytidine (CAS 320-67-2) beta-2'-deoxy-6-thioguanosine monohydrate (beta-TGdR)
(CAS 789-61-7) 1,4-butanediol dimethanesulfonate (busulfan) (CAS 55-98-1) 3,3'-iminobis-l-propanol dimethanesulfonate (ester) hydrochloride [IPD] (CAS 3458-22-8)
(+)-4,4'->(l-methyl-l,2-ethanediyl)bis-2,6-piperazinedione (ICRF-159) (CAS 21416-87-5)
N,3-bis(2-chloroethyl)tetrahydro-2H-l,3,2-oxazaphosphorin-2amine-2-oxide (isophosphamide) (CAS 3778-73-2)
N-(2-chloroethyl)-N-(l-methyl-2-phenoxyethyl)benzylamine hydrochloride (phenoxybenzamine) (CAS 63-92-3)
N-(l-methylethyl)-4-((2-methylhydrazino)methyl)benzamide monohydrochloride (procarbazine) (CAS 366-70-1)
tris(l-aziridinyl)phosphine sulfide (thio-TEPA) (CAS 52-24-4) 2,4,6-tris(dimethylamino)-s-triazine (CAS 645-05-6)
MICE
Feed Studies
4-acetyl-N-((cyclohexylamino)carbonyl)benzenesulfonamide (acetohexamide) (CAS 968-81-0)
anthranilic acid (CAS 118-92-3) l-butyl-3-(p-tolylsulfonyl)urea (tolbutamide) (CAS 64-77-7) 4-chloro-N-((propylamino)carbonyl)benzenesulfonamide (chlorpropamide) (CAS 94-20-2)
5-(4-chlorophenyl)-6-ethyl-2,4-pyrimidinediamine (pyrimethamine) (CAS 58-14-0)
ethionamide (CAS 536-33-4) 2,6-diamino-3-(phenylazo)pyridine hydrochloride (phenazopyridine hydrochloride) (CAS 136-40-3)
L-tryptophan (CAS 73-22-3)
6

N-9H-fluoren-2-ylacetamide (CAS 53-96-3) N-(p-toluenesulfonyl)-N'-hexamethyleniminourea
(tolazamide) (CAS 1156-19-0) 1-phenethylbiguanide hydrochloride (phenformin) (CAS 114-86-3) pyrazinecarboxamide (pyrazinamide) (CAS 98-96-4) 4,4'-sulfonyldianiline (dapsone) (CAS 80-08-0) 4,4'-thiodianil:Lne (CAS 139-65-1) ethionamlde (CAS 536-33-4)
Gavage Studies
cholesterol (p-(bis(2-chloroethyl)amino)phenyl)acetate (phenesterin) (CAS 3546-10-9)
estradiol bis((p-(bis(2-chloroethyl)amino)phenyl)acetate) (estradiol mustard) (CAS 22966-79-6)
Intraperitoneal Injection Studies
4'-(9-acridinylamino)methansulfon-m-aniside monohydrochloride (MAAM) (NSC 141549)
acronycine (CAS 7008-42-6) 5-azacytidine (CAS 320-67-2) beta-2'-deoxy-6-thioguanosine monohydrate (beta-TGdR)
(CAS 789-61-7) 1,4-butanediol dimethanesulfonate (busulfan) (CAS 55-98-1) 3,3'-iminobis-l-propanol dimethanesulfonate (ester) hydrochloride [IPD] (CAS 3458-22-8)
(+)-4,4'-(1-methyl-l,2-ethanediyl)bis-2,6-piperazinedione (ICRF-159) (CAS 21416-87-5)
N,3-bis(2-chloroethyl)tetrahydro-2H-l,3,2-oxazaphosphorin-2amine-2-oxide (isophosphamide) (CAS 3778-73-2)
N-(2-chloroethyl)-N-(l-methyl-2-phenoxyethyl)benzylamine hydrochloride (phenoxybenzamine) (CAS 63-92-3)
N-(l-methylethyl)-4-((2-methylhydrazino)methyl)benzamide monohydrochloride (procarbazine) (CAS 366-70-1)
tris(l-aziridinyl)phosphine sulfide (thio-TEPA) (CAS 52-24-4) 2,4,6-tris(dimethylamino)-s-triazine (CAS 645-05-6)
E. Subchronic Studies
Subchronic studies were conducted to estimate the maximum
tolerated doses of emetine, on the basis of which low and high
doses were determined for administration in the chronic studies.
7
In the subchronic studies, Sprague-Dawley male rats and Swiss
male mice were administered emetine by intraperitoneal injection
three times per week for 45 days. Following treatment, all
animals were observed for an additional 45 days before termin
ation of the study. Five animals of each species were used at
each dose, and 10 animals of each species were used as untreated
or vehicle (saline) controls.
In rats, administration of emetine at 0.1, 0.25, 0.5, and 1.0
mg/kg body weight resulted in no deaths and in no weight
depression that exceeded the 15% guideline. At 2.0 mg/kg, the
mean body weight was depressed and two animals died, one in week
7 and one in week 8. No lesions were observed in any of the
animals. The low and high doses for rats were set at 0.5 and 1
mg/kg for the chronic studies.
In mice, the subchronic study was initially conducted at doses of
0.17, 0.43, 0.85, 1.7, and 3.4 mg/kg. No deaths attributable to
drug toxicity and no weight depression exceeding the 15%
guideline resulted. A second study was then performed using
doses of 6.4, 12.8, and 25.6 mg/kg. Four of the five animals
receiving 12.8 mg/kg died prior to week 6, and 4/5 animals
receiving 25.6 mg/kg died prior to week 4; however, there were no
deaths at 6.4 mg/kg. Weight depression did not exceed the 15%
guideline in animals receiving 6.4 mg/kg, and no lesions were
8

seen in any of the animals at necropsy. The low and high doses
for mice were set at 3.2 and 6.4 mg/kg for the chronic studies.
F. Designs of Chronic Studies
The designs of the chronic studies are shown in tables 1, 2, and
3.
Since the numbers of rats in the matched vehicle-control groups
were small, pooled vehicle-control groups of rats also were used
for statistical comparisons. Vehicle-control rats from the
current injection studies on emetine were combined with vehicle
control rats from injection studies performed on 5-azacytidine
(CAS 320-67-2). The pooled controls for statistical tests using
rats consisted of 25 males and 25 females. The study on
5-azacytidine in rats was also conducted at Southern Research
Institute and overlapped the emetine study by at least 17 months.
The vehicle-control groups for 5-azacytidine were of the same
strain and from the same suppliers, and they were examined by the
same pathologist!?.
G. Clinical and Pathologic Examinations
All animals were observed twice daily for signs of toxicity, and
animals that were moribund were killed and necropsied. Rats and
mice were weighed, individually every week for the first 2 months
9

Table 1. Design of Chronic Studies of Emetine in Rats
Sex and Treatment Group
Male
Untreated-Control
Vehicle-Control
Low-Dose
High-Dose
Female
Untreated-Control
Vehicle-Control
Low-Dose
High-Dose
Initial No. of Animalsa
10
10
35
35
10
10
35
35
Emetine Doseb
(mg/kg)
0
Qd
0.5
1
0
Od
0.5
1
Time Treated0
(weeks )
52
52
52
52
52
52
on Study Untreated (weeks )
84
32
32
31
84
32
32
32
aMale rats were 34 days of age and female rats were 41 days of age when placed on study.
^Emetine was administered intraperitoneally in buffered saline three times per week at a volume of 0.25 ml/100 g body weight. Doses were based on individual weights.
CA11 rats were placed on study on the same day.
^Vehicle-control groups received buffered saline solution at the same volume as the treated groups.
10

Table 2. Design of Chronic Studies of Emetine in Male Mice
Sex and Treatment Group
Low-Dose Untreated-Control0
Low-Dose Vehicle-Control0
Low-Dosec
Mid- and High-Dose Untreated-Control Mid- and High-Dose Vehicle-Control Mid-Dose High-Dose
Initial No. of Animals3
10
10 35
15
15 35 35
Emetine Doseb
(mg/kg)
0
Od
1.6
0
Od
3.2 6.4
Time Treated (weeks)
52 52
52 52 28f
on Study Untreated (weeks)
80
26 26
83
30 20e
aHigh- and mid-dose animals and their controls were 48 days of age when placed on study; low-dose animals and their controls were 58 days of age.
"Emetine was administered intraperitoneally in buffered saline three times per week at a volume of 0.1 ml/10 g body weight. Doses were based on the mean weights of the animals in each cage.
cDue to the high mortality of the treated animals, one additional low-dose group and two low-dose control groups were started 32 weeks after the original start of the study. The original low-dose group became the mid-dose group.
^Vehicle-control groups received buffered saline solution at the same volume as the treated groups.
eAll mid-dose animals died or were killed by week 72.
high-dose animals died or were killed by week 28.
11

Table 3. Design of Chronic Studies of Emetine in Female Mice
Sex and Treatment Group
Low-Dose Untreated-Control0
Low-Dose Vehicle-Control0
Low-Do sec
Mid- and High-Dose Untreated-Control Mid- and High-Dose Vehicle-Control
Mid-Dose High -Dose
aHigh- and mid-dose animals and their controls were 49 days of age when placed on study; low-dose animals and their controls were 58 days of age.
^Emetine was administered intraperitoneally in buffered saline three times per week at a volume of 0.1 ml/10 g body weight. Doses were based on the mean weights of the animals in each cage.
cDue to the high mortality of the treated animals, one additional low-dose group and two low-dose control groups were started 32 weeks after the original start of the study. The original low-dose group became the mid-dose group.
^Vehicle-control groups received buffered saline solution at the same volume as the treated groups.
eAll mid-dose animals died or were killed by week 40.
*A11 high-dose animals died or were killed by week 33.
12
Emetine Doseb
(mg/kg)
0
0<1 1.6
0
Qd 3.2 6.4
Initial No. of Animals3
10
10 35
15
15 35 35
Time Treated (weeks )
52 52
52 40e 33f
on Study Untreated (weeks)
80
27 26
83
31

and every 2 weeks thereafter. Palpation for masses was carried
out at each weighing.
The pathologic evaluation consisted of gross and microscopic
examination of major tissues, major organs, and all gross lesions
from killed animals and from animals found dead. The following
tissues were examined microscopically: skin, muscle, lungs and
bronchi, trachea, bone marrow, spleen,, lymph nodes, thymus,
heart, salivary gland, liver, gallbladder (mice), pancreas,
esophagus, stomach, small intestine, large intestine, kidney,
urinary bladder, pituitary, adrenal, thyroid, parathyroid,
mammary gland, testis or ovary, prostate or uterus, brain, and
sensory organs. Peripheral blood smears from each animal were
prepared. Occasionally, additional tissues were also examined
microscopically. The different tissues were preserved in 10%
buffered formalin, embedded in paraffin, sectioned, and stained
with hematoxylin and eosin. Special staining techniques were
utilized when indicated for more definitive diagnosis.
A few tissues from some animals were not examined, particularly
from those animals that died early. Also, some animals were
missing, cannibalized, or judged to be in such an advanced state
of autolysis as to preclude histopathologic evaluation. Thus,
the number of animals from which particular organs or tissues
were examined microscopically varies, and does not necessarily
13

represent the number of animals that were placed on study in each
group.
H. Data Recording and Statistical Analyses
Pertinent data on this experiment have been recorded in an auto
matic data processing system, the Carcinogenesis Bioassay Data
System (Linhart et al., 1974). The data elements include descrip
tive information on the chemicals, animals, experimental design,
clinical observations, survival, body weight, and individual
pathologic results, as recommended by the International Union
Against Cancer (Berenblum, 1969). Data tables were generated for
verification of data transcription and for statistical review.
These data were analyzed using the statistical techniques
described in this section. Those analyses of the experimental
results that bear on the possibility of carcinogenicity are
discussed in the statistical narrative sections.
Probabilities of survival were estimated by the product-limit
procedure of Kaplan and Meier (1958) and are presented in this
report in the form of graphs. Animals were statistically
censored as of the time that they died of other than natural
causes or were found to be missing; animals dying from natural
causes were not statistically censored. Statistical analyses for
14
a possible dose-related effect on survival used the method of Cox
(1972) for testing two groups for equality and Tarone's (1975)
extensions of: Cox's methods for testing for a dose-related trend.
One-tailed P values have been reported for all tests except the
departure from linearity test, which is only reported when its
two-tailed P value is less than 0.05.
The incidence of neoplastic or nonneoplastic lesions has been
given as the ratio of the number of animals bearing such lesions
at a specific anatomic site (numerator) to the number of animals
in which that site is examined (denominator). In most instances,
the denominators included only those animals for which that site
was examined histologically. However, when macroscopic examin
ation was required to detect lesions prior to histologic sampling
(e.g., skin or mammary tumors), or when lesions could have
appeared at multiple sites (e.g., lymphomas), the denominators
consist of the numbers of animals necropsied.
The purpose of the statistical analyses of tumor incidence is to
determine whether animals receiving the test chemical developed a
significantly higher proportion of tumors than did the control
animals. As a part of these analyses, the one-tailed Fisher
exact test (Cox, 1970) was used to compare the tumor incidence of
a control group with that of a group of treated animals at each
dose level. When results for a number of treated groups (k) are
15

compared simultaneously with those for a control group, a
correction to ensure an overall significance level of 0.05 may be
made. The Bonferroni inequality (Miller, 1966) requires that the
P value for any comparison be less than or equal to 0.05/k. In
cases where this correction was used, it is discussed in the
narrative section. It is not, however, presented in the tables,
where the Fisher exact P values are shown.
The Cochran-Armitage test for linear trend in proportions, with
continuity correction (Armitage, 1971), was also used. Under the
assumption of a linear trend, this test determines if the slope
of the dose-response curve is different from zero at the one
tailed 0.05 level of significance. Unless otherwise noted, the
direction of the significant trend is a positive dose relation
ship. This method also provides a two-tailed test of departure
from linear trend.
A time-adjusted analysis was applied when numerous early deaths
resulted from causes that were not associated with the formation
of tumors. In this analysis, deaths that occurred before the
first tumor was observed were excluded by basing the statistical
tests on animals that survived at least 52 weeks, unless a tumor
was found at the anatomic site of interest before week 52. When
such an early tumor was found, comparisons were based exclusively
on animals that survived at least as long as the animal in which
16
the first tumor was found. Once this reduced set of data was
obtained, the standard procedures for analyses of the incidence
of tumors (Fisher exact tests, Cochran-Armitage tests, etc.) were
followed.
When appropriate, life-table methods were used to analyze the
incidence of tumors. Curves of the proportions surviving without
an observed tumor were computed as in Saffiotti et al. (1972).
The week during which an animal died naturally or was sacrificed
was entered as the time point of tumor observation. Cox's
methods of comparing these curves were used for two groups;
Tarone's extension to testing for linear trend was used for three
groups. The sta.tistical tests for the incidence of tumors which
used life-table methods were one-tailed and, unless otherwise
noted, in the direction of a positive dose relationship.
Significant departures from linearity (P < 0.05, two-tailed test)
were also noted.
The approximate 95 percent confidence interval for the relative
risk of each trea.ted group compared to its control was calculated
from the exact interval on the odds ratio (Gart, 1971). The
relative risk is defined as p^/Pc where pt is the true binomial
probability of the incidence of a specific type of tumor in a
treated group of animals and pc is the true probability of the
spontaneous incidence of the same type of tumor in a control
17

group. The hypothesis of equality between the true proportion of
a specific tumor in a treated group and the proportion in a
control group corresponds to a relative risk of unity. Values in
excess of unity represent the condition of a larger proportion in
the treated group than in the control.
The lower and upper limits of the confidence interval of the
relative risk have been included in the tables of statistical
analyses. The interpretation of the limits is that in
approximately 95% of a large number of identical experiments, the
true ratio of the risk in a treated group of animals to that in a
control group would be within the interval calculated from the
experiment. When the lower limit of the confidence interval is
greater than one, it can be inferred that a statistically
significant result (P < 0.025 one-tailed test when the control
incidence is not zero, P < 0.050 when the control incidence is
zero) has occurred. When the lower limit is less than unity, but
the upper limit is greater than unity, the lower limit indicates
the absence of a significant result while the upper limit
indicates that there is a theoretical possibility of the
induction of tumors by the test chemical, which could not be
detected under the conditions of this test.
18

III. RESULTS - RATS
A. Body Weights and Clinical Signs (Rats)
Body weights of the low-dose male rats were comparable to those
of both the untreated and vehicle controls (figure 1). The
weights of the high-dose males were lower than those of the
controls during the period in which emetine was administered, but
were similar a.fter treatment was discontinued. The high-dose
female rats had lower body weights than those of both the control
groups, while the body weights of the low-dose female rats were
lower than those of the untreated controls, but similar to those
of the vehicle controls. Fluctuations in the growth curve may be
due to mortality; as the size of the group diminishes, the mean
body weight may be subject to wide variation.
No other clinical signs clearly associated with the adminis
tration of emetine were recorded.
B. Survival (Rats)
The Kaplan and Meier curves estimating the probabilities of
survival for male and female rats administered emetine by
intraperitoneal injection at the doses used in this experiment,
together with those of the matched controls, are shown in figure
2.
19

i i-
Figure 1. Growth Curves For Rats Treated With Emetine
20

Figure 2. Survival Curves for Rats Treated With Emetine
21

In male rats, the Tarone test result for positive dose-related
trend in mortality is significant (P < 0.001), and an indicated
departure from linear trend is observed (P < 0.001), due to the
steep increase in mortality in the high-dose rats, of which only
26% lived to the end of the study, with a median time on study of
53 weeks. Of the high-dose male rats, 18/35 lived at least 52
weeks on study, and no tumor was observed before this time. At
least 80% of the low-dose, vehicle-control, and untreated-control
groups survived to the end of the study.
In female rats, the Tarone test result is not significant; 69% of
the high-dose group, 83% of the low-dose group, all of the
vehicle-control group, and 70% of the untreated-control group
survived to termination of the study, providing sufficient
numbers of treated female rats for development of late-appearing
tumors.
C. Pathology (Rats)
Histopathologic findings on neoplasms in rats are summarized in
Appendix A, tables Al and A2; findings on nonneoplastic lesions
are summarized in Appendix C, tables Cl and C2.
A variety of neoplasms were seen both in control and treated
rats. Neoplasms were seen more frequently in the females than in
the males. The most frequently observed neoplasms in the female
22

rats were chromophobe adenomas of the pituitary gland, cortical
adenomas of the adrenal gland, and fibroadenomas of the mammary
gland. The neoplasms of the pituitary and adrenal glands occur
red with approximately equal frequency in treated and control
rats. The incidence of fibroadenomas of the mammary gland was
higher in the treated female rats than in the controls. These
tumors were characterized by local proliferations of well
differentiated fibrous tissue surrounding proliferating mammary
acinar and ductular epithelium. Much structural variation was
present in these neoplasms. In some of the neoplasms, the
connective tissue stroma was predominant, and in others, there
was a marked epithelial overgrowth. The histologic appearance of
the neoplasms in both the treated and control female rats was
similar to fibroadenomas known to occur spontaneously in female
Sprague-Dawley rats. Although the incidence of the neoplasm was
higher in the treated rats than in the controls, it was compar
able to published reports of spontaneously occurring mammary
gland fibroadenomas in this strain of rat (Davis et al., 1959;
Prejean et al., 1973; Thompson et al., 1961).
A variety of inflammatory, degenerative, and proliferative
lesions commonly seen in aged Sprague-Dawley rats were observed
with approximately equal frequency in treated and control
animals. Although there was a higher incidence of spontaneous
23

deaths in the treated groups, there were no consistent neoplastic
or nonneoplastic lesions in the animals that died spontaneously.
There were instances in this study where neoplastic lesions
occurred only in treated animals, or with increased frequency
when compared with the control group. The nature and incidence
of these lesions were similar to those known to occur
spontaneously in aged Sprague-Dawley rats. The histopathologic
evaluation of the study indicated that emetine administered for
the time period and at the doses used in this study did not
induce neoplastic lesions in the Sprague-Dawley rat.
D. Statistical Analyses of Results (Rats)
Tables El and E2 in Appendix E contain the statistical analyses
of the incidences of those primary tumors that were observed in
at least 5% of a treated group. The untreated controls are not
included in these tables and analyses, since the experimental
conditions of the vehicle controls more closely resemble those of
the treated animals.
In both sexes, the results of the Cochran-Armitage test for
positive dose-related trend and the Fisher exact test for direct
comparison of incidences between each of the control groups and
each of the treated groups are not significant.
24
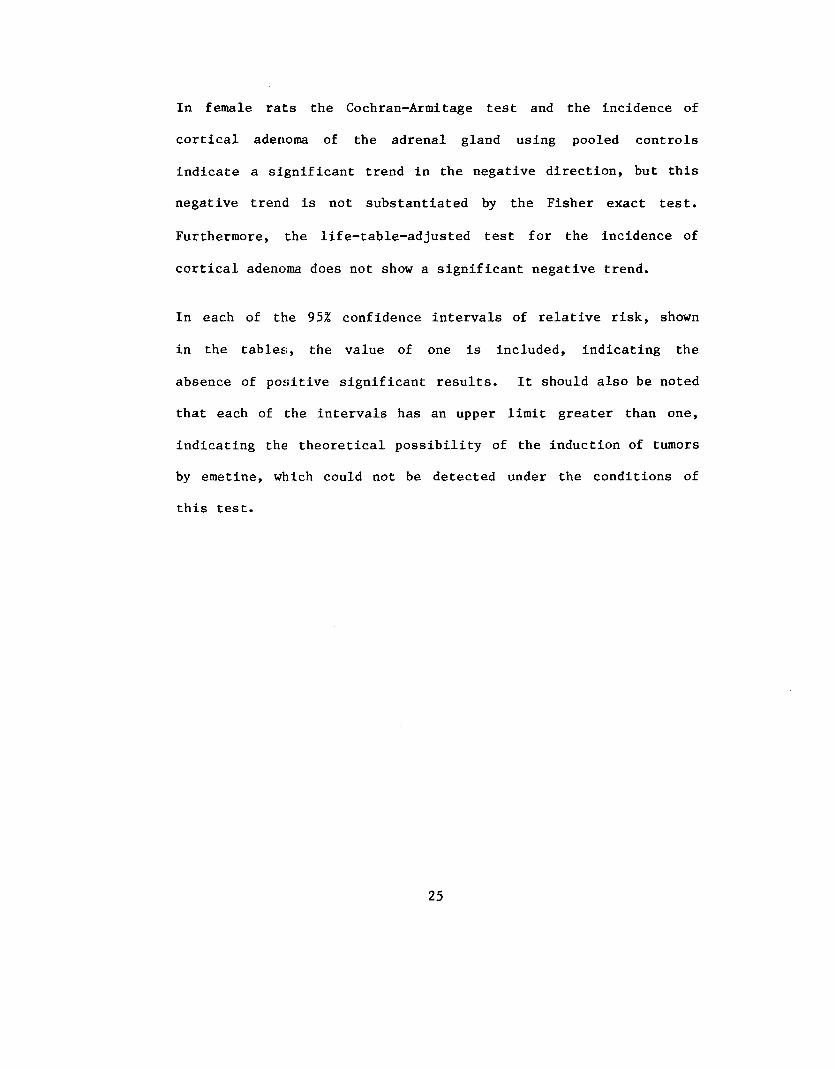
In female rats the Cochran-Armitage test and the incidence of
cortical adenoma of the adrenal gland using pooled controls
indicate a significant trend in the negative direction, but this
negative trend is not substantiated by the Fisher exact test.
Furthermore, the life-table-adjusted test for the incidence of
cortical adenoma does not show a significant negative trend.
In each of the 95% confidence intervals of relative risk, shown
in the tables;, the value of one is included, indicating the
absence of positive significant results. It should also be noted
that each of the intervals has an upper limit greater than one,
indicating the theoretical possibility of the induction of tumors
by emetine, which could not be detected under the conditions of
this test.
25


IV. RESULTS - MICE
A. Body Weights and Clinical Signs (Mice)
The high-dose male and female mice gained little weight, and most
of these animals died by week 33 (figures 3 and 4). The mean
body weights of the male mid-dose mice were lower than those of
both the control groups, while those of the female mid-dose mice
were comparable to those of the vehicle controls during the 40
weeks these mice survived. Mean body weights of the low-dose
groups of both sexes were comparable to those of both the control
groups.
Emetine was sufficiently toxic at the mid dose and high dose to
cause a shortened life span. No clinical signs of toxicity were
reported for the low-dose groups.
To control respiratory disease, the initial groups of mice were
treated with oxytetracycline in the drinking water at doses of
0.6 mg/ml for 5 days during week 55, followed by treatment for 5
days at 0.3 mg/ml. The restarted groups were not treated with
oxytetracycline.
B. Survival (Mice)
The Kaplan and Meier curves estimating the probabilities of
survival for male and female mice administered emetine by
27
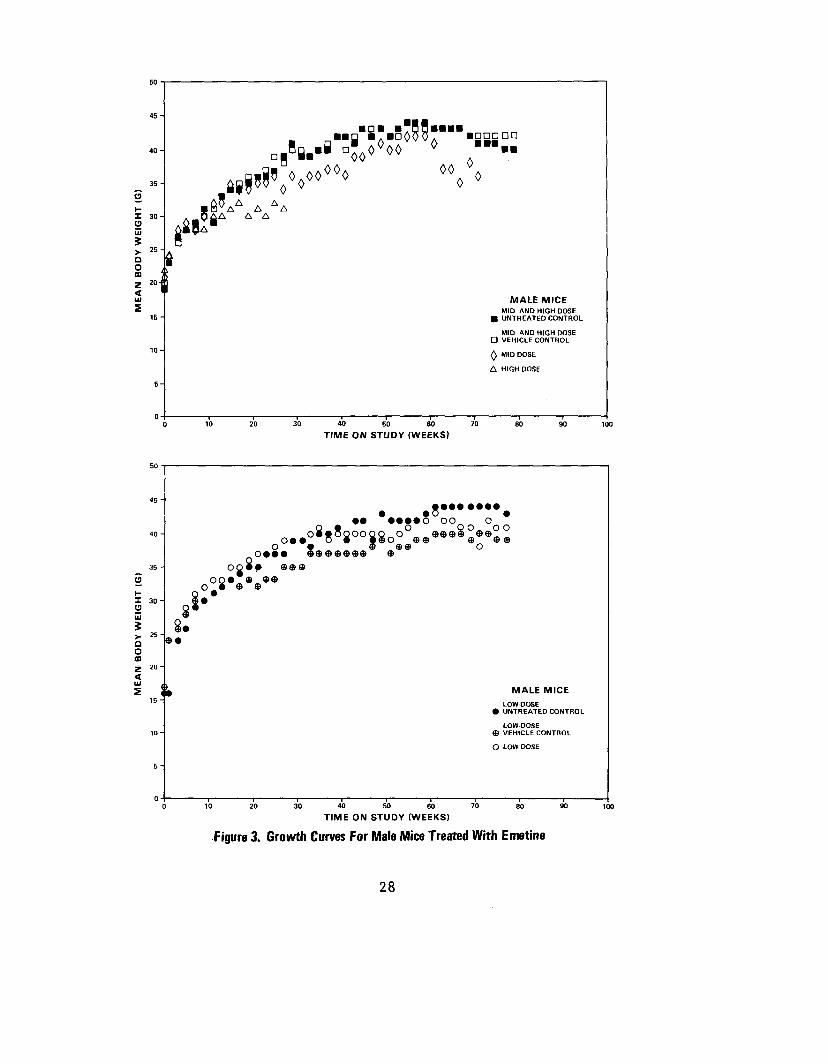
Figure 3. Growth Curves For Male Mice Treated With Emetine
28

Figure 4. Growth Curves For Female Mice Treated With Emetine
29
intraperitoneal injection at the doses used in this experiment,
together with those of the matched controls, are shown in figures
5 and 6.
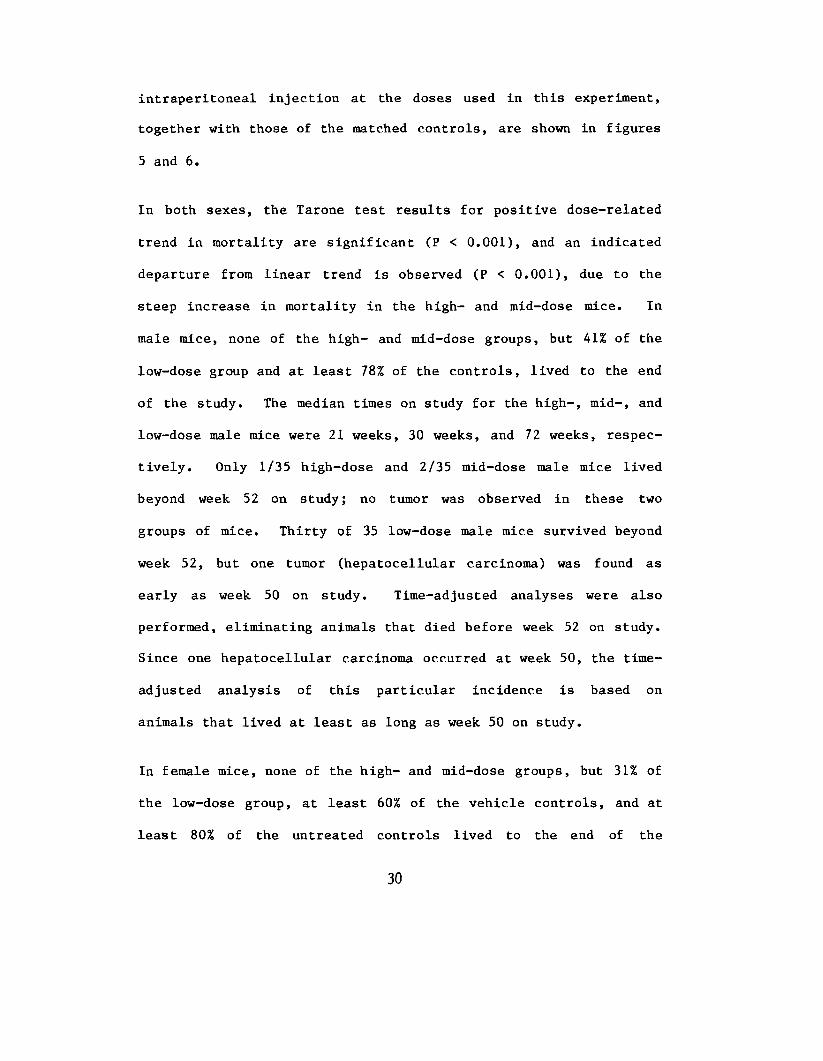
In both sexes, the Tarone test results for positive dose-related
trend in mortality are significant (P < 0.001), and an indicated
departure from linear trend is observed (P < 0.001), due to the
steep increase in mortality in the high- and mid-dose mice. In
male mice, none of the high- and mid-dose groups, but 41% of the
low-dose group and at least 78% of the controls, lived to the end
of the study. The median times on study for the high-, mid-, and
low-dose male mice were 21 weeks, 30 weeks, and 72 weeks, respec
tively. Only 1/35 high-dose and 2/35 mid-dose male mice lived
beyond week 52 on study; no tumor was observed in these two
groups of mice. Thirty of 35 low-dose male mice survived beyond
week 52, but one tumor (hepatocellular carcinoma) was found as
early as week 50 on study. Time-adjusted analyses were also
performed, eliminating animals that died before week 52 on study.
Since one hepatocellular carcinoma occurred at week 50, the time
adjusted analysis of this particular incidence is based on
animals that lived at least as long as week 50 on study.
In female mice, none of the high- and mid-dose groups, but 31% of
the low-dose group, at least 60% of the vehicle controls, and at
least 80% of the untreated controls lived to the end of the
30

Figure 5. Survival Curves For Male Mice Treated With Emetine
31
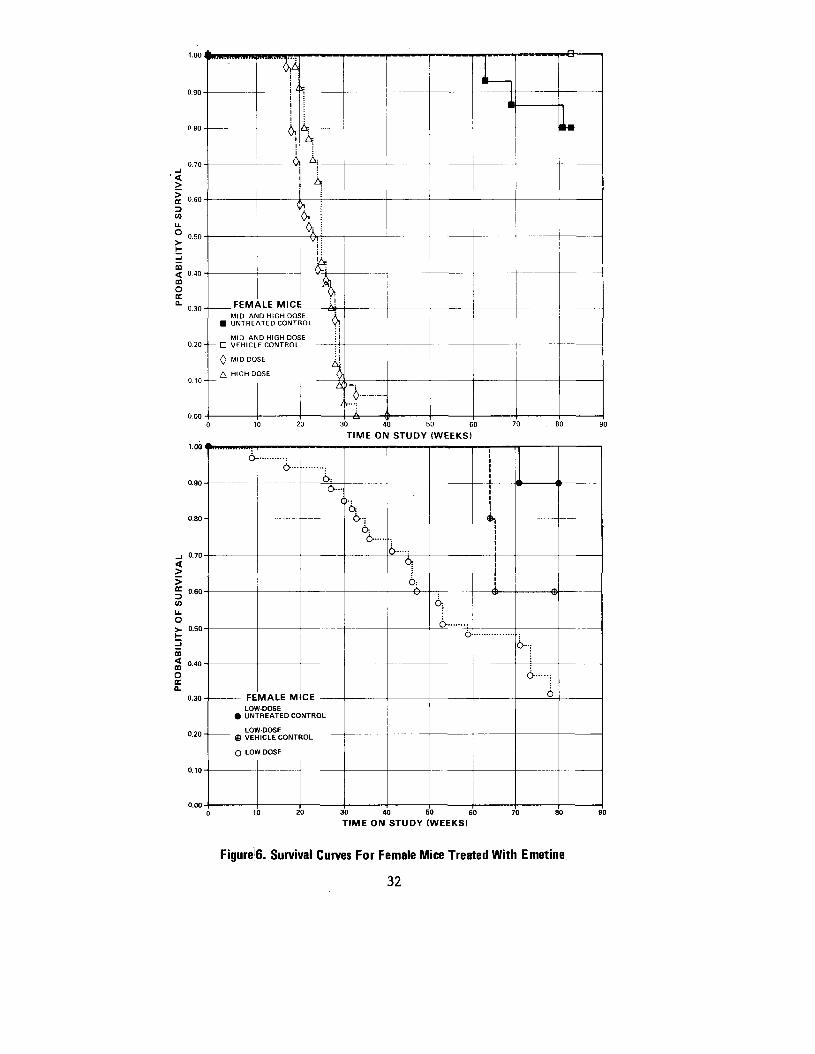
Figure6. Survival Curves For Female Mice Treated With Emetine
32

study. The median times on study of the high-, mid-, and
low-dose female mice were 25 weeks, 23 weeks, and 59 weeks,
respectively. All of the high- and mid-dose female mice died
before week 52 on study. No tumor was observed in the mid-dose
group, but one alveolar/bronchiolar adenoma was found in the
high-dose group as early as week 21. Of the low-dose female
mice, 21/35 lived to at least week 52; no tumor was observed
before that time.
The early deaths of the treated mice of both sexes may have
affected the incidences of late-appearing tumors.
C. Pathology (Mice)
Histopathologic findings on neoplasms in mice are summarized in
Appendix B, tables B1-B4; findings on nonneoplastic lesions are
summarized in Appendix D, tables D1-D4.
A variety of neoplasms occurred with approximately equal
frequency in control and treated mice. There was a low incidence
of neoplasia in both control and treated mice. The extremely low
incidence of neoplasia in the mid- and high-dose mice was
probably due to the high number of early deaths that occurred in
these groups.
33

Several inflammatory and degenerative lesions occurred with
approximately equal frequency in the control and treated mice.
The treated groups had a higher incidence of inflammatory lesions
in the respiratory system, the digestive system, and the
abdominal cavity when compared with the control groups. These
inflammatory lesions appeared to be related to emetine at these
doses and associated with an increase in mortality. •
The histopathologic evaluation of the lesions indicated that
emetine administered for the time period and at the doses used in
this study had a toxic effect, since the higher doses caused a
shortened life span.
D. Statistical Analyses of Results (Mice)
Tables Fl and F2 in Appendix F contain the statistical analyses
of the incidences of those primary tumors that were observed in
at least 5% of a treated group. The untreated controls are not
included in these tables and analyses, since the experimental
conditions of the vehicle controls more closely resemble those of
the treated groups. There is no table or analysis for female
mice, because the proportions of lesions in the treated groups
are less than 5%. In fact, only three tumors were observed among
all treated female mice: two in the low-dose and one in the
high-dose group.
34

Since there wa.s extremely high mortality in the treated male
mice, time-adjusted analyses were performed, eliminating animals
that died before week 52 on study. One hepatocellular carcinoma
was found as early as week 50 in the low-dose group; thus, the
time-adjusted analysis of the incidence of this tumor of the
liver is based only on animals that lived at least as long as
week 50 on study. These time-adjusted analyses of the male mice
are shown in table F2 in Appendix F.
The Cochran-Armitage test is not applied here, because the
survivals of the various treated and control groups are not
comparable. The Fisher exact test for direct comparison of the
incidences in each of the control groups with those in each of
the treated groups are not significant, either before or after
the time-adjustment. In each of the 95% confidence intervals of
relative risk, shown in the tables, the value of one is included,
indicating the absence of positive significant results. It
should also be noted that each of the intervals has an upper
limit greater than one, indicating the theoretical possibility of
the induction of tumors by emetine, which could not be detected
under the conditions of this test.
35


V. DISCUSSION
In this bioassay, emetine was toxic to male rats at the high
dose, to both sexes of mice at the high and mid doses, and to a
lesser extent at the low dose, as shown by the low survival in
these groups. This study was terminated at week 84 in rats and
week 83 in mice. Twenty-six percent of the high-dose male rats
and 69% of the high-dose female rats survived to the end of the
study. In mice* none of the high- and mid-dose animals of either
sex survived to the end of the study. At the low-dose, 30/35
males and 21/35 females lived for at least 1 year, and the median
time on study was 72 weeks for the males and 59 weeks for the
females.
A variety of neoplasms were observed in both control and treated
rats, but only the incidence of fibroadenoma of the mammary gland
in the females was higher in the treated rats than in the
controls. However, the incidence was not statistically
significant.
The incidences of neoplasms in treated mice of each sex were low
and were similar to those of both untreated and vehicle controls.
As early as 1912, the use of emetine in the chemotherapy of
amebiasis was recorded, and reports of its antitumor activity
appeared as early as 1918 and 1919 (Grollman and Jarkovsky,
37

1975). The results of a 24-week test for the carcinogenicity of
emetine in mice, evaluated by measuring the induction of
pulmonary tumors, was negative (Stoner et al., 1973).
It should be noted that in this study, treatment of both species
was stopped at week 52 and the studies were terminated by week
83, which is earlier than in current bioassays where animals are
treated until termination of the studies at 2 years. In
addition, there was poor survival among the treated mice.
It is concluded that the results of this study do not allow
evaluation of the possible carcinogenicity of emetine.
38

VI. BIBLIOGRAPHY
Abd-Rabbo, H., Chemotherapy of neoplasia (cancer) with dehydroemetine. J. Trop. Med. Hyg. 72(12):287-290. 1969.
Abd-Rabbo, H., Dehydroemetine in chronic leukemia. Lancet J.: 1161-162, 1966.
Armitage, P., Statistical Methods in Medical Research, John Wiley & Sons, Inc., 1971, pp. 362-365.
Berenblum, I., ed., Carcinogenicity Testing; A Report of the Panel on Carcinogenicity of the Cancer Research Commission of the UICC, International Union Against Cancer, Geneva, 1969.
Cox, D. R., Regression models and life tables. J. R. Statist. Soc. B 34(2);187-220, 1972.
Cox, D. R., Analysis of Binary Data, Methuen & Co., Ltd., London, 1970, pp. 48-52.
Davis, R. K. , Stevenson, G. T., and Busch, K. A., Tumor incidence in normal Sprague-Dawley female rats. Cancer Res.
16:194-197, 1959.
Gart, J. J., The comparison of proportions: a review of significance tests, confidence limits and adjustments for stratification. Rev. Int. Statist. Inst. 39;148-169, 1971.
Gilead, Z. and Becker, Y., Effect of emetine on ribonucleic acid biosynthesis in HeLa cells. Eur. J. Biochem. 23;143-149, 1971.
Grollman, A. P. and Jarkovsky, Z., Emetine and related alkaloids. In: Antibiotics, Vol. Ill; Mechanism of Action of Antimicrobial and Antitumor Agents, eds., Corcoran, J. W. and Hahn, F. E., Springer-Verlag, New York, 1975, pp. 420-435.
Grollman, A. P. and Huang, M. T. , Inhibitors of protein synthesis in eukarvotes: tools in cell research. Federation Proc. 32:1673-1678, 1973.
39

Grollman, A. P., Structural basis for inhibition of protein synthesis by emetine and cycloheximide based on an analogy between ipecac alkaloids and glutarimide antibiotics. Proc. Natl. Acad. Sci.. USA 56:1867-1874. 1966.
Kaplan, E. L. and Meier, P., Nonparametric estimation from incomplete observations. J. Amer. Statist. Assoc. 13:457-481, 1958.
Linhart, M. S., Cooper, J. , Martin, R. L., Page, N. , and Peters, J., Carcinogenesis bioassay data system. Comp. and Biomed. Res. 7:230-248, 1974.
Miller, R. G. , Jr. , Simultaneous Statistical Inference, McGraw-Hill Book Co., New York, 1966, pp. 6-10.
Morasca, L., Balconi, G., Erba, E. , Lilieveld, P. and van Putten, L. M., Cytotoxic effect in vitro and tumour volume reduction in vivo induced by chemotherapeutic agents. Eur. J. Cancer JLO(IO): 667-671, 1974.
Prejean, J. D., Peckham, J. C., Casey, A. E. , Greswald, D. P., Weisburger, E. K., and Weisburger, J. H., Spontaneous tumors in Sprague-Dawley rats and Swiss mice. Cancer Res. J33:2768-2773, 1973.
Rollo, I. M., Drugs used in the chemotherapy of amebiasis. In: The Pharmacological Basis of Therapeutics, eds., Goodman, L. S. and Gilman, A., MacMillan, New York, 1975, pp. 1069-1080.
Saffiotti, U., Montesano, R., Sellakumar, A. R., Cefis, F., and Kaufman, D. G., Respiratory tract carcinogenesis in hamsters induced by different numbers of administrations of benzo(a) pyrene and ferric oxide. Cancer Res. 32:1073-1081, 1972.
Stoner, G. D., Shimkin, M. B., Kniazeff, A. J., Weisburger, J. H., Weisburger, E. K. , and Gori, G. B., Test for carcinogenicity of food additives and chemotherapeutic agents by the pulmonary tumor response in strain A mice. Cancer Res. 33:3069-3085, 1973.
Tarone, R. E., Tests for trend in life table analysis. Biometrika 62(3);679-682. 1975.
40

Thompson, S. W. , Husby, R. A., Fox, M. A., Davis, C. L. , and Hunt, R. D., Spontaneous tumors in the Sprague-Dawley rat. J. Natl. Cancer Inst. 27:1037-1057, 1961.
Wyburn-Mason, R,,, Dehydroemetine in chronic leukemia. Lancet 1:1266-1267, 1966.
41


APPENDIX A
SUMMARY OF THE INCIDENCE OF NEOPLASMS IN
RATS TREATED WITH EMETINE
43


TABLE A1.
SUMMARY OF THE INCIDENCE OF NEOPLASMS IN MALE RATS TREATED WITH EMETINE
UNTREATED VEHICLE LOW DOSE CONTROL CONTROL
ANIMALS INITIALLY IN STUDY 10 10 35 ANIMALS NECROPSIED 10 10 35 ANIMALS EXAMINED HISTO PATHOLOGICALLY 10 10 35
INTEGUMENTARY SYSTEM
*SKIN (10) (10) (35) SQUAMOUS CELL PAPILLOMA 1 (3*).
*SUBCUT TISSUE (10) (10) (35) FIBROMA 2 (6*) LIPOMA 1 (3%) LEIOMYOSARCOMA 1 (3X)
RESPIRATORY SYSTEM
NONE
HEMATOPOIETIC SYSTEM
NONE
CIRCULATORY SYSTEM
NONE
DIGESTIVE SYSTEM
tLIVER (|0) (10) (35) HEPATOCELLULAR ADENOMA 2 (6X)
tSTOHACH (10) (10) (35) FIBROSARCOMA
URINARY SYSTEH
NONE
# NUHBE8 OF ANIHALS H IT 1 TISSOE EXAMINED MICROSCOPICALLY * NOHBER OF ANIHALS NECUOPSIED
HIGH DOSE
35 27 27
(27)
(27)
(27)
(27) 1 (<*%)
45

TABLE A1. MALE RATS: NEOPLASMS (CONTINUED)
ENDOCRINE SYSTEM
tPITOITARY CHBOHOPHOBE ADENOMA CHROMOPHOBE CARCINOMA
IADRENAL CORTICAL ADENOMA PHEOCHROMOCYTOHA
tPAPATHYROID ADENOMA, NOS
iPANCREATIC ISLETS ISLET-CELL ADENOMA
REPRODUCTIVE SYSTEM
*MAMMARY SLAND FIBROADEHOMA
tTESTIS INTEHSTITIAt-CELL TUMOR
NERVOUS SYSTEM
NONE
SPECIAL SENSE ORGANS
NONE
MUSCULOSKELETAL SYSTEM
NONE
BODY CAVITIES
NONE
ALL OTHER SYSTEMS
NONE
UNTREATED VEHICLE CONTROL CONTROL
(10) (10) 1 (10X) 1 (10X) 2 (20%) 1 (10X)
(9) (10)
1 (10X)
(8) (1)
(10) (9)
(10) (10)
(9) (10)
LOW DOSE
(32) 3 (9%) 1 (3%)
(35) 1 (3X) 1 <3X)
(10)
(3<») 2 (6X)
(35)
(3<») 3 (9X)
HIGH DOSE
(22) 1 (5X) 1 (5%)
(27)
(7) 1 (1U%)
(26) 1 (tX)
(27) 1 (UX)
(27)
I NUMBER OF ANIMALS WITH TISSUE EXAMINED MICROSCOPICALLY * NUMBER OF ANIMALS NECBOPSIED
46

TABLE A1. MALE RATS: NEOPLASMS (CONTINUED)
UNTREATED CONTROL
VEHICLE CONTROL
LOW DOSE HIGH DOSE
AMI HAL DISPOSITION SUMMARY
ANIMALS INITIALLY IN STODT NATURAL DEATHS MORIBUND SACRIFICE SCHEDULED SACRIFICE ACCIDENTALLY KILLED TERMINAL SACRIFICE ANIMAL HISSING
10 2
8
10 1
9
35 1 2
1 31
35 15 11
9
£ INCLUDES AUTOLYZED ANIMALS
TUMOR SUMMARY
TOTAL ANIMALS WITH PRIMARY TOMOBS* TOTAL PRIMARY TUMORS
3 3
3 3
13 18
5 6
TOTAL ANIMALS WITH BENIGN TUMORS TOTAL BSNIGN TUMORS
1 1
2 2
13 16
» II
TOTAL ANIMALS KITH MALIGNANT TUMORS TOTAL MALIGNANT TUMORS
2 2
1 1
2 2
2 2
TOTAL ANIMALS WITH SECONDARY TUMORS* TOTAL SECONDARY TUMORS
TOTAL ANIMALS WITH TUMORS UNCERTAIN-BENIGN OR MALIGNANT
TOTAL UNCERTAIN TUMORS
TOTAL ANIMALS WITH TUMORS UNCERTAIN-PRIMARY OR METASTATIC TOTAL UNCERTAIN TUMORS
* PRIMARY TUMORS: ALL TOHORS EXCEPT SECONDARY TOHORS * SECONDARY TOHORS: HETASTATIC TOHORS OR TOHORS INVASIVE INTO AN ADJACENT ORGAN
47

TABLE A2.
SUMMARY OF THE INCIDENCE OF NEOPLASMS IN FEMALE RATS TREATED WITH EMETINE
UNTREATED VEHICLE LOW DOSE HIGH DOSE
ANIMALS INITIALLY IN STUDY ANIMALS NECROPSIED ANIMALS EXAMINED HISTOPATHOLOGICALLY
INTEGUMENTARY SYSTEM
*SUBCUT TISSUE FIBBOSARCOBA LIPOMA LIPOSARCOMA
RESPIRATORY SYSTEM
*LON3 ADENOCARCINOMA, NOS, METASTATIC SARCOMA, NOS, METASTATIC
HEMATOPOIETIC SYSTEM
NONE
CIRCULATORY SYSTEM
NONE
DIGESTIVE SYSTEM
NONE
URINARY SYSTEM
NONE
ENDOCRINE SYSTEM
tPITUITARY CHROHO£HQBE._AP.E.NOM,4
CONTROL CONTROL
10 10 10 10 10 10
(10) (10)
(10) (9) 1 dOX)
(10) (10) - -3 J30SL. a jaasi. . _
* NUMBER OF ANIMALS WITH TISSUE EXAMINED MICROSCOPICALL f « NUMBER OF ANIMALS NECROPSIED
48
35 35 35 35 35 35
(35) (35) 1 (3%) 1 (3») 1 (3X)
(3U) (35)
1 (3%)
(35) (33) 11 -[3.1S1. _8 J2AJ51.

TABLE A2. FEMALE RATS: NEOPLASMS (CONTINUED)
UNTREATED CONTROL
VEHICLE CONTROL
CHROBOPHOBB CARCINOMA ACIDOPHIL ADENOBA
1 (10*) 1 (10*)
tADRBNIl t CORTICAL ADENOMA PHEOCHHOBOCYTOMA
(10) 1 (10*)
(10) 3 (30*)
# T H Y H O I D C-CBLL ADENOBA
(10) (7)
t P A N C R E A T I C ISLETS ISLET-CELL A D E N O M A
(10) (10)
BEPBODOCTIVE SYSTEB
» M A B B A R Y G L A N D (10) (10) A D E N O M A , NOS ADENOCARCINOMA, NOS 1 (10X) P A P I L L A R Y ADENOBA FIB ROB A 1 (10X) FIBROADENOBA 1 (10*) 2 (20*)
tUTERUS (10) (10) SQOABOnS CELL C A R C I N O M A S A R C O M A , NOS LEIOHYOBA LEIOBYOSARCOBA ENDOBETRIAL STROBAL POLYP 1 (10X)
NERVOUS SYSTEM
NONE
SPECIAL SENSE ORGANS
NOME
MOSCDLOSKELETAL SYSTEM
NONE
BODY CAVITIES
•MESENTERY (10) (10) _!IEOflA_
* NUMBER OF ANIMALS WITH TISSUE EXABINED MICROSCOPICALLY
LOW DOSE
1 (3X) 1 (3X)
(35) 9 (26X) 1 (3X)
(28) 1 (»*)
(35) 1 (3X)
(35) 1 (3*) 1 (3*) 1 (3X)
14 (UOX)
(35) 1 (3X)
1 (3X) 3 (9X)
(35)
HIGH DOSE
1 (3*)
(35) 2 (6X)
(2«) 1 (<»*)
<3«)
(35)
2 (6X)
1 (3X) 10 (29X)
(35)
1 <3X) 1 (3X) 1 <3X) 1 (3X)
(35) _2_1SSI .
49

TABLE A2. FEMALE RATS: NEOPLASMS (CONTINUED)
UNTREATED CONTROL
VEHICLE CONTROL
LOW DOSE HIGH DOSE
ALL OTHER SYSTEMS
NONE
ANIMAL DISPOSITION SUMMARY
ANIMALS INITIALLY IN STUDY NATURAL DEATHS MORIBUND SACRIFICE SCHEDULED SACRIFICE ACCIDENTALLY KILLED TERMINAL SACRIFICE ANIMAL MISSING
10 1 2
7
10
10
35 1 5
29
35 1
10
24
> INCLUDES ADTOLYZED ANIMALS
TUMOR SUMMARY
TOTAL ANIMALS WITH PRIMARY TUMORS* TOTAL PRIMARY TUMORS
7 9
6 9
26 50
22 31
TOTAL ANIMALS WITH BENIGN TUHOBS TOTAL BENIGN TUMORS
5 7
6 8
22 uit
20 26
TOTAL ANIMALS WITH MALIGNANT TUMORS TOTAL MALIGNANT TUMORS
2 2
1 1
5 6
5 5
TOTAL ANIMALS WITH SECONDARY TUMORS! TOTAL SECONDARY TUMORS
1 1
1 1
TOTAL ANIMALS WITH TUMOHS UNCERTAIN-BENIGN OR MALIGNANT
TOTAL UNCERTAIN TUHOBS
TOTAL ANIMALS WITH TUMORS UNCERTAIN-PRIMARY OR METASTATIC
TOTAL UNCERTAIN TUMORS
* PRIBARY TORORS: ALL TDHORS EXCEPT SECONDART TOBOBS I SECONDARY TUMORS: NETASTATIC TDHORS OR TOHORS INVASIVE INTO AN ADJACENT ORGAN
50
APPENDIX B
SUMMARY OF THE INCIDENCE OF NEOPLASMS IN
MICE TREATED WITH EMETINE
51


TABLE B1.
SUMMMW OF THE INCIDENCE OF NEOPLASMS IN MALE MICE TREATED WITH EMETINE (CONTROL GROUPS)
ANIMALS INITIALLY IN STUDY ANIMALS MISSING ANIMALS NECROPSIED ANIMALS EXAMINED HISTOPATHOLOGICALLY
INTEGUMENTARY SYSTEM
NONE
RESPIRATORY SYSTEM
tLUNG ALVEOLAR/BRONCHIOLA8 ADENOMA
HEMATOPOIETIC SYSTEM
*MULTIPLE ORGANS MONOCYTIC LEUKEMIA
CIBCULATORY SYSTEM
NONE
DIGESTIVE SYSTEM
»LIVER HEPATOCELLDLAR ADENOMA HEPATOCELLULAR CARCINOMA
URINARY SYSTEM
NONE
ENDOCRINE SYSTEM
NONE
MID & HIGH DOSE UNTREATED CONTROL
15 1
14 1U
(14)
(14)
(14) 2 (14*) 1 (7*)
LOW DOSE, UNTREATED CONTROL
10
10 10
(9)
(10)
(10)
MID & HIGH DOSE VEHICLE CONTROL
15
14 14
(14) 1 <7X)
(14)
d") 1 (7X)
LOW DOSE VEHICLE CONTROL
10
10 10
(10)
(10) 1 (10*)
(10)
f NDHBEB OF ANIMALS KITH TISSUE EXAMINED (1ICBOSCOPICALLY * NOHBER OP ANIHALS NECSOPSIED
53

TABLE B1. MALE MICE: NEOPLASMS (CONTINUED)
REPRODUCTIVE SYSTEM
NONE
NERVOUS SYSTEM
NONE
SPECIAL SENSE ORGANS
NONE
MOSCDLOSKELETAL SYSTEM
NONE
BODY CAVITIES
NONE
ALL OTHER SYSTEMS
NONE
ANIMAL DISPOSITION SUMMARY
ANIMALS INITIALLY IN STDDY NATURAL DEATHS MORIBUND SACRIFICE SCHEDULED SACRIFICE ACCIDENTALLY KILLED TERMINAL SACRIFICE ANIMAL MISSING
« INCLUDES ADTOLYZED ANIBALS
MID & HIGH DOSE LOW DOSE MID & HIGH DOSE LOW DOSE UNTREATED UNTREATED VEHICLE VEHICLE CONTROL CONTROL CONTROL CONTROL
15 10 15 10 2 1 2 1 1 1
11 9 13 8 1
» NUMBER OF ANIMALS BITH TISSUE Ell HI NED MICROSCOPICALLY * NUMBER OP ANIMALS NECROPSIED
54

TABLE B1. MALE MICE: NEOPLASMS (CONTINUED)
MID & HIGH DOSE UNTREATED
CONTROL
LOW DOSE UNTREATED
CONTROL
MID ft H I G H DOSE VEHICLE
CONTROL
LOW DOSE VEHICLE
CONTROL
T U H O B S U M M A R Y
TOTAL A N I M A L S W I T H P B I H A B YTOTAL P R I M A R Y T U M O R S
TUHOBS* 3 3
2 2
1 1
TOTAL A N I M A L S HITH B E N I G NTOTAL B E N I G N T U M O R S
TUMORS 2 2
2 2
TOTAL A N I M A L S WITH M A L I G N A N T T U M O R S TOTAL M A L I G N A N T T U M O B S
1 1
1 1
TOTAL A N I M A L S WITH S E C C N D A B YTOTAL S E C O N D A R Y T U H O B S
TUMORS*
TOTAL A N I M A L S W I T H T U M C R S UNCERTAIN-B E N I G N O R M A L I G N A N T
TOTAL U N C E R T A I N T U M O E S
TOTAL A N I M A L S W I T H T U M C R SP R I M A R Y OH M E T A S T A T I C
TOTAL U N C E R T A I N T U M O B S
U N C E R T A I N
* PBIHAFY TUMORS: ILL TOfOBS EXCEPT SECONDARY TOHOBS * SECONDABY TUMOBS: BETASTATIC TOHOHS OR TDHOBS INVASIVE IMTO AM ADJACENT OBGAN
55

TABLE B2.
SUMMARY OF THE INCIDENCE OF NEOPLASMS IN MALE MICE TREATED WITH EMETINE (TREATED GROUPS)
ANIMALS INITIALLY IN STUDY ANIMALS NECROPSIED ANIMALS EXAMINED HISTO PATHOLOGICALLY
INTEGUMENTARY SYSTEM
NONE
RESPIRATORY SYSTEM
#LUNG ALVEOLAR/BRONCHIOLAR ADENOMA ALVEOLAR/BRONCHIOLAR CARCINOMA
HEMATOPOIETIC SYSTEM
NONE
CIRCULATORY SYSTEM
NONE
DIGESTIVE SYSTEM
*LIVER HEPATOCELLULAR CARCINOMA
URINARY SYSTEM
NONE
ENDOCRINE SYSTEM
*THYROID PAPILL&RY CYSTADENOMA^ NOS
LOW DOSE MID DOSE HIGH DOSE _j
35 35 35 35 30 30 35 29 30
(35) 2 (6X) 1 (3*)
(28) (29)
(35) 3 (9*)
(27) (30)
(25) 1 J"SL .
(19) (16)
# NUMBER OF ANIMALS WITH TISSUE EXAMINED MICROSCOPICALLY * NUMBER OF ANIMALS NECROPSIED
56
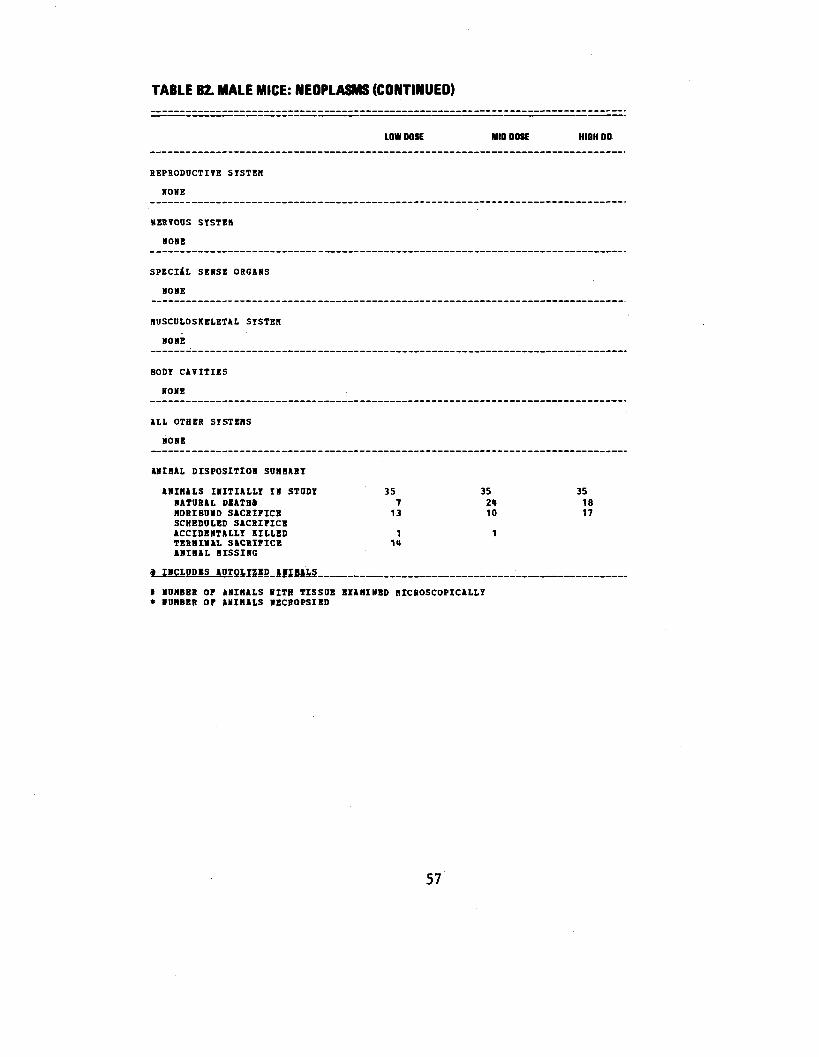
TABLE B2. MALE MICE: NEOPLASMS (CONTINUED)
REPRODUCTIVE STSTEH
NONE
NERVODS STSTEH
NONE
SPECIAL SENSE ORGANS
NONE
HDSCDLOSKELETAL STSTEH
HONE
BOOT CAVITIES
NONE
ALL OTHER STSTEHS
NONE
ANIHAL DISPOSITION SONNA8T
ANIMALS IIITIALLI IN STUDT NATURAL DEATH* MORIBUND SACRIFICE SCHEDULED SACRIFICE ACCIDENTALLT KILLED TERHINAL SACRIFICE ANIHAL HISSING
9 INCLUDES AOIOLTZED ANIHALS
LOW DOSE MID OOSE HIOH DO
35 35 35 7 20 18 13 10 17
1 1 1U
I NDHBEH OF ANIRALS BITH TISSUE BIAHINED HICBOSCOPICALLT * NUMBER OF ANIHALS NECROPSIED
57

TABLE B2. MALE MICE: NEOPLASMS (CONTINUED)
LOW DOSE MID DOSE HIGH DOSE
TUMOR SUMMARY
TOTAL ANIMALS WITH PRIMARY TUMORS* 7 TOTAL PRIMARY TDM08S 7
TOTAL ANIMALS WITH BENIGN TUMORS 3 TOTAL BENIGN TUMORS 3
TOTAL ANIMALS WITH MALIGNANT TUMORS it TOTAL MALIGNANT TUMORS a
TOTAL ANIMALS WITH SECONDARY TUMORS* TOTAL SECONDARY TUMORS
TOTAL ANIMALS WITH TUMORS UNCERTAIN-BENIGN OR MALIGNANT
TOTAL UNCERTAIN TUMORS
TOTAL ANIMALS WITH TUMORS UNCERTAIN-PRIMARY OR METASTATIC TOTAL UNCERTAIN TUMORS
* PRIMARY TUMORS: ALL TUMORS EXCEPT SECONDARY TOHOHS t SECONDARY TUMORS: METASTATIC TOBOHS OR TOHOHS INVASIVE INTO AN ADJACENT ORGAN
58
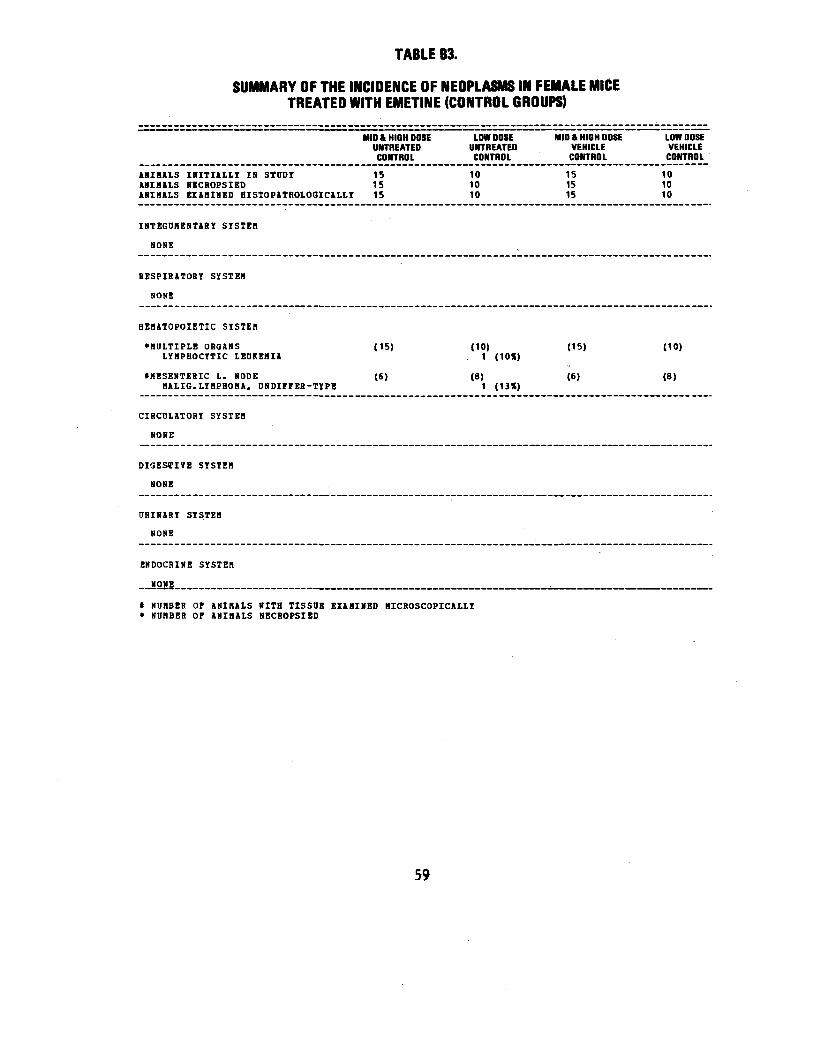
TABLE B3.
SUMMARY OF THE INCIDENCE OF NEOPLASMS IN FEMALE MICE TREATED WITH EMETINE (CONTROL GROUPS)
ANIMALS INITIALLY IN STUDY ANIMALS NECROPSIED ANIMALS E X A M I N E D HISTOPATHOLOGICALLY
I N T E G U M E N T A R Y SYSTEM
N O N E
R E S P I R A T O R Y SYSTEM
NONE
HEHATOPOIETIC SYSTEM
•MULTIPLE ORGANS LYMPROCYTIC L E U K E M I A
tHESENTERIC L. NODE M A L I G . L Y H P H O M A , UNDIFFER -TYPE
CIBCOLATORY SYSTEM
N O N E
DIGESTIVE SYSTEM
NONE
U R I H A B Y SYSTEM
NONE
ENDOCRINE SYSTEM
_NONE
MID ft HIGH DOSE LOW DOSE UNTREATED UNTREATED
CONTROL CONTROL
15 10 15 10 15 10
(15) (10) 1 (10*)
(6) IB) 1 (13*)
t NUMBER OF ANIMALS HITH TISSUE EXAMINED MICROSCOPICALLY * NUMBER OF ANIMALS NECROPSIED
59
MID ft HIGH DOSE LOW DOSE VEHICLE VEHICLE
CONTROL CONTROL
15 10 15 10 15 10
(15) (10)
(6) (8)
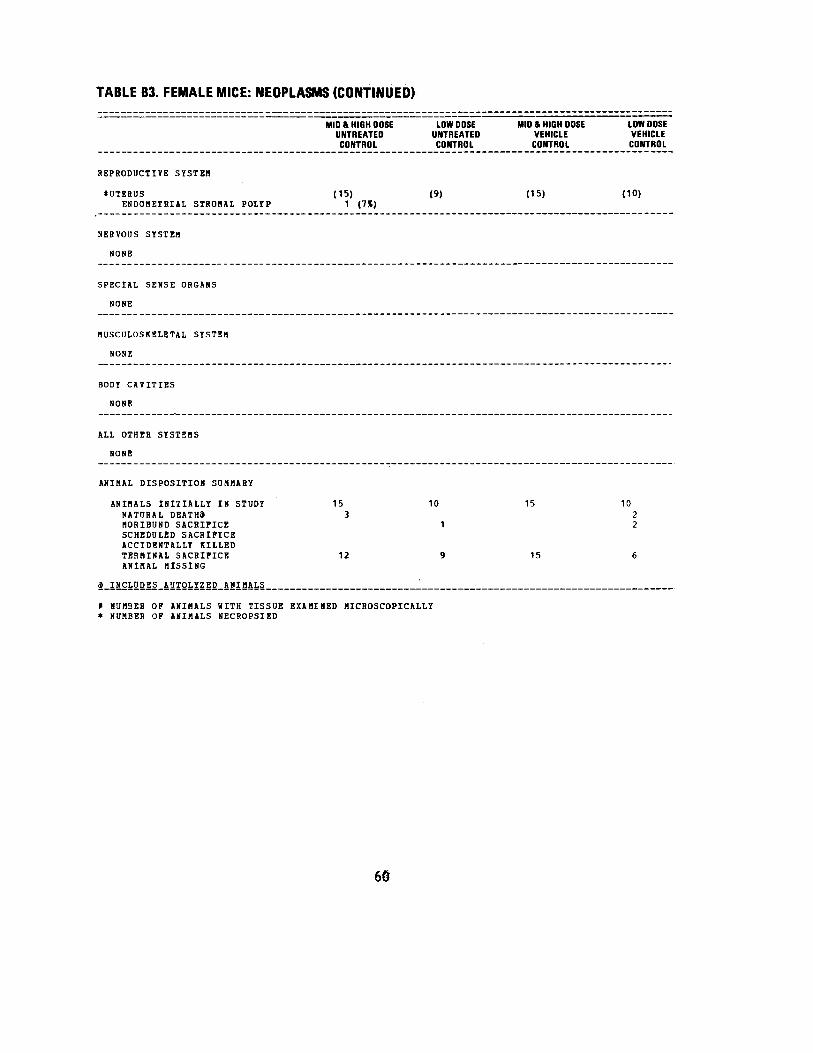
TABLE B3. FEMALE MICE: NEOPLASMS (CONTINUED)
MID a HIGH DOSE LOW DOSE UNTREATED UNTREATED CONTROL CONTROL
REPRODUCTIVE SYSTEM
•UTERUS (15) (9) ENDOMETRIAL STROHAL POLYP 1 (7%)
NERVOUS SYSTEM
NONE
SPECIAL SENSE ORGANS
NONE
MUSCULOSKBLETAL SYSTEM
NONE
BODY CAVITIES
NONE
ALL OTHER SYSTEMS
NONE
ANIMAL DISPOSITION SUMMARY
ANIMALS INITIALLY IN STUDY NATURAL DEATHS MORIBUND SACRIFICE SCHEDULED SACRIFICE ACCIDENTALLY KILLED TERMINAL SACRIFICE ANIMAL MISSING
15 3
12
10
1
9
i INCLODES_AUTOLYZED ANIMALS _ _
i NUMBER OF ANIMALS WITH TISSUE EXAMINED MICROSCOPICALLY * NUMBER OF ANIMALS NECROPSIED
60
MID a HIGH DOSE LOW DOSE VEHICLE VEHICLE CONTROL CONTROL
(15) (10)
15 10 2 2
15 6
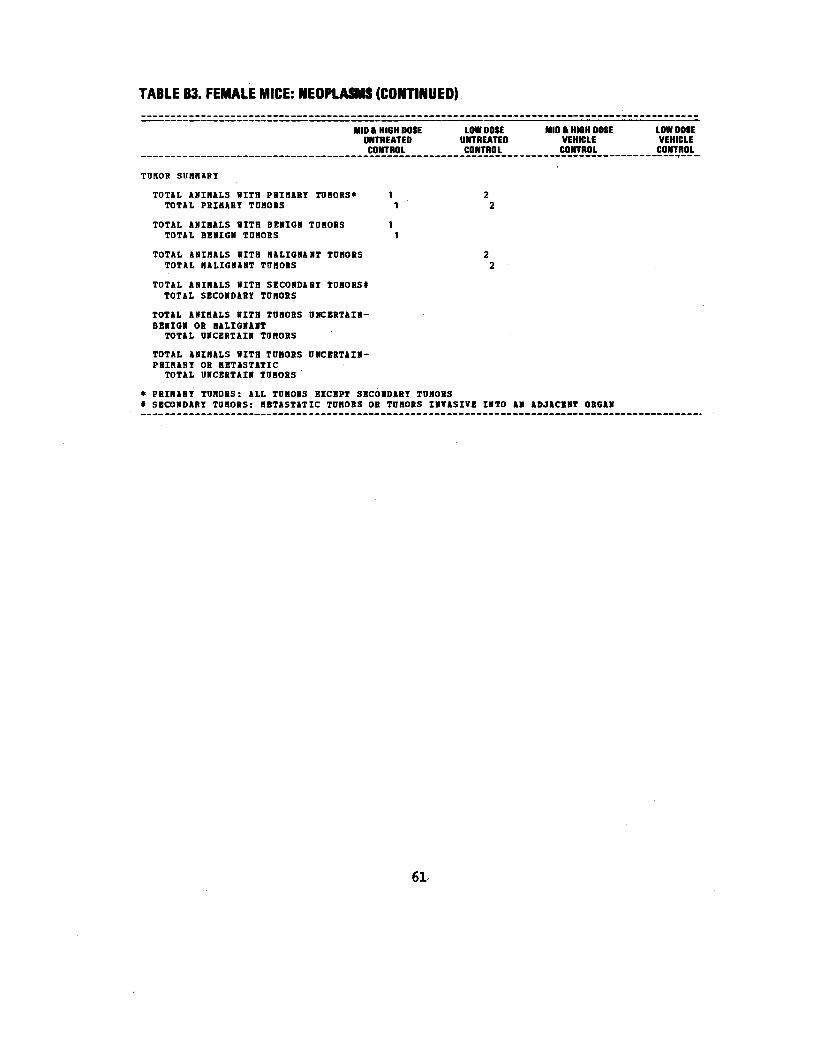
TABLE B3. FEMALE MICE: NEOPLASMS (CONTINUED)
MID ft HIGH DOSE LOW DOSE MID ft HIGH DOSE LOW DOSE UNTREATED UNTREATED VEHICLE VEHICLE CONTROL CONTROL CONTROL CONTROL
TUMOR SDHHABY
TOTAL ANIMALS WITH PHIMABY TO BO TOTAL PRIHART TDBOBS
HS* 1 1
2 2
TOTAL ANIHALS WITH BEIIGH TOHOR TOTAL BENIGN TDHORS
S 1 1
TOTAL ANIHALS WITH (IALI6HAHT TO TOTAL HALIGNANT THROBS
HOBS 2 2
TOTAL ANIHALS WITH SECOND* BY TO TOTAL SECOHDABT TDHOBS
HO RSI
TOTAL AHIHALS BITH TDHOBS OHCEB BBBIGI OR HALIGSAIT TOTAL ONCEBTAIN TDHOBS
TAIB-
TOTAL ANIHALS WITH TUHOBS ONCEB PBIHABT OB HETASTATIC
TAII-
TOTAL UNCERTAIN TDROBS
* PRIHABT TDROBS: ALL TDHOBS KICK PT SECONDARY TO HOBS * SECONDABI TDHOBS: HBTASTATIC TO HOBS OB TDHOBS INVASIVE INTO AN ADJACENT ORGAN
61
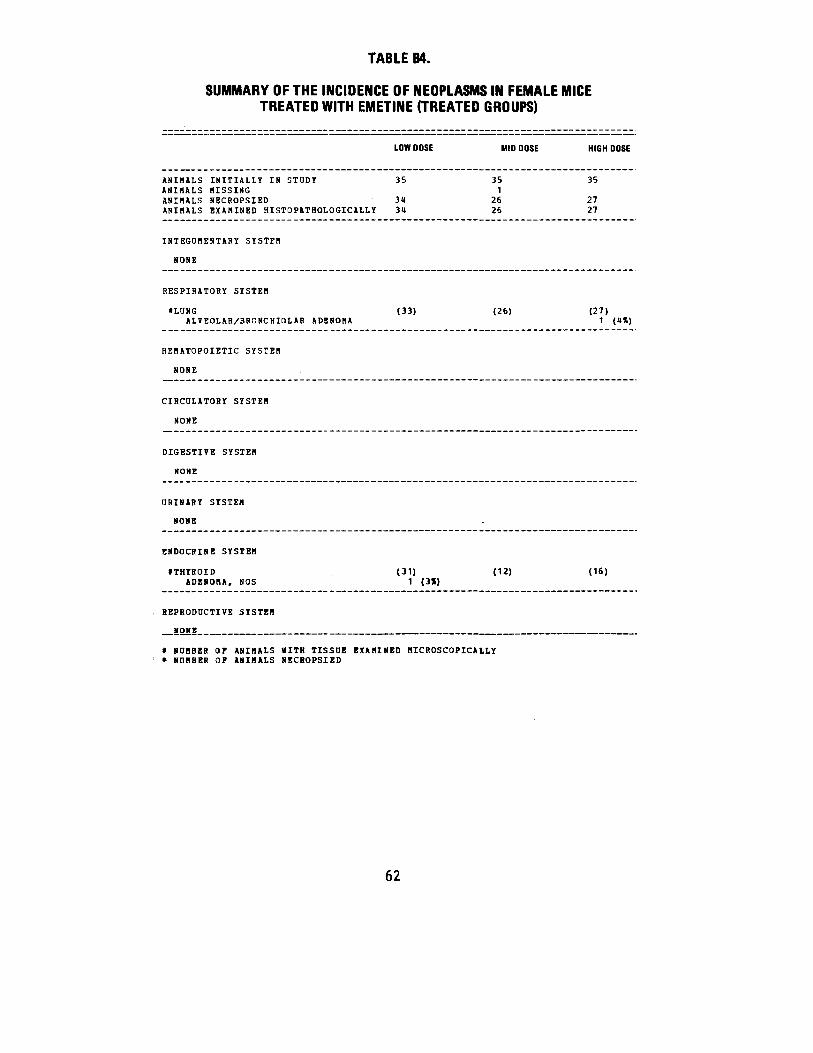
TABLE B4.
SUMMARY OF THE INCIDENCE OF NEOPLASMS IN FEMALE MICE TREATED WITH EMETINE (TREATED GROUPS)
ANIMALS INITIALLY IN STUDY ANIMALS HISSING ANIMALS NECROPSIED ANIMALS EXAMINED HISTOPATHOLOGICALLY
INTEGUMENTARY SYSTEM
NONE
RESPIRATORY SYSTEM
*LUNG ALVEOLAR/BBONCHIOLAH ADENOMA
HEHATOPOIETIC SYSTEM
NONE
CIRCULATORY SYSTEM
NONE
DIGESTIVE SYSTEM
NONE
URINARY SYSTEM
NONE
ENDOCRINE SYSTEM
•THYROID ADENOMA, NOS
REPRODUCTIVE SYSTEM
MOHE
LOW DOSE MID DOSE HIGH DOSE
35 35 35 1
3U 26 27 31 26 27
(33) (26) (27) 1 (U»)
(31) (12) (16) 1 (3%)
* NUMBER OF ANIMALS WITH TISSUE EXAMINED MICROSCOPICALLY * NUMBER OF ANIMALS NECBOPSIED
62
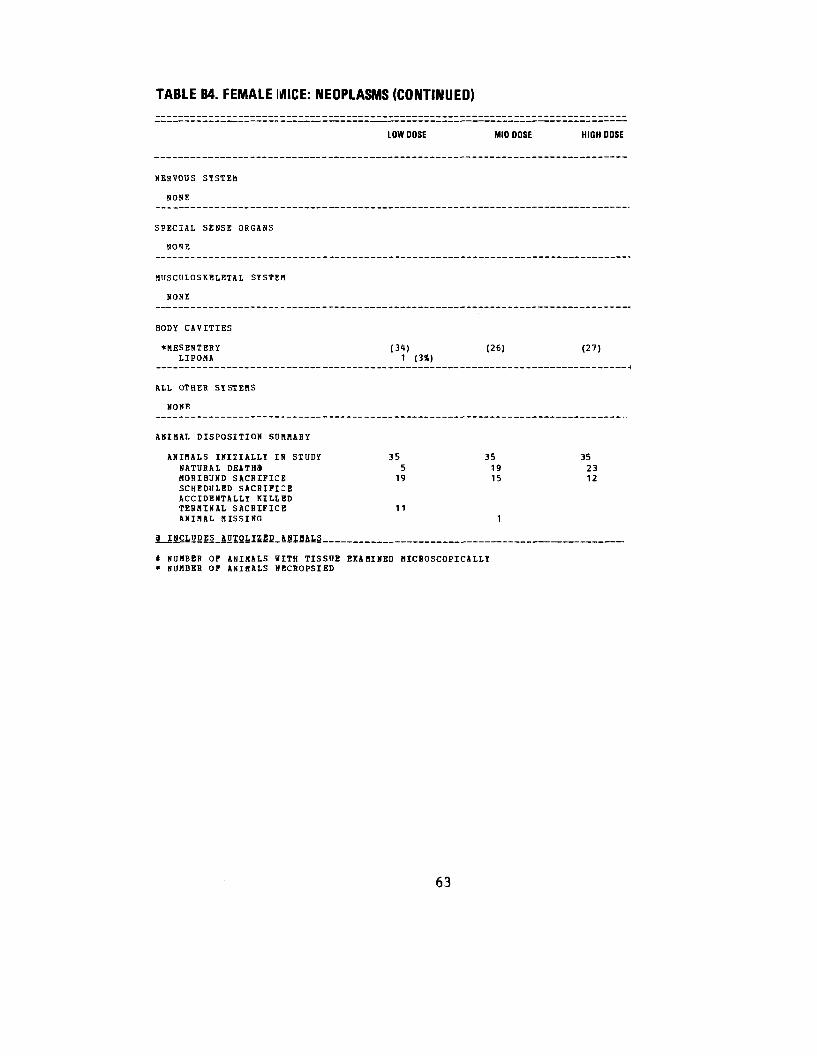
TABLE B4. FEMALE MICE: NEOPLASMS (CONTINUED)
NERVOUS SYSTEM
NONE
SPECIAL SENSE ORGANS
NONE
HUSCULOSKELETAL SYSTEM
NONE
BODY CAVITIES
*MESENTERY LIPONA
ALL OTHER SYSTEMS
NONE
ANIMAL DISPOSITION SUMMARY
ANIMALS INITIALLY IN STUDY NATURAL DEATHS HOHIBUND SACRIFICE SCHEDULED SACRIFICE ACCIDENTALLY KILLED TERHINAL SACRIFICE ANIMAL MISSING
3 INCLUDES AUTOLYSED ANNALS...
LOW DOSE MID DOSE HIGH DOSE
(31) (26) (27) 1 (3X)
35 35 35 5 19 23
19 15 12
11 1
* NUMBER OF ANIMALS HITH TISSUE EXAMINED MICROSCOPICALLY * NUMBER OF ANIHALS NECROPSIED
63
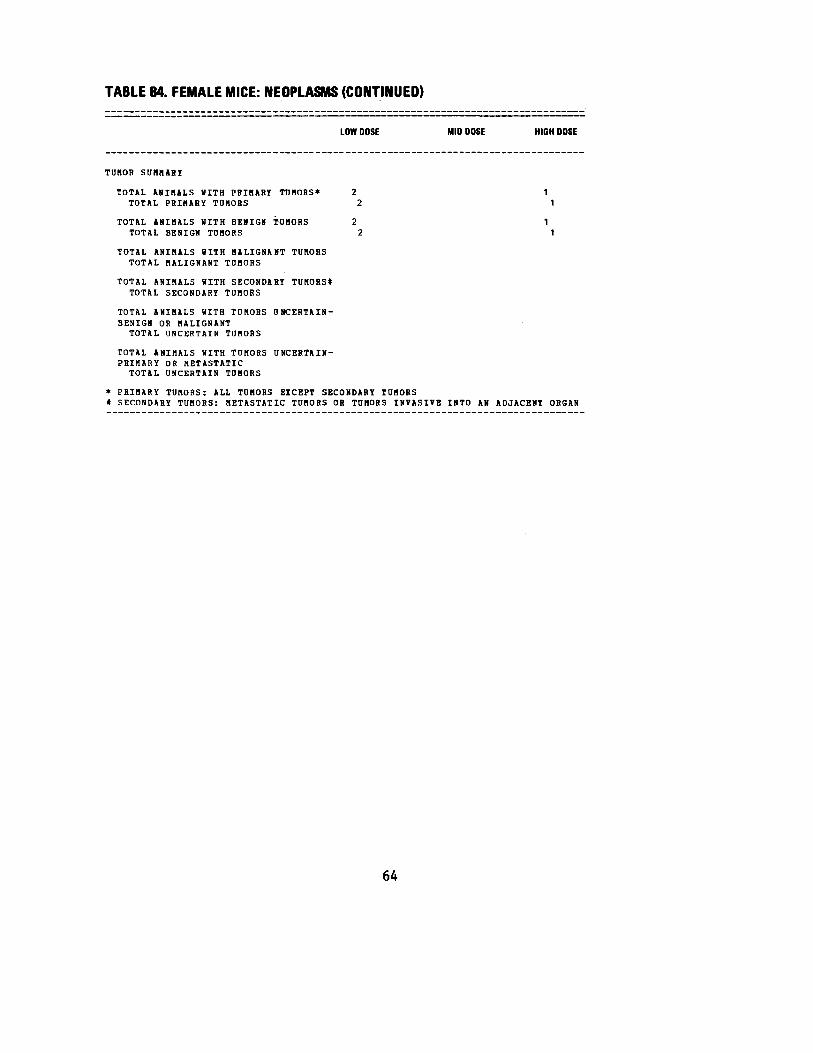
TABLE B4. FEMALE MICE: NEOPLASMS (CONTINUED)
LOW DOSE MID DOSE HIGH DOSE
TUMOR SUMMARY
TOTAL ANIMALS BITH PRIMARY TOMORS* 2 1 TOTAL PRIMARY TUMORS 2 1
TOTAL ANIMALS WITH BENIGN TUMORS 2 1 TOTAL BENIGN TOMORS 2 1
TOTAL ANIMALS WITH MALIGNANT TUMORS TOTAL MALIGNANT TUMORS
TOTAL ANIMALS WITH SECONDARY TUMORS* TOTAL SECONDARY TDMORS
TOTAL ANIMALS WITH TDMORS DNCERTAIN-BENIGN OR MALIGNANT
TOTAL UNCERTAIN TOMORS
TOTAL ANIMALS WITH TUMORS UNCERTAIN-PRIMARY OR METASTATIC
TOTAL UNCERTAIN TOMORS
* PRIMARY TUMORS: ALL TOHORS EICEPT SECONDARY TUMORS * SECONDARY TUMORS: METASTATIC TUMORS 08 TUMORS INVASIVE INTO AN ADJACENT ORGAN
64
APPENDIX C
SUMMARY OF THE INCIDENCE OF NONNEOPLASTIC LESIONS
IN RATS TREATED WITH EMETINE
65


TABLE C1.
SUMMARY OF THE INCIDENCE OF NONNEOPLASTIC LESIONS IN MALE RATS TREATED WITH EMETINE
UNTREATED VEHICLE LOW DOSE HIGH DOSE CONTROL CONTROL
ANIMALS INITIALLY IN STDDY 10 10 35 35 ANIMALS NECROPSIED 10 10 35 27 ANIMALS EXAMINED HISTOPATHOLOGICALLY 10 10 35 27
INTEGOMENTAHY SYSTEM
*SKIN (10) (10) (35) (27) EPIDERMAL INCLUSION CYST 2 (6%)
RESPIRATORY SYSTEM
tTRACHBA (10) (10) <3«) (26) INFLAMMATION, NOS 3 (30%) 5 (50») 6 (18%) LYMPHOCYTIC INFILTRATE 1 (10%) INFLAMMATION, SUPPURATIVE 1 (3%) 1 (1*) INFLAMMATION, ACUTE/CHRONIC 3 (9%) INFLAMMATION, CHRONIC 1 (1%)
iLUNG/BRONCHUS (10) (10) (35) (27) BRONCHIECTASIS 1 (10%) INFLAMMATION, NOS 2 (6%) INFLAMMATION, ACUTE/CHRONIC 1 (3%) INFLAMHATION, CHRONIC 1 (10%) 1 (3%)
•LUNG/BRONCHIOLE (10) (10) (35) (21) INFLAMHATION, SUPPOHATIVE 1 (10*) PEHIVASCOLAR CUFFING 1 (3%) HYPEHPLASIA, LYMPHOID 1 (3%)
ILUNG (10) (10) (35) [27) EMPHYSEMA, NOS 1 (t%) ABSCESS, NOS 1 HO*) PNEUMONIA INTERSTITIAL CHROMIC 1 (10*) 1 ("%)
HEUATOPOIETIC SYSTEM
tBONE MARROW (10) (10) (35) (27) ATROP.HU NOS_ _ _ _ 12 JIJUSI - _ 5.J1251.
* NUMBER OF ANIMALS KITH TISSUE EXAMINED MICROSCOPICALLY * NUMBER OF ANIMALS NECHOPSIED
67

TABLE C1. MALE RATS: NONNEOPLASTIC LESIONS (CONTINUED)
UNTREATED CONTROL
VEHICLE CONTROL
LOW DOSE HIGH DOSE
CIRCULATORY SYSTEM
IHEART CALCIFICATION, NOS
(10) (10) (3 ) (27) 2 (7%)
IMYOCARDIUM INFLAMMATION, DOS INFLAMMATION, INTERSTITIAL
(10) (10) (35) (27) 21 (7%) (UX)
DIGESTIVE SYSTEM
ILIVER INFLAMMATION, SDPPURATIVE NECROSIS, COAGULATIVE
(10) (10) (35) 1 (3%)
(27)
1 (<*«)
*PANCREAS INFLAMMATION, CHRONIC
(10) (9) (31) 1 (3X)
(26)
URINARY SYSTEM
IKIDNEY PYELONEPHRITIS, NOS ABSCESS, NOS INFLAMMATION, CHRONIC NEPHROSIS, NOS
(10)
1a (10*) (uox)
(10)
1 (10X)
(35)
10 (29%)
(27) 1 (t«)
2 (7«) « (15X)
IKIDNEY/GLOMERULUS INFLAMMATION, NOS FIBROSIS
(10) (10) (35) 1 (3X) 5 (U»)
(27)
•URINARY BLADDER HYPEHPLASIA, EPITHELIAL
(9) (9) (26) (2U) 3 (13X)
ENDOCRINE SYSTEM
tADRENAL ABSCESS, NOS
(9)1 (11X)
(10) (35) (27)
REPRODUCTIVE SYSTEM
•PROSTATE INFLAMMATION,. SUPgORATIVE
(9)1 lil!L__
(10) (33) (26) _ 3 .IJL2S1.-
i NUMBER OF ANIMALS HITH TISSUE EXAMINED MICROSCOPICALLY * NUMBER OF ANIMALS NECROPSIED
£8

TABLE C1. MALE RATS: NONNEOPLASTIC LESIONS (CONTINUED)
UNTREATED CONTROL
VEHICLE CONTROL
INFLAMMATION, ACUTE SHPPOHATIVE INFLAMMATION, CHRONIC INFLAHMATION, CHRONIC SUPPURATIV 1 (11X)
*SEHINAL VESICLE INFLAMMATION, ACOTE/CHBONIC
(10) (10)
NERVOUS SYSTEM
•CEREBELLUM (10) (10) GLIOSIS
SPECIAL SENSE ORGANS
NONE
NUSCULOSKELETAL SYSTEH
*JOINT (10) (10) INFLAMMATION, SUPPURATIVE 1 (10%)
•SKELETAL MUSCLE (10) (10) FIBROSIS 1 (10X) ATROPHY. FOCAL 1 (10*)
BODY CAVITIES
*PERITONEHM (10) (10) INFLAHHATION, CHRONIC
ALL OTHER SYSTEMS
NONE
SPECIAL MORPHOLOGY SUMMARY
NO LESION REPORTED 1 2 AUTOLYSIS/NO NECROPSY
* NUMBER OF ANIMALS WITH TISSUE EXAM: INED MICROSCOPIC ALLY * NUMBER OF ANIMALS NECROPSIED
LOW DOSE HIGH DOSE
1 {"•*> 1 (<**) 2 (8%)
(35) (27) 1 (UX)
(35) (25) 1 (3X)
(35) (27)
(35) (27)
(35) (27) 1 (IX)
1 8 8
69
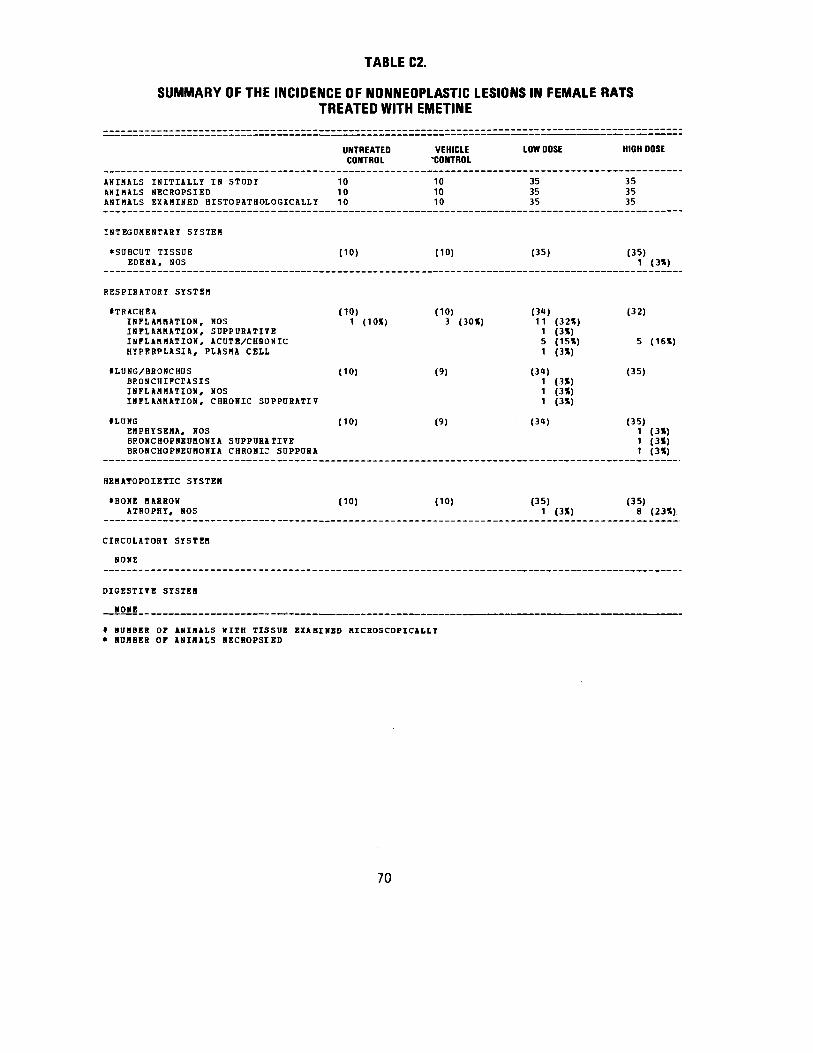
TABLE C2.
SUMMARY OF THE INCIDENCE OF NONNEOPLASTIC LESIONS IN FEMALE RATS TREATED WITH EMETINE
UNTREATED VEHICLE CONTROL -CONTROL
ANIMALS INITIALLY IN STDDY 10 10 ANIMALS NECBOPSIED 10 10 ANIMALS EXAMINED HISTOPATHOLOGICALLY 10 10
INTEGUMENTARY SYSTEM
*St)BCUT TISSUE (10) (10) EDEMA, NOS
RESPIHATORY SYSTEM
•TRACHEA (10) (10) INFLAMMATION, NOS 1 (10%) 3 (30%) INFLAMMATION, SDPPURATIVE INFLAMMATION, ACOTE/CHBONIC HYPEHPLASIA, PLASMA CELL
fLONG/BRONCHOS BRONCHIF.CIASIS
(10) (9)
INFLAMMATION, NOS INFLAMMATION, CHRONIC SUPPORATIV
»LONG EMPHYSEMA, NOS
(10) (9)
BRONCHOPNEDHONIA SDPPORATIVE BRONCHOPNEOHONIA CHRONIC SOPPORA
HEMATOPOIETIC SYSTEH
IBONE HARROH (10) (10) ATROPHY, NOS
CIRCDLATORY SYSTEH
NONE
DIGESTIVE SYSTEH
NONE
* N U M B E R OF ANIMALS WITH TISSUE EXAMINED MICROSCOPICALLY * SOMBER OF ANIMALS NECBOPSIED
70
LOW DOSE
35 35 35
(35)
(31) 11 (32%) 1 (3%) 5 (15%) 1 (3%)
(34) 1 (3%) 1 (3%) 1 (3%)
(3U)
(35) 1 (3%)
HIGH DOSE
35 35 35
(35) 1 (3%)
(32)
5 (16%)
(35)
(35) 1 (3%) 1 (3%) 1 (3%)
(35) 8 (23%)

TABLE C2. FEMALE RATS: NONNEOPLASTIC LESIONS (CONTINUED)
LOW DOSE
(35) 1 <3X) « (11*)
(35) 1 (3%)
(35)
(35)
(35) 2 (6%)
(35)
(32)
1 (3X)
(35)
HIGH DOSE
!
(35) 1 (3*)
(35)
(35) 1 (3*)
(35) 1 (3X)
(35)
(35) 2 (6%)
(27) 1 (<4X)
(35) 1 (3*) J-J3.H1.
U8IHARY SYSTEM
0KIDNEY INFLAMMATION, INTERSTITIAL INFLAMMATION, CHRONIC
fKIDNEY/GLOMEROHJS FIBROSIS
*KIDNEY/TDBBLE MINERALIZATION
ENDOCRINE SYSTEM
NONE
REPRODUCTIVE SYSTEM
*MAHNARY GLAND HYPEHPLASIA. CYSTIC
IOTERDS PYOMETRA
tUTERUS/ENDOMETHItJH INFLAMMATION, SUPPBRATIVE
tOVARY CYST, NOS ABSCESS, NOS
NERVOUS SYSTEM
NONE
SPECIAL SENSE ORGANS
*EAR/CARTILAGE HYPERPLASIA, NOS
__flETAEI,15Iii.SS5BQaS
UNTREATED CONTROL
(10)
(10)
(10)
(10)
(10) 1 (10*)
(10) 1 (10*)
(10)
(10)
VEHICLE CONTROL
(10)
(10)
(10)
(10)
(10) 1 (10%)
(10)
(3)
(10)
t NUUBER OF ANIMALS WITH TISSUE EIANIHBD MICROSCOPICALLY * NUMBER OF AMIHALS NECROPSIED
71

TABLE C2. FEMALE RATS: NONNEOPLASTIC LESIONS (CONTINUED)
UNTREATED CONTROL
VEHICLE CONTROL
LOW DOSE HIGH DOSE
NUSCOLOSKELETAL SYSTEM
•SKELETAL MUSCLE MINERALIZATION
(10) (10) (35) (35) 1 (3%)
BODY CAVITIES
*PEFITONEU» INFLAMMATION, CHRONIC SUPPURATIV
(10) (10) (35) (35) 1 (3X)
ALL OTHER SYSTEMS
NONE
SPECIAL MORPHOLOGY SUMMARY
NO LESION REPORTED 1 2 3 2
* NUMBER OF ANIMALS WITH TISSUE EXAMINED HICROSCOPICALLY * NUMBER OF ANIMALS NECROPSIED
n

APPENDIX D
SUMMARY OF THE INCIDENCE OF NONNEOPLASTIC LESIONS
IN MICE TREATED WITH EMETINE
73


TABLE 01.
SUMMARY OF THE INCIDENCE OF NONNEOPLASTIC LESIONS IN MALE MICE TREATED WITH EMETINE (CONTROL GROUPS)
MID & HIGH DOSE LOW DOSE VEHICLE VEHICLE CONTROL CONTROL
15 10
14 10 14 10
(14) (10)
(14) (10) 1 (10X)
(13) (9) 1 (11*)
(14) (10)
1 (10X)
1 (10%)
(14) (10) 2 (14X) 1 (10X)
(11) (9) 1 (9X) 1 (9X)
2 (18X) 3 (33X)
(10)
(14) (10) 1 .Oil _
ANIHALS INITIALLY IN STODY ANIMALS HISSING ANIMALS NECROPSIED ANIMALS EXAMINED HISTO PATHOLOGICALLY
INTEGUMENTARY SYSTEM
*SKIN INFLAMMATION, NOS
*SUBCUT TISSUE LIPOGRANULONA
RESPIRATORY SYSTEM
*TRACHEA INFLAMMATION, SUPPURATIVE
tLDNG EDEMA, NOS INFLAMMATION, INTERSTITIAL BRONCHOPNEUHONIA SUPPUHATIVE BHONCHOPNEUMONIA CHRONIC SOPPUHA
HEHATOPOIETIC SYSTEM
tSPLEEN HEMATOPOIESIS
*MESENTERIC L. NODE INFLAMMATION, SUPPURATIVE INFLAMMATION, NECROTIZING RYPERPLASIA, HEMATOPOIETIC HYPERPLASIA, LYMPHOID
ITHYMOS ATROPHY, NOS
CIRCOLATOHY SYSTEM
IHEART _£EglABTS6lTls
MID & HIGH DOSE LOW DOSE UNTREATED UNTREATED CONTROL CONTROL
15 10 1
14 10 14 10
(14) (10) 2 (14X)
(14) (10)
(13) (8)
(1U) (9) 1 (7X) 1 (7X) 1 (7X)
(14) (9)
(7) (4)
1 (14X)
(8) (D 1 (13X)
d«) (10)
t NUMBER OF ANIMALS KITH TISSOE EXAMINED MICROSCOPICALLY * NUMBER OF ANIMALS NECROPSIED
75
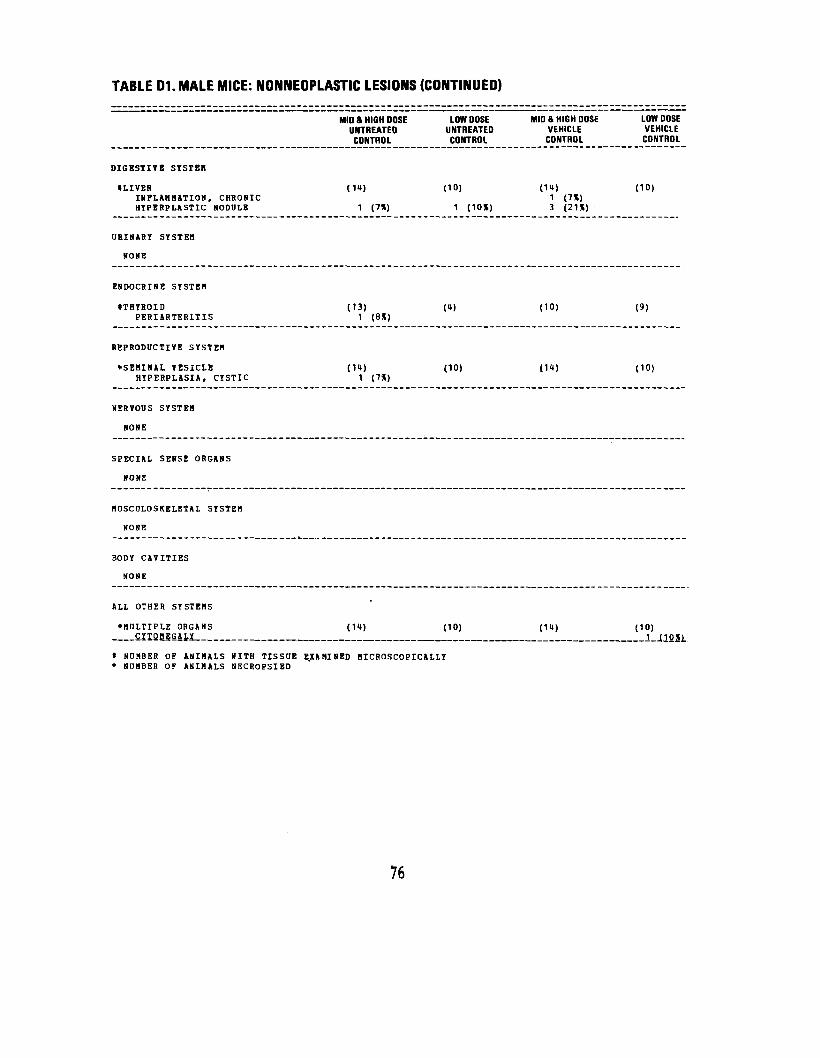
TABLE 01. MALE MICE: NONNEOPLASTIC LESIONS (CONTINUED)
MID ft HIGH DOSE LOW DOSE UNTREATED UNTREATED
CONTROL CONTROL
DIGESTIVE SISTER
•LIVER ( i n ) (10) I N F L A M M A T I O N , CHRONIC HYPERPLASTIC NODDLE 1 (7*) 1 (10X)
D R I N A R Y SYSTEM
N O N E
E N D O C R I N E SYSTEM
t T H Y H O I D (13) (1) P E R I A R T E R I T I S 1 (8X)
REPRODUCTIVE SYSTEM
*SEMINAL VESICLE (11) (10) HYPERPLASIA, CYSTIC 1 (7X)
NERVODS SYSTEM
N O N E
SPECIAL SENSE O R G A N S
NONE
M U S C D L O S K E L E T A L SYSTEM
N O N E
BODY CAVITIES
N O N E
ALL OTHER SYSTEMS
• M D L T I P L E O R G A N S (11) (10) CHOH.5GAL.X
* NUMBER OF ANIMALS KITH TISSUE EXAMINED MICROSCOPICALLY « NUMBER OF ANIMALS SECROPSIBD
76
MID ft HIGH DOSE VEHICLE
CONTROL
(11)1 (7X) 3 (21%)
(10)
(14)
(11)
LOW DOSE VEHICLE
CONTROL
(10)
(9)
(10)
(10) 1 J10X.1.

TABLE 01. MALE MICE: NONNEOPLASTIC LESIONS (CONTINUED)
MID & HIGH DOSE UNTREATED CONTROL
LOW DOSE UNTREATED CONTROL
MID & HIGH DOSE VEHICLE
CONTROL
LOW DOSE VEHICLE
CONTROL
SPECIAL MORPHOLOGY SUHHARY
HO LESIOM REPORTED ANIMAL HISSING/NO NECROPSY AOTOLYSIS/NO NECROPSY
7 1
9 7
1
i|
i NUMBER OF ANIMALS WITH TISSDE EXAMINED MICROSCOPICALLY * NUMBER OF ANIMALS NECROPSIED
11
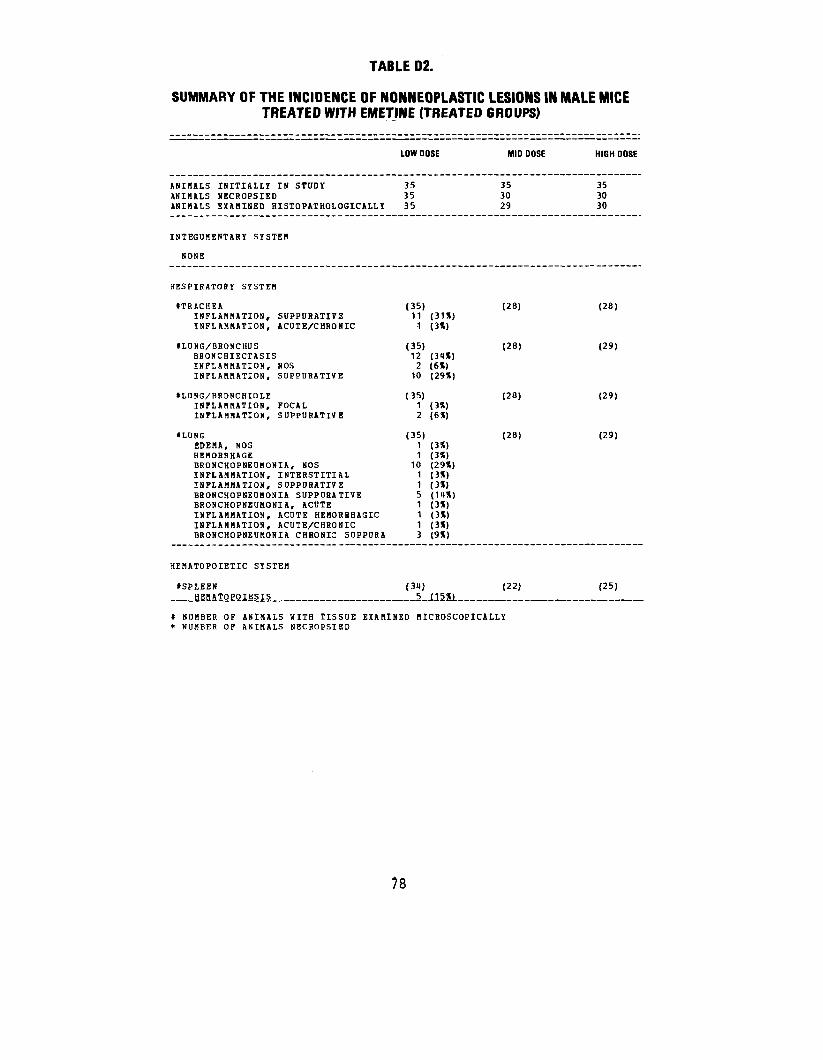
TABLE 02.
SUMMARY OF THE INCIDENCE OF NONNEOPLASTIC LESIONS IN MALE MICE TREATED WITH EMETINE (TREATED GROUPS)
ANIMALS INITIALLY IN STUDY ANIMALS NECROPSIED ANIMALS EXAMINED HISTOPATHOLOGICALLY
INTEGUMENTARY SYSTEM
NONE
RESPIRATORY SYSTEM
tTRACHEA INFLAMMATION, SUPPURATIVE INFLAMMATION, ACUTE/CHRONIC
tLONG/BRONCHUS BRONCHIECTASIS INFLAMMATION, NOS INFLAMMATION, SUPPORATIVE
tLQNG/BRONCHIOLE INFLAMMATION, FOCAL INFLAMMATION, SUPPORATIVE
HLONG EDEMA, NOS HEMORRHAGE BRONCHOPNEDMONIA, NOS INFLAMMATION, INTERSTITIAL INFLAMMATION, SUPPOHATIVE BBONCHOPNEUHONIA SUPPORATIVE BRONCHOPNEOHONIA, ACDTE INFLAMMATION, ACUTE HEMORHHAGIC INFLAMMATION, ACUTE/CHRONIC BRONCHOPNEDMONIA CHRONIC SOPPURA
HEMATOPOIETIC SYSTEM
•SPLEEN HEMATOPOIESIS
LOW DOSE MID DOSE HIGH DOSE
35 35 35 35 30 30 35 29 30
(35) 11 (31X) 1 (3%)
(28) (28)
(35) 12 (31*) 2 (6%) 10 (29%)
(28) (29)
(35) 1 (3X) 2 (6%)
(28) (29)
(35) 1 (3X) 1 (3*)
10 (29%) 1 (3%) 1 (3*) 5 (1HX) 1 (3%) 1 (3%) 1 (3*) 3 (9%)
(28) (29)
(31) 5_J15SL .
(22) (25)
* NUMBER OF ANIMALS WITH TISSUE EXAMINED MICROSCOPICALLY * NUMBER OF ANIMALS NECROPSIED
78

TABLE 02. MALE MICE: NONNEOPLASTIC LESIONS (CONTINUED)
HIGH DOSE
(19)
(19)
(19)
1 (5X)
(29)
(29)
(29)
(30)
1 (3X)
(29)
(29)
(24) 1 i"»Sl
•MANDIBULAR L. MODE ATROPHY, NOS
iMEDIASTINAL L.HODE PLASMACYTOSIS
IMESENTERIC L. NODE INFLAMMATION, MECROTIZIMG INFLAMMATION, CHRONIC
HTHYMUS ATROPHY, SOS
CIRCULATORY SYSTEM
IHEART DEGENERATION, NOS NECROSIS, NOS
*HEART/ATRIUM THROMBOSIS, NOS
•MYOCARDIUM INFLAMMATION, NOS INFLAMMATION, INTERSTITIAL INFLAMMATION, SUPPURATIVE
DIGESTIVE SYSTEM
*LIVER INFLAMMATION. SUPPURATIVE NECROSIS, FOCAL NECROSIS, COAGULATIVE BASOPHILIC CYTO CHANGE FOCAL CELLULAR CHANGE
•PANCREAS INFLAMMATION, CHRONIC
•PANCREATIC ACINDS ATROPHY, NOS
•ESOPHAGUS ULCER,. NOS.
LOW DOSE
(32) 1 (3X)
(32) 1 (3X)
(32)1 (3X)
(6) 6 (100X)
(35) 2 (6X) 2 (6X)
(35) 1 (3X)
,(35) 1 (3X) 2 (6X) 1 (3X)
(35) 1 (3X)
2 (6X) 1 (3X)
(33) 1 (3X)
(33)
(3t) 1 13S1_
MID DOSE
(22)
(22)
(22)
(D
(27)
(27)
(27)
(27)
1 (ux) 3 (11%)
(26) 1 (U%)
(26) 1 (<»%)
(2«)
t NUMBER OF ANIMALS WITH TISSUE EXAMINED MICROSCOPICALLY * NUMBER OF ANIMALS NECROPSIED
79

TABLE D2. MALE MICE: NONNEOPLASTIC LESIONS (CONTINUED)
HIGH DOSE
1 (t%)
(15) 1 (7X)
(15) 1 (7%)
(15) 1 (7%)
(15)
(30)
(29)
INFLAMMATION, SUPPURATIVE ULCER, CHRONIC
•SHALL INTESTINE HEMORRHAGE
•DUODENUM HEMORRHAGE
tILEUH INFLAMMATION, HEMORRHAGIC
ORIHARY SYSTEM
NONE
ENDOCRINE SYSTEM
NONE
REPRODUCTIVE SYSTEM
•PROSTATE ULCER, NOS INFLAMMATION, SUPPORATIVE
*SEMINAL VESICLE INFLAMMATION, SUPPURATIVE INFLAMMATION, CHRONIC
NERVOUS SYSTEM
tBRAIN/MENINGES INFLAMMATION, SUPPURATIVE
SPECIAL SENSE ORGANS
NONE
HUSCULOSKELETAL SYSTEM
NONE _ _ _ .
LOW DOSE MID DOSE
1 (3%) 2 (8*)
(26) (27)
(26) (27)
(26) (27)
(21) (22) 1 (5X) 1 (5X)
(35) (30) 1 (3X) 1 (3X)
(35) (28) 1 (3%)
# NUMBER OF ANIMALS WITH TISSUE EXAMINED MICROSCOPICALLY * NUMBER OF ANIMALS NECROPSIED
80

TABLE D2. MALE MICE: NONNEOPLASTIC LESIONS (CONTINUED)
BODY CAVITIES
*PERITONEUI1 INFLAMMATION, SUPPURATIVE INFLAMMATION, CHRONIC INFLAMMATION, CHRONIC NECROTIZIN FIBROSIS HEMOSIDEROSIS
*VISCERAL PERITONEUM INFLAMMATION, HEMORRHAGIC INFLAMMATION, CHRONIC INFLAMMATION, CHRONIC NECROTIZIN
*PLEURA INFLAMMATION, SOPPURATIVE INFLAMMATION, CHRONIC NECROTIZIN
ALL OTHER SYSTEMS
NONE
SPECIAL MORPHOLOGY SDMMARY
NO LESION REPORTED NECROPSY PERF/NO HISTO PERFORMED NO NECROPSY PERFORMED ADTOLYSIS/NO NECROPSY
LOW DOSE MID DOSE HIGH DOSE
(35) (30) (30) 2 (6%) 2 (6X)
1 (3X) 2 (6%) 1 (3X)
(35) (30) (30) 1 (3%) 2 (7*)
16 (53X) 12 (tOX) 2 (7X)
(35) (30) (30) 1 (3X) 1 (3X)
5 12 12 1 1 1 a it
* NUMBER OF ANIMALS WITH TISSUE EXAMINED MICROSCOPICALLY * NUMBER OF ANIMALS NECROPSIED
&1

TABLE D3.
SUMMARY OF THE INCIDENCE OF NONNEOPLASTIC LESIONS IN FEMALE MICE TREATED WITH EMETINE (CONTROL GROUPS)
MID & HIGH DOSE UNTREATED CONTROL
LOW DOSE UNTREATED CONTROL
ANIMALS INITIALLY IN STDDY ANIMALS NECROPSIED ANIMALS EXAMINED HISTOPATHOLOGICALLY
15 15 15
10 10 10
INTEGUMENTARY SYSTEM
*SKIN (15) (10) INFLAMMATION. NOS 1 (7%) INFLAMMATION, SUPPURATI7E 1 (7X)
BESPIBATOFY SYSTEM
•TRACHEA (14) (7) INFLAMMATION, SOPPORATIYE
tLONG/BRONCHUS (15) (10) INFLAMMATION, CHRONIC SOPPUHATIT
*LUNG (15) (10) CONGESTION, NOS 1 (7*) EDEMA, NOS 2 (13X) HEMORRHAGE 1 (7X) BRONCHOPNEUNONIA CHRONIC SOPPORA
HEHATOPOIETIC SYSTEM
tSPLEEN (13) (10) HEMATOPOIESIS
CIRCULATORY SYSTEM
tMYOCARDIUM (15) (10) INFLAMMATION. ACUTE 1 (7X)
DIQESTIVE SYSTEM
tLIVER (11) (10) .INFLAMMATION , . SUPPaRA.Tiy E_...
* NOHBER OF ANIHALS KITH TISSOE EXAMINED HICROSCOPICALLY * NUMBER OF ANIMALS NECROPSIED
82
MID ft HIGH DOSE VEHICLE CONTROL
15 15 15
(15)
d«)
(10)
(U)
(15) 3 (20%)
(15)
(15)
LOW DOSE VEHICLE CONTROL
10 10 10
(10)
(9) 2 (22*)
(9) 1 (11«)
(9)
U (4UX)
(10) 1 (K0%)
(9)
(10) 1 (1SW

TABLE D3. FEMALE MICE: NONNEOPLASTIC LESIONS (CONTINUED)
I S T O M A C H I N F L A M M A T I O N , S U P P O R A T I V E H Y P E R P L A S I A , NOS
U R I N A R Y S Y S T E M
N O N E
E N D O C R I N E SYSTEH
N O N E
R E P R O D U C T I V E S Y S T E M
* M A B M A R Y G L A N D H Y P E S P L A S I A , CYSTIC
t U T E R U S I N F L A M H A T I O N , S O P P U R A T I V E PYOMETRA
* U T E R U S / E N D O M E T R I U M H Y P E B P L A S I A , C Y S T I C
KERVOOS SYSTEM
N O N E
S P E C I A L SENSE O R G A N S
*EAR T H R O M B O S I S , NOS H E M O R R H A G E
M O S C U L O S K E L E T A L SYSTEM
N O N E
BODY CAVITIES
* P E R I T O N E U M . JNFLAMMATIQN^SOPPDSATITE
MID & HIGH DOSE UNTREATED
CONTROL
(11) 1 <7X) 1 (7%)
(15) 1 (7*)
(15) 1 (7X) 3 (20%)
(15) 10 (67X)
(15) 1 (7%) 1 (7X)
(15) 1 17JL
LOW DOSE UNTREATED
CONTROL
(8)
(10)
(9)
(9) 8 (89X)
(10)
(10)
MID & HIGH DOSE VEHICLE
CONTROL
(15)
(15)
(15)
(15) 11 (93*)
(15)
(15)
LOW DOSE VEHICLE
CONTROL
(10)
(10)
(10)
(10) 8 (80%)
(10)
(10)
* NUMBER OF A N I M A L S »ITH TISSUE EXAMINED MICROSCOPICALLY * NUMBER OF ANIMALS NECHOPSIED
83
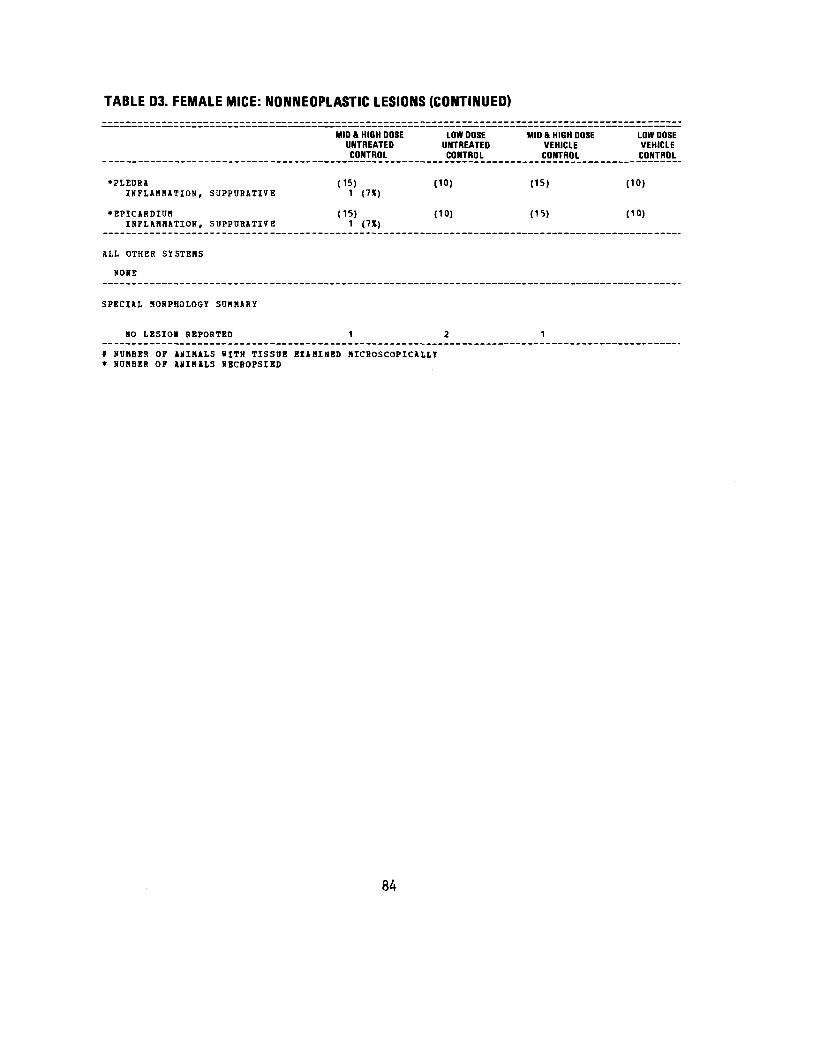
TABLE 03. FEMALE MICE: NONNEOPLASTIC LESIONS (CONTINUED)
MID ft HIGH DOSE UNTREATED
CONTROL
LOW DOSE UNTREATED
CONTROL
MID & HIGH DOSE VEHICLE CONTROL
LOW DOSE VEHICLE
CONTROL
*PLEORA I N F L A M M A T I O N ,
* E P I C A R D I U H I N F L A M M A T I O N ,
S U P P O B A T I V E
SDPP08ATIVE
(15)1 (7X)
(15)1 (7X)
(10)
(10)
(15)
(15)
(10)
(10)
ALL OTHER
NOHE
SYSTEMS
SPECIAL H O K P H O L O G Y S U M M A R Y
HO LESIOI REPORTED 1 2 1
t NUMBER OF ANIMALS KITH TISSDE EXAMINED MICROSCOPICALLY * NUMBER OF ANIMALS NECROPSIED
84

TABLE 04.
SUMMARY OF THE INCIDENCE OF NONNEOPLASTIC LESIONS IN FEMALE MICE TREATED WITH EMETINE (TREATED GROUPS)
LOW DOSE MID DOSE HIGH DOSE
ANIHALS INITIALLY IN STUDY 35 35 35 ANIMALS MISSISG 1 ANIMALS NECROPSIED 3« 26 27 ANIMALS EXAUINED HISTOP4THOLOGICALLY 34 26 27
INTEGUMENTARY SYSTEM
NONE
RESPIRATORY SYSTEM
ITHACHEA (31) (19) (27) INFLAMMATION, SUPPDRATIVE 1 (3X)
• I.UNG (33) (26) (27) INFLAMMATION. INTEBSTITIAL 2 (6X) BRONCHOPNEDMONIA SOPPDHATIYE 1 (3X) BRONCHOPNEUMONIA CHRONIC SUPPUBA 9 (27X)
HEMATOPOIETIC SYSTEM
iBONE MARROW (32) (21) (25) ATROPHY, NOS 1 (3X)
tSPLEEN (3*) (20) (26) INFLAMMATION, NECROTIZING 1 (3X) HEMATOPOIESIS « (12X) 2 (10X) 3 (12X)
»MESENTERIC L. HODE (26) (20) (23) INFLAMMATION, NECROTIZING 1 (IX) INFLAMMATION, ACUTE SDPPURATIVE 1 C»X) RYPEBPLASIA, LYHPHOID 1 (IX)
•INGUINAL LYMPH NODE (26) (20) (23) HYPERPLASIA, LYMPHOID 1 (5X)
CIRCULATORY SYSTEM
HONE
» NUMBER OF ANIMALS WITH TISSUE EXAHHED MICROSCOPICALLY * NUHBER OF ANIMALS NECROPSIED
85

TABLE D4. FEMALE MICE: NONNEOPLASTIC LESIONS (CONTINUED)
LOW DOSE MID DOSE
DIGESTIVE SYSTEM
ILIVER (33) (2K) INFLAMMATION, SOPPORATIVE 1 (3%) INFLANHATION, NECHOTIZING 1 (3%) NECROSIS, FOCAL 1 (<**) NECROSIS, COAGULATIVE 1 ("»*) HEBATOPOIESIS 1 (3X)
*HEPATIC CAPSULE (33) (21) CALCIFICATION, DYSTBOPHIC 1 (3%)
*ESOPHAGUS (29) (20) OLCEH, NOS 6 (30%) INFLAHHATION, SUPPURATIVE 1 (3%) ULCER, CHRONIC D (20X)
tSTOHACH (33) (18) ULCEH, NOS 1 (3%)
URINARY SYSTEM
*ORINARY BLADDER (26) (21) INFLAHHATION, SDPPURATIVE ULCER, CHRONIC 1 (5*)
ENDOCRINE SYSTEM
NONE
REPRODUCTIVE SYSTEM
tOTEHUS/ENDOHETRIUH (29) (22) INFLAHHATION, SOPPURATIVE 1 (3%) INFLAMMATION, ACUTE/CHRONIC 1 (3%) HYPERPLASIA, CYSTIC 21 (72*)
IOVARY (21) (19) CYST, NOS 1 (5*)
NERVOUS SYSTEM
NONE
* NUMBER OF ANIMALS WITH TISSUE EXAMINED MICROSCOPICALLY * NUMBER OF ANIMALS NECROPSIED
HIGH DOSE
(27)
1 (t*)
3 (11%)
(27)
(21)3 (13%)
(17)
(18)1 (6%)
(25)
(21)
86
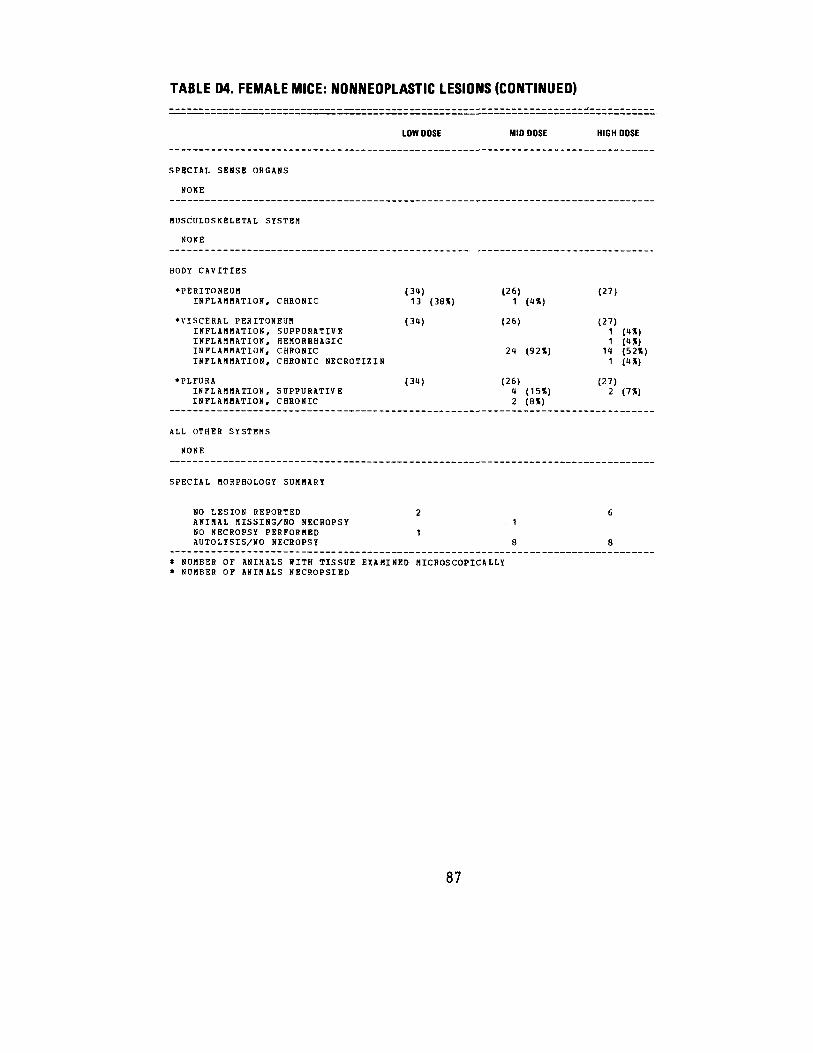
TABLE D4. FEMALE MICE: NONNEOPLASTIC LESIONS (CONTINUED)
HIGH DOSE
(27)
(27) 1 (4S) 1 (4X)
14 (52X) 1 (4X)
(27) 2 (7%)
6
8
LOW DOSE
SPECIAL SENSE ORGANS
NONE
MUSCOLOSKELETAL SYSTEM
NONE
BODY CAVITIES
*PERITONEUM INFLAMMATION. CHBONIC
*VISCEHAL PERITONEUM INFLAMMATION, SUPPURATIVE INFLAMMATION, HEMOBRHAGIC INFLAMMATION, CHRONIC INFLAMMATION, CHRONIC NECROTIZIN
(34) 13 (38%)
(3U)
*PLEURA (34) INFLAMMATION, SDPPURATIVE INFLAMBATION, CHRONIC
ALL OTHER SYSTEMS
NONE
SPECIAL MORPHOLOGY SUMMARY
NO LESION REPORTED ANIMAL MISSING/NO NECROPSY NO NECROPSY PERFORMED AUTOLYSIS/NO NECROPSY
# NDHBEB OF ANIMALS WITH TISSUE EXAMINED* NUMBER OF A N I M A L S NECROPSIED
2
1
MICROSCOPICALLY
87
MID DOSE
(26) 1 (4X)
(26)
24 (92X)
(26) 4 (15%) 2 (8X)
1
8


APPENDIX E
ANALYSES OF THE INCIDENCE OF PRIMARY TUMORS IN
RATS TREATED WITH EMETINE
89

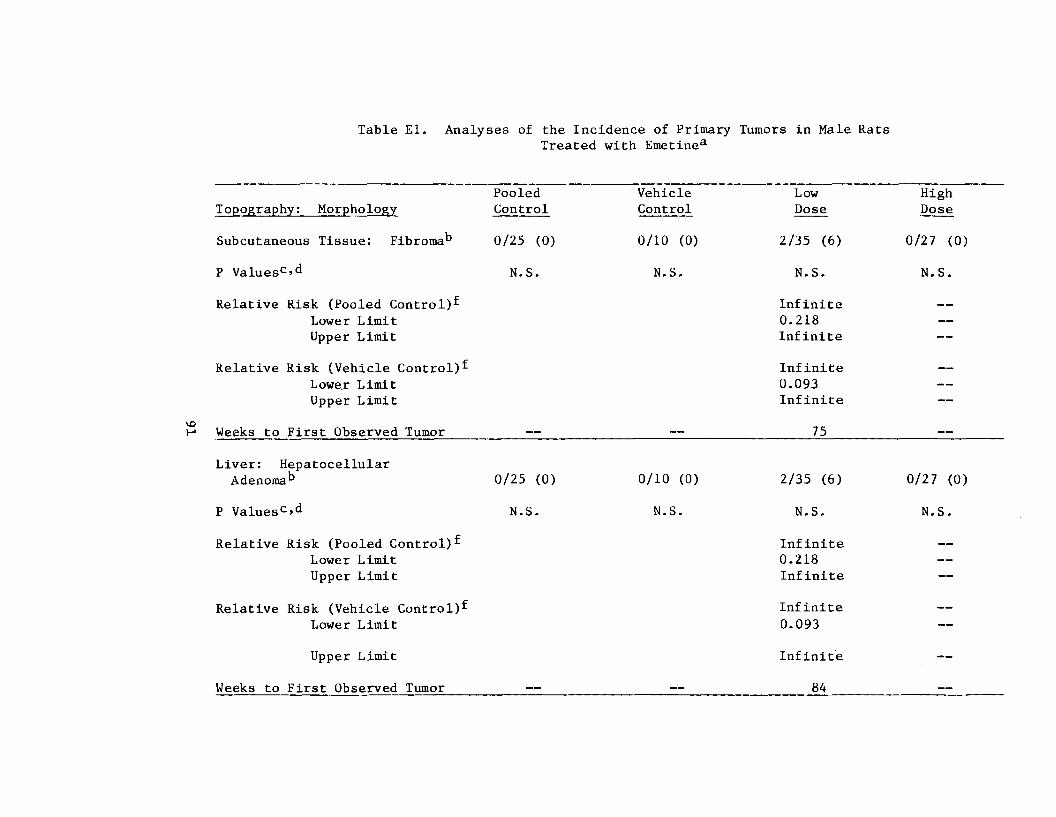
__
__
__
__
__
Table El. Analyses of the Incidence of Primary Tumors in Male Rats Treated with Emetine3
Topography: Morphology
Subcutaneous Tissue: Fibroma"3
P Values0 »d
Relative Risk (Pooled Control)f
Lower Limit Upper Limit
Relative Risk (Vehicle Control)f
Lowe.r Limit Upper Limit
Weeks to First Observed Tumor
Liver: Hepatocellular Adenoma*5
P Values0>d
Relative Risk (Pooled Control)f
Lower Limit Upper Limit
Relative Risk (Vehicle Control)f
Lower Limit
Upper Limit
Weeks to First Observed Tumor —
Pooled Control
0/25 (0)
N.S.
0/25 (0)
N.S.
Vehicle Control
0/10 (0)
N.S.
—
0/10 (0)
N.S.
Low Dose
2/35 (6)
N.S.
Infinite 0.218 Infinite
Infinite 0.093 Infinite
75
2/35 (6)
N.S.
Infinite 0.218 Infinite
Infinite 0.093
Infinite
84 —
High Dose
0/27 (0)
N.S.
— —
— —
0/27 (0)
N.S.
— —
— —
—
—

Table El. Analyses of the Incidence of Primary Tumors in Male Rats Treated with Emetine3
(continued) Pooled Vehicle
Topography: Morphology Control Control
Pituitary: Chromophobe Carcinoma 2/25 (8) 1/10 (10)
P Values0 » d N.S. N.S.
Relative Risk (Pooled Control)f
Lower Limit Upper Limit
Relative Risk (Vehicle Control)f
Lower Limit Upper Limit
__ Weeks to First Observed Tumor 84
Pituitary: Chromophobe Adenoma or Carcinoma 3/25 (12) 2/10 (20)
P Values0 » d N.S. N.S.
Relative Risk (Pooled Control)f
Lower Limit Upper Limit
Relative Risk (Vehicle Control)f
Lower Limit Upper Limit
Weeks to First Observed Tumor 84 —
Low Dose
1/32 (3)
N.S.
0.391 0.007 7.098
0.313 0.004 23.802
84
4/32 (13)
N.S.
1.042 0.195 6.533
0.625 0.114 6.349
84
High Dose
1/22 (5)
N.S.
0.568 0.010 10.110
0.455 0.006 34.087
80
2/22 (9)
N.S.
0.758 0.069 5.976
0.455 0.040 5.664
80

__ __
__
__
Table El. Analyses of the Incidence of Primary Tumors in Male Rats Treated with Emetine3
(continued)
Topography: Morphology
Parathyroid: Adenoma, NOSb
P Values0 >d
Relative Risk (Pooled Control)f
Lower Limit Upper Limit
Relative Risk (Vehicle Control)f
Lower Limit Upper Limit
Weeks to First Observed Tumor
Pancreatic Islets: Islet-cell Adenoma
P Values0 >d
Relative Risk (Pooled Control) ^ Lower Limit Upper Limit
Relative Risk (Vehicle Control)f
Lower Limit Upper Limit
Weeks to First Observed Tumor
Pooled Control
0/9 (0)
N.S.
0/24 (0)
N.S.
—
High Dose
1/7 (14)
N.S.
Infinite 0.076 Infinite
Infinite 0.039 Infinite
1/26 (4)
N.S.
Infinite 0.051 Infinite
Infinite 0.020 Infinite
——
Low Dose
0/10 (0)
N.S. _M
— —
— —
2/34 (6)
N.S.
Infinite 0.215 Infinite
Infinite 0.088 Infinite
84
Vehicle Control
0/4 (0)
N.S.
0/9 (0)
N.S.
83
83

__
__
Table El. Analyses of the Incidence of Primary Tumors in Male Rats Treated with Emetine3
(continued) Pooled Vehicle Low High
Topography: Morphology Control Control Dose Dose
Testis: Interstitial-cell Tumor 0/25 (0) 0/10 (0) 3/34 (9) 0/27 (0)
d N.S. N.S. N.S. N.S. P Values0 >
Departure from Linear Trend6 P = 0.029
Relative Risk (Pooled Control)-^ Infinite Lower Limit 0.453
— Upper Limit Infinite —
Relative Risk (Vehicle Control)f Infinite Lower Limit 0.197
— Upper Limit Infinite —
Weeks to First Observed Tumor 84 — — —
aTreated groups received doses of 0.5 or 1 mg/kg body weight by intraperitoneal injection.
''Number of tumor-bearing animals/number of animals examined at site (percent).
cBeneath the incidence of tumors in a control group is the probability level for the Cochran-Armitage test when P < 0.05; otherwise, not significant (N.S.) is indicated. Beneath the incidence of tumors in a treated group is the probability level for the Fisher exact test for the comparison of that treated group with the vehicle-control group (*) or with the pooledcontrol group (**) when P < 0.05 for either control group; otherwise, not significant (N.S.) is indicated.

Table El. Analyses of the Incidence of Primary Tumors in Male Rats Treated with Emetine3
(continued)
A negative trend (N) indicates a lower incidence in a treated group than in a control group.
eThe probability level for departure from linear trend is given when P < 0.05 for any comparison.
fThe 95% confidence interval of the relative risk between each treated group and the specified control group.
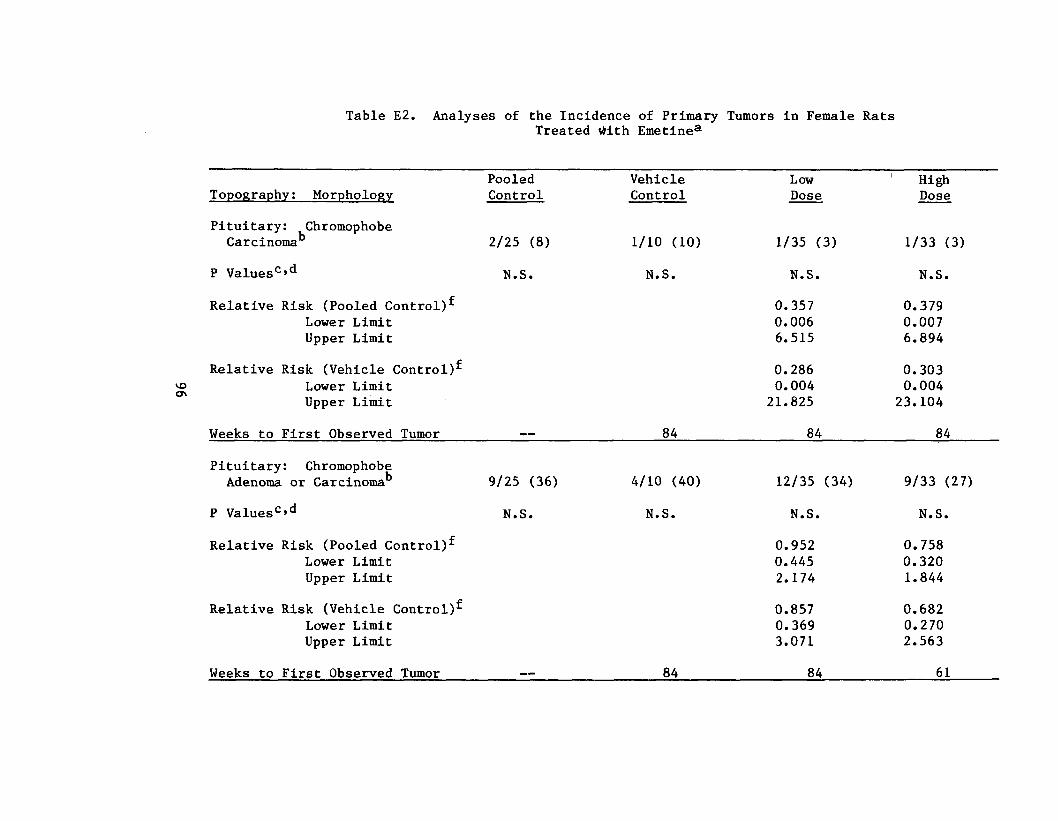
__
Table E2. Analyses of the Incidence of Primary Tumors in Female Rats
Topography: Morphology
Pituitary: Chromophobe Carcinoma
P Valuesc'd
Relative Risk (Pooled Control)f
Lower Limit Upper Limit
Relative Risk (Vehicle Control)f
Lower Limit Upper Limit
Weeks to First Observed Tumor
Pituitary: Chromophobe Adenoma or Carcinoma
P Values0 »d
Relative Risk (Pooled Control)f
Lower Limit Upper Limit
Relative Risk (Vehicle Control)f
Lower Limit Upper Limit
Weeks to First Observed Tumor
Treated with Emetine3
Pooled Vehicle Low High Control Control Dose Dose
2/25 (8) 1/10 (10) 1/35 (3) 1/33 (3)
N.S. N.S. N.S. N.S.
0.357 0.379 0.006 0.007 6.515 6.894
0.286 0.303 0.004 0.004 21.825 23.104
_— 84 84 84
9/25 (36) 4/10 (40) 12/35 (34) 9/33 (27)
N.S. N.S. N.S. N.S.
0.952 0.758 0.445 0.320 2.174 1.844
0.857 0.682 0.369 0.270 3.071 2.563
84 84 61

__
Table E2. Analyses of the Incidence of Primary Tumors in Female Rats Treated with Emetine3
(continued)
Topography: Morphology
Adrenal: Cortical Adenoma
P Values0 »d
Departure from Linear Trend6
Relative Risk (Pooled Control)f
Lower Limit Upper Limit
Relative Risk (Vehicle Control)f
Lower Limit Upper Limit
Weeks to First Observed Tumor
Mammary Gland: Adenocarcinoma, NOS
P Valuesc»d
Relative Risk (Pooled Control)f
Lower Limit Upper Limit
Relative Risk (Vehicle Contol)f
Lower Limit Upper Limit
Weeks to First Observed Tumor
Pooled Control
3/25 (12)
N.S.
P = 0.026
0/25 (0)
N.S.
Vehicle Control
3/10 (30)
P = 0.018(N)
84
0/10 (0)
N.S.
Low Dose
9/35 (26)
N.S.
2.143 0.608 11.255
0.857 0.291 4.323
66
1/35 (3)
N.S.
Infinite 0.039 Infinite
Infinite 0.017 Infinite
84
High Dose
2/35 (6)
N.S.
0.476 0.043 3.876
0.190 0.020 1.494
84
2/35 (6)
N.S.
Infinite 0.218 Infinite
Infinite 0.093 Infinite
61 ———

__
Table E2. Analyses of the Incidence of Primary Tumors in Female Rats Treated with Emetine3
(continued)
Topography: Morphology
Mammary Gland: Fibroadenoma
P Values0 »d
Relative Risk (Pooled Control)f
Lower Limit Upper Limit
Relative Risk (Vehicle Control)f
Lower Limit Upper Limit
Weeks to First Observed Tumor
Uterus: Endometrial Stromal Polypb
P Values0 »d
Relative Risk (Pooled Control)f
Lower Limit Upper Limit
Relative Risk (Vehicle Control)f
Lower Limit Upper Limit
Weeks to First Observed Tumor
Pooled Control
5/25 (20)
N.S.
0/25 (0)
N.S.
—
Vehicle Control
2/10 (20)
N.S.
84
0/10 (0)
N.S.
——
Low Dose
14/35 (40)
N.S.
2.000 0.802 6.183
2.000 0.604 16.343
66
3/35 (9)
N.S.
Infinite 0.443 Infinite
Infinite 0.191 Infinite
84
High Dose
10/35 (29)
N.S.
1.429 0.516 4.720
1.429 0.398 12.223
52
1/35 (3)
N.S.
Infinite 0.039 Infinite
Infinite 0.017 Infinite
83

Table E2. Analyses of the Incidence of Primary Tumors in Female Rats Treated with Emetine3
(continued)
aTreated groups received doses of 0.5 or 1 mg/kg body weight by intraperitoneal injection.
"Number of tumor-bearing animals/number of animals examined at site (percent).
°Beneath the incidence of tumors in a control group is the probability level for the Cochran-Armitage test when P < 0.05; otherwise, not significant (N.S.) is indicated. Beneath the incidence of tumors in a treated group is the probability level for the Fisher exact test for the comparison of that treated group with the vehicle-control group (*) or with the pooledcontrol group (**) when P < 0.05 for either control group; otherwise, not significant (N.S.) is indicated.
"A negative trend (N) indicates a lower incidence in a treated group than in a control group.
eThe probability level for departure from linear trend is given when P < 0.05 for any comparison.
^The 95% confidence interval of the relative risk between each treated group and the specified control group.


APPENDIX F
ANALYSES OF THE INCIDENCE OF PRIMARY TUMORS IN
MICE TREATED WITH EMETINE
101

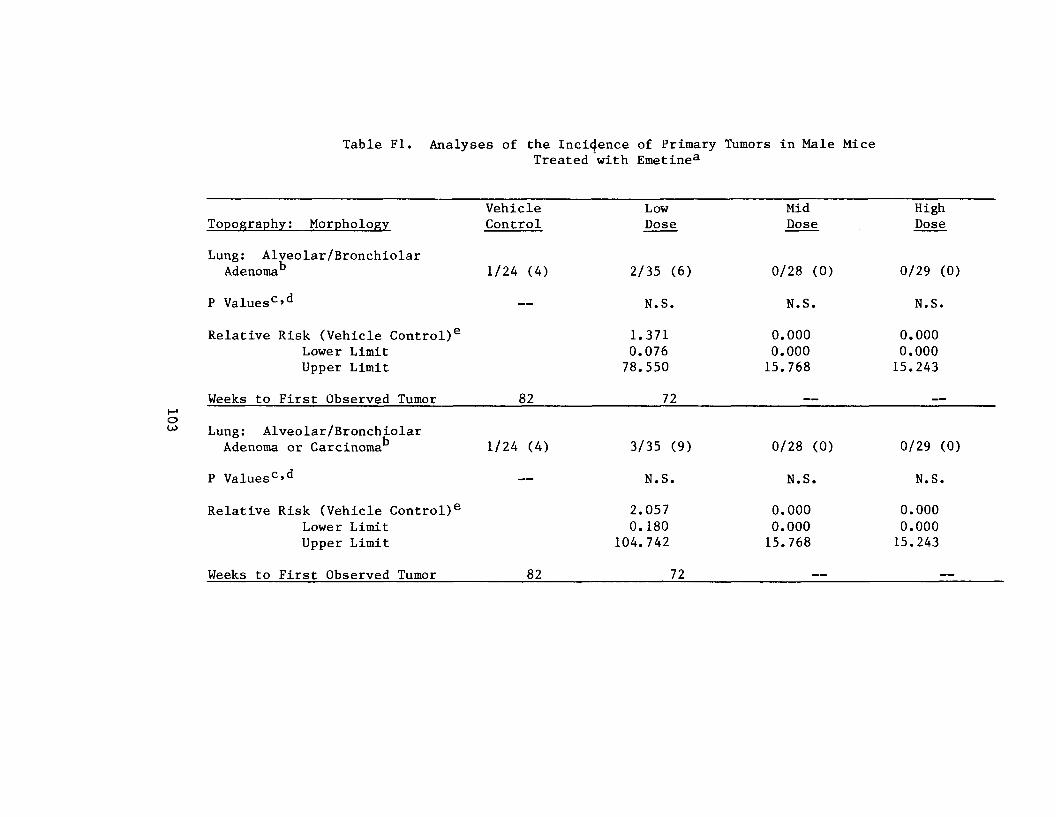
__ __
Table Fl. Analyses of the Incidence of Primary Tumors in Male Mice Treated with Emetine3
Vehicle Low Mid High Topography: Morphology Control Dose Dose Dose
Lung: Alveolar /Bronchiolar Adenoma 1/24 (4) 2/35 (6) 0/28 (0) 0/29 (0)
P Values0'd N.S-. N.S. N.S. —
Relative Risk (Vehicle Control)6 1.371 0.000 0.000 Lower Limit 0.076 0.000 0.000 Upper Limit 78.550 15.768 15.243
Weeks to First Observed Tumor 82 72
Lung: Alveolar/Bronchiolar Adenoma or Carcinoma 1/24 (4) 3/35 (9) 0/28 (0) 0/29 (0)
P Valuesc'd N.S. N.S. N.S. —
Relative Risk (Vehicle Control)6 2.057 0.000 0.000 Lower Limit 0.180 0.000 0.000 Upper Limit 104.742 15.768 15.243
Weeks to First Observed Tumor 82 72 — —

Table Fl. Analyses of the Incidence of Primary Tumors in Male Mice Treated with Emetine3
(continued) Vehicle Low Mid High
Topography; Morphology Control Dose Dose Dose
Liver: Hepatocellular Carcinoma 1/24 (4) 3/35 (9) 0/27 (0) 0/30 (0)
P Values0 »d N.S. N.S. N.S. —
Relative Risk (Vehicle Control)6 2.057 0.000 0.000 Lower Limit 0.180 0.000 0.000 Upper Limit 104.742 16.331 14.750
Weeks to First Observed Tumor 75 50 — — —
aTreated groups received doses of 1.6, 3.2, or 6.4 mg/kg body weights by intraperitoneal injection.
^Number of tumor-bearing animals/number of animals examined at site (percent).
cBeneath the incidence of tumors in a treated group is the probability level for the Fisher exact test for the comparison of that treated group with the matched control group when P < 0.05; otherwise, not significant (N.S.) is indicated.
Since survivals were not comparable no trend tests were made.
eThe 95% confidence interval of the relative risk between each treated group and the matched control group.

Table F2. Time-adjusted Analyses of the Incidence of Primary Tumors in Male Mice Treated with Emetine3
Topography: Morphology
Lung: Alveolar/Bronchiolar Adenoma (52)b
P Values0 »d
Relative Risk (Vehicle Control)6
Lower Limit Upper Limit
Weeks to First Observed Tumor
Lung: Alveolar/Bronchiolar Adenoma or Carcinoma (52)
P Values0 »d
Relative Risk (Vehicle Control)6
Lower Limit Upper Limit
Weeks to First Observed Tumor
Vehicle Low Mid High Control Dose Dose Dose
1/23 (4) 2/30 (7) 0/2 (0) 0/1 (0)
N.S. N.S. N.S. —
1.533 0.000 0.000 0.085 0.000 0.000 87.354 119.310 89.856
__ __ 82 72
1/23 (4) 3/30 (10) 0/2 (0) 0/1 (0)
N.S. N.S. N.S. —
2.300 0.000 0.000 0.200 0.000 0.000
116.430 119.310 89.856
82 72 — —

Table F2. Time-adjusted Analyses of the Incidence of Primary Tumors in Male Mice Treated with Emetine3
(continued) Vehicle Low Mid High
Topography; Morphology Control Dose Dose Dose
Liver: Hepatocellular Carcinoma (50)b 1/23 (4) 3/31 (10) 0/2 (0) 0/1 (0)
P Values0 »d N.S. N.S. N.S. —
Relative Risk (Vehicle Control)6 2.226 0.000 0.000 Lower Limit 0.196 0.000 0.000 Upper Limit 112.848 119.310 89.856
Weeks to First Observed Tumor 75 50 — —
aTreated groups received doses of 1.6, 3.2, or 6.4 mg/kg body weight by intraperitoneal injection.
"Number of tumor-bearing animals/number of animals examined at site (percent), based upon animals that lived at least as long as the number of weeks on study shown in parentheses after the morphology.
GBeneath the incidence of tumors in a treated group is the probability level for the Fisher exact test for the comparison of that treated group with the matched control group when P < 0.05; otherwise, not significant (N.S.) is indicated.
"Since survivals were not comparable no trend tests were made.
eThe 95% confidence interval of the relative risk between each treated group and the matched control group.

Review of the Bioassay of Emetine*for Carcinogenicity by the Data Evaluation/Risk Assessment Subgroup of the
Clearinghouse on Environmental Carcinogens
November 28, 1977
The Clearinghouse on Environmental Carcinogens was established in May, 1976 under the authority of the National Cancer Act of 1971 (P.L. 92-218). The purpose of the Clearinghouse is to advise on the National Cancer Institute's bioassay program to identify and evaluate chemical carcinogens in the environment to which humans may be exposed. The members of the Clearinghouse have been drawn from academia, industry, organized labor, public interest groups, State health officials, and quasi-public health and research organizations. Members have been selected on the basis of their experience in carcinogenesis or related fields and, collectively, provide expertise in organic chemistry, biochemistry, biostatistics, toxicology, pathology, and epidemiology. Representatives of various Governmental agencies participate as ad hoc members. The Data Evaluation/Risk Assessment Subgroup of the Clearinghouse is charged with the responsibility of providing a peer review of NCI bioassay reports on chemicals studied for carcinogenicity. In this context, below is the edited excerpt from the minutes of the Subgroup's meeting at which Emetine was reviewed.
It was noted that the drug was tested as part of a program to study the potential carcinogenicity of cancer chemotherapeutic agents. The experimental protocol deviated from the standard bioassay, since it was meant to mimic the clinical exposure situation. The primary reviewer said that the high dose levels initially tested were excessive, as evidence by the growth curves and mortality incidences. Although the NCI staff concluded that the study was inadequate to evaluate the carcinogenicity of Emetine, the Subgroup reviewer said that the survival was sufficient at low dosages to assess the drug when used as a chemotherapeutic agent in adults. He concluded that Emetine poses no carcinogenic hazard when used as an adult chemotherapeutic agent. He added that the study was inadequate as a carcinogenicity screen if the drug were to be used in children.
The secondary reviewer said that he agreed with the conclusions stated in the report. His assessment was based on the high mortality resulting in inadequate numbers of animals in each group. A discussion ensued as to the weight that should be given to a negative study that contained less than the desired number of animals. It was suggested by one Subgroup member that a probabilistic model be constructed that could be used for interpreting negative studies.
107

A motion was made as follows: "As part of a program of research on the potential carcinogenicity of drugs used in cancer chemotherapy. Emetine was tested in rats and mice. Survival of the mice was poor. The bioassay is inadequate to answer the question of carcinogenicity in the absolute sense, but the data obtained do not seem to indicate (Emetine to be) an appreciable risk when used in chemotherapy in adults. If (its) independent use is contemplated, more adequate data need to be developed for a definitive conclusion to be drawn." The motion was seconded and approved by all present except Mr. Garfinkel, who opposed it.
Members present were:
Gerald N. Wogan (Chairman), Massachusetts Institute of Technology Lawrence Garfinkel, American Cancer Society Henry C. Pitot, University of Wisconsin Medical Center George Roush, Jr., Monsanto Company Verald K. Rowe, Dow Chemical U.S.A. Michael B. Shimkin, University of California at San Diego Louise Strong, University of Texas Health Sciences Center John H. Weisburger, American Health Foundation
* Subsequent to this review, changes may have been made in the bioassay report either as a result of the review or other reasons. Thus, certain comments and criticisms reflected in thre review may no longer be appropriate.
U. S. GOVERNMENT PRINTING OFFICE : 1978 — 260-899/3016
108


DHEW Publication No. (NIH) 78-843