tpc benchmarktm e report 2009 tpc benchmarktm e report vi configured customers: broker-volume...
TRANSCRIPT

-TPC BenchmarkTM E Report
TPC BenchmarkTM EReport
Unisys ES7000 Model 7600REnterprise Server (16s)
using
Microsoft SQL Server 2008 R2Datacenter Edition
on
Microsoft Windows Server 2008 R2Datacenter Edition
First EditionNovember 2, 2009

November 2009 TPC BenchmarkTM E Report ii
First Edition - November 2009
Unisys Corporation believes that the information in this document is accurate as of the publication date. Theinformation in this document is subject to change without notice. Unisys Corporation assumes no responsibility forany errors that may appear in this document.
The pricing information in this document is believed to accurately reflect the current prices as of the publication date.However, Unisys Corporation and Microsoft Corporation provide no warranty on the pricing information in thisdocument.
Benchmark results are highly dependent upon workload, specific application requirements, and systems design andimplementation. Relative system performance will vary as a result of these and other factors. Therefore, TPCBenchmarkTM E should not be used as a substitute for a specific customer application benchmark when criticalcapacity planning and/or product evaluation decisions are contemplated.
All performance data contained in this report were obtained in a rigorously controlled environment, and thereforeresults obtained in other operating environments may vary significantly. Unisys Corporation and MicrosoftCorporation do not warrant or represent that a user can or will achieve similar performance expressed in transactionper second (tpsE) or normalized price/performance ($/tpsE). No warranty of system performance or price/performance is expressed or implied in this report.
Copyright © 2009 Unisys Corporation.
All Rights Reserved. Permission is hereby granted to reproduce this document in whole or in part provided thecopyright notice printed above is set forth in full text on the title page of each item reproduced.
Printed in USA, November 2009.
Unisys is a registered trademark of Unisys Corporation.
Intel, Xeon, Xeon(R) and Xeon Processor MP are registered trademarks of Intel Corporation.
Microsoft, Windows, Visual C++ and SQL Server 2008 are registered trademarks of Microsoft Corporation.
TPC Benchmark, TPC-E and tpsE are trademarks of the Transaction Processing Performance Council.
Other product names used in this document may be trademarks and/or registered trademarks of their respectivecompanies.

Abstract
Overview
This report documents the methodology and results of the TPC BenchmarkTM E (TPC-E) conducted on the Unisys Corporation ES7000 Model 7600R Enterprise Server (16s). The operating system on the server was Microsoft Windows Server 2008 R2 Datacenter Edition. The DBMS used was Microsoft SQL Server 2008 R2 Datacenter Edition. The TPC applications, which included TPC provided EGen software, were provided by Microsoft Corporation. The operating system on the client was Microsoft Windows Server 2008 R2 Standard Edition. The standard TPC BenchmarkTM E metrics, tpsE (transactions per second), price per tpsE (three year capital cost per reported tpsE), and the availability date are reported as required by the benchmark specification.
Executive Summary
The following pages contain the Executive Summary results of the benchmark. The Executive Summary Statement (ExecutiveSummary.pdf) and the (ES.xml) file can be found in the ExecutiveSummaryStatement folder.
Auditor
Lorna Livingtree of Performance Metrics, Inc., verified compliance with the relevant TPC specifications, audited the benchmark configuration, environment, and methodology used to produce and validate the test results, along with the pricing model used to calculate the price per tpsE.
November 2009 TPC BenchmarkTM E Report iii

870 x 73GB 15K rpmDatabase Storage
12 x 146GB 15K rpm8,309 GB
Redundancy Level: 1
RAID-10
Initial Database Size
TPC-E Throughput Price/Performance Availability Date Total System Cost
Microsoft SQL Server 2008 R2 Datacenter
Edition16/96/96
$958.23 USD per tpsE May 6, 2010
Database Server ConfigurationMemory
$1,928,688
Database Manager Processors/Cores/ ThreadsMicrosoft Windows
Server 2008 R2 Datacenter Edition
ES7000 Model 7600R
Operating System
tpsE2012.77
Enterprise Server (16s) November 2, 2009
USD
1024GB
TPC-E 1.9.0TPC Pricing 1.5.0
Report Date
StorageRTS 4200 RAID Storage870 x 73GB 12 x 146GB External Fibre Channel disks,31 x FCExternal RAID controllers
ClientES3000 Model 3560R2 x Intel® Quad-core Xeon™ E5520 2.26GHz w/ 8MB Smart cache,6 GB memory, 1 x 73GB internal disk,4 Inbuilt 1Gb Eth. cntrls.
ServerES7000 Model 7600R16 x Intel® Hex-core Xeon™X7460 2.66GHz w/ 16MB L3 cache, 1 TB memory,2 x 73GB SAS disk, internal ,1 x PCI SAS RAID cntrl, internal, 15 x PCI Fibre Channel cntrls,8 Inbuilt 1Gb Eth. cntrls. (2 used).
November 2009 TPC BenchmarkTM E Report iv

Extended
Server Hardware:ES7/7600R 16x X7460, 64GB ES7764163-100 1 1ES7000 7600R Installation Accessory Kit ES790001-IAK 1 1Snap-in 1U Filler RCK4219421-1UP 1 3Snap-In 3U Fil ler RCK4219421-3UP 1 4Power Strip PWR4243001-SD 1 2Power Strip PWR4243001-SVD 1 242U Rack RCK4219421-FSS 1 1Rack Trim Kit RCK4219421-OTK 1 1Internal RAID + 2 x 73GB Hard Drive FAC7760731-IDK 1 1Initial Memory - 16GB FAC7102803-ICA 1 4Memory Expansion - 16GB FAC7102803-16G 1Emulex LPe12002 - Disk HBA FCH9540231-PCE 1
SubtotalServer Software:
Windows Server 2008 R2 Datacenter Edition P71-06367 2SQL Server 2008 R2 Datacenter Edition * 2*SRVC: Microsoft Problem Resolution Services 2
SubtotalStorage Hardware:
Rack Mount Kit RTS400012-RK 1Disk Enclosure with (15) 73GB Disk - 30 Pack RTS4307315-30P SDisk for RAID Enclosure RTS4307315-4FH SDual RAID Controller for Log RTS422880-T2 1SAN Manager Software RTS44101-SAN 1146GB Disk Drive RTS4314615-4FH 1RAID Controller 1x1 Style 1 - 15 Pack RTS4228801-P15 1RAID Controller 1x1 Style 1 RTS422880-1X1 1RAID Controller 1x1 Style 2 - 5 Pack RTS4228802-P05 1RAID Controller 1x1 Style 2 RTS422880-T1 1Optical Tranceiver RTS400150-SFP 1AC Power Cord RTS400740-CBL 1UPS for Log Enclosure UPS120 5
Infrastructure8 port KVM switch KVM9083101-SWC 1Rack mount LCD w/1U Drawer MON2145-LCD 1Rack mount keyboard, w/touchpad, USB KBR210501-USB 142U Rack - No Doors RM421940-FRM 18 Outlet Power Strip SFR9-PWR 1Power Cord USE1936-LC6 116 Port Ethernet Switch (Netgear) incl 2 spares FS116 4Fiber Channel Cable incl 2 spares GCFAZLLM20-M 3Ethernet Cable incl 2 spares GCP0888650-BL 3
Client Hardware:ES3/3560R Server ES3560031-SVR 1ES3/3560R Server, 2.26GHz CPU ES3560341-CPU 1ES3/3560R No Bezel ES3560012-BZL 1Hard Drive - 73GB,10K SAS 2.5 ES3599011-DSK 1ES3/3560R Slide Ready Rail,No Cb Mng Arm ES3560011-RCK 1ES3000 DVD ROM, SATA, Internal ES3599021-ODD 1ES3/3560R High Output PSply,NonRdnt,870W ES3560111-PWR 1ES3000 6GB,6x1GB,1333M,1R UDIMM,2P,OP ES3599591-MEM 1ES3/3560R Server, 2.26GHz 2nd CPU ES3599341-CPU 1Power Cord OSM1000-PRC 1USB to Cat5 KVM Adapter KVM9002301-CNV 1
SubtotalClient Software:
Windows Server 2008 R2 Standard Edition P73-04980 2Subtotal
Unisys Product Pricing (List Pricing) - Michael Heifner (215)-986-4757 where Price Source = 1 or S Total USD
Notes:1. HW & SW maintenance at 24 x 7 w/ 4 hr. max. response time for spares. USD2. Price Source: 1 = Unisys Product Price, Unisys Maintenance Price TPC-E Throughput:
2 = Microsoft 3 = CableSys 4 = NewEgg Price/Performance: USD5 = IQstor
S One or more components of the measured configuration have beensubstituted in the Priced Configuration - see FDR for details
* This component is not immediately orderable. See the FDR for more informationBenchmark results and test methodology audited by Lorna Livingtree of Performance Metrics, Inc.Prices used in TPC benchmarks reflect the actual prices a customer would pay for a one-time purchase of the stated components. Individually negotiated discounts are not permitted. Special prices based on assumption about past or future purchases are not permitted. All discountsreflect standard pricing policies for the listed components. For complete details, see the pricing sections of the TPC benchmarks specifications.If you find that the stated prices are not available according to these terms, please inform the TPC at [email protected]. Thank You.
$31,020$3,190
$60,6126$45,459
31
$7,920$2,246
30
$2,246
$210,540
$6,600$333,144
12
$484$15,840
1435
1
2960$11
$1,000
$2,700
$24
$660
$1,300
2$823,508
1
$275$1,286
$10,340
$1,300
$110
TPC-E 1.9.0
$806
November 2, 2009 Report Date
$88
$6,768$145,290
$1,005
$5,144
$259
$1,085
$15,166
$768
$2,890
$770,624
$30$272
$0
$60
$8,032
$3,295 $1,005
$579
$250$13
$2,700
$85,400
$1,920,656
$239
$59,790
$104,277
$149
$579
$300
$1311
$30
1
1
1
1
$403$2,769
$350$2,403
$333,144
$2,769$350
$9,512
$307,352
$250
$2,000
$301
1
Subtotal
$1,0851$579
$69
$15,840
37
1
5
11
1
174
17
Description Qty.Part Number Price Unit Price Source
$958.23
$711
2,012.77 tpsE$1,928,688
$0
3-Year Cost of Ownership:
$711$711
3-yr Maint. Price Price
ES7000 Model 7600REnterprise Server (16s)
TPC Pricing 1.5.0
$145,290
56
$100$20$22
$392
$2,378$2,403
$784
$100
$0
$272$579
Subtotal
$239$149
$7
$275
$69
$1,530
$30
32
$170$90
111
$60
$6,768
$259
15
$37,712$732,912
$2591
1616
$10,102$104,277
$45,459
$1,525$3,986
$2,357
$660
$220
$45,807
November 2009 TPC BenchmarkTM E Report v

Configured Customers:
Broker-Volume
Customer-Position
Market-Feed
Market-Watch
Security-Detail
Trade-Lookup
Trade-Order
Trade-Result
Trade-Status
Trade-Update
Data-Maintenance
Transaction Mix (in percent of total transactions)
Broker_Volume
Customer-Position
Market-Feed
Market-Watch
Security-Detail
Trade-Lookup
Trade-Order
Trade-Result
Trade-Status
Trade-Update
Data-Maintenance
Test Duration and Timing
Ramp-up Time (hh:mm:ss)
Measurement Interval (hh:mm:ss)
Business Recovery Time (hh:mm:ss)
Total Number of Transactions Completed in Measurement Interval
13.000%
1.000%
18.000%
19.001%
14.000%
8.000%
10.100%
9.999%
144,927,546
2.000%
N/A
2,898,338
120
0:53:25
2:00:00
1:11:57
14,638,092
14,491,978
27,536,991
1,449,216
26,087,012
20,289,638
11,594,027
18,841,160
7,101,094
Transaction Count
0.03
0.53
0.05
0.73
0.08 N/A
0.11
7.04
0.150.10
0.18
0.05
3.26
4.08
0.04
0.72
4.900%
12.03
3.12
4.01
1.19
Mix
0.01
0.00
0.00
0.00
0.00
0.00
0.00
Minimum
0.00
0.00
0.01
0.00
0.09
Enterprise Server (16s)
0.04 2.19
3.05
0.04
Average
2012.77
90th %tile
0.15
0.07
0.07
Reported Throughput:
Response Time (in seconds)
Numerical Quantities Summary
ES7000 Model 7600R
0.48
Report Date
TPC-E 1.9.0
0.10
November 2, 2009
0.02 2.02
8.50
Maximum
1,025,000
November 2009 TPC BenchmarkTM E Report vi

Table of Contents
Abstract ..................................................................................................... iii
Overview................................................................................................... iii
Table of Contents..................................................................................... vii
Figures ...................................................................................................... ix
Tables........................................................................................................ xi
PrefaceDocument Structure ........................................................................... xiiiTPC BenchmarkTM E Overview....................................................... xiii
Clause 1: General Items1.1. Order and Titles .......................................................................... 1-11.2. Executive Summary Statement ................................................... 1-11.3. Benchmark Sponsor .................................................................... 1-11.4. Configuration Diagrams.............................................................. 1-11.5. Hardware Configuration ............................................................. 1-31.6. Software Configuration............................................................... 1-4
Clause 2: Database Design, Scaling & Population2.1. Physical Database Creation......................................................... 2-12.2. Physical Database Organization.................................................. 2-12.3. Table and Row Partitioning ........................................................ 2-22.4. Replications, Duplications, or Additions .................................... 2-22.5. Initial Cardinality of Tables ........................................................ 2-22.6. Disk Configuration Data ............................................................. 2-42.7. Database Interface..................................................................... 2-10
Clause 3: Transaction Related Items3.1. Code Functionality...................................................................... 3-13.2. Database Requirements............................................................... 3-1
Clause 4: SUT, Driver, and Network Items4.1. Network Configurations.............................................................. 4-1
Clause 5: EGen Items5.1. EGen Version.............................................................................. 5-15.2. EGen Code .................................................................................. 5-15.3. EGen Modifications .................................................................... 5-15.4. EGenLoader Extension Code...................................................... 5-15.5. EGenLoader Make/Project Files ................................................. 5-1
November 2009 TPC BenchmarkTM E Report vii

Clause 6: Performance Metrics & Response Time6.1. EGenDriver Instances ................................................................. 6-16.2. Measured Throughput (tpsE) ...................................................... 6-16.3. Test Run Times/Steady State Measurement ............................... 6-16.4. Work Measurements (Test Run) ................................................. 6-26.5. Transaction Report (Averages) ................................................... 6-3
Clause 7: Transaction and System Properties7.1. Transaction System Properties (ACID) ...................................... 7-17.2. Redundancy Level....................................................................... 7-17.3. Data Accessibility Graph ............................................................ 7-27.4. Business Recovery Tests............................................................. 7-27.5. Business Recovery Time............................................................. 7-3
Clause 8: Pricing8.1. 60-Day Space .............................................................................. 8-18.2. Attestation Letter......................................................................... 8-2
Clause 9: Supporting Files9.0. Supporting Files Index Table...................................................... 9-19.1. Supporting Files .......................................................................... 9-9
Appendix A - Third Party Price Quotations
November 2009 TPC BenchmarkTM E Report viii

Figures
Figure 1-1: Benchmarked Configuration................................................. 1-2
Figure 1-2: Priced Configuration............................................................. 1-2
Figure 1.3: ES7000 Model 7600R Server Layout ................................... 1-3
Figure 6.1: Test Run Graph .................................................................... 6-2
Figure 7-2: Data Accessibility Test Run.................................................. 7-2
Figure 7-2: Business Recovery Time....................................................... 7-3
Figure 8-1: Disk Space Requirements ..................................................... 8-1
November 2009 TPC BenchmarkTM E Report ix

November 2009 TPC BenchmarkTM E Report x

Tables
Table 2.1: Physical Database Organization ............................................. 2-1
Table 2.2: Initial Cardinality of Database................................................ 2-3
Table 2.3: Disk Rack Configuration ........................................................ 2-4
Table 2.3: Disk Rack Configuration (cont.) ............................................ 2-5
Table 2.3: Disk Rack Configuration (cont.) ............................................ 2-6
Table 2.3: Disk Rack Configuration (cont.) ............................................ 2-7
Table 2.3: Disk Rack Configuration (cont.) ............................................ 2-8
Table 2.3: Disk Rack Configuration (cont.) ............................................ 2-9
Table 2.3: Disk Rack Configuration (cont.) .......................................... 2-10
Table 6.3: Transaction Parameters (Averages)........................................ 6-3
Table 9.1: Index of Supporting Files ....................................................... 9-1
Table 9.1: Index of Supporting Files (cont.)............................................ 9-2
Table 9.1: Index of Supporting Files (cont.)............................................ 9-3
Table 9.1: Index of Supporting Files (cont.)............................................ 9-4
Table 9.1: Index of Supporting Files (cont.)............................................ 9-5
Table 9.1: Index of Supporting Files (cont.)............................................ 9-6
Table 9.1: Index of Supporting Files (cont.)............................................ 9-7
Table 9.1: Index of Supporting Files (cont.)............................................ 9-8
Table 9.1: Index of Supporting Files (cont.)............................................ 9-9
November 2009 TPC BenchmarkTM E Report xi

November 2009 TPC BenchmarkTM E Report xii

Preface
Document Structure
The TPC BenchmarkTM E Standard Specification requires test sponsors to publish, submit to the TPC, and make available to the public, a full disclosure report for any result to be considered compliant with the specification. The required contents of the full disclosure report are specified in Clause 9.
This report is submitted to satisfy the specification's requirement for full disclosure. It documents the compliance of the benchmark implementation and execution reported for the Unisys ES7000 Model 7600R Enterprise Server (16s) using Microsoft SQL Server 2008 R2 Datacenter Edition on Microsoft Windows Server 2008 R2 Datacenter Edition.
TPC BenchmarkTM E Overview
The Transaction Processing Performance Council (TPC) developed The TPC BenchmarkTM E Standard Specification Revision 1.9.0. It is the intent of the TPC to develop a suite of benchmarks to measure the performance of computer systems executing a wide range of applications. Unisys and Microsoft Corporations are active participants in the TPC to define and develop such a suite of benchmarks.
TPC BenchmarkTM E (TPC-E) is an online Transaction Processing (OLTP) workload. It is a mixture of read-only and update intensive transactions that simulate the activities found in complex OLTP application environments. The benchmark exercises a breadth of system components associated with such environments, which are characterized by:
• The simultaneous execution of multiple transaction types that span a breadth of complexity; • Moderate system and application execution time; • A balanced mixture of disk input/output and processor usage; • Transaction integrity (ACID properties); • A mixture of uniform and non-uniform data access through primary and secondary keys; • Databases consisting of many tables with a wide variety of sizes, attributes, and relationships with
realistic content; • Contention on data access and update. The TPC-E benchmark simulates the OLTP workload of a brokerage firm. The focus of the benchmark is the central database that exercises transactions related to the firm’s customer accounts. In keeping with the goal of measuring the performance characteristics of the database system, the benchmark does not attempt to measure the complex flow of data between multiple application systems that would exist in a real environment.
The mixture and variety of transactions being executed on the benchmark system is designed to capture the characteristic components of a complex system. Different transaction types are defined to simulate the interactions of the firm with its customers as well as its business partners. Different transaction types have varying run-time requirements.
November 2009 TPC BenchmarkTM E Report xiii

November 2009 TPC BenchmarkTM E Report xiv

Clause 1: General Items
1.1. Order and Titles
The order and titles of sections in the Report and Supporting Files must correspond with the order and titles of sections from the TPC-E Standard Specification (i.e., this document). The intent is to make it as easy as possible for readers to compare and contrast material in the different Reports. (9.1.1.1)
The order and titles of the sections in this report correspond with those from the TPC-E standard specification.
1.2. Executive Summary Statement
The TPC Executive Summary Statement must be included near the beginning of the Report. (9.2) The schema of the ES.xml document is defined by the XML schema document tpce-es.xsd (available from www.tpc.org). The ES.xml file must conform to the tpce-es.xsd (established by XML schema validation). (9.2.3.1)
The TPC Executive Summary Statement is included in the ExecutiveSummaryStatement folder. The TPC Executive Summary Statement is located near the beginning of this report.
The ES.xml file conforms to the tpce-es-xsd specification and is included in the ExecutiveSummaryStatement folder.
1.3. Benchmark Sponsor
A statement identifying the benchmark sponsor(s) and other participating companies must be reported in the Report. (9.3.1.1)
Unisys Corporation sponsored this TPC benchmarkTM E. Microsoft and Unisys developed the benchmark test. The benchmark was conducted at Unisys, Mission Viejo, California.
1.4. Configuration Diagrams
Diagrams of both the Measured and Priced Configurations must be reported in the Report, accompanied by a description of the differences. This includes, but is not limited to: (9.3.1.2)(9.3.1.3)
o Number and type of processors, number of cores, and number of threads.o Size of allocated memory, and any specific mapping/partitioning of memory unique to the test.o Number and type of disk units (and controllers, if applicable).o Number of channels or bus connections to disk units, including their protocol type.o Number of LAN (e.g., Ethernet) connections, including routers, workstations, etc., that were
physically used in the test or are incorporated into the pricing structure.o Type and the run-time execution location of software components (e.g., DBMS, client,
processes, transaction monitors, software drivers, etc.). The Benchmarked Configuration of the drivers and Unisys ES7000 Model 7600R Enterprise Server (16s) is illustrated in Figure 1.1. The Priced Configuration is shown in Figure 1.2. Table 2.3 contains a detailed description of the disk configuration.
November 2009 TPC BenchmarkTM E Report 1-1

Figure 1-1: Benchmarked Configuration
Figure 1-2: Priced Configuration
4 Driver Machines
StorageRTS 4200 RAID Storage 540 x 73GB (Style 1)330 x 73GB (Style 2)12 x 146GB External Fibre Channel disks,21 x FC (Style 1)10 x FC (Style 2)External RAID controllers
ServerES7000 Model 7600R16 x Intel® Hex-core Xeon™X7460 2.66GHz w/ 16MB L3 cache, 1 TB memory,2 x 73GB SAS disk, internal ,1 x PCI SAS RAID cntrl, internal,15 x PCI Fibre Channel cntrls,8 Inbuilt 1Gb Eth. cntrls. (2 used).
Client ES3000 Model 3560R 2 x Intel® Quad-core Xeon™E5520 2.26GHz w/ 8MB smart cache,6 GB memory, 1 x 73GB internal disk,4 Inbuilt 1Gb Eth. cntrls.
1GbEthernet
4
SUT
ES3000
Tier A Tier B
(Lo g)
ES7000
4
(Database)
4Gb FibreChannel RTS 4200 RAID Storage
1Gb Ethernet
29
4 Driver Machines
StorageRTS 4200 RAID Storage 540 x 73GB (Style 1)330 x 73GB (Style 2)12 x 146GB External Fibre Channel disks,21 x FC (Style 1)10 x FC (Style 2)External RAID controllers
ServerES7000 Model 7600R16 x Intel® Hex-core Xeon™X7460 2.66GHz w/ 16MB L3 cache, 1 TB memory,2 x 73GB SAS disk, internal ,1 x PCI SAS RAID cntrl, internal,15 x PCI Fibre Channel cntrls,8 Inbuilt 1Gb Eth. cntrls. (2 used).
Client ES3000 Model 3560R 2 x Intel® Quad-core Xeon™E5520 2.26GHz w/ 8MB smart cache,6 GB memory, 1 x 73GB internal disk,4 Inbuilt 1Gb Eth. cntrls.
1GbEthernet
4
SUT
ES3000
Tier A
ES3000
Tier A Tier B
(Lo g)
ES7000
4
(Database)
4Gb FibreChannel RTS 4200 RAID Storage
1Gb Ethernet
2929
StorageRTS 4200 RAID Storage870 x 73GB 12 x 146GB External Fibre Channel disks,21 x FC (Style 1)10 x FC (Style 2)External RAID controll ers
ClientES3000 Model 3560R2 x Intel® Quad-core Xeon™ E5520 2.26GHz w/ 8MB Smart cache,6 GB memory, 1 x 73GB internal disk,4 Inbuilt 1Gb Eth. cnt rls .
ServerES7000 Model 7600R16 x Intel® Hex-core Xeon™X7460 2.66GHz w/ 16MB L3 cache, 1 TB memory,2 x 73GB SAS disk, internal ,1 x PCI SAS RAID cnt rl , internal, 15 x PCI Fibre Channel cntrls,8 Inbuilt 1Gb Eth. cntrls. (2 used).
SUTTier A Tier B
4Gb Fib reC han nel
(Database)
ES7000
4
(Lo g)
ES3000
1Gb Ethernet
29
StorageRTS 4200 RAID Storage870 x 73GB 12 x 146GB External Fibre Channel disks,21 x FC (Style 1)10 x FC (Style 2)External RAID controll ers
ClientES3000 Model 3560R2 x Intel® Quad-core Xeon™ E5520 2.26GHz w/ 8MB Smart cache,6 GB memory, 1 x 73GB internal disk,4 Inbuilt 1Gb Eth. cnt rls .
ServerES7000 Model 7600R16 x Intel® Hex-core Xeon™X7460 2.66GHz w/ 16MB L3 cache, 1 TB memory,2 x 73GB SAS disk, internal ,1 x PCI SAS RAID cnt rl , internal, 15 x PCI Fibre Channel cntrls,8 Inbuilt 1Gb Eth. cntrls. (2 used).
SUTTier A Tier B
4Gb Fib reC han nel
(Database)
ES7000
4
(Lo g)
ES3000
1Gb Ethernet
2929
November 2009 TPC BenchmarkTM E Report 1-2

1.5. Hardware Configuration
A description of the steps taken to configure all of the hardware must be reported in the Report. Any and all configuration scripts or step by step GUI instructions are reported in the Supporting Files (see Clause 9.4.1.1). The description, scripts and GUI instructions must be sufficient such that a reader knowledgeable of computer systems and the TPC-E specifications could recreate the hardware environment. This includes but is not limited to: (9.3.1.4)
o A description of any firmware updates or patches to the hardware.o A description of any GUI configuration used to configure the system hardware.o A description of exactly how the hardware is combined to create the complete system.o A description of how the hardware components are connected. The description can assume the
reader is knowledgeable of computer systems and the TPC-E specification.
The file HardwareConfiguration.pdf in the SupportingFiles Directory (“Introduction”) contains the hardware configuration used in running these TPC-E tests. It also contains the disk subsystem configuration in the file RAID_Hardware_config.pdf in the DiskSubsystem directory. Figure 1.3 shows the layout of the ES7000 Model 7600R server.
Figure 1.3: ES7000 Model 7600R Server Layout
CEL
L-0 4 x 2.66GHz HC
Xeon Processor MP FC-HBA-DATA3
256GB RAM FC-HBA-LOG-DATA1
CEL
L-1 4 x 2.66GHz HC
Xeon Processor MP FC-HBA-DATA7FC-HBA-DATA6
256GB RAMFC-HBA-DATA5FC-HBA-DATA4
CEL
L-3 4 x 2.66GHz HC
Xeon Processor MP FC-HBA-DATA15
256GB RAM
FC-HBA-DATA14FC-HBA-DATA13FC-HBA-DATA12
FC-HBA-DATA2
CEL
L-2 4 x 2.66GHz HC
Xeon Processor MP FC-HBA-DATA11FC-HBA-DATA10
256GB RAMFC-HBA-DATA9FC-HBA-DATA8
November 2009 TPC BenchmarkTM E Report 1-3

1.6. Software Configuration
A description of the steps taken to configure all software must be reported in the Report. Any and all configuration scripts or step by step GUI instructions are reported in the Supporting Files (see Clause 9.4.1.2). The description, scripts and GUI instructions must be sufficient such that a reader knowledgeable of computer systems and the TPC-E specifications could recreate the software environment. This includes but is not limited to: (9.3.1.5)
o A description of any updates or patches to the software.o A description of any changes to the software.o A description of any GUI configurations used to configure the software.
The file SoftwareConfiguration.pdf in the SupportingFiles Directory (“Introduction”) contains the configuration and system parameters used in running these TPC-E tests. It also contains all the client and server OS and SQL Server tunable parameters.
November 2009 TPC BenchmarkTM E Report 1-4

Clause 2: Database Design, Scaling & Population
2.1. Physical Database Creation
A description of the steps taken to create the database for the Reported Throughput must be reported in the Report. Any and all scripts or step by step GUI instructions are reported in the Supporting Files (see Clause 9.4.2). The description, scripts and GUI instructions must be sufficient such that a reader knowledgeable of database software environments and the TPC-E specification could recreate the database. (9.3.2)
All the steps required to create the database are described in MSTPCE Database Setup Reference.pdf (included in SupportingFiles\Clause2). The Unisys customized scripts are located in Supportingfiles\Clause2\Database. These include:
o Tempdb.sql (used to increase the size of tempdb) o Create_Database.sql (used to create the customer TPCE database) o Backup.sql (used to backup the database once it has been built)o Restore.sql (used to restore the TPCE database from the backup)
2.2. Physical Database Organization
The physical organization of tables and User-Defined Objects, within the database, must be reported in the Report. (9.3.2.1)
The database tables and their corresponding User-Defined Objects were organized into four file groups as shown in Table 2.1 below. The SupportingFiles/Clause2 folder contains the SQL definitions of all the required filegroups, tables and indexes.
Table 2.1: Physical Database Organization
Growing File Group Scaling File Group Fixed File GroupCASH_TRANSACTION ACCOUNT_PERMISSION CHARGE
HOLDING ADDRESS COMMISSION_RATE
HOLDING_HISTORY BROKER EXCHANGE
HOLDING_SUMMARY COMPANY INDUSTRY
SETTLEMENT COMPANY_COMPETITOR SECTOR
TRADE CUSTOMER STATUS_TYPE
TRADE_HISTORY CUSTOMER_ACCOUNT TAXRATE
TRADE_REQUEST CUSTOMER_TAXRATE TRADE_TYPE
DAILY_MARKET ZIP_CODE
FINANCIAL
LAST_TRADE
NEWS_ITEM
NEWS_XREF
SECURITY
WATCH_ITEM
WATCH_LIST
June 2005 TPC BenchmarkTM E Report 2-1

2.3. Table and Row Partitioning
Any horizontal or vertical partitioning of tables and rows in the TPC-E benchmark (see Clause 2.3.3), must be reported in the Report. (9.3.2.2)
No partitioning was done for this implementation.
2.4. Replications, Duplications, or Additions
Replication of tables, if used, must be reported in the Report. (9.3.2.3) Additional and/or duplicate columns in any table must be reported in the Report along with a statement on the impact on performance. (see Clause 2.3.5) (9.3.2.4)
No replications, duplications or additional attributes were used in this implementation.
2.5. Initial Cardinality of Tables
The cardinality (e.g. the number of rows) of each table, as it existed after the database load (see Clause 2.6) must be reported in the Report. (9.3.2.5)
The TPC-E database for this test was configured with 1,025,000 customers. The cardinality of each table in the database is listed in Table 2.2
November 2009 TPC BenchmarkTM E Report 2-2

Table 2.2: Initial Cardinality of Database
Table Rows
CASH_TRANSACTION 16,294,994,199
HOLDING 906,842,419
HOLDING_HISTORY 23,737,047,918
HOLDING_SUMMARY 50,974,251
SETTLEMENT 17,712,000,000
TRADE 17,712,000,000
TRADE_HISTORY 42,508,800,690
TRADE_REQUEST 0
ACCOUNT_PERMISSION 7,277,539
ADDRESS 1,537,504
BROKER 10,250
COMPANY 512,500
COMPANY_COMPETITOR 1,537,500
CUSTOMER 1,025,000
CUSTOMER_ACCOUNT 5,125,000
CUSTOMER_TAXRATE 2,050,000
DAILY_MARKET 916,273,125
FINANCIAL 10,250,000
LAST_TRADE 702,125
NEWS_ITEM 1,025,000
NEWS_XREF 1,025,000
SECURITY 702,125
WATCH_ITEM 102,484,524
WATCH_LIST 1,025,000
CHARGE 15
COMMISSION_RATE 240
EXCHANGE 4
INDUSTRY 102
SECTOR 12
STATUS_TYPE 5
TAXRATE 320
TRADE_TYPE 5 ZIP_CODE 14,741
June 2005 TPC BenchmarkTM E Report 2-3

2.6. Disk Configuration Data
The distribution of tables, partitions and logs across all media must be explicitly depicted for the measured and Priced Configurations. (9.3.2.6)
Table 2.2 lists the distribution of the database over 870 73GB disks for the measured configuration, of which, 540 disks were style RTS4307315-4F and 330 disks were style RTS4307315-4FH. For the Priced configuration, 870 73GB disks were used. The transaction log was distributed over 5 mirrored pairs of 146GB disks for both the priced and measured configurations. The tempdb log was distributed over 1 mirrored pair of 146GB disks for both the priced and measured configurations. In addition, there were two 73GB mirrored disks in the host server containing Microsoft Windows Server 2008 R2 Datacenter Edition and Microsoft SQL Server 2008 R2 Datacenter Edition code and the master database plus the paging file.
Each database disk volume, as seen by the Windows operating system, was configured as a RAID-10 disk array with 6 physical disks. There were a total of 145 such disk volumes. Each disk volume was configured in Windows as three partitions, one for scaling, one for growing, and the last partition was used by the tempdb during the measurements.
Table 2.3: Disk Rack Configuration
Drives
Enclosure modelCell # RAID level
Cell 0 PCI Slot 1 HBA #1 port 1 RTS4200 #1, 2 010 X 146 GB RTS422880
RAID 10C:\Bigdb\dblogs\tpcelog1\ (RAW) 677.93 GB TPCE database Log
12 X 146 GB RTS422880
RAID 10C:\Bigdb\dblogs\tpcelog2\ (NTFS) 133.93 GB Tempdb Log
HBA #1 port 2 RTS4200 #3 26 x 73GB
RTS422880 RAID 10
C:\Bigdb\cabA\Scaling1 (RAW)C:\Bigdb\cabA\Growing1 (RAW)
C:\Bigdb\dbbackups\backupA1 (NTFS)
1.96 GB81.85 GB
116.13 GB
scaling_fggrowing_fg
backup, tempdb, fixed_fg
36 x 73GB
RTS422880 RAID 10
C:\Bigdb\cabA\Scaling2 (RAW)C:\Bigdb\cabA\Growing2 (RAW)
C:\Bigdb\dbbackups\backupA2 (NTFS)
1.96 GB81.85 GB
116.13 GB
scaling_fggrowing_fg
backup, tempdb
46 x 73GB
RTS422880 RAID 10
C:\Bigdb\cabA\Scaling3 (RAW)C:\Bigdb\cabA\Growing3 (RAW)
C:\Bigdb\dbbackups\backupA3 (NTFS)
1.96 GB81.85 GB
116.13 GB
scaling_fggrowing_fg
backup, tempdb
56 x 73GB
RTS422880 RAID 10
C:\Bigdb\cabA\Scaling4 (RAW)C:\Bigdb\cabA\Growing4 (RAW)
C:\Bigdb\dbbackups\backupA4 (NTFS)
1.96 GB81.85 GB
116.13 GB
scaling_fggrowing_fg
backup, tempdb
66 x 73GB
RTS422880 RAID 10
C:\Bigdb\cabA\Scaling5 (RAW)C:\Bigdb\cabA\Growing5 (RAW)
C:\Bigdb\dbbackups\backupA5 (NTFS)
1.96 GB81.85 GB
116.13 GB
scaling_fggrowing_fg
backup, tempdb
PCI Slot 2 HBA #2 port 1 RTS4200 #4 76 x 73GB
RTS422880 RAID 10
C:\Bigdb\cabA\Scaling6(RAW)C:\Bigdb\cabA\Growing6 (RAW)
C:\Bigdb\dbbackups\backupA6 (NTFS)
1.96 GB81.85 GB
116.13 GB
scaling_fggrowing_fg
backup, tempdb
86 x 73GB
RTS422880 RAID 10
C:\Bigdb\cabA\Scaling7 (RAW)C:\Bigdb\cabA\Growing7 (RAW)
C:\Bigdb\dbbackups\backupA7 (NTFS)
1.96 GB81.85 GB
116.13 GB
scaling_fggrowing_fg
backup, tempdb
96 x 73GB
RTS422880 RAID 10
C:\Bigdb\cabA\Scaling8 (RAW)C:\Bigdb\cabA\Growing8 (RAW)
C:\Bigdb\dbbackups\backupA8 (NTFS)
1.96 GB81.85 GB
116.13 GB
scaling_fggrowing_fg
backup, tempdb
106 x 73GB
RTS422880 RAID 10
C:\Bigdb\cabA\Scaling9 (RAW)C:\Bigdb\cabA\Growing9 (RAW)
C:\Bigdb\dbbackups\backupA9 (NTFS)
1.96 GB81.85 GB
116.13 GB
scaling_fggrowing_fg
backup, tempdb
116 x 73GB
RTS422880 RAID 10
C:\Bigdb\cabA\Scaling10 (RAW)C:\Bigdb\cabA\Growing10 (RAW)
C:\Bigdb\dbbackups\backupA10 (NTFS)
1.96 GB81.85 GB
116.13 GB
scaling_fggrowing_fg
backup, tempdb
HBA #2 port 2 RTS4200 #5 126 x 73GB
RTS422880 RAID 10
C:\Bigdb\cabB\Scaling1 (RAW)C:\Bigdb\cabB\Growing1 (RAW)
C:\Bigdb\dbbackups\backupB1 (NTFS)
1.96 GB81.85 GB
116.13 GB
scaling_fggrowing_fg
backup, tempdb
136 x 73GB
RTS422880 RAID 10
C:\Bigdb\cabB\Scaling2 (RAW)C:\Bigdb\cabB\Growing2 (RAW)
C:\Bigdb\dbbackups\backupB2 (NTFS)
1.96 GB81.85 GB
116.13 GB
scaling_fggrowing_fg
backup, tempdb
146 x 73GB
RTS422880 RAID 10
C:\Bigdb\cabB\Scaling3 (RAW)C:\Bigdb\cabB\Growing3 (RAW)
C:\Bigdb\dbbackups\backupB3 (NTFS)
1.96 GB81.85 GB
116.13 GB
scaling_fggrowing_fg
backup, tempdb
156 x 73GB
RTS422880 RAID 10
C:\Bigdb\cabB\Scaling4 (RAW)C:\Bigdb\cabB\Growing4 (RAW)
C:\Bigdb\dbbackups\backupB4 (NTFS)
1.96 GB81.85 GB
116.13 GB
scaling_fggrowing_fg
backup, tempdb
166 x 73GB
RTS422880 RAID 10
C:\Bigdb\cabB\Scaling5 (RAW)C:\Bigdb\cabB\Growing5 (RAW)
C:\Bigdb\dbbackups\backupB5 (NTFS)
1.96 GB81.85 GB
116.13 GB
scaling_fggrowing_fg
backup, tempdb
UseDisk #HBA #Slot #
FileSystem
PartitionController # Size
November 2009 TPC BenchmarkTM E Report 2-4

Table 2.3: Disk Rack Configuration (cont.)
Drives
Enclosure modelCell # RAID level
PCI Slot 3 HBA #3 port 1 RTS4200 #6 176 x 73GB
RTS422880 RAID 10
C:\Bigdb\cabB\Scaling6(RAW)C:\Bigdb\cabB\Growing6 (RAW)
C:\Bigdb\dbbackups\backupB6 (NTFS)
1.96 GB81.85 GB
116.13 GB
scaling_fggrowing_fg
backup, tempdb
186 x 73GB
RTS422880 RAID 10
C:\Bigdb\cabB\Scaling7 (RAW)C:\Bigdb\cabB\Growing7 (RAW)
C:\Bigdb\dbbackups\backupB7 (NTFS)
1.96 GB81.85 GB
116.13 GB
scaling_fggrowing_fg
backup, tempdb
196 x 73GB
RTS422880 RAID 10
C:\Bigdb\cabB\Scaling8 (RAW)C:\Bigdb\cabB\Growing8 (RAW)
C:\Bigdb\dbbackups\backupB8 (NTFS)
1.96 GB81.85 GB
116.13 GB
scaling_fggrowing_fg
backup, tempdb
206 x 73GB
RTS422880 RAID 10
C:\Bigdb\cabB\Scaling9 (RAW)C:\Bigdb\cabB\Growing9 (RAW)
C:\Bigdb\dbbackups\backupB9 (NTFS)
1.96 GB81.85 GB
116.13 GB
scaling_fggrowing_fg
backup, tempdb
216 x 73GB
RTS422880 RAID 10
C:\Bigdb\cabB\Scaling10 (RAW)C:\Bigdb\cabB\Growing10 (RAW)
C:\Bigdb\dbbackups\backupB10 (NTFS)
1.96 GB81.85 GB
116.13 GB
scaling_fggrowing_fg
backup, tempdb
HBA #3 port 2 RTS4200 #7 226 x 73GB
RTS422880 RAID 10
C:\Bigdb\cabC\Scaling1 (RAW)C:\Bigdb\cabC\Growing1 (RAW)
C:\Bigdb\dbbackups\backupC1 (NTFS)
1.96 GB81.85 GB
116.13 GB
scaling_fggrowing_fg
backup, tempdb
236 x 73GB
RTS422880 RAID 10
C:\Bigdb\cabC\Scaling2 (RAW)C:\Bigdb\cabC\Growing2 (RAW)
C:\Bigdb\dbbackups\backupC2 (NTFS)
1.96 GB81.85 GB
116.13 GB
scaling_fggrowing_fg
backup, tempdb
246 x 73GB
RTS422880 RAID 10
C:\Bigdb\cabC\Scaling3 (RAW)C:\Bigdb\cabC\Growing3 (RAW)
C:\Bigdb\dbbackups\backupC3 (NTFS)
1.96 GB81.85 GB
116.13 GB
scaling_fggrowing_fg
backup, tempdb
256 x 73GB
RTS422880 RAID 10
C:\Bigdb\cabC\Scaling4 (RAW)C:\Bigdb\cabC\Growing4 (RAW)
C:\Bigdb\dbbackups\backupC4 (NTFS)
1.96 GB81.85 GB
116.13 GB
scaling_fggrowing_fg
backup, tempdb
266 x 73GB
RTS422880 RAID 10
C:\Bigdb\cabC\Scaling5 (RAW)C:\Bigdb\cabC\Growing5 (RAW)
C:\Bigdb\dbbackups\backupC5 (NTFS)
1.96 GB81.85 GB
116.13 GB
scaling_fggrowing_fg
backup, tempdb
Cell 1 PCI Slot 1 HBA #4 port 1 RTS4200 #8 276 x 73GB
RTS422880 RAID 10
C:\Bigdb\cabC\Scaling6(RAW)C:\Bigdb\cabC\Growing6 (RAW)
C:\Bigdb\dbbackups\backupC6 (NTFS)
1.96 GB81.85 GB
116.13 GB
scaling_fggrowing_fg
backup, tempdb
286 x 73GB
RTS422880 RAID 10
C:\Bigdb\cabC\Scaling7 (RAW)C:\Bigdb\cabC\Growing7 (RAW)
C:\Bigdb\dbbackups\backupC7 (NTFS)
1.96 GB81.85 GB
116.13 GB
scaling_fggrowing_fg
backup, tempdb
296 x 73GB
RTS422880 RAID 10
C:\Bigdb\cabC\Scaling8 (RAW)C:\Bigdb\cabC\Growing8 (RAW)
C:\Bigdb\dbbackups\backupC8 (NTFS)
1.96 GB81.85 GB
116.13 GB
scaling_fggrowing_fg
backup, tempdb
306 x 73GB
RTS422880 RAID 10
C:\Bigdb\cabC\Scaling9 (RAW)C:\Bigdb\cabC\Growing9 (RAW)
C:\Bigdb\dbbackups\backupC9 (NTFS)
1.96 GB81.85 GB
116.13 GB
scaling_fggrowing_fg
backup, tempdb
316 x 73GB
RTS422880 RAID 10
C:\Bigdb\cabC\Scaling10 (RAW)C:\Bigdb\cabC\Growing10 (RAW)
C:\Bigdb\dbbackups\backupC10 (NTFS)
1.96 GB81.85 GB
116.13 GB
scaling_fggrowing_fg
backup, tempdb
HBA #4 port 2 RTS4200 #9 326 x 73GB
RTS422880 RAID 10
C:\Bigdb\cabD\Scaling1 (RAW)C:\Bigdb\cabD\Growing1 (RAW)
C:\Bigdb\dbbackups\backupD1 (NTFS)
1.96 GB81.85 GB
116.13 GB
scaling_fggrowing_fg
backup, tempdb
336 x 73GB
RTS422880 RAID 10
C:\Bigdb\cabD\Scaling2 (RAW)C:\Bigdb\cabD\Growing2 (RAW)
C:\Bigdb\dbbackups\backupD2 (NTFS)
1.96 GB81.85 GB
116.13 GB
scaling_fggrowing_fg
backup, tempdb
346 x 73GB
RTS422880 RAID 10
C:\Bigdb\cabD\Scaling3 (RAW)C:\Bigdb\cabD\Growing3 (RAW)
C:\Bigdb\dbbackups\backupD3 (NTFS)
1.96 GB81.85 GB
116.13 GB
scaling_fggrowing_fg
backup, tempdb
356 x 73GB
RTS422880 RAID 10
C:\Bigdb\cabD\Scaling4 (RAW)C:\Bigdb\cabD\Growing4 (RAW)
C:\Bigdb\dbbackups\backupD4 (NTFS)
1.96 GB81.85 GB
116.13 GB
scaling_fggrowing_fg
backup, tempdb
366 x 73GB
RTS422880 RAID 10
C:\Bigdb\cabD\Scaling5 (RAW)C:\Bigdb\cabD\Growing5 (RAW)
C:\Bigdb\dbbackups\backupD5 (NTFS)
1.96 GB81.85 GB
116.13 GB
scaling_fggrowing_fg
backup, tempdb
PCI Slot 2 HBA #5 port 1 RTS4200 #10 376 x 73GB
RTS422880 RAID 10
C:\Bigdb\cabD\Scaling6(RAW)C:\Bigdb\cabD\Growing6 (RAW)
C:\Bigdb\dbbackups\backupD6 (NTFS)
1.96 GB81.85 GB
116.13 GB
scaling_fggrowing_fg
backup, tempdb
386 x 73GB
RTS422880 RAID 10
C:\Bigdb\cabD\Scaling7 (RAW)C:\Bigdb\cabD\Growing7 (RAW)
C:\Bigdb\dbbackups\backupD7 (NTFS)
1.96 GB81.85 GB
116.13 GB
scaling_fggrowing_fg
backup, tempdb
396 x 73GB
RTS422880 RAID 10
C:\Bigdb\cabD\Scaling8 (RAW)C:\Bigdb\cabD\Growing8 (RAW)
C:\Bigdb\dbbackups\backupD8 (NTFS)
1.96 GB81.85 GB
116.13 GB
scaling_fggrowing_fg
backup, tempdb
Slot # HBA # Controller # Disk #
FileSystem
Partition Size Use
June 2005 TPC BenchmarkTM E Report 2-5

Table 2.3: Disk Rack Configuration (cont.)
Drives
Enclosure modelCell # RAID level
406 x 73GB
RTS422880 RAID 10
C:\Bigdb\cabD\Scaling9 (RAW)C:\Bigdb\cabD\Growing9 (RAW)
C:\Bigdb\dbbackups\backupD9 (NTFS)
1.96 GB81.85 GB
116.13 GB
scaling_fggrowing_fg
backup, tempdb
416 x 73GB
RTS422880 RAID 10
C:\Bigdb\cabD\Scaling10 (RAW)C:\Bigdb\cabD\Growing10 (RAW)
C:\Bigdb\dbbackups\backupD10 (NTFS)
1.96 GB81.85 GB
116.13 GB
scaling_fggrowing_fg
backup, tempdb
HBA #5port 2 RTS4200 #11 426 x 73GB
RTS422880 RAID 10
C:\Bigdb\cabE\Scaling1 (RAW)C:\Bigdb\cabE\Growing1 (RAW)
C:\Bigdb\dbbackups\backupE1 (NTFS)
1.96 GB81.85 GB
116.13 GB
scaling_fggrowing_fg
backup, tempdb
436 x 73GB
RTS422880 RAID 10
C:\Bigdb\cabE\Scaling2 (RAW)C:\Bigdb\cabE\Growing2 (RAW)
C:\Bigdb\dbbackups\backupE2 (NTFS)
1.96 GB81.85 GB
116.13 GB
scaling_fggrowing_fg
backup, tempdb
446 x 73GB
RTS422880 RAID 10
C:\Bigdb\cabE\Scaling3 (RAW)C:\Bigdb\cabE\Growing3 (RAW)
C:\Bigdb\dbbackups\backupE3 (NTFS)
1.96 GB81.85 GB
116.13 GB
scaling_fggrowing_fg
backup, tempdb
456 x 73GB
RTS422880 RAID 10
C:\Bigdb\cabE\Scaling4 (RAW)C:\Bigdb\cabE\Growing4 (RAW)
C:\Bigdb\dbbackups\backupE4 (NTFS)
1.96 GB81.85 GB
116.13 GB
scaling_fggrowing_fg
backup, tempdb
466 x 73GB
RTS422880 RAID 10
C:\Bigdb\cabE\Scaling5 (RAW)C:\Bigdb\cabE\Growing5 (RAW)
C:\Bigdb\dbbackups\backupE5 (NTFS)
1.96 GB81.85 GB
116.13 GB
scaling_fggrowing_fg
backup, tempdb
PCI Slot 3 HBA #6 port 1 RTS4200 #12 476 x 73GB
RTS422880 RAID 10
C:\Bigdb\cabE\Scaling6(RAW)C:\Bigdb\cabE\Growing6 (RAW)
C:\Bigdb\dbbackups\backupE6 (NTFS)
1.96 GB81.85 GB
116.13 GB
scaling_fggrowing_fg
backup, tempdb
486 x 73GB
RTS422880 RAID 10
C:\Bigdb\cabE\Scaling7 (RAW)C:\Bigdb\cabE\Growing7 (RAW)
C:\Bigdb\dbbackups\backupE7 (NTFS)
1.96 GB81.85 GB
116.13 GB
scaling_fggrowing_fg
backup, tempdb
496 x 73GB
RTS422880 RAID 10
C:\Bigdb\cabE\Scaling8 (RAW)C:\Bigdb\cabE\Growing8 (RAW)
C:\Bigdb\dbbackups\backupE8 (NTFS)
1.96 GB81.85 GB
116.13 GB
scaling_fggrowing_fg
backup, tempdb
506 x 73GB
RTS422880 RAID 10
C:\Bigdb\cabE\Scaling9 (RAW)C:\Bigdb\cabE\Growing9 (RAW)
C:\Bigdb\dbbackups\backupE9 (NTFS)
1.96 GB81.85 GB
116.13 GB
scaling_fggrowing_fg
backup, tempdb
516 x 73GB
RTS422880 RAID 10
C:\Bigdb\cabE\Scaling10 (RAW)C:\Bigdb\cabE\Growing10 (RAW)
C:\Bigdb\dbbackups\backupE10 (NTFS)
1.96 GB81.85 GB
116.13 GB
scaling_fggrowing_fg
backup, tempdb
HBA #6 port 2 RTS4200 #13 526 x 73GB
RTS422880 RAID 10
C:\Bigdb\cabF\Scaling1 (RAW)C:\Bigdb\cabF\Growing1 (RAW)
C:\Bigdb\dbbackups\backupF1 (NTFS)
1.96 GB81.85 GB
116.13 GB
scaling_fggrowing_fg
backup, tempdb
536 x 73GB
RTS422880 RAID 10
C:\Bigdb\cabF\Scaling2 (RAW)C:\Bigdb\cabF\Growing2 (RAW)
C:\Bigdb\dbbackups\backupF2 (NTFS)
1.96 GB81.85 GB
116.13 GB
scaling_fggrowing_fg
backup, tempdb
546 x 73GB
RTS422880 RAID 10
C:\Bigdb\cabF\Scaling3 (RAW)C:\Bigdb\cabF\Growing3 (RAW)
C:\Bigdb\dbbackups\backupF3 (NTFS)
1.96 GB81.85 GB
116.13 GB
scaling_fggrowing_fg
backup, tempdb
556 x 73GB
RTS422880 RAID 10
C:\Bigdb\cabF\Scaling4 (RAW)C:\Bigdb\cabF\Growing4 (RAW)
C:\Bigdb\dbbackups\backupF4 (NTFS)
1.96 GB81.85 GB
116.13 GB
scaling_fggrowing_fg
backup, tempdb
566 x 73GB
RTS422880 RAID 10
C:\Bigdb\cabF\Scaling5 (RAW)C:\Bigdb\cabF\Growing5 (RAW)
C:\Bigdb\dbbackups\backupF5 (NTFS)
1.96 GB81.85 GB
116.13 GB
scaling_fggrowing_fg
backup, tempdb
PCI Slot 4 HBA #7 port 1 RTS4200 #14 576 x 73GB
RTS422880 RAID 10
C:\Bigdb\cabF\Scaling6(RAW)C:\Bigdb\cabF\Growing6 (RAW)
C:\Bigdb\dbbackups\backupF6 (NTFS)
1.96 GB81.85 GB
116.13 GB
scaling_fggrowing_fg
backup, tempdb
586 x 73GB
RTS422880 RAID 10
C:\Bigdb\cabF\Scaling7 (RAW)C:\Bigdb\cabF\Growing7 (RAW)
C:\Bigdb\dbbackups\backupF7 (NTFS)
1.96 GB81.85 GB
116.13 GB
scaling_fggrowing_fg
backup, tempdb
596 x 73GB
RTS422880 RAID 10
C:\Bigdb\cabF\Scaling8 (RAW)C:\Bigdb\cabF\Growing8 (RAW)
C:\Bigdb\dbbackups\backupF8 (NTFS)
1.96 GB81.85 GB
116.13 GB
scaling_fggrowing_fg
backup, tempdb
606 x 73GB
RTS422880 RAID 10
C:\Bigdb\cabF\Scaling9 (RAW)C:\Bigdb\cabF\Growing9 (RAW)
C:\Bigdb\dbbackups\backupF9 (NTFS)
1.96 GB81.85 GB
116.13 GB
scaling_fggrowing_fg
backup, tempdb
616 x 73GB
RTS422880 RAID 10
C:\Bigdb\cabF\Scaling10 (RAW)C:\Bigdb\cabF\Growing10 (RAW)
C:\Bigdb\dbbackups\backupF10 (NTFS)
1.96 GB81.85 GB
116.13 GB
scaling_fggrowing_fg
backup, tempdb
HBA #7 port 2 RTS4200 #15 626 x 73GB
RTS422880 RAID 10
C:\Bigdb\cabG\Scaling1 (RAW)C:\Bigdb\cabG\Growing1 (RAW)
C:\Bigdb\dbbackups\backupG1 (NTFS)
1.96 GB81.85 GB
116.13 GB
scaling_fggrowing_fg
backup, tempdb
636 x 73GB
RTS422880 RAID 10
C:\Bigdb\cabG\Scaling2 (RAW)C:\Bigdb\cabG\Growing2 (RAW)
C:\Bigdb\dbbackups\backupG2 (NTFS)
1.96 GB81.85 GB
116.13 GB
scaling_fggrowing_fg
backup, tempdb
FileSystem
Partition Size UseSlot # HBA # Controller # Disk #
November 2009 TPC BenchmarkTM E Report 2-6

Table 2.3: Disk Rack Configuration (cont.)
Drives
Enclosure modelCell # RAID level
646 x 73GB
RTS422880 RAID 10
C:\Bigdb\cabG\Scaling3 (RAW)C:\Bigdb\cabG\Growing3 (RAW)
C:\Bigdb\dbbackups\backupG3 (NTFS)
1.96 GB81.85 GB
116.13 GB
scaling_fggrowing_fg
backup, tempdb
656 x 73GB
RTS422880 RAID 10
C:\Bigdb\cabG\Scaling4 (RAW)C:\Bigdb\cabG\Growing4 (RAW)
C:\Bigdb\dbbackups\backupG4 (NTFS)
1.96 GB81.85 GB
116.13 GB
scaling_fggrowing_fg
backup, tempdb
666 x 73GB
RTS422880 RAID 10
C:\Bigdb\cabG\Scaling5 (RAW)C:\Bigdb\cabG\Growing5 (RAW)
C:\Bigdb\dbbackups\backupG5 (NTFS)
1.96 GB81.85 GB
116.13 GB
scaling_fggrowing_fg
backup, tempdb
Cell 2 PCI Slot 1 HBA #8 port 1 RTS4200 #16 676 x 73GB
RTS422880 RAID 10
C:\Bigdb\cabG\Scaling6(RAW)C:\Bigdb\cabG\Growing6 (RAW)
C:\Bigdb\dbbackups\backupG6 (NTFS)
1.96 GB81.85 GB
116.13 GB
scaling_fggrowing_fg
backup, tempdb
686 x 73GB
RTS422880 RAID 10
C:\Bigdb\cabG\Scaling7 (RAW)C:\Bigdb\cabG\Growing7 (RAW)
C:\Bigdb\dbbackups\backupG7 (NTFS)
1.96 GB81.85 GB
116.13 GB
scaling_fggrowing_fg
backup, tempdb
696 x 73GB
RTS422880 RAID 10
C:\Bigdb\cabG\Scaling8 (RAW)C:\Bigdb\cabG\Growing8 (RAW)
C:\Bigdb\dbbackups\backupG8 (NTFS)
1.96 GB81.85 GB
116.13 GB
scaling_fggrowing_fg
backup, tempdb
706 x 73GB
RTS422880 RAID 10
C:\Bigdb\cabG\Scaling9 (RAW)C:\Bigdb\cabG\Growing9 (RAW)
C:\Bigdb\dbbackups\backupG9 (NTFS)
1.96 GB81.85 GB
116.13 GB
scaling_fggrowing_fg
backup, tempdb
716 x 73GB
RTS422880 RAID 10
C:\Bigdb\cabG\Scaling10 (RAW)C:\Bigdb\cabG\Growing10 (RAW)
C:\Bigdb\dbbackups\backupG10 (NTFS)
1.96 GB81.85 GB
116.13 GB
scaling_fggrowing_fg
backup, tempdb
HBA #8 port 2 RTS4200 #17 726 x 73GB
RTS422880 RAID 10
C:\Bigdb\cabH\Scaling1 (RAW)C:\Bigdb\cabH\Growing1 (RAW)
C:\Bigdb\dbbackups\backupH1 (NTFS)
1.96 GB81.85 GB
116.13 GB
scaling_fggrowing_fg
backup, tempdb
736 x 73GB
RTS422880 RAID 10
C:\Bigdb\cabH\Scaling2 (RAW)C:\Bigdb\cabH\Growing2 (RAW)
C:\Bigdb\dbbackups\backupH2 (NTFS)
1.96 GB81.85 GB
116.13 GB
scaling_fggrowing_fg
backup, tempdb
746 x 73GB
RTS422880 RAID 10
C:\Bigdb\cabH\Scaling3 (RAW)C:\Bigdb\cabH\Growing3 (RAW)
C:\Bigdb\dbbackups\backupH3 (NTFS)
1.96 GB81.85 GB
116.13 GB
scaling_fggrowing_fg
backup, tempdb
756 x 73GB
RTS422880 RAID 10
C:\Bigdb\cabH\Scaling4 (RAW)C:\Bigdb\cabH\Growing4 (RAW)
C:\Bigdb\dbbackups\backupH4 (NTFS)
1.96 GB81.85 GB
116.13 GB
scaling_fggrowing_fg
backup, tempdb
766 x 73GB
RTS422880 RAID 10
C:\Bigdb\cabH\Scaling5 (RAW)C:\Bigdb\cabH\Growing5 (RAW)
C:\Bigdb\dbbackups\backupH5 (NTFS)
1.96 GB81.85 GB
116.13 GB
scaling_fggrowing_fg
backup, tempdb
PCI Slot 2 HBA #9 port 1 RTS4200 #18 776 x 73GB
RTS422880 RAID 10
C:\Bigdb\cabH\Scaling6(RAW)C:\Bigdb\cabH\Growing6 (RAW)
C:\Bigdb\dbbackups\backupH6 (NTFS)
1.96 GB81.85 GB
116.13 GB
scaling_fggrowing_fg
backup, tempdb
786 x 73GB
RTS422880 RAID 10
C:\Bigdb\cabH\Scaling7 (RAW)C:\Bigdb\cabH\Growing7 (RAW)
C:\Bigdb\dbbackups\backupH7 (NTFS)
1.96 GB81.85 GB
116.13 GB
scaling_fggrowing_fg
backup, tempdb
796 x 73GB
RTS422880 RAID 10
C:\Bigdb\cabH\Scaling8 (RAW)C:\Bigdb\cabH\Growing8 (RAW)
C:\Bigdb\dbbackups\backupH8 (NTFS)
1.96 GB81.85 GB
116.13 GB
scaling_fggrowing_fg
backup, tempdb
806 x 73GB
RTS422880 RAID 10
C:\Bigdb\cabH\Scaling9 (RAW)C:\Bigdb\cabH\Growing9 (RAW)
C:\Bigdb\dbbackups\backupH9 (NTFS)
1.96 GB81.85 GB
116.13 GB
scaling_fggrowing_fg
backup, tempdb
816 x 73GB
RTS422880 RAID 10
C:\Bigdb\cabH\Scaling10 (RAW)C:\Bigdb\cabH\Growing10 (RAW)
C:\Bigdb\dbbackups\backupH10 (NTFS)
1.96 GB81.85 GB
116.13 GB
scaling_fggrowing_fg
backup, tempdb
HBA #9 port 2 RTS4200 #19 826 x 73GB
RTS422880 RAID 10
C:\Bigdb\cabI\Scaling1 (RAW)C:\Bigdb\cabI\Growing1 (RAW)
C:\Bigdb\dbbackups\backupI1 (NTFS)
1.96 GB81.85 GB
116.13 GB
scaling_fggrowing_fg
backup, tempdb
836 x 73GB
RTS422880 RAID 10
C:\Bigdb\cabI\Scaling2 (RAW)C:\Bigdb\cabI\Growing2 (RAW)
C:\Bigdb\dbbackups\backupI2 (NTFS)
1.96 GB81.85 GB
116.13 GB
scaling_fggrowing_fg
backup, tempdb
846 x 73GB
RTS422880 RAID 10
C:\Bigdb\cabI\Scaling3 (RAW)C:\Bigdb\cabI\Growing3 (RAW)
C:\Bigdb\dbbackups\backupI3 (NTFS)
1.96 GB81.85 GB
116.13 GB
scaling_fggrowing_fg
backup, tempdb
856 x 73GB
RTS422880 RAID 10
C:\Bigdb\cabI\Scaling4 (RAW)C:\Bigdb\cabI\Growing4 (RAW)
C:\Bigdb\dbbackups\backupI4 (NTFS)
1.96 GB81.85 GB
116.13 GB
scaling_fggrowing_fg
backup, tempdb
866 x 73GB
RTS422880 RAID 10
C:\Bigdb\cabI\Scaling5 (RAW)C:\Bigdb\cabI\Growing5 (RAW)
C:\Bigdb\dbbackups\backupI5 (NTFS)
1.96 GB81.85 GB
116.13 GB
scaling_fggrowing_fg
backup, tempdb
PCI Slot 3 HBA #10 port 1 RTS4200 #20 876 x 73GB
RTS422880 RAID 10
C:\Bigdb\cabI\Scaling6(RAW)C:\Bigdb\cabI\Growing6 (RAW)
C:\Bigdb\dbbackups\backupI6 (NTFS)
1.96 GB81.85 GB
116.13 GB
scaling_fggrowing_fg
backup, tempdb
Slot # HBA # Controller # Disk #
FileSystem
Partition Size Use
June 2005 TPC BenchmarkTM E Report 2-7

Table 2.3: Disk Rack Configuration (cont.)
Drives
Enclosure modelCell # RAID level
886 x 73GB
RTS422880 RAID 10
C:\Bigdb\cabI\Scaling7 (RAW)C:\Bigdb\cabI\Growing7 (RAW)
C:\Bigdb\dbbackups\backupI7 (NTFS)
1.96 GB81.85 GB
116.13 GB
scaling_fggrowing_fg
backup, tempdb
896 x 73GB
RTS422880 RAID 10
C:\Bigdb\cabI\Scaling8 (RAW)C:\Bigdb\cabI\Growing8 (RAW)
C:\Bigdb\dbbackups\backupI8 (NTFS)
1.96 GB81.85 GB
116.13 GB
scaling_fggrowing_fg
backup, tempdb
906 x 73GB
RTS422880 RAID 10
C:\Bigdb\cabI\Scaling9 (RAW)C:\Bigdb\cabI\Growing9 (RAW)
C:\Bigdb\dbbackups\backupI9 (NTFS)
1.96 GB81.85 GB
116.13 GB
scaling_fggrowing_fg
backup, tempdb
916 x 73GB
RTS422880 RAID 10
C:\Bigdb\cabI\Scaling10 (RAW)C:\Bigdb\cabI\Growing10 (RAW)
C:\Bigdb\dbbackups\backupI10 (NTFS)
1.96 GB81.85 GB
116.13 GB
scaling_fggrowing_fg
backup, tempdb
HBA #10 port 2 RTS4200 #21 926 x 73GB
RTS422880 RAID 10
C:\Bigdb\cabJ\Scaling1 (RAW)C:\Bigdb\cabJ\Growing1 (RAW)
C:\Bigdb\dbbackups\backupJ1 (NTFS)
1.96 GB81.85 GB
116.13 GB
scaling_fggrowing_fg
backup, tempdb
936 x 73GB
RTS422880 RAID 10
C:\Bigdb\cabJ\Scaling2 (RAW)C:\Bigdb\cabJ\Growing2 (RAW)
C:\Bigdb\dbbackups\backupJ2 (NTFS)
1.96 GB81.85 GB
116.13 GB
scaling_fggrowing_fg
backup, tempdb
946 x 73GB
RTS422880 RAID 10
C:\Bigdb\cabJ\Scaling3 (RAW)C:\Bigdb\cabJ\Growing3 (RAW)
C:\Bigdb\dbbackups\backupJ3 (NTFS)
1.96 GB81.85 GB
116.13 GB
scaling_fggrowing_fg
backup, tempdb
956 x 73GB
RTS422880 RAID 10
C:\Bigdb\cabJ\Scaling4 (RAW)C:\Bigdb\cabJ\Growing4 (RAW)
C:\Bigdb\dbbackups\backupJ4 (NTFS)
1.96 GB81.85 GB
116.13 GB
scaling_fggrowing_fg
backup, tempdb
966 x 73GB
RTS422880 RAID 10
C:\Bigdb\cabJ\Scaling5 (RAW)C:\Bigdb\cabJ\Growing5 (RAW)
C:\Bigdb\dbbackups\backupJ5 (NTFS)
1.96 GB81.85 GB
116.13 GB
scaling_fggrowing_fg
backup, tempdb
PCI Slot 4 HBA #11 port 1 RTS4200 #22 976 x 73GB
RTS422880 RAID 10
C:\Bigdb\cabJ\Scaling6(RAW)C:\Bigdb\cabJ\Growing6 (RAW)
C:\Bigdb\dbbackups\backupJ6 (NTFS)
1.96 GB81.85 GB
116.13 GB
scaling_fggrowing_fg
backup, tempdb
986 x 73GB
RTS422880 RAID 10
C:\Bigdb\cabJ\Scaling7 (RAW)C:\Bigdb\cabJ\Growing7 (RAW)
C:\Bigdb\dbbackups\backupJ7 (NTFS)
1.96 GB81.85 GB
116.13 GB
scaling_fggrowing_fg
backup, tempdb
996 x 73GB
RTS422880 RAID 10
C:\Bigdb\cabJ\Scaling8 (RAW)C:\Bigdb\cabJ\Growing8 (RAW)
C:\Bigdb\dbbackups\backupJ8 (NTFS)
1.96 GB81.85 GB
116.13 GB
scaling_fggrowing_fg
backup, tempdb
1006 x 73GB
RTS422880 RAID 10
C:\Bigdb\cabJ\Scaling9 (RAW)C:\Bigdb\cabJ\Growing9 (RAW)
C:\Bigdb\dbbackups\backupJ9 (NTFS)
1.96 GB81.85 GB
116.13 GB
scaling_fggrowing_fg
backup, tempdb
1016 x 73GB
RTS422880 RAID 10
C:\Bigdb\cabJ\Scaling10 (RAW)C:\Bigdb\cabJ\Growing10 (RAW)
C:\Bigdb\dbbackups\backupJ10 (NTFS)
1.96 GB81.85 GB
116.13 GB
scaling_fggrowing_fg
backup, tempdb
HBA #11 port 2 RTS4200 #23 1026 x 73GB
RTS422880 RAID 10
C:\Bigdb\cabK\Scaling1 (RAW)C:\Bigdb\cabK\Growing1 (RAW)
C:\Bigdb\dbbackups\backupK1 (NTFS)
1.96 GB81.85 GB
116.13 GB
scaling_fggrowing_fg
backup, tempdb
1036 x 73GB
RTS422880 RAID 10
C:\Bigdb\cabK\Scaling2 (RAW)C:\Bigdb\cabK\Growing2 (RAW)
C:\Bigdb\dbbackups\backupK2 (NTFS)
1.96 GB81.85 GB
116.13 GB
scaling_fggrowing_fg
backup, tempdb
1046 x 73GB
RTS422880 RAID 10
C:\Bigdb\cabK\Scaling3 (RAW)C:\Bigdb\cabK\Growing3 (RAW)
C:\Bigdb\dbbackups\backupK3 (NTFS)
1.96 GB81.85 GB
116.13 GB
scaling_fggrowing_fg
backup, tempdb
1056 x 73GB
RTS422880 RAID 10
C:\Bigdb\cabK\Scaling4 (RAW)C:\Bigdb\cabK\Growing4 (RAW)
C:\Bigdb\dbbackups\backupK4 (NTFS)
1.96 GB81.85 GB
116.13 GB
scaling_fggrowing_fg
backup, tempdb
1066 x 73GB
RTS422880 RAID 10
C:\Bigdb\cabK\Scaling5 (RAW)C:\Bigdb\cabK\Growing5 (RAW)
C:\Bigdb\dbbackups\backupK5 (NTFS)
1.96 GB81.85 GB
116.13 GB
scaling_fggrowing_fg
backup, tempdb
Cell 3 PCI Slot 1 HBA #12 port 1 RTS4200 #24 1076 x 73GB
RTS422880 RAID 10
C:\Bigdb\cabK\Scaling6(RAW)C:\Bigdb\cabK\Growing6 (RAW)
C:\Bigdb\dbbackups\backupK6 (NTFS)
1.96 GB81.85 GB
116.13 GB
scaling_fggrowing_fg
backup, tempdb
1086 x 73GB
RTS422880 RAID 10
C:\Bigdb\cabK\Scaling7 (RAW)C:\Bigdb\cabK\Growing7 (RAW)
C:\Bigdb\dbbackups\backupK7 (NTFS)
1.96 GB81.85 GB
116.13 GB
scaling_fggrowing_fg
backup, tempdb
1096 x 73GB
RTS422880 RAID 10
C:\Bigdb\cabK\Scaling8 (RAW)C:\Bigdb\cabK\Growing8 (RAW)
C:\Bigdb\dbbackups\backupK8 (NTFS)
1.96 GB81.85 GB
116.13 GB
scaling_fggrowing_fg
backup, tempdb
1106 x 73GB
RTS422880 RAID 10
C:\Bigdb\cabK\Scaling9 (RAW)C:\Bigdb\cabK\Growing9 (RAW)
C:\Bigdb\dbbackups\backupK9 (NTFS)
1.96 GB81.85 GB
116.13 GB
scaling_fggrowing_fg
backup, tempdb
FileSystem
Partition Size UseSlot # HBA # Controller # Disk #
November 2009 TPC BenchmarkTM E Report 2-8

Table 2.3: Disk Rack Configuration (cont.)
Drives
Enclosure modelCell # RAID level
1116 x 73GB
RTS422880 RAID 10
C:\Bigdb\cabK\Scaling10 (RAW)C:\Bigdb\cabK\Growing10 (RAW)
C:\Bigdb\dbbackups\backupK10 (NTFS)
1.96 GB81.85 GB
116.13 GB
scaling_fggrowing_fg
backup, tempdb
HBA #12 port 2 RTS4200 #25 1126 x 73GB
RTS422880 RAID 10
C:\Bigdb\cabL\Scaling1 (RAW)C:\Bigdb\cabL\Growing1 (RAW)
C:\Bigdb\dbbackups\backupL1 (NTFS)
1.96 GB81.85 GB
116.13 GB
scaling_fggrowing_fg
backup, tempdb
1136 x 73GB
RTS422880 RAID 10
C:\Bigdb\cabL\Scaling2 (RAW)C:\Bigdb\cabL\Growing2 (RAW)
C:\Bigdb\dbbackups\backupL2 (NTFS)
1.96 GB81.85 GB
116.13 GB
scaling_fggrowing_fg
backup, tempdb
1146 x 73GB
RTS422880 RAID 10
C:\Bigdb\cabL\Scaling3 (RAW)C:\Bigdb\cabL\Growing3 (RAW)
C:\Bigdb\dbbackups\backupL3 (NTFS)
1.96 GB81.85 GB
116.13 GB
scaling_fggrowing_fg
backup, tempdb
1156 x 73GB
RTS422880 RAID 10
C:\Bigdb\cabL\Scaling4 (RAW)C:\Bigdb\cabL\Growing4 (RAW)
C:\Bigdb\dbbackups\backupL4 (NTFS)
1.96 GB81.85 GB
116.13 GB
scaling_fggrowing_fg
backup, tempdb
1166 x 73GB
RTS422880 RAID 10
C:\Bigdb\cabL\Scaling5 (RAW)C:\Bigdb\cabL\Growing5 (RAW)
C:\Bigdb\dbbackups\backupL5 (NTFS)
1.96 GB81.85 GB
116.13 GB
scaling_fggrowing_fg
backup, tempdb
PCI Slot 2 HBA #13 port 1 RTS4200 #26 1176 x 73GB
RTS422880 RAID 10
C:\Bigdb\cabL\Scaling6(RAW)C:\Bigdb\cabL\Growing6 (RAW)
C:\Bigdb\dbbackups\backupL6 (NTFS)
1.96 GB81.85 GB
116.13 GB
scaling_fggrowing_fg
backup, tempdb
1186 x 73GB
RTS422880 RAID 10
C:\Bigdb\cabL\Scaling7 (RAW)C:\Bigdb\cabL\Growing7 (RAW)
C:\Bigdb\dbbackups\backupL7 (NTFS)
1.96 GB81.85 GB
116.13 GB
scaling_fggrowing_fg
backup, tempdb
1196 x 73GB
RTS422880 RAID 10
C:\Bigdb\cabL\Scaling8 (RAW)C:\Bigdb\cabL\Growing8 (RAW)
C:\Bigdb\dbbackups\backupL8 (NTFS)
1.96 GB81.85 GB
116.13 GB
scaling_fggrowing_fg
backup, tempdb
1206 x 73GB
RTS422880 RAID 10
C:\Bigdb\cabL\Scaling9 (RAW)C:\Bigdb\cabL\Growing9 (RAW)
C:\Bigdb\dbbackups\backupL9 (NTFS)
1.96 GB81.85 GB
116.13 GB
scaling_fggrowing_fg
backup, tempdb
1216 x 73GB
RTS422880 RAID 10
C:\Bigdb\cabL\Scaling10 (RAW)C:\Bigdb\cabL\Growing10 (RAW)
C:\Bigdb\dbbackups\backupL10 (NTFS)
1.96 GB81.85 GB
116.13 GB
scaling_fggrowing_fg
backup, tempdb
HBA #13 port 2 RTS4200 #27 1226 x 73GB
RTS422880 RAID 10
C:\Bigdb\cabM\Scaling1 (RAW)C:\Bigdb\cabM\Growing1 (RAW)
C:\Bigdb\dbbackups\backupM1 (NTFS)
1.96 GB81.85 GB
116.13 GB
scaling_fggrowing_fg
backup, tempdb
1236 x 73GB
RTS422880 RAID 10
C:\Bigdb\cabM\Scaling2 (RAW)C:\Bigdb\cabM\Growing2 (RAW)
C:\Bigdb\dbbackups\backupM2 (NTFS)
1.96 GB81.85 GB
116.13 GB
scaling_fggrowing_fg
backup, tempdb
1246 x 73GB
RTS422880 RAID 10
C:\Bigdb\cabM\Scaling3 (RAW)C:\Bigdb\cabM\Growing3 (RAW)
C:\Bigdb\dbbackups\backupM3 (NTFS)
1.96 GB81.85 GB
116.13 GB
scaling_fggrowing_fg
backup, tempdb
1256 x 73GB
RTS422880 RAID 10
C:\Bigdb\cabM\Scaling4 (RAW)C:\Bigdb\cabM\Growing4 (RAW)
C:\Bigdb\dbbackups\backupM4 (NTFS)
1.96 GB81.85 GB
116.13 GB
scaling_fggrowing_fg
backup, tempdb
1266 x 73GB
RTS422880 RAID 10
C:\Bigdb\cabM\Scaling5 (RAW)C:\Bigdb\cabM\Growing5 (RAW)
C:\Bigdb\dbbackups\backupM5 (NTFS)
1.96 GB81.85 GB
116.13 GB
scaling_fggrowing_fg
backup, tempdb
PCI Slot 3 HBA #14 port 1 RTS4200 #28 1276 x 73GB
RTS422880 RAID 10
C:\Bigdb\cabM\Scaling6(RAW)C:\Bigdb\cabM\Growing6 (RAW)
C:\Bigdb\dbbackups\backupM6 (NTFS)
1.96 GB81.85 GB
116.13 GB
scaling_fggrowing_fg
backup, tempdb
1286 x 73GB
RTS422880 RAID 10
C:\Bigdb\cabM\Scaling7 (RAW)C:\Bigdb\cabM\Growing7 (RAW)
C:\Bigdb\dbbackups\backupM7 (NTFS)
1.96 GB81.85 GB
116.13 GB
scaling_fggrowing_fg
backup, tempdb
1296 x 73GB
RTS422880 RAID 10
C:\Bigdb\cabM\Scaling8 (RAW)C:\Bigdb\cabM\Growing8 (RAW)
C:\Bigdb\dbbackups\backupM8 (NTFS)
1.96 GB81.85 GB
116.13 GB
scaling_fggrowing_fg
backup, tempdb
1306 x 73GB
RTS422880 RAID 10
C:\Bigdb\cabM\Scaling9 (RAW)C:\Bigdb\cabM\Growing9 (RAW)
C:\Bigdb\dbbackups\backupM9 (NTFS)
1.96 GB81.85 GB
116.13 GB
scaling_fggrowing_fg
backup, tempdb
1316 x 73GB
RTS422880 RAID 10
C:\Bigdb\cabM\Scaling10 (RAW)C:\Bigdb\cabM\Growing10 (RAW)
C:\Bigdb\dbbackups\backupM10 (NTFS)
1.96 GB81.85 GB
116.13 GB
scaling_fggrowing_fg
backup, tempdb
HBA #14 port 2 RTS4200 #29 1326 x 73GB
RTS422880 RAID 10
C:\Bigdb\cabN\Scaling1 (RAW)C:\Bigdb\cabN\Growing1 (RAW)
C:\Bigdb\dbbackups\backupN1 (NTFS)
1.96 GB81.85 GB
116.13 GB
scaling_fggrowing_fg
backup, tempdb
1336 x 73GB
RTS422880 RAID 10
C:\Bigdb\cabN\Scaling2 (RAW)C:\Bigdb\cabN\Growing2 (RAW)
C:\Bigdb\dbbackups\backupN2 (NTFS)
1.96 GB81.85 GB
116.13 GB
scaling_fggrowing_fg
backup, tempdb
1346 x 73GB
RTS422880 RAID 10
C:\Bigdb\cabN\Scaling3 (RAW)C:\Bigdb\cabN\Growing3 (RAW)
C:\Bigdb\dbbackups\backupN3 (NTFS)
1.96 GB81.85 GB
116.13 GB
scaling_fggrowing_fg
backup, tempdb
Slot # HBA # Controller # Disk #
FileSystem
Partition Size Use
June 2005 TPC BenchmarkTM E Report 2-9

Table 2.3: Disk Rack Configuration (cont.)
2.7. Database Interface
A statement must be provided in the Report that describes:
o The Database Interface (e.g. embedded, call level) and access language (e.g. SQL, COBOL, read/write) used to implement TPC-E transactions. If more than one interface/access language is used to implement TPC-E, each interface/access language must be described and a list of which interface/access language is used with which Transaction type must be reported.
o The data model implemented by the DBMS (e.g. relational, network, hierarchical). (9.3.2.7). The methodology used to load the database must be reported. (9.3.2.8) Microsoft SQL Server 2008 R2 is a relational database. The client software interfaced to SQL Server through Stored Procedures invoked through ODBC calls embedded in the C++ application code.
The methodology used to load the database used the flat files option on the EGenLoader command line. This generates flat files then a bulk insert of the data into the tables. For a more detailed description, refer to Clause2 of the SupportingFiles directory (MSTPCE Database Setup Steps.pdf)
DrivesEnclosure model
Cell # RAID level
1356 x 73GB
RTS422880 RAID 10
C:\Bigdb\cabN\Scaling4 (RAW)C:\Bigdb\cabN\Growing4 (RAW)
C:\Bigdb\dbbackups\backupN4 (NTFS)
1.96 GB81.85 GB
116.13 GB
scaling_fggrowing_fg
backup, tempdb
1366 x 73GB
RTS422880 RAID 10
C:\Bigdb\cabN\Scaling5 (RAW)C:\Bigdb\cabN\Growing5 (RAW)
C:\Bigdb\dbbackups\backupN5 (NTFS)
1.96 GB81.85 GB
116.13 GB
scaling_fggrowing_fg
backup, tempdb
PCI Slot 4 HBA #15 port 1 RTS4200 #30 1376 x 73GB
RTS422880 RAID 10
C:\Bigdb\cabN\Scaling6(RAW)C:\Bigdb\cabN\Growing6 (RAW)
C:\Bigdb\dbbackups\backupN6 (NTFS)
1.96 GB81.85 GB
116.13 GB
scaling_fggrowing_fg
backup, tempdb
1386 x 73GB
RTS422880 RAID 10
C:\Bigdb\cabN\Scaling7 (RAW)C:\Bigdb\cabN\Growing7 (RAW)
C:\Bigdb\dbbackups\backupN7 (NTFS)
1.96 GB81.85 GB
116.13 GB
scaling_fggrowing_fg
backup, tempdb
1396 x 73GB
RTS422880 RAID 10
C:\Bigdb\cabN\Scaling8 (RAW)C:\Bigdb\cabN\Growing8 (RAW)
C:\Bigdb\dbbackups\backupN8 (NTFS)
1.96 GB81.85 GB
116.13 GB
scaling_fggrowing_fg
backup, tempdb
1406 x 73GB
RTS422880 RAID 10
C:\Bigdb\cabN\Scaling9 (RAW)C:\Bigdb\cabN\Growing9 (RAW)
C:\Bigdb\dbbackups\backupN9 (NTFS)
1.96 GB81.85 GB
116.13 GB
scaling_fggrowing_fg
backup, tempdb
1416 x 73GB
RTS422880 RAID 10
C:\Bigdb\cabN\Scaling10 (RAW)C:\Bigdb\cabN\Growing10 (RAW)
C:\Bigdb\dbbackups\backupN10 (NTFS)
1.96 GB81.85 GB
116.13 GB
scaling_fggrowing_fg
backup, tempdb
HBA #15 port 2 RTS4200 #31 1426 x 73GB
RTS422880 RAID 10
C:\Bigdb\cabO\Scaling1 (RAW)C:\Bigdb\cabO\Growing1 (RAW)
C:\Bigdb\dbbackups\backupO1 (NTFS)
1.96 GB81.85 GB
116.13 GB
scaling_fggrowing_fg
backup, tempdb
1436 x 73GB
RTS422880 RAID 10
C:\Bigdb\cabO\Scaling2 (RAW)C:\Bigdb\cabO\Growing2 (RAW)
C:\Bigdb\dbbackups\backupO2 (NTFS)
1.96 GB81.85 GB
116.13 GB
scaling_fggrowing_fg
backup, tempdb
1446 x 73GB
RTS422880 RAID 10
C:\Bigdb\cabO\Scaling3 (RAW)C:\Bigdb\cabO\Growing3 (RAW)
C:\Bigdb\dbbackups\backupO3 (NTFS)
1.96 GB81.85 GB
116.13 GB
scaling_fggrowing_fg
backup, tempdb
1456 x 73GB
RTS422880 RAID 10
C:\Bigdb\cabO\Scaling4 (RAW)C:\Bigdb\cabO\Growing4 (RAW)
C:\Bigdb\dbbackups\backupO4 (NTFS)
1.96 GB81.85 GB
116.13 GB
scaling_fggrowing_fg
backup, tempdb
1466 x 73GB
RTS422880 RAID 10
C:\Bigdb\cabO\Scaling5 (RAW)C:\Bigdb\cabO\Growing5 (RAW)
C:\Bigdb\dbbackups\backupO5 (NTFS)
1.96 GB81.85 GB
116.13 GB
scaling_fggrowing_fg
backup, tempdb
FileSystem
Partition Size UseSlot # HBA # Controller # Disk #
November 2009 TPC BenchmarkTM E Report 2-10

Clause 3: Transaction Related Items
3.1. Code Functionality
A statement that vendor-supplied code is functionally equivalent to Pseudo-code in the specification (see Clause 3.2.1.6) must be reported in the Report. (9.3.3.1)
Secondary sponsor-supplied code is functionally equivalent to the Pseudo-code in the specification.
3.2. Database Requirements
A statement that the database footprint requirements (as described in Clause 3.3) were met must be reported in the Report. (9.3.3.2)
The database footprint requirements were met.
November 2009 TPC BenchmarkTM E Report 3-1

November 2009 TPC BenchmarkTM E Report 3-2

Clause 4: SUT, Driver, and Network Items
4.1. Network Configurations
The Network configurations of both the measured and Priced Configurations must be described and reported in the Report. This includes the mandatory Network between the Driver and Tier A (see Clause 4.2.2) and any optional Database Server interface networks (see Clause 4.1.3.12). (9.3.4.1).
Figures 1.1 and 1.2 in Clause 1 of this report diagram the network configurations of the measured and priced configurations and represent the drivers connected via LAN replacing the user PCs that are directly connected via LAN. Network measured and priced configuarations are the same.
Local area networks (LANs) were used in the configurations. The database server contained eight (8) 1 gigabit-per-second LAN adapters of which two (2) were used. Tier A contained four (4) 1 gigabit-per-second inbuilt LAN controllers. The Tier A client was directly connected to the Tier B database server through two (2) 1 gigabit-per-second connetions. The Tier A client and the driver systems were connected through a 1 gigabit-per-second switch.
November 2009 TPC BenchmarkTM E Report 4-1

November 2009 TPC BenchmarkTM E Report 4-2

Clause 5: EGen Items
5.1. EGen Version
The version of EGen used in the benchmark must be reported in the Report (see Clause 5.3.1). (9.3.5.1) The EGen version used in this test was 1.9.0.
5.2. EGen Code
A statement that all required TPC-provided EGen code was used in the benchmark must be reported in the Report. (9.3.5.2)
All required TPC-provided EGen code was used in the benchmark.
5.3. EGen Modifications
If the Test Sponsor modified the EGen, a statement EGen has been modified must be reported in the Report. all formal waivers from the TPC documenting the allowed changes to EGen must also be reported in the Report (see Clause 5.3.7.1). If any of the changes to EGen do not have a formal waiver, that must also be reported in the Report. (9.3.5.3)
No modifications were made to EGen.
5.4. EGenLoader Extension Code
If the Test Sponsor extended EGenLoader (as described in Appendix A.6), the use of the extended EGenLoader and the audit of the extended code by an Auditor must be reported in the Report (see Clause 5.7.4). (9.3.5.4)
No extensions were made to the EGenLoader for this test.
5.5. EGenLoader Make/Project Files
The make/project files used to compile/link EGenLoader and EGen Validate must be reported in the Supporting Files. The compiler/linker options and flags used to compile/link EGen Objects for the SUT must be reported in the Supporting Files. (9.3.5.5)
The project files (and solution file) for EGen are located in the “SupportingFiles\Clause3\prj\VS2008\” folder. The project files (and solution file) for the SUT CE_Server are located in the SupportingFiles\Clause3\SUT_CE_Server\ folder. The project files (and solution file) for the SUT MEE_Server are located in the SupportingFiles\Clause3\SUT_MEE_Server\ folder.
November 2009 TPC BenchmarkTM E Report 5-1

November 2009 TPC BenchmarkTM E Report 5-2

Clause 6: Performance Metrics & Response Time
6.1. EGenDriver Instances
The number of EGenDriverMEE and EGenDriverCE instances used in the benchmark must be reported in the Report. (see Clause 6.2.5) (9.3.6.1)
There were 16 EGenDriverMEEs with a dynamic number of instances and 16 EGenDriverCEs with a total of 1745 instances used in this benchmark run.
6.2. Measured Throughput (tpsE)
The Measured Throughput must be reported in the Report. (see Clause 6.7.1.2) (9.3.6.2) The measured tpsE was 2012.77.
6.3. Test Run Times/Steady State Measurement
A Test Run Graph of throughput versus elapsed wall clock time must be reported in the Report for the Trade-Result Transaction (see Clause 6.7.2). (9.3.6.3)
The method used to determine that the SUT had reached a Steady State prior to commencing the Measurement Interval must be reported in the Report. (9.3.6.4)
The transaction throughput rate (tpsE) and response time were relatively constant after the initial ramp-up period. The throughput and response time behavior were determined by examining data reported for each 60-second interval over the duration of the benchmark. Ramp-up and steady state are discernible in the graph presented in Figure 6.1
After the run, Steady State was confirmed by:
• Looking at the Test Run Graph and verifying that tpsE was steady prior to commencing the Measurement Interval.
• Calculated 60-minute average tpsE during the Steady State moving the time window 10 minutes each time. Then confirmed that the minimum 60-minute average tpsE was not less than 98% of the Reported Throughput, and that the maximum 60-minute average tpsE was not greater than 102% of the Reported Throughput.
• Calculated 10-minute average tpsE during the Steady State moving the window 1 minute each time. Then confirmed that the minimum 10-minute average tpsE was not less than 80% of the Reported Throughput, and the maximum 10-minute average tpsE was not greater than 120% of the Reported Throughput.
November 2009 TPC BenchmarkTM E Report 6-1

Figure 6.1: Test Run Graph
6.4. Work Measurements (Test Run)
A description of how the work normally performed during a Test Run, actually occurred during the Measurement Interval must be reported in the Report (for example checkpointing, writing Undo/Redo Log, etc.). (9.3.6.5)
The driver engines generated the required transactions and their input data. This data was timestamped. The response for the requested transaction was verified and time-stamped in the driver log files. Each driver engine maintains its own log file. Log file contents are consolidated for the reports.
The driver engines transactions were sent to the SUT processes running on the Tier A machines through Ethernet LANs. These Tier A SUT processes handled all requests to the database on the server. The SUT processes communicated with the database server over a TCP/IP network using Microsoft SQL Server ODBC library and RPC calls.
To perform checkpoints at specific intervals, the SQL Server recovery interval was set to 32767. Continuous checkpoints every 450 seconds were performed during the steady state before and during the measurement interval by a script running on the database server. SQL Server was started with trace flag 3502, which caused it to log the occurrence and duration of the checkpoints. This information was used to verify that the checkpoints occurred at the appropriate times during the test run.
During a checkpoint, SQL Server flushes all dirty pages from its cache to disk. It places a record in the database transaction log indicating that the checkpoint has completed and that all dirty pages for transactions which were committed prior to the checkpoint have been written to disk.
Data Maintenance was run every 60 seconds.
Throughput over Time (Test Run)
0
500
1000
1500
2000
2500
0 20 40 60 80 100 120 140 160 180 200 220
Elapsed Time (minutes)
tpsE
RampUp
MeasurementInterval Start
MeasurementIntervalEnd
Steady State
November 2009 TPC BenchmarkTM E Report 6-2

6.5. Transaction Report (Averages) The recorded averages over the Measurement Interval for each of the Transaction input parameters specified by Clause 6.4.1 must be reported in the Report. (9.3.6.6)
Table 6.3 shows the Transaction Report Averages.
Table 6.3: Transaction Parameters (Averages)
RangeTransaction Overall Parameter Value Check Min Max
Customer Position Ok By Tax ID 50.00% Ok 48.00% 52.00%
Get history 50.00% Ok 48.00% 52.00%
Trade Lookup Ok Frame 1 29.99% Ok 28.50% 31.50%
Frame 2 30.02% Ok 28.50% 31.50%
Frame 3 30.00% Ok 28.50% 31.50%
Frame 4 10.00% Ok 9.50% 10.50%
Market Watch Ok By Watch List 60.00% Ok 57.00% 63.00%
By Customer Account 34.99% Ok 33.00% 37.00%
By Industry 5.00% Ok 4.50% 5.50%
Trade Update Ok Frame 1 33.00% Ok 31.00% 35.00%
Frame 2 33.01% Ok 31.00% 35.00%
Frame 3 33.98% Ok 32.00% 36.00%
Security Detail Ok Access LOB 1.00% Ok 0.90% 1.10%
Trade Order Ok By Non-Owner 9.99% Ok 9.50% 10.50%
By Company Name 40.02% Ok 38.00% 42.00%
Buy on Margin 8.00% Ok 7.50% 8.50%
Rollback 1.00% Ok 0.94% 1.04%
LIFO 35.02% Ok 33.00% 37.00%
Trade Quantity 100 25.01% Ok 24.00% 26.00%
Trade Quantity 200 24.98% Ok 24.00% 26.00%
Trade Quantity 400 25.02% Ok 24.00% 26.00%
Trade Quantity 800 24.98% Ok 24.00% 26.00%
Market Buy 29.99% Ok 29.70% 30.30%
Market Sell 30.02% Ok 29.70% 30.30%
Limit buy 20.01% Ok 19.80% 20.20%
Limit sell 9.98% Ok 9.90% 10.10%Stop Loss 10.00% Ok 9.90% 10.10%
Acceptable Range
November 2009 TPC BenchmarkTM E Report 6-3

November 2009 TPC BenchmarkTM E Report 6-4

Clause 7: Transaction and System Properties
7.1. Transaction System Properties (ACID)
The results of the ACID tests must be reported in the Report along with a description of how the ACID requirements were met, and how the ACID tests were run. (9.3.7.1)
The TPC BenchmarkTM E Standard Specification defines a set of transaction processing system properties that a system under test (SUT) must support during the execution of the benchmark. Those properties are Transaction System Properties (ACID) and Redundancy.
This section defines each of these properties, describes the steps taken to ensure that they were present during the test and describes a series of tests done to demonstrate compliance with the specification. See file MSTPCE ACID Procedures.pdf in the SupportingFiles directory (Clause 7).
7.2. Redundancy Level
The Test Sponsor must report in the Report the Redundancy Level (see Clause 7.5.7.1) and describe the Data Accessibility test(s) used to demonstrate compliance. (9.3.7.2)
Redundancy level 1 was used for all tests. The following is a description of the Data Accessibility Tests: 1. The rows in the Settlement table were counted to determine the initial count of completed trades
present in the database (count1).2. The benchmark was executed above 95% load with the same number of configured customers and
driver load used for the measurement interval.3. After five minutes of running at steady state, a hot-pluggable log disk was removed from the disk
cabinet.4. A spare disk drive was installed in the RAID subsystem and configured to replace the faulty drive.5. The Drivers continued running for a minimum of 20 minutes with no errors on the OS or SQL
Server. The performance was at or above 95% of Reported throughput this period.6. A data disk was removed from the disk cabinet. 7. A spare disk drive was installed in the RAID subsystem and configured to replace the faulty drive.8. The Drivers continued running for a minimum of 20 minutes with no errors on the OS or SQL
Server. 9. The Drivers were stopped gracefully. 10. No errors were reported by the Drivers during steps 2 through 8.11. Step 1 was repeated to determine the total number of completed trades present in the database
(count2).12. Count2 minus count1 was verified to be equal to the number of successful Trade-Result transaction
records in the driver log file.13. The recovery process completed.
November 2009 TPC BenchmarkTM E Report 7-1

7.3. Data Accessibility Graph
A Data Accessibility Graph for each run demonstrating a Redundancy Level must be reported in the Report (see Clause 7.5.7.2). (9.3.7.3)
Figure 7-2: Data Accessibility Test Run
7.4. Business Recovery Tests
The Test Sponsor must describe in the Report the test(s) used to demonstrate Business Recovery. (9.3.7.4)
Removing the primary power to the SUT while the benchmark was executing induced this failure: 1. The rows in the Settlement table were summed up to determine the initial count of completed trades
present in the database (count1). 2. The benchmark was executed above 95% load with the same number of configured customers and
driver load used for the measurement interval for a minimum of twenty minutes. 3. The primary power to the Tier B server and the Tier A client was removed. 4. After transaction failures were noted by the drivers, the drivers were stopped. 5. Power was restored to the SUT, the system rebooted, SQL Server was restarted, and automatic
database recovery was performed. The database recovery used the transaction log to reapply all committed transactions and rollback any (in progress) uncommitted transactions, so that the database disks were correct.
6. Business Recovery started when SQL Server reported “Starting up database ‘master’”. Database recovery ended when SQL Server reported “Recovery is complete”.
7. The Trade-Cleanup Transaction was executed.
Throughput Over Time (Data Access Test)
0
500
1000
1500
2000
2500
0 5 10 15 20 25 30 35 40 45 50 55 60 65 70 75 80 85 90 95 100Elapsed Time (minutes)
tpsE
95% Reported tpsE
Start steady state
Pull log disk
Replace log disk
Pull Data Disk
Replace data disk
20 Minutes
November 2009 TPC BenchmarkTM E Report 7-2

8. After Trade-Cleanup finished, SQL Server was restarted and the benchmark was executed above
95% load with same number of configured customers and driver load used for the measurement interval for a minimum of twenty minutes.
9. Business Recovery ended successfully. 10. The drivers were stopped gracefully. 11. No errors were reported by the Drivers during steps 8 through 9. 12. Step 1 was repeated to determine the total number of completed trades present in the database
(count2). 13. Count2 minus count1 was not less than the aggregate number of successful Trade-Result
transaction records in the driver log file for the runs performed in step 2 and step 8. 14. Finally, consistency conditions as specified in Clause 7.3.1.1 were executed to verify that the
database was consistent.
7.5. Business Recovery Time
The Business Recovery Time must be reported on the Executive Summary Statement and in the Report. If the failures described in Clauses 7.5.2.2, 7.5.2.3, and 7.5.2.4 were not combined into one Durability Test (usually powering off the database during the run), then the Business Recovery Time for the failure described for instantaneous interruption is the Business Recovery Time that must be reported in the Executive Summary Statement. All the Business Recovery Times for each test requiring Business Recovery must be reported in the Report. (9.3.7.5)
A Business Recovery Time Graph (see Clause 7.5.7.4) must be reported in the Report for all Business Recovery Tests. (9.3.7.6)
Business Recovery time was 01:11:57. This time is also reported in the Executive Summary Statement.
Figure 7-2: Business Recovery Time
Throughput over Time (Business Recovery Test)
0
500
1000
1500
2000
2500
0 20 40 60 80 100
Elapsed Time (minutes)
tpsE
Run 1 Run 2 95% tpsE
Run 1 End
Run 2 End
20 Minutes
Business Recovery Time
November 2009 TPC BenchmarkTM E Report 7-3

November 2009 TPC BenchmarkTM E Report 7-4

Clause 8: Pricing
8.1. 60-Day Space
Details of the 60-Day Space computations (see Clause 8.2.2) along with proof that the database is configured to sustain a Business Day of growth (see Clause 6.6.6.1) must be reported in the Report. (9.3.8.1)
Figure 8.1 contains the details of the 60-Day Space Requirements.
Figure 8-1: Disk Space Requirements
Customers Used 1,025,000 Performance 2012.77 tpsEGrowing File Group Initial Rows Data (KB) Index size (KB) Extra 5% (KB) Total + 5% (KB) After run (KB) Growth (KB)
CA SH_TRANSACTION 16,294,994,199 1,682,115,224 3,552,784 1,685,668,008 1,690,069,520 4,401,512
HOLD ING 906,842,419 60,460,608 38,293,280 98,753,888 100,212,640 1,458,752
HOLD ING_HISTORY 23,737,047,918 863,165,744 498,912,576 1,362,078,320 1,366,824,888 4,746,568
HOLD ING_SUMMARY 50,974,251 2,223,472 10,832 2,234,304 2,234,304 0
SETTLEMENT 17,712,000,000 938,918,712 1,981,360 940,900,072 943,502,488 2,602,416
TRADE 17,712,000,000 2,113,333,176 1,063,156,136 3,176,489,312 3,187,693,304 11,203,992
TRADE_HISTO RY 42,508,800,690 1,278,460,544 3,337,448 1,281,797,992 1,286,230,920 4,432,928
TRADE_REQUEST 0 0 0 0 40,552 40,552
Scaling File GroupACCO UNT_PERMISSION 7,277,539 619,760 5,936 31,285 656,981 625,984 288
ADDRESS 1,537,504 88,928 2,704 4,582 96,214 91,688 56
BROK ER 10,250 752 1,008 88 1,848 1,760 0
CO MPAN Y 512,500 111,816 36,400 7,411 155,627 148,232 16
CO MPAN Y_COMPETITOR 1,537,500 41,504 37,664 3,958 83,126 79,168 0
CU STOMER 1,025,000 173,904 50,192 11,205 235,301 224,104 8
CU STOMER_ACCO UNT 5,125,000 464,664 103,384 28,402 596,450 568,056 8
CU STOMER_TAX RA TE 2,050,000 43,008 2,704 2,286 47,998 45,864 152
DAILY_MARKET 916,273,125 47,454,864 169,152 2,381,201 50,005,217 47,625,416 1,400
FINANCIAL 10,250,000 1,206,272 6,080 60,618 1,272,970 1,212,688 336
LAST_TRADE 702,125 43,864 2,704 2,328 48,896 46,568 0
NEWS_ITEM 1,025,000 111,129,856 3,920 5,556,689 116,690,465 111,133,832 56
NEWS_XREF 1,025,000 25,800 2,704 1,425 29,929 28,504 0
SECURITY 702,125 111,056 29,592 7,032 147,680 140,672 24
WATCH_ITEM 102,484,524 2,859,400 13,128 143,626 3,016,154 2,872,816 288
WATCH_LIST 1,025,000 25,744 25,016 2,538 53,298 50,760 0
Fixed File GroupCH ARGE 15 8 8 1 17 16 0
CO MMISSION _RATE 240 16 16 2 34 32 0
EXCHA NGE 4 8 8 1 17 16 0
INDUS TRY 102 8 24 2 34 32 0
SECTO R 12 8 24 2 34 32 0
STATUS_TYPE 5 8 8 1 17 16 0
TAX RA TE 320 24 16 2 42 56 16
TRADE_TYPE 5 8 1,032 52 1,092 1,040 0
ZIP_CODE 14,741 488 16 25 529 504 0
TOTALS (KB) 7,103,079,248 1,609,737,856 8,244,760 8,721,061,864
8,508,610 8,309 GB 8.11 TB
Db/Filegroups LUN Count Partition Size(KB) MB allocated MB Loaded MB Loaded+5% Ending size 8 Hours
Growing_FG 145 85,811,200 12,151,000 8,347,580 8,347,580 8,375,790 8,416,366
Scaling_FG 145 2,048,000 290,000 161,029 169,080 161,031 161,035
Fixed_FG 1 512,000 500 1.69 2 2 2
Settlements 23,772,895
Init ial Growing Space (MB) 8,347,580
Final Growi ng Space (MB) 8,375,790 Data LU NS 145 Initial Log siz e (MB) 3,845 Log D isks 10
Delta (MB) 28,210 Disks per LUN 6 Final Log size (MB) 158,273 Disk Capacity (MB) 138,841
Data Space per TR (MB) 0.001186632 Disk Capac ity (MB) 68,881 Log Grow th (MB) 154,427 RAID10 ove rhead 50%
1 Day D ata Growth (MB) 68,786 RAID10 overhead 50% Log Grow th/TR (MB) 0.006495947129 Tempdb Log -
60 Day Space (MB) 12,635,797 Total Space (MB) 29,963,235 1 Day log space (MB) 376,556 Log Space (MB) 694,207
Initial Database Size (MB)
November 2009 TPC BenchmarkTM E Report 8-1

8.2. Attestation Letter
The Auditor’s Attestation Letter, which indicates compliance, must be included in the Report. (9.3.8.2) Lorna Livingtree, a TPC certified auditor, audited this implementation of the TPC BenchmarkTM E on the Unisys ES7000 Model 7600R Enterprise Server (16s) representing:
Performance Metrics, Inc. P.O. Box 984 Klamath, CA 95548-0984 Phone: (707) 482-0523 Fax: (707) 482-0575 Email: [email protected] The attestation letter is shown near the end of this section.
November 2009 TPC BenchmarkTM E Report 8-2

November 2009 TPC BenchmarkTM E Report 8-3

November 2009 TPC BenchmarkTM E Report 8-4

Clause 9: Supporting Files
9.0. Supporting Files Index Table
An index for all files required by Clause 9.4 Supporting Files must be provided in the Report. The Supporting Files index is presented in a tabular format where the columns specify the following:
o The first column denotes the clause in the TPC Specification o The second column provides a short description of the file contents o The third column contains the path name for the file starting at the SupportingFiles directory.
If there are no Supporting Files provided then the description column must indicate that there is no supporting file and the path name column must be left blank. (9.3.9)
The Supporting Files Index Table must be provided in the Report. (9.3.9.1) The Supporting Files Index table is shown below. Individual files within the htm file can be viewed by clicking on the active links under Pathname in the file.
Table 9.1: Index of Supporting Files
Clause Description PathnameIntroduction Disk Configuration SupportingFiles\SupportingFilesIndex.htm
SupportingFiles\Introduction\DatabaseDisks\disks.txtSupportingFiles\Introduction\DatabaseDisks\formats.cmdSupportingFiles\Introduction\DatabaseDisks\input.txtSupportingFiles\Introduction\DatabaseDisks\mkdir.cmdSupportingFiles\Introduction\DatabaseDisks\Mounts.txt
Hardware Configuration SupportingFiles\Introduction\Hardware_Configuration\Hardware_Configuration.pdfSupportingFiles\Introduction\Hardware_Configuration\Raid_Configuration.pdf
Software Configuration DocumenSupportingFiles\Introduction\Software_Configuration\Software_Configuration.pdfCheckpoint scripts SupportingFiles\Introduction\Software_Configuration\Checkpoint.cmd
SupportingFiles\Introduction\Software_Configuration\Checkpoint_TPCE_Database.SQLDatabase Tunables SupportingFiles\Introduction\Software_Configuration\SQLaliases.reg
SupportingFiles\Introduction\Software_Configuration\SQLServerNodeConfiguration.regSupportingFiles\Introduction\Software_Configuration\SQLServer_IPAll.regSupportingFiles\Introduction\Software_Configuration\sql_config.sqlSupportingFiles\Introduction\Software_Configuration\STARTSQL.CMD
Tier-A Scripts SupportingFiles\Introduction\Software_Configuration\TierA_Start-CE.cmdSupportingFiles\Introduction\Software_Configuration\TierA_Start-MEE.cmd
System Information SupportingFiles\Introduction\Software_Configuration\systeminfo_DBMS.txtSupportingFiles\Introduction\Software_Configuration\systeminfo_tierA.txt
Clause 2 Database Setup Procedure SupportingFiles\Clause2\MSTPCE Database Setup Reference.pdfDatabase Audit Scripts SupportingFiles\Clause2\Audit_Scripts\Database\Create_DB_Audit_Tables.SQL
SupportingFiles\Clause2\Audit_Scripts\Database\DB_Check.sqlSupportingFiles\Clause2\Audit_Scripts\Database\DB_FK_Constraints.sqlSupportingFiles\Clause2\Audit_Scripts\Database\DB_Primary_Key_Check.SQLSupportingFiles\Clause2\Audit_Scripts\Database\DB_Tables.sqlSupportingFiles\Clause2\Audit_Scripts\Database\Drop_DB_Audit_Tables.SQLSupportingFiles\Clause2\Audit_Scripts\Database\Insert_Duplicates_Tests.sqlSupportingFiles\Clause2\Audit_Scripts\Database\Referential_Integrity_Tests.sql
Database Space Scripts SupportingFiles\Clause2\Audit_Scripts\Space\SPFiles.sqlSupportingFiles\Clause2\Audit_Scripts\Space\SPLog.sqlSupportingFiles\Clause2\Audit_Scripts\Space\SPUsed.sql
Database Creation Scripts SupportingFiles\Clause2\1025000.Cust\Database\Backup_Database.sqlSupportingFiles\Clause2\1025000.Cust\Database\Create_Database.sqlSupportingFiles\Clause2\1025000.Cust\Database\flatfiles.txtSupportingFiles\Clause2\1025000.Cust\Database\Restore_Database.sqlSupportingFiles\Clause2\1025000.Cust\Database\tempdb.sql
Database Constraints Scripts SupportingFiles\Clause2\DDL\Create_Check_Constraints_Fixed.sqlSupportingFiles\Clause2\DDL\Create_Check_Constraints_Growing.sql
November 2009 TPC BenchmarkTM E Report 9-1

Table 9.1: Index of Supporting Files (cont.)
Clause Description Pathname
SupportingFiles\Clause2\DDL\Create_Check_Constraints_Scaling.sqlSupportingFiles\Clause2\DDL\Create_FK_Constraints.sqlSupportingFiles\Clause2\DDL\Drop_FK_Constraints.sql
Table Creation Scripts SupportingFiles\Clause2\DDL\Create_Tables_Fixed.sqlSupportingFiles\Clause2\DDL\Create_Tables_Growing.sqlSupportingFiles\Clause2\DDL\Create_Tables_Scaling.sqlSupportingFiles\Clause2\DDL\Create_Tables_Scaling_Flat.sqlSupportingFiles\Clause2\DDL\Create_TPCE_Types.sqlSupportingFiles\Clause2\DDL\Drop_Tables_Fixed.sqlSupportingFiles\Clause2\DDL\Drop_Tables_Growing.sqlSupportingFiles\Clause2\DDL\Drop_Tables_Scaling.sqlSupportingFiles\Clause2\DDL\Convert_NI_ITEM_Data.SQLSupportingFiles\Clause2\DDL\BulkInsert_1.sqlSupportingFiles\Clause2\DDL\BulkInsert_10.sqlSupportingFiles\Clause2\DDL\BulkInsert_100.sqlSupportingFiles\Clause2\DDL\BulkInsert_101.sqlSupportingFiles\Clause2\DDL\BulkInsert_102.sqlSupportingFiles\Clause2\DDL\BulkInsert_103.sqlSupportingFiles\Clause2\DDL\BulkInsert_104.sqlSupportingFiles\Clause2\DDL\BulkInsert_105.sqlSupportingFiles\Clause2\DDL\BulkInsert_106.sqlSupportingFiles\Clause2\DDL\BulkInsert_107.sqlSupportingFiles\Clause2\DDL\BulkInsert_108.sqlSupportingFiles\Clause2\DDL\BulkInsert_109.sqlSupportingFiles\Clause2\DDL\BulkInsert_11.sqlSupportingFiles\Clause2\DDL\BulkInsert_110.sqlSupportingFiles\Clause2\DDL\BulkInsert_111.sqlSupportingFiles\Clause2\DDL\BulkInsert_112.sqlSupportingFiles\Clause2\DDL\BulkInsert_113.sqlSupportingFiles\Clause2\DDL\BulkInsert_114.sqlSupportingFiles\Clause2\DDL\BulkInsert_115.sqlSupportingFiles\Clause2\DDL\BulkInsert_116.sqlSupportingFiles\Clause2\DDL\BulkInsert_117.sqlSupportingFiles\Clause2\DDL\BulkInsert_118.sqlSupportingFiles\Clause2\DDL\BulkInsert_119.sqlSupportingFiles\Clause2\DDL\BulkInsert_12.sqlSupportingFiles\Clause2\DDL\BulkInsert_120.sqlSupportingFiles\Clause2\DDL\BulkInsert_121.sqlSupportingFiles\Clause2\DDL\BulkInsert_122.sqlSupportingFiles\Clause2\DDL\BulkInsert_123.sqlSupportingFiles\Clause2\DDL\BulkInsert_124.sqlSupportingFiles\Clause2\DDL\BulkInsert_125.sqlSupportingFiles\Clause2\DDL\BulkInsert_126.sqlSupportingFiles\Clause2\DDL\BulkInsert_127.sqlSupportingFiles\Clause2\DDL\BulkInsert_128.sqlSupportingFiles\Clause2\DDL\BulkInsert_129.sqlSupportingFiles\Clause2\DDL\BulkInsert_13.sqlSupportingFiles\Clause2\DDL\BulkInsert_130.sqlSupportingFiles\Clause2\DDL\BulkInsert_131.sqlSupportingFiles\Clause2\DDL\BulkInsert_132.sqlSupportingFiles\Clause2\DDL\BulkInsert_133.sqlSupportingFiles\Clause2\DDL\BulkInsert_134.sqlSupportingFiles\Clause2\DDL\BulkInsert_135.sqlSupportingFiles\Clause2\DDL\BulkInsert_136.sqlSupportingFiles\Clause2\DDL\BulkInsert_137.sqlSupportingFiles\Clause2\DDL\BulkInsert_138.sqlSupportingFiles\Clause2\DDL\BulkInsert_139.sqlSupportingFiles\Clause2\DDL\BulkInsert_14.sqlSupportingFiles\Clause2\DDL\BulkInsert_140.sqlSupportingFiles\Clause2\DDL\BulkInsert_15.sqlSupportingFiles\Clause2\DDL\BulkInsert_16.sqlSupportingFiles\Clause2\DDL\BulkInsert_17.sqlSupportingFiles\Clause2\DDL\BulkInsert_18.sqlSupportingFiles\Clause2\DDL\BulkInsert_19.sqlSupportingFiles\Clause2\DDL\BulkInsert_2.sqlSupportingFiles\Clause2\DDL\BulkInsert_20.sqlSupportingFiles\Clause2\DDL\BulkInsert_21.sqlSupportingFiles\Clause2\DDL\BulkInsert_22.sqlSupportingFiles\Clause2\DDL\BulkInsert_23.sql
November 2009 TPC BenchmarkTM E Report 9-2

Table 9.1: Index of Supporting Files (cont.)
Clause Description Pathname
SupportingFiles\Clause2\DDL\BulkInsert_24.sqlSupportingFiles\Clause2\DDL\BulkInsert_25.sqlSupportingFiles\Clause2\DDL\BulkInsert_26.sqlSupportingFiles\Clause2\DDL\BulkInsert_27.sqlSupportingFiles\Clause2\DDL\BulkInsert_28.sqlSupportingFiles\Clause2\DDL\BulkInsert_29.sqlSupportingFiles\Clause2\DDL\BulkInsert_3.sqlSupportingFiles\Clause2\DDL\BulkInsert_30.sqlSupportingFiles\Clause2\DDL\BulkInsert_31.sqlSupportingFiles\Clause2\DDL\BulkInsert_32.sqlSupportingFiles\Clause2\DDL\BulkInsert_33.sqlSupportingFiles\Clause2\DDL\BulkInsert_34.sqlSupportingFiles\Clause2\DDL\BulkInsert_35.sqlSupportingFiles\Clause2\DDL\BulkInsert_36.sqlSupportingFiles\Clause2\DDL\BulkInsert_37.sqlSupportingFiles\Clause2\DDL\BulkInsert_38.sqlSupportingFiles\Clause2\DDL\BulkInsert_39.sqlSupportingFiles\Clause2\DDL\BulkInsert_4.sqlSupportingFiles\Clause2\DDL\BulkInsert_40.sqlSupportingFiles\Clause2\DDL\BulkInsert_41.sqlSupportingFiles\Clause2\DDL\BulkInsert_42.sqlSupportingFiles\Clause2\DDL\BulkInsert_43.sqlSupportingFiles\Clause2\DDL\BulkInsert_44.sqlSupportingFiles\Clause2\DDL\BulkInsert_45.sqlSupportingFiles\Clause2\DDL\BulkInsert_46.sqlSupportingFiles\Clause2\DDL\BulkInsert_47.sqlSupportingFiles\Clause2\DDL\BulkInsert_48.sqlSupportingFiles\Clause2\DDL\BulkInsert_49.sqlSupportingFiles\Clause2\DDL\BulkInsert_5.sqlSupportingFiles\Clause2\DDL\BulkInsert_50.sqlSupportingFiles\Clause2\DDL\BulkInsert_51.sqlSupportingFiles\Clause2\DDL\BulkInsert_52.sqlSupportingFiles\Clause2\DDL\BulkInsert_53.sqlSupportingFiles\Clause2\DDL\BulkInsert_54.sqlSupportingFiles\Clause2\DDL\BulkInsert_55.sqlSupportingFiles\Clause2\DDL\BulkInsert_56.sqlSupportingFiles\Clause2\DDL\BulkInsert_57.sqlSupportingFiles\Clause2\DDL\BulkInsert_58.sqlSupportingFiles\Clause2\DDL\BulkInsert_59.sqlSupportingFiles\Clause2\DDL\BulkInsert_6.sqlSupportingFiles\Clause2\DDL\BulkInsert_60.sqlSupportingFiles\Clause2\DDL\BulkInsert_61.sqlSupportingFiles\Clause2\DDL\BulkInsert_62.sqlSupportingFiles\Clause2\DDL\BulkInsert_63.sqlSupportingFiles\Clause2\DDL\BulkInsert_64.sqlSupportingFiles\Clause2\DDL\BulkInsert_65.sqlSupportingFiles\Clause2\DDL\BulkInsert_66.sqlSupportingFiles\Clause2\DDL\BulkInsert_67.sqlSupportingFiles\Clause2\DDL\BulkInsert_68.sqlSupportingFiles\Clause2\DDL\BulkInsert_69.sqlSupportingFiles\Clause2\DDL\BulkInsert_7.sqlSupportingFiles\Clause2\DDL\BulkInsert_70.sqlSupportingFiles\Clause2\DDL\BulkInsert_71.sqlSupportingFiles\Clause2\DDL\BulkInsert_72.sqlSupportingFiles\Clause2\DDL\BulkInsert_73.sqlSupportingFiles\Clause2\DDL\BulkInsert_74.sqlSupportingFiles\Clause2\DDL\BulkInsert_75.sqlSupportingFiles\Clause2\DDL\BulkInsert_76.sqlSupportingFiles\Clause2\DDL\BulkInsert_77.sqlSupportingFiles\Clause2\DDL\BulkInsert_78.sqlSupportingFiles\Clause2\DDL\BulkInsert_79.sqlSupportingFiles\Clause2\DDL\BulkInsert_8.sqlSupportingFiles\Clause2\DDL\BulkInsert_80.sqlSupportingFiles\Clause2\DDL\BulkInsert_81.sqlSupportingFiles\Clause2\DDL\BulkInsert_82.sqlSupportingFiles\Clause2\DDL\BulkInsert_83.sqlSupportingFiles\Clause2\DDL\BulkInsert_84.sqlSupportingFiles\Clause2\DDL\BulkInsert_85.sqlSupportingFiles\Clause2\DDL\BulkInsert_86.sql
November 2009 TPC BenchmarkTM E Report 9-3

Table 9.1: Index of Supporting Files (cont.)
Clause Description Pathname
SupportingFiles\Clause2\DDL\BulkInsert_87.sqlSupportingFiles\Clause2\DDL\BulkInsert_88.sqlSupportingFiles\Clause2\DDL\BulkInsert_89.sqlSupportingFiles\Clause2\DDL\BulkInsert_9.sqlSupportingFiles\Clause2\DDL\BulkInsert_90.sqlSupportingFiles\Clause2\DDL\BulkInsert_91.sqlSupportingFiles\Clause2\DDL\BulkInsert_92.sqlSupportingFiles\Clause2\DDL\BulkInsert_93.sqlSupportingFiles\Clause2\DDL\BulkInsert_94.sqlSupportingFiles\Clause2\DDL\BulkInsert_95.sqlSupportingFiles\Clause2\DDL\BulkInsert_96.sqlSupportingFiles\Clause2\DDL\BulkInsert_97.sqlSupportingFiles\Clause2\DDL\BulkInsert_98.sqlSupportingFiles\Clause2\DDL\BulkInsert_99.sql
Index Creation Scripts SupportingFiles\Clause2\DDL\Unified_Create_Indexes.sqlMisc Scripts SupportingFiles\Clause2\Utility\Checkpoint_TPCE_Database.SQL
SupportingFiles\Clause2\Utility\Count_Customers.sqlSupportingFiles\Clause2\Utility\Create_DM_Audit_Table.sqlSupportingFiles\Clause2\Utility\Create_TID_Ranges_Table.sqlSupportingFiles\Clause2\Utility\Create_Timer_Table.sqlSupportingFiles\Clause2\Utility\Create_TL_TU_Warnings_Table.sqlSupportingFiles\Clause2\Utility\Create_TPCE_VERSIONS_Table.sqlSupportingFiles\Clause2\Utility\Database_Options_1.sqlSupportingFiles\Clause2\Utility\Database_Options_2.sqlSupportingFiles\Clause2\Utility\Drop_and_Create_TPCE_INFO.sqlSupportingFiles\Clause2\Utility\End_Load_Timer.sqlSupportingFiles\Clause2\Utility\Get_Next_T_ID.sqlSupportingFiles\Clause2\Utility\Install_Load_Timer_Proc.sqlSupportingFiles\Clause2\Utility\Load_TPCE_Info.sqlSupportingFiles\Clause2\Utility\Output_TPCE_VERSIONS_Table.SQLSupportingFiles\Clause2\Utility\SQL_Server_Configuration.sqlSupportingFiles\Clause2\Utility\Trade_Cleanup.sqlSupportingFiles\Clause2\Utility\Version.sql
Clause 3 Transaction Frames SupportingFiles\Clause3\BrokerVolume.sqlSupportingFiles\Clause3\CustomerPosition.sqlSupportingFiles\Clause3\DataMaintenance.sqlSupportingFiles\Clause3\Get_Next_T_ID.sqlSupportingFiles\Clause3\MarketFeed.sqlSupportingFiles\Clause3\MarketWatch.sqlSupportingFiles\Clause3\SecurityDetail.sqlSupportingFiles\Clause3\TradeLookup.sqlSupportingFiles\Clause3\TradeOrder.sqlSupportingFiles\Clause3\TradeResult.sqlSupportingFiles\Clause3\TradeStatus.sqlSupportingFiles\Clause3\TradeUpdate.sqlSupportingFiles\Clause3\Trade_Cleanup.sql
BaseServer SupportingFiles\Clause3\BaseServer\BaseServer.cppSupportingFiles\Clause3\BaseServer\BaseServer.hSupportingFiles\Clause3\BaseServer\BaseServer.vcprojSupportingFiles\Clause3\BaseServer\stdafx.cppSupportingFiles\Clause3\BaseServer\stdafx.hSupportingFiles\Clause3\BaseServer\SUTServersLocals.h
EGen Make/Project files SupportingFiles\Clause3\prj\MakefileSupportingFiles\Clause3\prj\VS2008\EGen.slnSupportingFiles\Clause3\prj\VS2008\EGen.suoSupportingFiles\Clause3\prj\VS2008\EGenBaseLoader.vcprojSupportingFiles\Clause3\prj\VS2008\EGenDriverCELib.vcprojSupportingFiles\Clause3\prj\VS2008\EGenDriverDMLib.vcprojSupportingFiles\Clause3\prj\VS2008\EGenDriverMEELib.vcprojSupportingFiles\Clause3\prj\VS2008\EGenFlatFileLoad.vcprojSupportingFiles\Clause3\prj\VS2008\EGenGenerateAndLoad.vcprojSupportingFiles\Clause3\prj\VS2008\EGenLoader.vcprojSupportingFiles\Clause3\prj\VS2008\EGenLogger.vcprojSupportingFiles\Clause3\prj\VS2008\EGenMSSQLLoader.vcprojSupportingFiles\Clause3\prj\VS2008\EGenNullLoader.vcprojSupportingFiles\Clause3\prj\VS2008\EGenTables.vcprojSupportingFiles\Clause3\prj\VS2008\EGenUtilities.vcprojSupportingFiles\Clause3\prj\VS2008\EGenValidate.vcproj
SUT_CE_Server SupportingFiles\Clause3\SUT_CE_Server\CEServer.cpp
November 2009 TPC BenchmarkTM E Report 9-4

Table 9.1: Index of Supporting Files (cont.)
Clause Description Pathname
SupportingFiles\Clause3\SUT_CE_Server\CEServer.hSupportingFiles\Clause3\SUT_CE_Server\CEServerMain.cppSupportingFiles\Clause3\SUT_CE_Server\PortDefinitions.hSupportingFiles\Clause3\SUT_CE_Server\stdafx.cppSupportingFiles\Clause3\SUT_CE_Server\stdafx.hSupportingFiles\Clause3\SUT_CE_Server\SUTServer.slnSupportingFiles\Clause3\SUT_CE_Server\SUTServer.suoSupportingFiles\Clause3\SUT_CE_Server\SUTStructs.hSupportingFiles\Clause3\SUT_CE_Server\SUT_CE_Server.vcproj
SUT_MEE_Server SupportingFiles\Clause3\SUT_MEE_Server\MEEServer.cppSupportingFiles\Clause3\SUT_MEE_Server\MEEServer.hSupportingFiles\Clause3\SUT_MEE_Server\MEEServerMain.cppSupportingFiles\Clause3\SUT_MEE_Server\stdafx.cppSupportingFiles\Clause3\SUT_MEE_Server\stdafx.hSupportingFiles\Clause3\SUT_MEE_Server\SUT_MEE_Server.vcproj
TransactionsSP SupportingFiles\Clause3\TransactionsSP\BrokerVolumeDB_SP.cppSupportingFiles\Clause3\TransactionsSP\BrokerVolumeDB_SP.hSupportingFiles\Clause3\TransactionsSP\CheckpointDB_SP.cppSupportingFiles\Clause3\TransactionsSP\CheckpointDB_SP.hSupportingFiles\Clause3\TransactionsSP\CustomerPositionDB_SP.cppSupportingFiles\Clause3\TransactionsSP\CustomerPositionDB_SP.hSupportingFiles\Clause3\TransactionsSP\DataMaintenanceDB_SP.cppSupportingFiles\Clause3\TransactionsSP\DataMaintenanceDB_SP.hSupportingFiles\Clause3\TransactionsSP\MarketFeedDB_SP.cppSupportingFiles\Clause3\TransactionsSP\MarketFeedDB_SP.hSupportingFiles\Clause3\TransactionsSP\MarketWatchDB_SP.cppSupportingFiles\Clause3\TransactionsSP\MarketWatchDB_SP.hSupportingFiles\Clause3\TransactionsSP\SecurityDetailDB_SP.cppSupportingFiles\Clause3\TransactionsSP\SecurityDetailDB_SP.hSupportingFiles\Clause3\TransactionsSP\stdafx.cppSupportingFiles\Clause3\TransactionsSP\stdafx.hSupportingFiles\Clause3\TransactionsSP\TradeLookupDB_SP.cppSupportingFiles\Clause3\TransactionsSP\TradeLookupDB_SP.hSupportingFiles\Clause3\TransactionsSP\TradeOrderDB_SP.cppSupportingFiles\Clause3\TransactionsSP\TradeOrderDB_SP.hSupportingFiles\Clause3\TransactionsSP\TradeResultDB_SP.cppSupportingFiles\Clause3\TransactionsSP\TradeResultDB_SP.hSupportingFiles\Clause3\TransactionsSP\TradeStatusDB_SP.cppSupportingFiles\Clause3\TransactionsSP\TradeStatusDB_SP.hSupportingFiles\Clause3\TransactionsSP\TradeUpdateDB_SP.cppSupportingFiles\Clause3\TransactionsSP\TradeUpdateDB_SP.hSupportingFiles\Clause3\TransactionsSP\TransactionsSP.vcprojSupportingFiles\Clause3\TransactionsSP\TxnHarnessDBBase.cppSupportingFiles\Clause3\TransactionsSP\TxnHarnessDBBase.hSupportingFiles\Clause3\TransactionsSP\TxnHarnessDBConn.cppSupportingFiles\Clause3\TransactionsSP\TxnHarnessDBConn.h
TxnHarness SupportingFiles\Clause3\TxnHarness\TxnHarness.vcprojSupportingFiles\Clause3\TxnHarness\TxnHarnessSendToMarket.cppSupportingFiles\Clause3\TxnHarness\TxnHarnessSendToMarket.hSupportingFiles\Clause3\TxnHarness\TxnHarness_stdafx.cppSupportingFiles\Clause3\TxnHarness\TxnHarness_stdafx.h
Clause 4 No RequirementsClause 5 No EGen Modifications
No EGenLoader ExtentionsEGenDriver Configuration SupportingFiles\Clause5\1025k.xmlEGenLoader Parameters SupportingFiles\Clause5\BuildSteps1.log
SupportingFiles\Clause5\BuildSteps2.logSupportingFiles\Clause5\BuildSteps3.logSupportingFiles\Clause5\BuildSteps4.logSupportingFiles\Clause5\EGenLoaderFrom1003001To1010000.logSupportingFiles\Clause5\EGenLoaderFrom1010001To1018000.logSupportingFiles\Clause5\EGenLoaderFrom1018001To1025000.logSupportingFiles\Clause5\EGenLoaderFrom103001To110000.logSupportingFiles\Clause5\EGenLoaderFrom110001To117000.logSupportingFiles\Clause5\EGenLoaderFrom117001To124000.logSupportingFiles\Clause5\EGenLoaderFrom124001To132000.logSupportingFiles\Clause5\EGenLoaderFrom132001To139000.logSupportingFiles\Clause5\EGenLoaderFrom139001To146000.logSupportingFiles\Clause5\EGenLoaderFrom146001To154000.log
November 2009 TPC BenchmarkTM E Report 9-5

Table 9.1: Index of Supporting Files (cont.)
Clause Description Pathname
SupportingFiles\Clause5\EGenLoaderFrom15001To22000.logSupportingFiles\Clause5\EGenLoaderFrom154001To161000.logSupportingFiles\Clause5\EGenLoaderFrom161001To168000.logSupportingFiles\Clause5\EGenLoaderFrom168001To176000.logSupportingFiles\Clause5\EGenLoaderFrom176001To183000.logSupportingFiles\Clause5\EGenLoaderFrom183001To190000.logSupportingFiles\Clause5\EGenLoaderFrom190001To198000.logSupportingFiles\Clause5\EGenLoaderFrom198001To205000.logSupportingFiles\Clause5\EGenLoaderFrom1To7000.logSupportingFiles\Clause5\EGenLoaderFrom205001To212000.logSupportingFiles\Clause5\EGenLoaderFrom212001To220000.logSupportingFiles\Clause5\EGenLoaderFrom220001To227000.logSupportingFiles\Clause5\EGenLoaderFrom22001To29000.logSupportingFiles\Clause5\EGenLoaderFrom227001To234000.logSupportingFiles\Clause5\EGenLoaderFrom234001To242000.logSupportingFiles\Clause5\EGenLoaderFrom242001To249000.logSupportingFiles\Clause5\EGenLoaderFrom249001To256000.logSupportingFiles\Clause5\EGenLoaderFrom256001To264000.logSupportingFiles\Clause5\EGenLoaderFrom264001To271000.logSupportingFiles\Clause5\EGenLoaderFrom271001To278000.logSupportingFiles\Clause5\EGenLoaderFrom278001To286000.logSupportingFiles\Clause5\EGenLoaderFrom286001To293000.logSupportingFiles\Clause5\EGenLoaderFrom29001To37000.logSupportingFiles\Clause5\EGenLoaderFrom293001To300000.logSupportingFiles\Clause5\EGenLoaderFrom300001To308000.logSupportingFiles\Clause5\EGenLoaderFrom308001To315000.logSupportingFiles\Clause5\EGenLoaderFrom315001To322000.logSupportingFiles\Clause5\EGenLoaderFrom322001To329000.logSupportingFiles\Clause5\EGenLoaderFrom329001To337000.logSupportingFiles\Clause5\EGenLoaderFrom337001To344000.logSupportingFiles\Clause5\EGenLoaderFrom344001To351000.logSupportingFiles\Clause5\EGenLoaderFrom351001To359000.logSupportingFiles\Clause5\EGenLoaderFrom359001To366000.logSupportingFiles\Clause5\EGenLoaderFrom366001To373000.logSupportingFiles\Clause5\EGenLoaderFrom37001To44000.logSupportingFiles\Clause5\EGenLoaderFrom373001To381000.logSupportingFiles\Clause5\EGenLoaderFrom381001To388000.logSupportingFiles\Clause5\EGenLoaderFrom388001To395000.logSupportingFiles\Clause5\EGenLoaderFrom395001To403000.logSupportingFiles\Clause5\EGenLoaderFrom403001To410000.logSupportingFiles\Clause5\EGenLoaderFrom410001To417000.logSupportingFiles\Clause5\EGenLoaderFrom417001To425000.logSupportingFiles\Clause5\EGenLoaderFrom425001To432000.logSupportingFiles\Clause5\EGenLoaderFrom432001To439000.logSupportingFiles\Clause5\EGenLoaderFrom439001To447000.logSupportingFiles\Clause5\EGenLoaderFrom44001To51000.logSupportingFiles\Clause5\EGenLoaderFrom447001To454000.logSupportingFiles\Clause5\EGenLoaderFrom454001To461000.logSupportingFiles\Clause5\EGenLoaderFrom461001To469000.logSupportingFiles\Clause5\EGenLoaderFrom469001To476000.logSupportingFiles\Clause5\EGenLoaderFrom476001To483000.logSupportingFiles\Clause5\EGenLoaderFrom483001To491000.logSupportingFiles\Clause5\EGenLoaderFrom491001To498000.logSupportingFiles\Clause5\EGenLoaderFrom498001To505000.logSupportingFiles\Clause5\EGenLoaderFrom505001To513000.logSupportingFiles\Clause5\EGenLoaderFrom51001To59000.logSupportingFiles\Clause5\EGenLoaderFrom513001To520000.logSupportingFiles\Clause5\EGenLoaderFrom520001To527000.logSupportingFiles\Clause5\EGenLoaderFrom527001To534000.logSupportingFiles\Clause5\EGenLoaderFrom534001To542000.logSupportingFiles\Clause5\EGenLoaderFrom542001To549000.logSupportingFiles\Clause5\EGenLoaderFrom549001To556000.logSupportingFiles\Clause5\EGenLoaderFrom556001To564000.logSupportingFiles\Clause5\EGenLoaderFrom564001To571000.logSupportingFiles\Clause5\EGenLoaderFrom571001To578000.logSupportingFiles\Clause5\EGenLoaderFrom578001To586000.logSupportingFiles\Clause5\EGenLoaderFrom586001To593000.logSupportingFiles\Clause5\EGenLoaderFrom59001To66000.logSupportingFiles\Clause5\EGenLoaderFrom593001To600000.log
November 2009 TPC BenchmarkTM E Report 9-6

Table 9.1: Index of Supporting Files (cont.)
Clause Description Pathname
SupportingFiles\Clause5\EGenLoaderFrom600001To608000.logSupportingFiles\Clause5\EGenLoaderFrom608001To615000.logSupportingFiles\Clause5\EGenLoaderFrom615001To622000.logSupportingFiles\Clause5\EGenLoaderFrom622001To630000.logSupportingFiles\Clause5\EGenLoaderFrom630001To637000.logSupportingFiles\Clause5\EGenLoaderFrom637001To644000.logSupportingFiles\Clause5\EGenLoaderFrom644001To652000.logSupportingFiles\Clause5\EGenLoaderFrom652001To659000.logSupportingFiles\Clause5\EGenLoaderFrom659001To666000.logSupportingFiles\Clause5\EGenLoaderFrom66001To73000.logSupportingFiles\Clause5\EGenLoaderFrom666001To674000.logSupportingFiles\Clause5\EGenLoaderFrom674001To681000.logSupportingFiles\Clause5\EGenLoaderFrom681001To688000.logSupportingFiles\Clause5\EGenLoaderFrom688001To696000.logSupportingFiles\Clause5\EGenLoaderFrom696001To703000.logSupportingFiles\Clause5\EGenLoaderFrom7001To15000.logSupportingFiles\Clause5\EGenLoaderFrom703001To710000.logSupportingFiles\Clause5\EGenLoaderFrom710001To718000.logSupportingFiles\Clause5\EGenLoaderFrom718001To725000.logSupportingFiles\Clause5\EGenLoaderFrom725001To732000.logSupportingFiles\Clause5\EGenLoaderFrom73001To81000.logSupportingFiles\Clause5\EGenLoaderFrom732001To739000.logSupportingFiles\Clause5\EGenLoaderFrom739001To747000.logSupportingFiles\Clause5\EGenLoaderFrom747001To754000.logSupportingFiles\Clause5\EGenLoaderFrom754001To761000.logSupportingFiles\Clause5\EGenLoaderFrom761001To769000.logSupportingFiles\Clause5\EGenLoaderFrom769001To776000.logSupportingFiles\Clause5\EGenLoaderFrom776001To783000.logSupportingFiles\Clause5\EGenLoaderFrom783001To791000.logSupportingFiles\Clause5\EGenLoaderFrom791001To798000.logSupportingFiles\Clause5\EGenLoaderFrom798001To805000.logSupportingFiles\Clause5\EGenLoaderFrom805001To813000.logSupportingFiles\Clause5\EGenLoaderFrom81001To88000.logSupportingFiles\Clause5\EGenLoaderFrom813001To820000.logSupportingFiles\Clause5\EGenLoaderFrom820001To827000.logSupportingFiles\Clause5\EGenLoaderFrom827001To835000.logSupportingFiles\Clause5\EGenLoaderFrom835001To842000.logSupportingFiles\Clause5\EGenLoaderFrom842001To849000.logSupportingFiles\Clause5\EGenLoaderFrom849001To857000.logSupportingFiles\Clause5\EGenLoaderFrom857001To864000.logSupportingFiles\Clause5\EGenLoaderFrom864001To871000.logSupportingFiles\Clause5\EGenLoaderFrom871001To879000.logSupportingFiles\Clause5\EGenLoaderFrom879001To886000.logSupportingFiles\Clause5\EGenLoaderFrom88001To95000.logSupportingFiles\Clause5\EGenLoaderFrom886001To893000.logSupportingFiles\Clause5\EGenLoaderFrom893001To901000.logSupportingFiles\Clause5\EGenLoaderFrom901001To908000.logSupportingFiles\Clause5\EGenLoaderFrom908001To915000.logSupportingFiles\Clause5\EGenLoaderFrom915001To923000.logSupportingFiles\Clause5\EGenLoaderFrom923001To930000.logSupportingFiles\Clause5\EGenLoaderFrom930001To937000.logSupportingFiles\Clause5\EGenLoaderFrom937001To944000.logSupportingFiles\Clause5\EGenLoaderFrom944001To952000.logSupportingFiles\Clause5\EGenLoaderFrom95001To103000.logSupportingFiles\Clause5\EGenLoaderFrom952001To959000.logSupportingFiles\Clause5\EGenLoaderFrom959001To966000.logSupportingFiles\Clause5\EGenLoaderFrom966001To974000.logSupportingFiles\Clause5\EGenLoaderFrom974001To981000.logSupportingFiles\Clause5\EGenLoaderFrom981001To988000.logSupportingFiles\Clause5\EGenLoaderFrom988001To996000.logSupportingFiles\Clause5\EGenLoaderFrom996001To1003000.log
EGenLogger Output SupportingFiles\Clause5\EGenLogs.xltClause 6 EGenValidate Output SupportingFiles\Clause6\EGenValidate.outClause 7 ACID Procedure document SupportingFiles\Clause7\MSTPCE ACID Procedures.pdf
ACID Procedure Scripts SupportingFiles\Clause7\AcidProcs\AcidProc.cmdSupportingFiles\Clause7\AcidProcs\Remove AcidProcs.cmdSupportingFiles\Clause7\AcidProcs\Scripts\AcidProc.vbsSupportingFiles\Clause7\AcidProcs\Scripts\CustomerPosition_Iso3.sqlSupportingFiles\Clause7\AcidProcs\Scripts\CustomerPosition_Iso4.sql
November 2009 TPC BenchmarkTM E Report 9-7

Table 9.1: Index of Supporting Files (cont.)
Clause Description Pathname
SupportingFiles\Clause7\AcidProcs\Scripts\Remove_AcidProcs.vbsSupportingFiles\Clause7\AcidProcs\Scripts\TradeOrder_C.sqlSupportingFiles\Clause7\AcidProcs\Scripts\TradeOrder Iso1 1.sqlSupportingFiles\Clause7\AcidProcs\Scripts\TradeOrder Iso1 2.sqlSupportingFiles\Clause7\AcidProcs\Scripts\TradeOrder_Iso2.sqlSupportingFiles\Clause7\AcidProcs\Scripts\TradeOrder_Iso3.sqlSupportingFiles\Clause7\AcidProcs\Scripts\TradeOrder Iso4.sqlSupportingFiles\Clause7\AcidProcs\Scripts\TradeOrder RB.sqlSupportingFiles\Clause7\AcidProcs\Scripts\TradeResult_Iso1_1.sqlSupportingFiles\Clause7\AcidProcs\Scripts\TradeResult_Iso1_2.sqlSupportingFiles\Clause7\AcidProcs\Scripts\TradeResult Iso2 1.sqlSupportingFiles\Clause7\AcidProcs\Scripts\TradeResult Iso2 2.sqlSupportingFiles\Clause7\AcidProcs\Scripts\TradeResult_Iso3.sqlSupportingFiles\Clause7\AcidProcs\Scripts\TradeResult_Iso4.sql
ACID Procedure output SupportingFiles\Clause7\AcidProcs\AcidProc.outAtomicity Scripts SupportingFiles\Clause7\Atomicity\Atomicity.cmd
SupportingFiles\Clause7\Atomicity\Scripts\atom.vbsSupportingFiles\Clause7\Atomicity\Scripts\Atomicity_C.sqlSupportingFiles\Clause7\Atomicity\Scripts\Atomicity_RB.sql
Atomicity Output SupportingFiles\Clause7\Atomicity\Atomicity C.outSupportingFiles\Clause7\Atomicity\Atomicity RB.out
Consistency Scripts SupportingFiles\Clause7\Consistency\Consistency.cmdSupportingFiles\Clause7\Consistency\Scripts\Consistency.sqlSupportingFiles\Clause7\Consistency\Scripts\Consistency.vbs
Consistency Output SupportingFiles\Clause7\Consistency\Consistency.outDurability Business Recovery SupportingFiles\Clause7\Durability\BusinessRecovey\1025k.xml
SupportingFiles\Clause7\Durability\BusinessRecovey\app_event.txtSupportingFiles\Clause7\Durability\BusinessRecovey\cntb.txtSupportingFiles\Clause7\Durability\BusinessRecovey\cnte.txtSupportingFiles\Clause7\Durability\BusinessRecovey\Consistency.outSupportingFiles\Clause7\Durability\BusinessRecovey\CountSettlement.sqlSupportingFiles\Clause7\Durability\BusinessRecovey\ERRORLOG recovery.txtSupportingFiles\Clause7\Durability\BusinessRecovey\ERRORLOG run1.txtSupportingFiles\Clause7\Durability\BusinessRecovey\ERRORLOG_run2.txtSupportingFiles\Clause7\Durability\BusinessRecovey\SQL_Server_Configuration_BusinessRecovery.txtSupportingFiles\Clause7\Durability\BusinessRecovey\sys_event.txtSupportingFiles\Clause7\Durability\BusinessRecovey\TierA application.logSupportingFiles\Clause7\Durability\BusinessRecovey\TierA_systemlog.logSupportingFiles\Clause7\Durability\BusinessRecovey\TradeRequest_cntb.verSupportingFiles\Clause7\Durability\BusinessRecovey\TradeRequest_cntbe.verSupportingFiles\Clause7\Durability\BusinessRecovey\Tradesb.txtSupportingFiles\Clause7\Durability\BusinessRecovey\Tradese.txtSupportingFiles\Clause7\Durability\BusinessRecovey\trade_cleanup_after_database_recovery.txtSupportingFiles\Clause7\Durability\BusinessRecovey\TxnErrorlog_BusinessRecovery_Run1.xltSupportingFiles\Clause7\Durability\BusinessRecovey\TxnErrorlog BusinessRecovery Run2.xltSupportingFiles\Clause7\Durability\BusinessRecovey\TxnReportE BusinessRecovery Run1-20min.xlsSupportingFiles\Clause7\Durability\BusinessRecovey\TxnReportE_BusinessRecovery_Run2-20min.xlsSupportingFiles\Clause7\Durability\BusinessRecovey\TxnReport_BusinessRecovery_Run1-20min.xltSupportingFiles\Clause7\Durability\BusinessRecovey\TxnReport BusinessRecovery Run1-All.xltSupportingFiles\Clause7\Durability\BusinessRecovey\TxnReport BusinessRecovery Run2-20min.xltSupportingFiles\Clause7\Durability\BusinessRecovey\TxnReport_BusinessRecovery_Run2-all.xltSupportingFiles\Clause7\Durability\BusinessRecovey\TxnStep_BusinessRecovery_Run1.xltSupportingFiles\Clause7\Durability\BusinessRecovey\TxnStep BusinessRecovery Run2.xlt
Durability Data Accessibility SupportingFiles\Clause7\Durability\DataAccessibility\1025k.xmlSupportingFiles\Clause7\Durability\DataAccessibility\app_event.txtSupportingFiles\Clause7\Durability\DataAccessibility\cntb.txtSupportingFiles\Clause7\Durability\DataAccessibility\cnte.txtSupportingFiles\Clause7\Durability\DataAccessibility\Consistency e.outSupportingFiles\Clause7\Durability\DataAccessibility\ERRORLOG.txtSupportingFiles\Clause7\Durability\DataAccessibility\SQL_Server_Configuration.txtSupportingFiles\Clause7\Durability\DataAccessibility\sys_event.txtSupportingFiles\Clause7\Durability\DataAccessibility\TradeRequest cntb.verSupportingFiles\Clause7\Durability\DataAccessibility\trade_cleanup.txtSupportingFiles\Clause7\Durability\DataAccessibility\TxnErrorlog_DataAccessibility-All.xltSupportingFiles\Clause7\Durability\DataAccessibility\TxnReportE_DataAccessibility-5min.xlsSupportingFiles\Clause7\Durability\DataAccessibility\TxnReportE DataAccessibility-data-recovery-20min.xlsSupportingFiles\Clause7\Durability\DataAccessibility\TxnReportE DataAccessibility-log-recovery-20min.xlsSupportingFiles\Clause7\Durability\DataAccessibility\TxnReport_DataAccessibility-5min.xltSupportingFiles\Clause7\Durability\DataAccessibility\TxnReport_DataAccessibility-All.xlt
November 2009 TPC BenchmarkTM E Report 9-8

Table 9.1: Index of Supporting Files (cont.)
9.1. Supporting Files
The Supporting Files contain human readable and machine executable (i.e., able to be performed by the appropriate program without modification) scripts that are required to recreate the benchmark Result. If there is a choice of using a GUI or a script, then the machine executable script must be provided in the Supporting Files. If no corresponding script is available for a GUI, then the Supporting Files must contain a step-by-step description of how to manipulate the GUI. (9.4)
All Supporting Files can be found in the SupportingFiles Directory.
Clause Description PathnameSupportingFiles\Clause7\Durability\DataAccessibility\TxnReport_DataAccessibility-data-recovery-20min.xltSupportingFiles\Clause7\Durability\DataAccessibility\TxnReport_DataAccessibility-log-recovery-20min.xltSupportingFiles\Clause7\Durability\DataAccessibility\TxnStep DataAccessibility.xlt
Isolation Scripts SupportingFiles\Clause7\Isolation\Scripts\Isolation1 S1.sqlSupportingFiles\Clause7\Isolation\Scripts\Isolation1_S2.sqlSupportingFiles\Clause7\Isolation\Scripts\Isolation1_S3.sqlSupportingFiles\Clause7\Isolation\Scripts\Isolation1 S4.sqlSupportingFiles\Clause7\Isolation\Scripts\Isolation2 S1.sqlSupportingFiles\Clause7\Isolation\Scripts\Isolation2_S2.sqlSupportingFiles\Clause7\Isolation\Scripts\Isolation2_S3.sqlSupportingFiles\Clause7\Isolation\Scripts\Isolation2 S4.sqlSupportingFiles\Clause7\Isolation\Scripts\Isolation3 S1.sqlSupportingFiles\Clause7\Isolation\Scripts\Isolation3_S2.sqlSupportingFiles\Clause7\Isolation\Scripts\Isolation3_S3.sqlSupportingFiles\Clause7\Isolation\Scripts\Isolation4_S1.sqlSupportingFiles\Clause7\Isolation\Scripts\Isolation4 S2.sqlSupportingFiles\Clause7\Isolation\Scripts\Isolation4_S3.sql
Isolation Output SupportingFiles\Clause7\Isolation\Isolation1_S1.verSupportingFiles\Clause7\Isolation\Isolation1_S2.verSupportingFiles\Clause7\Isolation\Isolation1 S3.verSupportingFiles\Clause7\Isolation\Isolation1 S4.verSupportingFiles\Clause7\Isolation\Isolation2_S1.verSupportingFiles\Clause7\Isolation\Isolation2_S2.verSupportingFiles\Clause7\Isolation\Isolation2 S3.verSupportingFiles\Clause7\Isolation\Isolation2 S4.verSupportingFiles\Clause7\Isolation\Isolation3_S1.verSupportingFiles\Clause7\Isolation\Isolation3_S2.verSupportingFiles\Clause7\Isolation\Isolation3 S3.verSupportingFiles\Clause7\Isolation\Isolation4 S1.verSupportingFiles\Clause7\Isolation\Isolation4_S2.verSupportingFiles\Clause7\Isolation\Isolation4_S3.ver
Clause 8 60-day Space Calculation SupportingFiles\Clause8\tpce space.xls
November 2009 TPC BenchmarkTM E Report 9-9

November 2009 TPC BenchmarkTM E Report 9-10

November 2009 TPC BenchmarkTM E Report A-1
Appendix A - Third Party Price Quotations
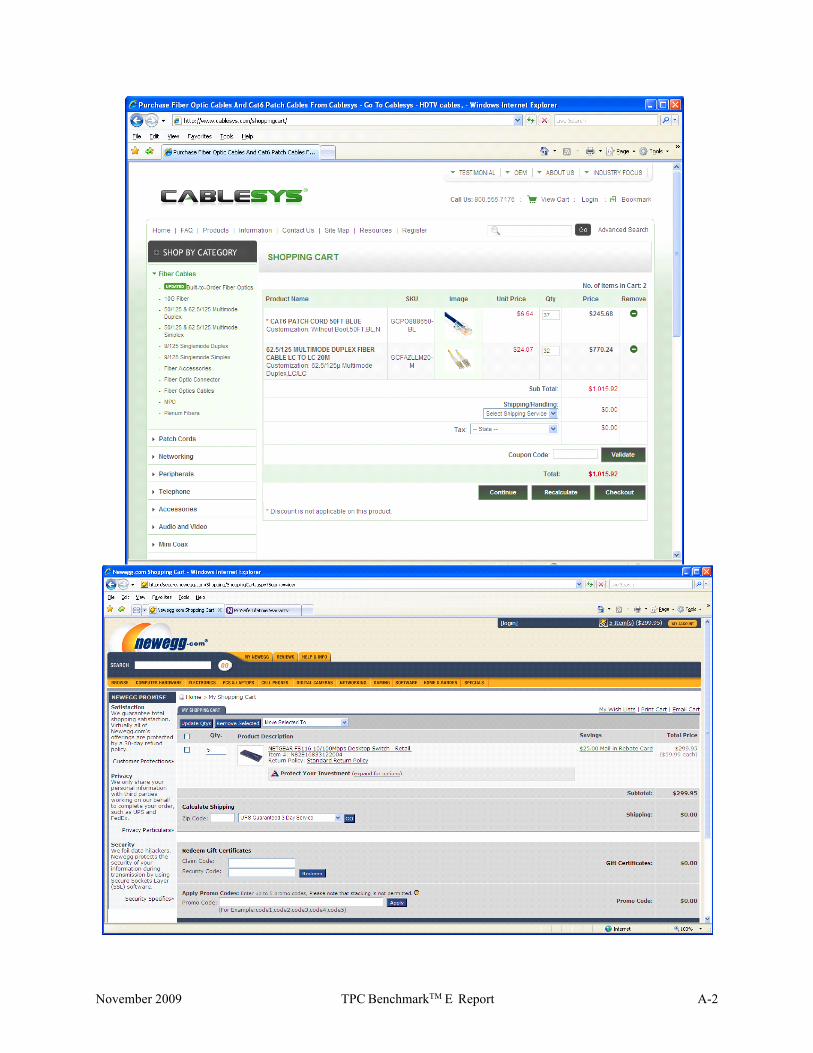
November 2009 TPC BenchmarkTM E Report A-2

November 2009 TPC BenchmarkTM E Report A-3

November 2009 TPC BenchmarkTM E Report A-4