toxicity of chemically dispersed crude oil to herring embryos
TRANSCRIPT

TOXICITY OF CHEMICALLY DISPERSED CRUDE OIL TO
HERRING EMBRYOS
by
Colleen Diane Greer
A thesis submitted to the Department of Biology
In conformity with the requirements for
the degree of Master of Science
Queen‟s University
Kingston, Ontario, Canada
(May, 2011)
Copyright © Colleen Diane Greer, 2011

ii
Abstract
The use of chemicals to disperse oil spills raises concerns for organisms living
below the surface of the water. While decreasing the surface area of the slick, chemical
dispersants increase the amount of oil in the water column, the surface-to-volume ratio of
droplets, the partitioning to water of the toxic constituents of oil, and the bioavailability
of oil to pelagic and benthic organisms. Chemical dispersion can increase the exposure
to polycyclic aromatic hydrocarbons (PAH) by 100-fold. As a model for a full-scale spill
at sea, a wave tank was used to simulate chemical and natural dispersion of spilled oil to
determine if the concentrations of chemically dispersed oil were sufficient to cause
toxicity to embryos of Atlantic herring (Clupea harengus). While the hydrocarbon
concentrations of dispersed oil from the wave tank were not large, the exposure response
relationship was consistent with that of laboratory-prepared dispersed oil. Additionally,
the toxicities of chemically dispersed oil prepared in the lab to Pacific (Clupea pallasi)
and Atlantic herring were compared to ensure that the wealth of literature available on
Pacific herring could be used for assessing the risk of oil exposure to Atlantic herring.
Exposures to low concentrations of dispersed oil for short periods (2.4 to 24 h)
consistently increased the incidence of blue sac disease, and decreased the percentage of
normal embryos at hatch, indicating that even brief exposures to oil could be detrimental
to the survival and recruitment of herring.

iii
Co-Authorship
Chapters 2 and 3 were co-authored by Dr. Peter Hodson. Dr. Hodson contributed
to experimental design, data analysis and interpretation, and editing. Chapter 2 was also
co-authored by Dr. Zhengkai Li, Thomas King, and Dr. Kenneth Lee, who contributed to
experimental design and operation of the wave tank.

iv
Acknowledgements
It‟s funny how things turn out. In April of 2008, I was leaving Kingston with a
BScH of Biology in my back pocket and determined never to return to Kingston. A year
later and apparently wiser, I came back, and what a whirlwind it has been! Returning has
certainly been the best decision I have ever made.
First and foremost, I would like to thank my supervisor, Peter Hodson. Thank
you for the wonderful opportunity to study in your lab. Your guidance and patience has
taught me more than I could have imagined; both about science and about myself.
My adventures would have been boring without the support of Ken Lee. Thank
you for allowing me into your lab to complete my experiments and thank you so very
much for giving me the opportunity to travel to the Gulf with your team during the oil
spill. And to the rest of the COOGER team, thank you for your encouragement and
support. Everyone was always pulling for a successful experiment!
To my committee members, Stephen Brown and Shelley Arnott, thank you for
your guidance and sharing your knowledge.
Thank you to everyone in the Hodson lab for your support and words of wisdom!
Jon, it was your encouragement that persuaded me to become a “Hodsonite” and I am
happy to have an old friend in the lab to reminisce with! To everyone else, including the
Environmental Studies office staff, thanks for the laughs and helping me escape from
thesis-izing! My trips to Tim Horton‟s will never be the same!
To all the assistants I have had over the last two years and who probably never
want to see a carton of Sparkleen or a jam jar again, thank you so much for the countless

v
hours of help! Michelle, Andrew, Chloe, and Claire, you were all there to cheer on the
herring eggs in hopes that they would finally fertilize! I would not have made it through
the experiments without your help.
And lastly to my family. Thank you for always believing in me and never letting
me give up, even when I thought my experiments would never work!
Thank you to everyone! I could not have done it without your love and support. I
have been daydreaming about the future with excitement and courage!
Colleen

vi
Table of Contents
Abstract ............................................................................................................................................ ii
Co-Authorship ................................................................................................................................ iii
Acknowledgements ......................................................................................................................... iv
List of Figures ................................................................................................................................. ix
List of Tables .................................................................................................................................. xi
List of Abbreviations ..................................................................................................................... xii
Chapter 1 Introduction ..................................................................................................................... 1
1.1 Crude Oil ................................................................................................................................ 2
1.2 Chemical Dispersants ............................................................................................................. 4
1.3 Polycyclic Aromatic Hydrocarbons (PAH) and Bioavailability ............................................ 6
1.4 Early Life Stages of Fish ...................................................................................................... 10
1.5 Herring ................................................................................................................................. 11
1.6 Modeling Oil Spills .............................................................................................................. 15
1.7 Purpose ................................................................................................................................. 17
1.8 References ............................................................................................................................ 18
1.9 Figures ................................................................................................................................. 24
Chapter 2 Toxicity of crude oil dispersed in a wave tank to Atlantic herring (Clupea harengus)
embryos .......................................................................................................................................... 28
2.1 Abstract ................................................................................................................................ 28
2.2 Introduction .......................................................................................................................... 29
2.3 Methods ............................................................................................................................... 33
2.3.1 Wave Tank .................................................................................................................... 33
2.3.2 Test Species .................................................................................................................. 34
2.3.3 Experimental Setup ....................................................................................................... 34
2.3.4 Test Solutions ................................................................................................................ 35
2.3.5 Design ........................................................................................................................... 36
2.3.6 Water Chemistry ........................................................................................................... 37
2.3.7 Statistics ........................................................................................................................ 39
2.4 Results .................................................................................................................................. 40
2.5 Discussion ............................................................................................................................ 43

vii
2.6 Conclusion ........................................................................................................................... 51
2.7 Acknowledgements .............................................................................................................. 51
2.8 References ............................................................................................................................ 52
2.9 Figures ................................................................................................................................. 56
Chapter 3 Oil Toxicity: A Comparison Between Pacific and Atlantic Herring ............................. 62
3.1 Abstract ................................................................................................................................ 62
3.2 Introduction .......................................................................................................................... 63
3.3 Methods ............................................................................................................................... 66
3.3.1 Test Species .................................................................................................................. 66
3.3.2 Experimental Setup ....................................................................................................... 66
3.3.3 Test Solutions ................................................................................................................ 66
3.3.4 Design ........................................................................................................................... 67
3.3.5 Water Chemistry ........................................................................................................... 67
3.3.6 Statistics ........................................................................................................................ 68
3.4 Results .................................................................................................................................. 69
3.5 Discussion ............................................................................................................................ 71
3.6 Conclusion ........................................................................................................................... 75
3.7 Acknowledgements .............................................................................................................. 76
3.8 References ............................................................................................................................ 76
3.9 Figures ................................................................................................................................. 79
Chapter 4 General Discussion and Summary ................................................................................ 83
4.1 Overview .............................................................................................................................. 83
4.2 Significance of Findings and Future Work .......................................................................... 86
4.3 Summary .............................................................................................................................. 88
4.4 References ............................................................................................................................ 89
Appendix A Physical and Chemical Characteristics of Oils .......................................................... 92
Appendix B Standard Operating Procedure – Laboratory Preparation of WAF and CEWAF ...... 97
Appendix C Wave Tank............................................................................................................... 100
Appendix D Standard Operating Procedure – Analysis of Saline Water Samples Containing Oil
by Fluorescence ........................................................................................................................... 105
Appendix E Photos of Hatched Atlantic Herring Embryos ......................................................... 109
Appendix F Exposure Time ......................................................................................................... 110

viii
Appendix G Equations of Non-linear Regressions ...................................................................... 111

ix
List of Figures
Figure 1-1: Extent of oil spread from Exxon Valdez crash site.. ................................................... 24
Figure 1-2: Pacific herring spawning sites overlap with oiled areas resulting from the Exxon
Valdez Oil Spill…………………………………………………………………………………...25
Figure 1-3: Application of a chemical dispersant onto an oil slick. ............................................. 26
Figure 1-4: Atlantic herring spawning beds overlap with tanker routes transporting crude oil in
Eastern Canada…………………………………………………………………………………...27
Figure 2-1: Hatched Atlantic herring embryos. ............................................................................ 56
Figure 2-2: The concentration of petroleum hydrocarbons in test solutions at different loadings of
the water accommodated fractions (WAF) and the chemically-enhanced water accommodated
fractions (CEWAF).. ...................................................................................................................... 57
Figure 2-3: Toxicity of the water accommodated fraction (WAF) and chemically-enhanced water
accommodated fraction (CEWAF) of Alaska North Slope Crude (ANSC) and Arabian Light
Crude (ALC) oils prepared in the lab............................................................................................. 58
Figure 2-4: The effect of exposure time and petroleum hydrocarbon concentration on the
percentage of normal embryos at hatch exposed to lab-prepared Alaska North Slope Crude
(ANSC) and Arabian Light Crude (ALC). ..................................................................................... 59
Figure 2-5: Wave tank data showing the movement of fluorescing hydrocarbons in Alaska North
Slope Crude oil (ANSC) through the tank over time, and the change in percent normal with
increasing concentration of the chemically-enhanced water accommodated fraction (CEWAF) of
ANSC and Arabian Light Crude oil (ALC) exposures drawn from the tank.. ............................... 60
Figure 3-1: The concentration of petroleum hydrocarbons in test solutions at different loadings of
the water accommodated fraction (WAF) and the chemically-enhanced water accommodated
fraction (CEWAF) of Alaska North Slope Crude (ANSC) and Medium South American Crude
(MESA) oils. .................................................................................................................................. 79
Figure 3-2: Toxicity of the water accommodated fraction (WAF) and chemically-enhanced water
accommodated fraction (CEWAF) of Alaska North Slope Crude (ANSC) …………………….80

x
Figure 3-3: Toxicity of the water accommodated fraction (WAF) and chemically-enhanced water
accommodated fraction (CEWAF) of Alaska North Slope Crude (ANSC) and Medium South
American Crude (MESA) oils to Pacific herring embryos. ........................................................... 81
xi
List of Tables
Table 2-1: The effect of exposure time on the toxicity of the chemically-enhanced water
accommodated fraction (CEWAF) of Alaska North Slope Crude (ANSC) and Arabian Light
Crude (ALC) oils.. ......................................................................................................................... 61
Table 3-1: The toxicity of Medium South American Crude (MESA), Alaska North Slope Crude
(ANSC), and Arabian Light Crude (ALC) oils to Atlantic and Pacific herring embryos .............. 82

xii
List of Abbreviations
A. herring Atlantic herring
ANSC Alaska North Slope Crude oil
ALC Arabian Light Crude oil
BIO Bedford Institute of Oceanography
BSD Blue sac disease
CEWAF Chemically-enhanced water accommodated fraction
CI 95% Confidence intervals
CYP1A Cytochrome P450A
EC50 Median effective concentration
EC50%Hatch Median effective concentration of percent hatch
EC50%Normal Median effective concentration of percent normal
EC50SI Median effective concentration of the BSD Severity Index
GC-FID Gas Chromatography-Flame Ionized Detection
GC-MS Gas Chromatography-Mass Spectrometry
LC50 Median lethal concentration
MESA Medium South American Crude oil
P. herring Pacific herring
PAH Polycyclic aromatic hydrocarbons
tPAH Total polycyclic aromatic hydrocarbon concentration
WAF Water accommodated fraction

1
Chapter 1
Introduction
The Exxon Valdez Oil Spill, the 2nd
largest spill in US Maritime history, occurred
on March 24, 1989 (Paine et al. 1996). Approximately 41 million litres of Alaska North
Slope crude oil were spilled in Prince William Sound, Alaska, coating 1750 km of
shoreline (Figure 1-1; Bragg et al. 1994). Immediately following the spill, conditions
were ideal for recovery, but emergency response was not prepared (Ginsburg 1993). An
argument about whether or not to use chemical dispersants, lead primarily by
ExxonMobil with the desire to disperse all oil spilled, further delayed cleanup (Ginsburg
1993). Now dispersants are stockpiled, but approval for use is only granted if mechanical
recovery (booming, skimming) is deemed inefficient (PWSRCAC 1999; PWSRCAC
2009).
As oil exploration, development, and transport expand into more remote and
inaccessible regions of the world, the potential for large-scale spills and ecological
damage increases. The more remote the area, the harder it would be to get the necessary
equipment into the vicinity for spill cleanup and the larger the expense (Etkin 1999).
This will encourage spill response to rely heavily on chemical dispersants to mitigate the
effects of the oil as efficiently and economically as possible. Unfortunately, there is still
considerable controversy surrounding the use of chemical dispersants. Dispersants are
much less toxic since the tragic events of the Torrey Canyon spill (1967), where the use

2
of dispersants caused widespread mortality of benthic organisms, but have also become
more efficient, allowing a greater quantity of oil to enter the water column. Although
chemical dispersants spare surface-dwelling organisms and shorelines from oiling, they
induce a surge of oil below the surface, increasing the potential for toxicity to organisms
inhabiting these areas. There is a deficiency in the knowledge available to oil spill
responders to enable them to make educated decisions about where and when to use
chemical dispersants.
This chapter will provide the knowledge necessary to understand the concept of
oil toxicity to early life stages of fish, and introduce the main thesis, where I will assess
the toxicity of chemically dispersed and un-dispersed crude oil to Atlantic and Pacific
herring embryos.
1.1 Crude Oil
Crude oil is a fossil fuel naturally generated from geological and geochemical
processes. The threat oil poses to the environment involves not only the volume of oil
spilled and the location of the spill, but also the chemical composition of the oil and the
proportion of its toxic components. Most crude oils consist of about 97% hydrocarbons or
related compounds (saturates, aromatics, resins, and asphaltenes) and the remaining 3% is
composed of nitrogen, sulphur, and oxygen (NRC 2003). While oil sits on the surface of
the water and is being naturally dispersed by waves and currents, compounds will
partition into the water to a degree proportional to their solubility in water. This produces
a water accommodated fraction of oil in water (WAF). Natural dispersion also causes the

3
oil to weather, whereby the physical and chemical characteristics of the oil are altered;
the oil becomes thicker, and lighter, more volatile compounds are released.
BTEX (benzene, toluene, ethylbenzene, and xylene) are monoaromatic
compounds that are highly volatile, acutely toxic, and cause narcosis, but the high
volatility of BTEX decreases the potential for harm as the oil weathers (Barron et al.
2004). Asphaltenes and resins are polar compounds bonded with sulphur, nitrogen, or
oxygen and have a significant effect on the behaviour of oil (NRC 2003). The higher the
composition of asphaltenes and other high molecular weight compounds, the more
viscous the oil is, which can pose many negative physical effects on organisms (e.g.
smothering, skin contact effects), as well as increase the persistence of oil in the
environment and along shorelines (NRC 2003). Polycyclic aromatic hydrocarbons
(PAH) compose the most toxic component of oil, causing chronic toxicity, and include
known carcinogens (Ramachandran et al. 2004).
With expansion of the oil and gas industry there is an increasing number of
tankers transporting oil throughout the world. In response, increased regulations on how
oil can be transported have led to a significant decrease in the number of large tanker-
related spills over the years (1970-2009), but small-scale spills remain inconsistently
documented (ITOPF 2010). Extraction, transportation, and consumption can all release
oil in great quantities to the environment as a result of human activities, and natural seeps
continuously release low levels of hydrocarbons (NRC 2003). It is estimated that more

4
than nine million barrels of petroleum are released into the environment worldwide
annually (NRC 2003).
1.2 Chemical Dispersants
Oil spill cleanup depends on a number of factors, with the primary concern being
the amount of visible oil. Whether or not the oil will reach the shoreline is of utmost
importance, since the general consensus is that this is where it would cause the most
long-term damage and be the most difficult to clean up (Etkin 1999). Before cleanup is
initiated, a decision must be made as to which method will minimize the negative impacts
of the oil. For chemical dispersants, there is a trade-off between the shoreline and surface
dwelling organisms, and organisms that live within the water column.
Chemical dispersants are composed of surfactants and solvents. The surfactants
contain both a lipophilic and a hydrophilic end, which effectively decrease the interfacial
tension between the oil and water. This allows the oil to break into small oil-surfactant
micelles that can more easily be diluted by wave action and currents than the original oil
(Fiocco and Lewis 1999). The surfactants stabilize the oil droplets to prevent resurfacing
and recoalescence with the oil (Fiocco and Lewis 1999). In this way, oil droplets can
spread throughout the water column, quickly diluting the concentration of total oil and
becoming more bioavailable to hydrocarbon-degrading bacteria.
During the events of the Torrey Canyon spill, the solvents used in dispersants
were aromatic based (e.g. benzene), rendering the dispersant highly toxic. Modern
dispersants use solvent systems that allow a higher proportion of surfactant per volume of

5
dispersant, decreasing the required application rate for successful dispersion (Fiocco and
Lewis 1999). A commonly used dispersant today and the only dispersant stockpiled for
use in Canada is Corexit 9500A (contains: dioctyl sodium sulphosuccinate (active
ingredient); sorbitans; butanedioic acid, 2-sulfo-, 1,4-bis(2-ethylhexyl) ester, sodium salt
(1:1); propanol; petroleum distillates). The US Environmental Protection Agency has
recommended a dispersant to oil ratio of 1:10 to 1:50 for Corexit 9500A which is
reported to be up to 45.3% effective at dispersing Prudhoe Bay Crude oil (USEPA
Technical Product Bulletin #D-4). The effectiveness of Corexit 9500A was measured
using the swirling flask dispersant effectiveness test and calculated from the oil
remaining after dispersant application.
The ability of oil to be dispersed is a function of its physical and chemical
properties. Heavy oils are highly viscous, making it difficult for the dispersant to
penetrate and break the oil into smaller droplets, and light oils are very buoyant, requiring
high doses of dispersant to break the oil into small enough droplets to overcome
buoyancy (Venosa et al. 2005). Water-based dispersants are less effective and have a
lower affinity to oil, but might be successful at dispersing lighter oils (Fiocco and Lewis
1999).
Before a dispersant is applied, oil will form a slick on the surface of the water.
Few compounds in oil will readily mix into the water, as crude oil is generally immiscible
in water. As chemical dispersants are applied and small droplets of oil in water are
formed, the surface area of oil in water greatly increases. This allows more compounds

6
to reach their limits of solubility in the water and increases the rate of partitioning,
forming the chemically-enhanced water accommodated fraction (CEWAF; Figure 1-3).
Compared to undispersed crude oil, chemical dispersion of oil markedly increases
the water concentration of polycyclic aromatic hydrocarbons (PAH), particularly high
molecular weight PAH, below the water surface (Couillard et al. 2005; Cohen et al.
2001). Application of dispersants occurs under the premise that oil will not reach the
shoreline and will be quickly diluted into the water column to concentrations below toxic
levels. However, if the concentration of PAH is high enough, even for a short period of
time, it could induce toxicity in early life stages of fish and other organisms (Wolfe et al.
1994).
1.3 Polycyclic Aromatic Hydrocarbons (PAH) and Bioavailability
Polycyclic aromatic hydrocarbons consist of two or more fused benzene rings and
occur naturally in crude oil (Wang and Fingas 2003). Three to five-ring alkyl-PAH
comprise the most toxic fraction of oil (Khan 2007; Hodson et al. 2007) and are known to
cause dioxin-like signs of toxicity in early life stages of fish (Billiard et al. 1999).
Heavier oils contain a higher percentage of aromatics than their light counterparts
(Reviewed by Incardona et al. 2008; Appendix A). For example, the Bunker C fuel oil
spilled during the Cosco Busan spill (2007) has three times more PAH per unit mass than
the medium crude spilled by the Exxon Valdez (Alaska North Slope Crude; Reviewed by
Incardona et al. 2008).

7
The bioavailability of oil is a function of the compounds present in the oil and the
portion of chemicals that are in a form that can be absorbed by the organism and can
reach the sites of toxic action (Rand et al. 1995). Additionally, biotic and abiotic
transformations, such as metabolism, hydrolysis, oxidation, and photolysis, have the
potential to increase the availability and toxicity of chemicals (Rand et al. 1995). The
composition of PAH within the oil determines toxicity, as some PAH are more toxic than
others and if found in high quantities would contribute greatly to toxicity (Carls et al.
1999). In fact, the larger the quantity of high molecular weight PAH (≥ 3 rings) the
greater the toxicity to Pacific herring embryos (Carls et al. 1999).
Carls et al (2008) tested the bioavailability of oil to zebrafish embryos and found
that the dissolved PAH fraction is most toxic. Only 16% of mechanically-dispersed
Alaska North Slope Crude (ANSC) oil dissolved in water and was bioavailable to
zebrafish, and total PAH (tPAH) concentrations were up to 17 times less in the dissolved
PAH exposure compared to the exposure containing oil droplets (Carls et al. 2008). This
shows that bioavailability of oil to fish embryos is consistent with hydrocarbon
compounds that are soluble in water. In contrast, phytane, a highly insoluble tracer
compound for oil, was present in the droplet exposure, but not the dissolved oil exposure
(Carls et al. 2008).
Retene (7-isopropyl-1-methyl phenanthrene) is C-4 alkyl phenanthrene and
chronic exposure of early life stages of fish results in signs of Blue Sac Disease (BSD)
and the induction of cytochrome P450A (CYP1A; Billiard et al. 1999). Exposure to

8
whole crude oil, of which retene may be a component, can also induce CYP1A. As such,
retene can be used as a model for oil exposure and a positive control for BSD
(Ramachandran et al. 2004).
Retene induces the production of the CYP1A protein by binding to the aryl
hydrocarbon receptor (AhR) protein in the liver (Billiard et al. 2002). CYP1A catalyzes
oxygenation reactions, which might generate reactive oxygen species and other reactive
byproducts, and could result in oxidative stress and BSD (Halliwell and Gutteridge
1999). Others have found that chronic exposure of embyronic rainbow trout to retene
increases toxicity (signified as BSD and mortality) in a concentration-dependent manner
and that the metabolites may be the toxic component (Billiard et al. 1999; Hodson et al.
2007). In addition, there is evidence for a wide range of toxic effects among structurally
similar PAH (Turcotte et al. 2011). This could account for various toxicities among oils,
which are complex mixtures that contain a wide variety of PAH and other compounds.
Ramachandran et al. (2004) found that induction of CYP1A was greatest when
rainbow trout were exposed to chemically dispersed oil versus non-dispersed oil and
greatest for dispersed oils containing a higher percentage by weight of PAH, suggesting
that CEWAF contains larger concentrations of PAH with higher toxicity than WAF. By
increasing the concentration of dissolved PAH, chemical dispersion increases the
bioavailability of oil to early life stages of fish.
Heintz et al. (1999) have demonstrated that PAH such as phenanthrene and
chrysene are persistent in the environment, extending the potential period for toxicity.

9
Phenanthrenes and chrysenes are the most toxic, relatively abundant PAH in Alaska
North Slope Crude oil (ANSC), the oil spilled during the Exxon Valdez spill. Stranded
oil that has been relatively protected from weathering can persist and leach for years,
while continuously exposing organisms in the vicinity (Short and Harris 1996).
Blue sac disease is a chronic, non-contagious syndrome exhibited in early life
stages of fish that have been exposed to persistent contaminants such as PAH (Wolf
1957; Brinkworth et al. 2003). It is believed that BSD in early life stages of fish is a
result of oxidative damage and membrane destabilization (Carls et al. 1999). Signs
include, but are not limited to, pericardial edema, yolk sac edema, spinal curvature,
craniofacial malformations, fin rot, and CYP1A induction. Edema is the most sensitive
sign of toxicity in pink salmon embryos (Marty et al. 1997), zebrafish embryos
(Incardona et al. 2009), and herring embryos (Carls et al. 1999) exposed to PAH, and
often leads to mortality. Edema can reduce cardiac output, impede circulation, and
negatively affect swimming ability (Carls et al. 1999). Spinal curvature is also an
important sign of toxicity because it can occur in varying degrees and inhibits swimming
ability, reducing the capacity to forage for food and escape predators. Addtionally, BSD
could increase the susceptibility of fish to disease and parasitism, reduce movement and
feeding ability, and eventually lead to mortality (Heintz et al. 1999). Severe deformities
would hinder an embryo‟s ability to forage for food, escape predators, swim unimpeded,
and ultimately be reproductively viable (Kocan et al. 1996; Smith and Cameron 1979).
10
1.4 Early Life Stages of Fish
Chemically dispersed crude oil is 50 to 1000 times more toxic than un-dispersed
oil, and older, more toxic dispersants (e.g. Finasol SC) can further increase toxicity
(Linden 1975; McIntosh et al. 2010; Schein et al. 2009). Additionally, newly fertilized
and newly hatched fish embryos are the most sensitive to oil contamination (McIntosh et
al. 2010). Damages to fish eggs, embryos, and larvae are more threatening to the future
of the fish population and fishing industry than injury to adult fish because the young
represent future recruitment to the population.
Pink salmon (Oncorhynchus gorbuscha) were the most economically important
fish species in Prince William Sound during the Exxon Valdez oil spill and all life stages,
including spawning adults, were exposed to oil in the area (Marty et al. 1997). Pink
salmon spawn in the intertidal region of Prince William Sound, which represented the
most heavily oiled area in the region (Marty et al. 1997). Weidmer et al. (1996) found
elevated CYP1A activity, a known sign of oil exposure in fish, in pink salmon embryos,
which indicated exposure for up to 2 years following the spill. Additionally, Bue et al.
(1996) found high levels of egg mortality in oiled streams around Prince William Sound
from 1989 to 1993, and developmental impairment in salmon fry was reported at initial
concentrations of 4.4 µg/L tPAH (Marty et al. 1997). Exxon Valdez oil at concentrations
representative of the environment can be lethal to pink salmon embryos at concentrations
as low as 1 µg/L tPAH (Heintz et al. 1999).

11
1.5 Herring
Herring are especially sensitive to oil exposure (Carls et al. 1999). Just as Pacific
herring (P. herring) were starting to spawn in Prince William Sound, Alaska, the Tanker
Vessel (T/V) Exxon Valdez collided with Bligh Reef, spilling its load of Alaska North
Slope Crude oil (ANSC; Brown et al. 1996). Prior to the Exxon Valdez oil spill, P.
herring (Clupea pallasi) were observed to spawn along 106-273 km of the Prince
William Sound shoreline and the population peaked at over 110,000 metric tons in 1989
(Figure 1-2; Funk 1994; Brown and Carls 1998). In 1994, the spawning area decreased
to 12 km, marking a massive population crash and leading to the closure of the roe
herring fishery (Funk 1994). A Natural Resource Damage Assessment estimated that the
spill directly caused a 52% reduction in herring productivity (Brown et al. 1996). By
1997 the population had only recovered to 34,100 metric tons, but a limited commercial
fishery in Prince William Sound re-opened (Brown and Carls 1998). Although there is
evidence of a link between the abrupt population decline and over-population (Pearson et
al. 1999), oil is believed to be the leading cause, corroborated by lab-scale tests showing
the toxicity of crude oil to P. herring embryos (Paine et al. 1996; Carls et al. 1999).
There is a positive correlation between oil-exposed areas in Prince William Sound
directly following the Exxon Valdez oil spill and physical deformities in herring embryos,
compared with un-oiled areas (Hose et al. 1996).
Herring (Clupea sp.) are more at risk of oil exposure than some other species
because the eggs are sessile when laid, sticking to stationary surfaces like kelp, and

12
leaving the embryos vulnerable to an oil spill (Smith and Cameron 1979). Herring are a
significant species both economically for the fishing industry and ecologically, as a vital
component of the local food web. Pacific herring and many populations of Atlantic
herring (A. herring; Clupea harengus) spawn in shallow intertidal and subtidal (0-20 m)
areas, and Baltic herring (Clupea harengus membras) frequent the upper 10 m of the
water column (Haegele and Schweigert 1985; Smith and Cameron 1979; Ackefors 1974).
Pacific herring normally spawn in sheltered estuarine areas where oil is likely to strand
and persist as a result of reduced wave action (Haegele and Schweigert 1985).
Additionally, CEWAF is more likely to reach shallow depths where herring generally
spawn.
Atlantic herring consist of both Spring and Fall-spawning stocks, while P. herring
prefer Winter-Spring spawning (Haegele and Schweigert 1985). Personal observations of
A. herring have indicated that Spring spawners are less fecund than Fall spawners and
that Fall spawning occurs over a larger area and longer time period, as not all fish on the
spawning grounds are “ripe and running” at the same time. It has been suggested that
Fall spawning herring are more fecund because of a high mortality rate of newly hatched
embryos and larvae during the first winter (Liamin 1959). During the Spring spawn,
lower fecundity could be a result of poorer food availability over the winter and lower
predation risk (Cushing 1967; Kerr and Dickie 1985). Additionally, A. herring spawn in
waters ranging from 0.5 – 19.0 ºC and from “virtually freshwater” to 35 ppt salinity

13
(summarized in Haegele and Schweigert 1985). Higher water temperatures generally
decrease the time to hatch, resulting in smaller hatchlings (Alderdice and Velson 1971).
Herring are most sensitive to oil exposure immediately following fertilization,
specifically during the blastula and gastrula stages of embryonic development, as
determined by pulse exposures (McIntosh et al. 2010; Kocan et al. 1996). Embryos
exposed within the first 24 - 48 h of development showed a 40% decrease in hatching
success, while embryos exposed beginning 72 h post-fertilization did not (Kocan et al.
1996). This stage-specific sensitivity may relate to damage to the anterior neural plate
during gastrulation, when embryos are particularly susceptible to teratogenesis, and
exposure to chemicals that affect DNA synthesis or integrity (Rogers and Kavlock 2007).
Carls et al. (1999) found that low concentrations of ANSC caused significant lethal and
sublethal effects on Pacific herring embryos, including genetic damage, malformations,
reduced swimming ability, earlier onset of hatch, and reduced growth. Exposures to
water containing 0.4 µg/L tPAH of highly weathered oil and consisting mainly of high
molecular weight PAH induced sublethal effects in the embryos, while 0.7 µg/L tPAH
induced genotoxicity (Carls et al. 1999). Edema was primarily responsible for mortality
in the embryos (Carls et al. 1999), indicating that it has the greatest effect on survival in
oil-exposed fish. Both edema and spinal curvature inhibited swimming and feeding
ability, which also indirectly leads to death (Carls et al. 1999).
Immediately following the Exxon Valdez Oil spill, concentrations of tPAH were
up to 6.24 µg/L in open water and concentrations of at least 1.59 µg/L tPAH persisted for
14
five weeks (Short and Harris 1996). Additionally, dissolved PAH concentrations were
found to a depth of 25 m in Prince William Sound and ranged from 0.9 to 6.2 µg/L near
heavily oiled beaches immediately following the spill (Short and Harris 1996). However,
Carls et al. (1999) observed toxicity in Pacific herring embryos exposed to concentrations
as low as 0.4 µg/L tPAH, indicating that conditions to observe embryotoxicity to Pacific
herring were suitable in Prince William Sound. The Alaskan guidelines for acceptable
levels of total aromatic hydrocarbons in water were set at 10 µg/L in 2009, significantly
higher than those observed to cause toxicity to herring (State of Alaska Quality Standard
Regulations 18 AAC 70, September 19, 2009).
Pacific herring were also affected in San Francisco Bay following the Cosco
Busan oil spill in 2007. The spill corresponded with herring spawning events and oil
coated many of the spawning grounds in the Bay (Incardona et al. 2008). In an attempt
to quantify the percentage of embryos that would be lost from oil exposure, embryos
were monitored for deformities upon hatch (Incardona et al. 2008). Laboratory and field
testing confirmed toxic effects from oil exposure, as indicated by signs of BSD
(Incardona et al. 2008).
Much research has been published on the toxicity of crude oil to Pacific herring,
but there is a lack of data available for Atlantic herring. Coincidently, Atlantic herring
spawning grounds (Stephenson et al. 2009) overlap with tanker routes monitored by the
International Tanker Owners Pollution Federation (ITOPF) where oil is transported
(ITOPF 2011) through the Eastern seaboard of North America (Figure 1-4). There are

15
many individual stocks of Atlantic herring throughout the northeastern and northwestern
Atlantic, each with different spawning times and locations (Iles and Sinclair 1982;
Cushing 1969). For the purposes of this thesis, we will focus on herring within the
northwestern Atlantic, specifically those spawning around Nova Scotia and New
Brunswick.
McIntosh et al. (2010) also studied Atlantic herring spawning near Nova Scotia.
They found gamete fertilization and newly fertilized embryos to be the most sensitive life
stages to oil exposure, with 1 h EC50s approximately equal to 21 mg/L and 100 mg/L
tPAH of MESA CEWAF, respectively; the 24 h EC50 of newly fertilized embryos was
8.5 mg/L tPAH. Often out of convenience, toxicity testing begins 24 h post-fertilization,
omitting the most sensitive stages of development and underestimating toxicity. With
this in mind, McIntosh et al. (2010) emphasized the need for more research on the
sensitive life stages of fish under conditions and for durations that represent possible real-
world scenarios.
1.6 Modeling Oil Spills
Researchers can model oil spills to determine dispersant efficacy and toxicity.
These methods can range from simple bench-top mixing systems to large scale in situ
spill experiments. Laboratory preparation methods allow for consistency and
reproducibility among experiments, as well as a controlled environment, but may not be
realistic because preparation in the lab does not take into account variable mixing energy,
currents, or wind. The laboratory method utilized for the following experiments is based

16
on the Chemical Response to Oil Spills: Ecological Research Forum (CROSERF) method
and reported elsewhere (Singer et al. 2000; Appendix B).
Preparation of CEWAF in a wave tank allows for a practical intermediate model
between laboratory-prepared CEWAF and a full-scale in situ field experiment, which is
very expensive and uncommon. In contrast to laboratory studies, preparation of CEWAF
in a wave tank integrates mixing energy and current effects, in an attempt to simulate the
natural environment (Li et al. 2009). A wave tank at the Bedford Institute of
Oceanography (BIO), Dartmouth, NS has been used to simulate chemically dispersed oil
spills at sea (Li et al. 2008; Li et al. 2009). Within the wave tank, breaking waves are
formed in a reproducible manner, occurring at the same location in the tank with each
wave (Venosa et al. 2005). Breaking waves cause velocity shear, increasing the mixing
energy among the oil, dispersant and water, thereby enhancing both chemical and
mechanical dispersion of the oil (Li et al. 2006) and forming oil-surfactant droplets (Li et
al. 2009).
Most testing and literature show the toxicity of crude oil to fish embryos under
chronic exposure conditions (Couillard et al. 2005; Hose et al. 1996; Paine et al. 1996).
Aside from the recent Deepwater Horizon Oil Spill, oil is rarely released from a spill
source and replenished on a continuous basis in the environment, maintaining the same
concentration of PAH from fertilization to hatch. Dispersant efficacy tests have shown
that hydrocarbon concentrations remain high for a few hours to a few days following a
spill, but not to the extent of a chronic toxicity test (Li et al. 2009). It is beneficial to test

17
a range of exposure times to estimate sublethal and lethal thresholds, and to provide a
more complete view of toxicity in relation to realistic exposure times (Sprague et al.
1969). Standard US Environmental Protection Agency operating procedures for
dispersant toxicity testing are 24, 48 and 96 h acute toxicity experiments (Weber et al.
1993), which are not generally maintained beyond the exposure time and not suitable for
observing the chronic effects associated with acute exposure. To better analyze the effect
of more realistic exposure times on fish, embryos were exposed to both lab-prepared and
wave tank-prepared dispersed oil solutions for exposures ranging from 2.4 to 24 h post-
fertilization. By using an acute sublethal exposure and scoring for toxicity post-hatch, we
can observe the chronic toxicity observed at hatch resulting from a brief exposure
coinciding with fertilization.
1.7 Purpose
The primary goal of this research was to determine if environmentally relevant
exposure scenarios can be replicated in a laboratory setting. Previous research suggests
that Atlantic herring embryos are most sensitive to oil exposure immediately following
fertilization (McIntosh et al. 2010), and environmentally relevant exposure
concentrations and durations have not been thoroughly studied. Most literature examines
the toxicity of oil exposure to Pacific herring embryos, yet oil exploration, exploitation
and transportation also occur around Atlantic herring spawning grounds. Most
importantly, if a spill were to occur near spawning grounds, chemical dispersion of oil
may increase the potential for toxicity. As such, my null hypotheses were: chemical
18
dispersion of oil would not increase the concentration of petroleum hydrocarbons in the
water; the toxicity of CEWAF prepared in a wave tank would not be more toxic than
CEWAF prepared in the lab; CEWAFs prepared from different oils would not differ in
toxicity; exposure duration would not affect toxicity; and Atlantic and Pacific herring
would not respond differently to oil exposure.
1.8 References
Ackefors, H. 1974. In: International Council for the Exploration of the Sea, Council
Meeting 1974. H: 34 (mimeo), Copenhagen.
Alderdice, D.F. and F.P.J. Velsen. 1971. Some effects of salinity and temperature on
early development of Pacific herring (Clupea pallasi). Journal of the Fisheries Research
Board of Canada. 28: 1545-1652.
Barron, M.G., M.G. Carls, R. Heintz, and S.D. Rice. 2004. Evaluation of fish early life-
stage toxicity models of chronic embryonic exposures to complex polycyclic aromatic
hydrocarbon mixtures. Toxicological Sciences. 78:60-67.
Billiard, S.M., K. Querbach, and P.V. Hodson. 1999. Toxicity of retene to early life
stages of two freshwater fish species. Environmental Toxicology and Chemistry. 18:2070-
2077.
Billiard, S.M., M.E. Hahn, D.G. Franks, R.E. Peterson, N. Bols, and P.V. Hodson. 2002.
Binding of polycyclic aromatic hydrocarbons (PAHs) to teleost aryl hydrocarbon
receptors (AHRs). Comparative Biochemistry and Physiology. 133:55-68.
Bragg, J.R., R.C. Prince, E.J. Harner, and R.M. Atlas. 1994. Effectiveness of
bioremediation for the Exxon Valdez oil spill. Nature. 368:413-418.
Brinkworth, L., P. Hodson, S. Tabash, and P. Lee. 2003. CYP1A induction and blue sac
disease in early developmental stages of rainbow trout (Onchorynchus mykiss) exposed to
retene. Journal of Toxicology and Environmental Health Part A. 66:526-646.
Brown, E.D., T.T. Baker, J.E. Hose, R.M. Kocan, G.D. Marty, M.D. McGurk, B.L.
Norcross, and J.W. Short. 1996. Injury to the early life history stages of Pacific herring in
Prince William Sound after the Exxon Valdez oil spill. American Fisheries Society
Symposium. 18:448-462.
Brown, E.D. and M.G. Carls. 1998. Restoration notebook: Pacific herring, Clupea
pallasi. Exxon Valdez Oil Spill Trustee Council, September 1998.

19
Bue, B.G., S. Sharr, S.D. Moffitt, and A.K. Craig. 1996. Effects of the Exxon Valdez oil
spill on pink salmon embryos and pre-emergent fry. Transactions of the American
Fisheries Society. 18:619-627.
Carls, M.G., L. Holland, M. Larsen, T.K. Collier, N.L. Scholz, and J.P. Incardona. 2008.
Fish embryos are damaged by dissolved PAHs, not oil particles. Aquatic Toxicology.
88:121-127.
Carls, M.G., S.D. Rice, and J.E. Hose. 1999. Sensitivity of fish embryos to weathered
crude oil: part I. low-level exposure during incubation causes malformations, genetic
damage, and mortality in larval Pacific herring (Clupea pallasi). Environmental
Toxicology and Chemistry. 18:481-493.
Chen, S., C.S. Zhan, K. Lee, Z. Li, and M. Boufadel. 2008. Modelling of oil droplet
kinetics under breaking waves. In: Oil Spill Response: A Global Perspective. W.F.
Davidson, K. Lee, and A. Cogswell, eds., Proceedings of the NATO CCMS Workshop on
Oil Spill Response, Dartmouth, NS, p.221-236.
Cohen, A.M., D. Nugegoda, and M.M. Gagnon. 2001. The effect of different oil spill
remediation techniques on petroleum hydrocarbon elimination in Australian bass
(Macquaria novemaculeata). Archives of Environmental Contamination and Toxicology.
40:264-270.
Couillard, C.M., K. Lee, B. Légaré, and T.L. King. 2005. Effect of dispersant on the
composition of the water-accomodated fraction of crude oil and its toxicity to larval
marine fish. Environmental Toxicology and Chemistry. 24:1496-1504.
Cushing, D.H. 1967. The grouping of herring populations. Journal of the Marine
Biological Association of the United Kingdom. 47:193-208.
Cushing, D.H. 1969. The regularity of the spawning season of some fishes. ICES Journal
of Marine Science. 33:81-92.
Etkin, D.S. 1999. Estimating cleanup costs for oil spills. 1999 International Oil Spill
Conference. Paper #168.
Funk, F. 1994. Preliminary summary of 1994 Alaska roe sac herring fisheries. Alaska
Department of Fish and Game, Juneau, AK.
Fiocco, R.J. and A. Lewis. 1999. Oil spill dispersants. Pure Applied Chemistry. 71:27-42.
Ginsburg, P. 1993. Then and now: changes since the Exxon Valdez oil spill. Report:
Prince William Sound Regional Citizens‟ Advisory Council, 28pp.
Haegele, C.W. and J.F. Schweigert. 1985. Distribution and characteristics of herring
spawning grounds and description of spawning behavior. Canadian Journal of Fisheries
and Aquatic Sciences. 42:39-55.
Halliwell, B. and J.M.C. Gutteridge. 1999. Free Radicals in Biology and Medicine (3rd
ed.), Oxford University Press Inc., New York, NY, USA.

20
Heintz, R.A., J.W. Short, and S.D. Rice. 1999. Sensitivity of fish embryos to weathered
crude oil: part II. Increased mortality of pink salmon (Oncorhynchus gorbuscha) embryos
incubating downstream from weathered Exxon Valdez crude oil. Environmental
Toxicology and Chemistry. 18:494-503.
Hodson, P.V., K. Qureshi, C.A.J. Noble, P. Akhtar, and R.S. Brown. 2007. Inhibition of
CYP1A enzymes by α-naphthoflavone causes both synergism and antagonism of retene
toxicity to rainbow trout (Oncorhynchus mykiss). Aquatic toxicology. 81:275-285.
Hose, J.E., M.D. McGurk, G.D. Marty, D.E. Hinton, E.D. Brown, and T.T. Baker. 1996.
Sublethal effects of the Exxon Valdez oil spill on herring embryos and larvae:
morphological, cytogenetic, and histopathological assessments, 1989-1991. Canadian
Journal of Fisheries and Aquatic Sciences. 53:2355-2365.
Iles, T.D. and M. Sinclair. 1982. Atlantic herring: stock discreteness and abundance.
Science. 215:627-633.
Incardona, J., G. Ylitalo, M. Myers, N. Scholz, T. Collier, C. Vines, F. Griffin, E. Smith,
and G. Cherr. 2008. The 2007 Cosco Busan oil spill: assessing toxic injury to Pacific
herring embryos and larvae in the San Francisco estuary. Draft Report 04 September
2008. 107pp.
Incardona, J.P., M.G. Carls, H.L. Day, C.A. Sloan, J.L. Bolton, T.K. Collier, and N.L.
Scholz. 2009. Cardiac arrhythmia is the primary response of embryonic Pacific herring
(Clupea pallasi) exposed to crude oil during weathering. Environmental Science and
Technology. 43:201-207.
International Tanker Owners Pollution Federation Limited (ITOPF). 2010. Statistics.
http://www.itopf.com/information-services/data-and-statistics/statistics/index.html.
(Accessed March 2011).
International Tanker Owners Pollution Federation Limited (ITOPF). 2011. WebGIS.
http://www.itopf.com/website/ITOPFWebGIS/viewer.htm. (Accessed April 2011).
Kerr, S.R. and L.M. Dickie. 1985. Bioenergetics of 0+ Atlantic herring Clupea harengus
harengus. Canadian Journal of Fisheries and Aquatic Science. 42:105-110.
Khan, C.W. 2007. Identification of compounds in crude oil that are chronically toxic to
the early life stages of fish. MSc Thesis, Queen‟s University, Kingston, ON, 132pp.
Kocan, R.M., J.E. Hose, E.D. Brown, and T.T. Baker. 1996. Pacific herring (Clupea
pallasi) embryo sensitivity to Prudhoe Bay petroleum hydrocarbons: laboratory
evaluation and in situ exposure at oiled and unoiled sites in Prince William Sound.
Canadian Journal of Fisheries and Aquatic Sciences. 53:2366-2375.
Li, Z., K. Lee, T. King, M.C. Boufadel, and A.D. Venosa. 2008. Assessment of chemical
dispersant effectiveness in a wave tank under regular nonbreaking and breaking wave
conditions. Marine Pollution Bulletin. 56:903-912.

21
Li, Z., K. Lee, T. King, M.C. Boufadel, and A.D. Venosa. 2009. Evaluating crude oil
chemical dispersion efficacy in a flow-through wave tank under regular non-breaking
wave and breaking wave conditions. Marine Pollution Bulletin. 58:735-744.
Li, Z., M.C. Boufadel, A.D. Venosa, and K. Lee. 2006. A wave tank facility to assess
chemical oil dispersant effectiveness as a function of energy dissipation rate. 2006
Interspill Conference, London, England. 12pp.
Liamin, K.A. 1959. Investigation into the life-cycle of summer-spawning herring in
Iceland. U.S. Fish and Wildlife Service, Special Scientific Report No. 327. Pp.166-202.
Linden, O. 1975. Acute effects of oil and oil/dispersant mixture on larvae of Baltic
herring. Ambio. 4:130-133.
Marty, G.D., J.W. Short, D.M. Dambach, N.H. Willits, R.A. Heintz, S.D. Rice, J.J.
Stegeman, and D.E. Hinton. 1997. Ascites, premature emergence, increased gonadal cell
apoptosis, and cytochrome P4501A induction in pink salmon larvae continuously
exposed to oil-contaminated gravel during development. Canadian Journal of Zoology.
75:989-1007.
McIntosh, S., T. King, W. Dongmei, and P.V. Hodson. 2010. Toxicity of dispersed
weathered crude oil to early life stages of Atlantic herring (Clupea harengus).
Environmental Toxicology and Chemistry. 29:1160-1167.
National Research Council (NRC). 2003. Oil in the sea III: inputs, fates, and effects.
National Academies Press, Washington, DC, 265pp.
Paine, R.T., J.L. Ruesink, A. Sun, E.L. Soulanille, M.J. Wonham, C.D.G. Harley, D.R.
Brumbaugh, and D.L. Secord. 1996. Trouble on oiled waters: lessons from the Exxon
Valdez oil spill. Annual Review of Ecology and Systematics. 27:197-235.
Pearson, W.H., R.A. Elston, R.W. Bienert, A.S. Drum, and L.D. Antrim. 1999. Why did
the Prince William Sound, Alaska, Pacific herring (Clupea pallasi) fisheries collapse in
1993 and 1994? Review of hypotheses. Canadian Journal of Fisheries and Aquatic
Sciences. 56:711-737.
PWSRCAC. 1999. Then and now: changes in oil transportation since the Exxon Valdez
spill. Report: Prince William Sound Regional Citizens‟ Advisory Council, 32pp.
PWSRCAC. 2009. Then and now: changes in Prince William Sound crude oil
transportation since the Exxon Valdez oil spill. Report: Prince William Sound Regional
Citizens‟ Advisory Council, 30pp.
Rand, G.M., P.G. Wells, and L.S. McCarty. 1995. Introduction to aquatic toxicology. In:
Fundamentals of Aquatic Toxicology: Effects, Environmental Fate, and Risk Assessment.
G.M. Rand, ed., Taylor & Francis, New York, NY, pp. 3-67.

22
Ramachandran S.D., P.V. Hodson, C.W. Khan, and K. Lee. 2004. Oil dispersant
increases PAH uptake by fish exposed to crude oil. Ecotoxicology and Environmental
Safety. 59:300-308.
Rogers, J.M. and R.J. Kavlock. 2007. Developmental toxicology. In: Casarett and Doull‟s
Toxicology: The Basic Science of Poisons, 7th
edition, McGraw-Hill Professional, 2008,
pp.415-425
Schein, A., J.A. Scott, L. Mos, and P.V. Hodson. 2009. Oil dispersion increases the
apparent bioavailability and toxicity of diesel to rainbow trout (Onchorynchus mykiss).
Environmental Toxicology and Chemistry. 28:595-602.
Short, J.W. and P.M. Harris. 1996. Chemical sampling and analysis of petroleum
hydrocarbons in near-surface seawater of Prince William Sound after the Exxon Valdez
oil spill. American Fisheries Society Symposium. 18:17-28.
Singer, M.M., D. Aurand, G.E. Bragin, J.R. Clark, G.M. Coelho, M.L. Sowby, and R.S.
Tjeerdema. 2000. Standardization of the preparation and quantitation of water-
accommodated fractions of petroleum for toxicity testing. Marine Pollution Bulletin.
40:1007-1016.
Smith, R.L. and J.A. Cameron. 1979. Effect of water soluble fraction of Prudhoe Bay
crude oil on embryonic development of Pacific herring. Transactions of the American
Fisheries Society. 108:70-75.
Sprague, J.B. 1969. Measurement of pollutant toxicity to fish I: bioassay methods for
acute toxicity. Water Research. 3:793-821.
Stephenson, R.L., G.D. Melvin, M.J. Power. 2009. Population integrity and connectivity
in Northwest Atlantic herring: a review of assumptions and evidence. ICES Journal of
Marine Science. 66:1733-1739.
Turcotte, D., P. Akhtar, M. Bowerman, Y. Kiparissis, R.S. Brown, and P.V. Hodson.
2011. Measuring the toxicity of alkyl-phenanthrenes to early life stages of medaka
(Oryzias latipes) using partition-controlled delivery. Environmental Toxicology and
Chemistry. 30:487-495.
Venosa, A.D., V.J. Kaku, M.C. Boufadel, and K. Lee. 2005. Measuring Energy
dissipation rates in a wave tank. In: Proceedings of 2005 International Oil Spill
Conference. Miami, FL. American Petroleum Institute, Washington, DC.
Wang, Z. and M. Fingas. 2003. Development of oil hydrocarbon fingerprinting and
identification techniques. Marine Pollution Bulletin. 47:423-452.
Weber, C.I. 1993. Methods for measuring the acute toxicity of effluents and receiving
waters to freshwater and marine organisms, 4th
edition. Environmental Monitoring
Systems Laboratory, U.S. Environmental Protection Agency, Cincinnati, OH, August
1993, EPA/600/4-90/027F.

23
Weidmer, M., M.J. Fink, J.J. Stegeman, R. Smolowitz, G.D. Marty, and D.E. Hinton.
1996. Cytochrome P450 induction and histopathology in pre-emergent pink salmon from
oiled streams in Prince William Sound, Alaska. American Fisheries Society Symposium
No. 18. Pp.509-517.
Wolf, K. 1957. Blue-sac disease investigations: microbiology and laboratory induction.
The Progressive Fish-Culturist. 19:14-18.
Wolfe, D.A., M.J. Hameedi, J.A. Galt, G. Watabayashi, J. Short, C. O‟Claire, S. Rice, J.
Michel, J.R. Payne, J. Braddock, S. Hanna, and D. Sale. 1994. The fate of the oil spilled
from the Exxon Valdez: the mass balance is the most complete and accurate of any major
oil spill. Environmental Science and Technology. 28:561-568.

24
1.9 Figures
Figure 1-1: Extent oil spread from the Exxon Valdez crash site (source: Alaska Department of
Environmental Conservation, National Marine Fisheries Service). The top right corner is Prince
William Sound. The inlaid panel shows the extent of oil still present today.

25
Figure 1-2: Pacific herring spawning sites overlap with oiled areas resulting from the Exxon
Valdez Oil Spill. The figure shows the major spawning sites for Pacific herring within Prince
William Sound (Brown and Carls 1998). The circled areas indicate the major spawning sites and
the x‟s indicate the juvenile nursery areas. Refer to previous figure to identify areas still oiled
today.

26
Figure 1-3: Application of a chemical dispersant onto an oil slick. Before dispersants are applied,
petroleum compounds partition into the water by natural dispersion forming the water
accommodated fraction (WAF). Chemical dispersants promote the formation of smaller droplets
of oil, increasing the surface area of oil exposed to water and increasing the rate of partitioning of
petroleum compounds into the water. This forms the chemically-enhanced water accommodated
fraction (CEWAF).

27
Figure 1-4: Atlantic herring spawning beds overlap with tanker routes transporting crude oil in
Eastern Canada. The map shows the Fall (closed symbols) and Spring (open symbols) spawning
stocks of Atlantic herring (borrowed with permission from Stephenson et al. 2009). The stars
represent the major ports in Eastern Canada with large oil refining operations. Transportation
routes to and from the ports would likely be close to herring spawning grounds.

28
Chapter 2
Toxicity of crude oil dispersed in a wave tank to Atlantic herring
(Clupea harengus) embryos
2.1 Abstract
The use of chemical dispersants to clean up oil spills raises many concerns for
organisms living below the surface of the water. Chemical dispersants break oil slicks
into smaller droplets suspended in the water column, thereby increasing the rate of
dilution and biodegradation. However, by decreasing the volume of surface oil, chemical
dispersion increases the partitioning of hydrocarbons into water and the bioavailability of
polycyclic aromatic hydrocarbons (PAH) to pelagic and benthic organisms by 100-fold.
Laboratory tests of chronic toxicity are often scrutinized because they do not adequately
reflect the conditions of actual oil spills. As an intermediate model between a full-scale
spill at sea and a laboratory test, a wave tank was used to simulate dispersion of spilled
oil and to determine if the resultant concentrations were sufficient to cause toxicity in
Atlantic herring (Clupea harengus) embryos. Wave tank exposures were up to four times
more toxic than laboratory-prepared test solutions, but in general, wave tank exposures
followed the same toxicity trends as laboratory exposures. Additionally, toxicity
increased with exposure time and concentration. Overall, laboratory tests can be used to
reasonably estimate the potential for toxicity from a spill at sea.

29
2.2 Introduction
The T/V Exxon Valdez collided with Bligh Reef in Prince William Sound, Alaska
on March 24, 1989, coinciding with the return of Pacific herring to the spawning grounds
in Prince William Sound (Kocan et al. 1996). Over 40 million litres of Alaska North
Slope crude oil were spilled, coating 1750 km of shoreline (Bragg et al. 1994).
Emergency response was not prepared for the spill, which delayed cleanup and allowed
the oil to spread, causing widespread damage.
Prior to the 1989, annual spawning of Pacific herring (Clupea pallasi) took place
over 106-273 km of shoreline. In 1994, the spawning area decreased up to 96%, to only
12 km (Funk 1994). Although other opinions exist (Pearson et al. 1999), it is assumed
that the oil was the leading cause of the population crash. Following the spill, Paine et al.
(1996) and Hose et al. (1996) observed physical deformation of Pacific herring embryos
in Prince William Sound, which they have linked to oil exposure. The grounding of the
Exxon Valdez and subsequent ecological damage lead to more stringent measures for
tankers travelling through the Sound and for preparations in anticipation of another
disaster, including stockpiling of chemical dispersants.
As oil sits on water, soluble compounds will partition into the water, forming the
water accommodated fraction of oil in water (WAF). Chemical dispersants decrease the
interfacial tension between oil and water, allowing the oil to break into smaller droplets
of oil-surfactant micelles that can more easily be dispersed by wave action and currents.
Smaller droplets have an increased surface area, allowing a larger quantity of petroleum
compounds to partition into the water, composing the chemically-enhanced water

30
accommodated fraction (CEWAF). As such, chemical dispersion of oil markedly
increases the concentration of polycyclic aromatic hydrocarbons (PAH) below the water
surface compared to un-dispersed crude oil, and increases the water solubility of high
molecular weight PAH (Couillard et al. 2005; Cohen et al. 2001). Application of
dispersants occurs under the premise that oil will be quickly diluted into the water
column to concentrations below toxic levels, and will be more bioavailable to
hydrocarbon-degrading microorganisms. However, before this can occur, there is a surge
in concentration of oil below the water surface, and if the concentration of petroleum
hydrocarbons is high enough, even for a short period of time, it could induce toxicity in
early life stages of fish (Wolfe et al. 1994; McIntosh et al. 2010).
PAH comprise the most toxic fraction of crude oil (Hodson et al. 2007). By
making droplets smaller and increasing the partitioning of oil into water, chemical
dispersion of crude oil could increase the exposure of fish embryos to PAH. Exposure of
early life stages of fish to PAH can result in dioxin-like toxicity, inducing blue sac
disease (Billiard et al. 1999). Pathological signs of blue sac disease in hatched herring
embryos include yolk sac edema, pericardial edema, spinal curvature, fin rot, and
craniofacial deformations (Figure 2-1; McIntosh et al. 2010). Severe deformities would
hinder an embryo‟s ability to forage for food, escape predators, swim unimpeded, and
ultimately be reproductively viable (Kocan et al. 1996; Smith and Cameron 1979).
Clupea sp. is at further risk because eggs stick to the substrate, preventing the
embryos from avoiding an oil spill (Smith and Cameron 1979). Atlantic herring (Clupea

31
harengus) spawn in shallow intertidal and subtidal (0-20 m) areas, putting the embryos at
further risk because CEWAF is more likely to reach these depths (Smith and Cameron
1979). Additionally, oil tanker routes in Eastern Canada pass through Atlantic herring
spawning grounds. McIntosh et al. (2010) found that Atlantic herring are most sensitive
to PAH directly following fertilization and hatch, increasing the potential for a high risk
to spawning grounds should a spill occur there during spawning season.
Aside from the work done by McIntosh et al. (2010), most studies of the toxicity
of crude oil to fish embryos in the literature have used chronic exposure conditions
(Couillard et al. 2005; Hose et al. 1996; Paine et al. 1996). However, maintaining the
same concentration of PAH from fertilization to hatch may not be realistic. Chronic
toxicity testing (fertilization to hatch) allows for a reproducible and controlled
environment for exposure, while giving the “worst-case scenario” for oil exposure.
However, dispersant efficacy tests have shown that hydrocarbon concentrations can
remain high for at most only a few days following a spill (Li et al. 2009). Additionally,
fish sensitivity is not constant throughout development. Fish are most sensitive to oil
exposure while gametes, immediately following fertilization, and immediately following
hatch (McIntosh et al. 2010). Research has shown that the blastula and gastrula stages
(within 24 – 48 h of fertilization) are critical for development, and exposure during this
time can decrease hatching success by 40%, while exposures 72 h after fertilization do
not (Kocan et al. 1996). By pinpointing the most sensitive stages of development,

32
exposures can be designed to better estimate the potential for toxicity under reasonable
petroleum hydrocarbon exposure scenarios.
Laboratory tests may not be realistic, but opportunities to test the conditions of a
real spill in the field are rare. As such, a practical intermediate model is needed to
validate studies of CEWAF prepared in the lab using a standard protocol. To simulate
chemical and natural dispersion of oil spills at sea, a wave tank at the Bedford Institute of
Oceanography (BIO), Dartmouth, NS, was used (Appendix C). Plunging breaking waves
(f = 0.85 Hz for 20 s followed by f = 0.50 Hz for 5 s), which are similar to white caps
visible on a windy day, were used to simulate the open ocean. With the use of chemical
dispersants, oil-surfactant droplets in the wave tank have a volumetric mean diameter
smaller than 50 µm (Li et al. 2009). Compared to laboratory studies, preparation of
CEWAF in a wave tank takes into account variable mixing energies and current effects,
simulating the natural environment (Li et al. 2009).
The objective of this study was to determine if crude oil chemically dispersed
within a wave tank can induce similar toxicity to Atlantic herring embryos as caused by
laboratory-prepared test solutions. Newly fertilized embryos were exposed to lab-
prepared WAF and CEWAF to provide a baseline for toxicity and to CEWAF prepared in
a wave tank to compare toxicity between the two preparation methods. Finally, brief
episodic exposures were used to determine the relationships among exposure time,
concentration and toxicity.

33
2.3 Methods
2.3.1 Wave Tank
To assess the toxicity of chemically dispersed crude oil to Atlantic herring
embryos, a wave tank was used as a practical intermediate model between a lab-prepared
bench top method and a full-scale spill in the environment. The wave tank was located at
the Bedford Institute of Oceanography (BIO), Dartmouth, NS, and operated by the Centre
for Offshore Oil, Gas and Energy Research, a division of the Department of Fisheries and
Oceans Canada. The wave tank was made from carbon steel, was 32 m long, 0.6 m wide,
and 2 m high, and located beside the Bedford Basin. It was filled to an average depth of
1.5 m with filtered saltwater from the Bedford Basin for each experiment. Waves were
generated by a computer-controlled flap-type wave maker situated at one end of the tank.
Using a frequency sweep technique (Funke and Mansard 1979), recurrent breaking waves
were generated for these experiments. A low-frequency, fast-moving wave was super-
imposed on a high-frequency, slow-moving wave, causing wave heights to increase
continuously until they broke.
The wave tank was equipped with water samplers at four horizontal locations (2
m upstream, and 2, 6 and 10 m downstream) and three vertical locations (5, 75 and 140
cm from the water surface) from the spill site (Appendix C). Thus, twelve water samples,
or exposure solutions, were collected at each sampling time. At time 0, 300 mL of oil
was poured onto the surface of the water at the spill site and 12 mL of dispersant (Corexit
34
9500A) was sprayed onto the surface of the oil. Water was sampled from the twelve
sample points at 5, 15, 30, and 60 min post-dispersion.
2.3.2 Test Species
“Ripe and running”, stage VI herring were acquired from the roe herring fishery
in Eastern Passage, Nova Scotia (Dinnel et al. 2002; Hay 1985). Ripe herring have
transparent eggs, and the eggs and sperm flow without external pressure (Hay 1985).
Gonads were removed from the fish at the wharf and transported in re-sealable plastic
bags in a cooler to BIO. Eggs and sperm were used within 24 h of capture to ensure
freshness.
2.3.3 Experimental Setup
The experiments, from egg fertilization to scoring hatched embryos, were
maintained at 10 C (±1C) with a 2:22 h dim light:dark photoperiod. Approximately 50-
100 eggs were spread onto glass slides and separated into groups of two or three using a
dissection needle. Individual experiments used eggs from a single female, and
subsequent experiments were replicated with eggs from a different female. Once the
eggs were attached to the glass slides, the slides were placed into a milt solution that was
prepared by mashing 1/5 of a testis, from a pool of all testes collected (6 males), in
approximately 500 mL of saltwater (15 g/L salinity). Slides were left in the milt solution
for about 15 min after which they were rinsed with clean saltwater to remove excess milt
and placed into test solutions. Freshly fertilized eggs were used for the experiments
because they are the most sensitive life stage for herring (McIntosh et al. 2010).

35
2.3.4 Test Solutions
Crude oils tested included Alaska North Slope (ANSC, viscosity of 17.5cP) and
Arabian Light (ALC, viscosity of 15.5cP). Oils were weathered by evaporation and
sparging with air to simulate loss of volatiles at sea; 10% loss of ANSC, by weight and
7% loss of ALC, by weight (Appendix A; King 2011; Lee et al. 2011). Oil viscosities
were measured after weathering. Corexit 9500A (Nalco Energy Services, L.P.; active
ingredient is dioctyl sodium sulphosuccinate) was used to make CEWAF because it is the
only dispersant stockpiled for use in Canada. All oils and the dispersant were supplied by
the Centre for Offshore Oil, Gas and Energy Research, Dartmouth, NS. The
recommended application is a dispersant:oil ratio (DOR) of 1:50 to 1:10 (US EPA
Technical Product Bulletin #D-4). For our purposes, oil in the wave tank was dispersed
using a DOR of 1:25 to follow the specifications of the tank, and CEWAF prepared in the
lab was dispersed at a DOR of 1:10 to maximize effect.
Exposure solutions were either drawn from the wave tank or prepared in the
laboratory. Wave tank solutions were drawn from the twelve sampling points at 5, 15,
30, and 60 min post-dispersion. Positive controls included retene (320 µg/L using
methanol as the carrier solvent) and laboratory-prepared CEWAF. Retene (7-isopropyl-
1-methyl phenanthrene) is an alkyl-phenanthrene and known to cause BSD in early life
stages of fish (Billiard et al. 1999). Negative controls included lab water, wave tank
water drawn before oil application, and a dispersant control. The optimum salinity for
Atlantic herring fertilization and hatching is 15 g/L (McIntosh 2009). The water used in
the wave tank was from the Bedford Basin (30 g/L salinity) and samples were diluted

36
with dechlorinated freshwater to 15 g/L. The CROSERF methods used to prepare
CEWAF and dispersant controls are outlined in Appendix B, adapted from Singer et al.
(2000), and reported previously (McIntosh et al. 2010).
2.3.5 Design
Slides of herring eggs were exposed to WAF (14 d exposure) and CEWAF for 2.4
h, 8 h, 24 h, or 14 d. After exposure, embryos were transferred to clean Mason jars
containing fresh saltwater (15 g/L). Water and test solutions for 14 d exposures were
renewed daily until hatch. Embryos remained attached to the glass slides until hatch.
Seven days post-fertilization, unfertilized eggs were removed from the slides and
fertilized embryos were randomly culled to about 20 per slide. Every other day from this
point to hatch, dead embryos were removed and survivors were monitored to determine
the day of hatch.
Within 24 h of hatch, embryos were scored for signs of blue sac disease (BSD).
These included pericardial edema (Score = 0-3), yolk sac edema (0-3), spinal curvature
(0-3), fin rot (0-1), craniofacial deformities (0-1), and mortality. Scoring was done using
a graduated scale; three indicated the most severe response and zero indicated no
response. Fin rot and craniofacial deformities were scored as either present (1) or absent
(0) because it was assumed they would have less of a lasting impact on the fish, and the
response was subtle and could not be scored on a graduated scale. We assumed that fish
with lower BSD scores were more likely to survive and contribute to the next generation,
despite the deformities. Abnormal fin and jaw development are thought to be results of

37
early hatch induced by PAH exposure and could be reversible (Carls et al. 1999;
Humphrey et al. 1995). Jaw growth and development continue throughout the larval
stage, increasing the probability that a fish with this type of deformity could still develop
a normal jaw if the water quality improved (Alderdice and Velsen 1971). On the other
hand, edema was the most sensitive response to oil exposure and primarily responsible
for mortality, and residual edema may reduce the ability to feed (Carls et al. 1999; Marty
et al. 1997).
Embryos that were dead upon hatch received the highest possible BSD score
(11.5) to indicate the most severe response beyond sublethal toxicity. The BSD Severity
Index was calculated from the average BSD scores for all embryos within a treatment and
normalized to the maximum score. The Index included both lethal (mortality) and sub-
lethal (BSD) signs of toxicity (modified from Villalobos et al. 2000). Alternatively,
embryos were considered „normal‟ if they were alive at hatch, did not show any signs of
BSD, and swam normally. These fish would be most likely to grow, reproduce, and
contribute to the next generation.
2.3.6 Water Chemistry
Water samples were drawn from exposure solutions to quantify the concentration
of hydrocarbons by fluorescence (Detailed SOP in Appendix D). Water samples (3 mL)
were drawn from exposure solutions at the start (time 0 h) and end of the exposure period
and added to 3 mL of absolute ethanol in 7 mL glass scintillation vials with foil-lined
caps and stored at 4C. Samples were sonicated for 3 min before chemical analysis. Upon

38
mixing with ethanol, salt from the water samples precipitated from solution. To reduce
interference by salt particles, samples were centrifuged at 9055 x g for 10 min to separate
the salt from the sample. An aliquot of the sample was placed in a quartz cuvette and
analyzed for total fluorescence using a RF-5301PC scanning spectrofluorometer
(Shimadzu Corporation, Kyoto, Japan) with Panorama fluorescence 1.1 software
(LabCognition, Dortmund, Germany). The excitation (278 nm) and emission (300-450
nm) wave lengths used for the experiments were the same for both ALC and ANSC. A
comparison of fluorescence to a standard curve prepared from each test oil dissolved in
50:50 ethanol:water provided an estimate of total petroleum hydrocarbons. The limit of
detection (LOD), or instrument detection limit, is the concentration of chemical required
to produce a signal three standard deviations above the noise level of the instrument, and
the concentration above which we can accurately determine the concentration of
chemical. The LOD was calculated as three times the standard deviation of the mean
fluorescence of a standard oil concentration run ten times on the fluorometer.
Water samples (100 mL) were also drawn from a subset of exposures to quantify
the concentration of total petroleum hydrocarbons for comparison to concentrations
estimated by fluorescence. Samples were preserved with 10 mL of dichloromethane and
sent to the Centre for Offshore Oil, Gas and Energy Research, Bedford Institute of
Oceanography, to be analyzed by Gas Chromatography-Flame Ionized Detection (GC-
FID).

39
2.3.7 Statistics
SigmaPlot 11.0 (Systat Software, Inc., San Jose, CA) and GraphPad Prism 5.00
(GraphPad Software, San Diego, CA) were used to prepare nonlinear regressions and
estimate LC50s (median lethal concentration) and EC50s (median effective
concentration). To calculate LC50s, lower constraints for percent mortality were set at
the negative control (14 d and exposure time = 7.69%; Wave tank = 0.00%;
Supplementary ANSC wave tank = 5.00%) for the corresponding experiments and upper
constraints were set at 100% to represent the maximum possible response. EC50s were
calculated for percent normal, percent hatch and the BSD Severity Index. The upper
constraints for percent normal (14 d and exposure time = 80.77%; ANSC wave tank =
89.82%; ALC wave tank = 93.33%; Supplementary ANSC wave tank = 81.23%) and
hatch (14 d and exposure time = 96.15%; ANSC and ALC wave tank = 100%;
Supplementary ANSC wave tank = 96.67%) were set at the corresponding negative
controls and the lower constraints were zero. The BSD Severity Index is a normalized
value based on the sum of the BSD scores for each fish (including mortalities) and the
maximum possible score, and averaged within treatments. Lower constraints were set at
the response level of negative controls (14 d and exposure time = 0.11; ANSC wave tank
= 0.02; ALC wave tank = 0.01; Supplementary ANSC wave tank = 0.09) and the upper
constraints at the maximum possible score of 1.0, where all embryos would be dead.
Statistical comparisons were made by comparing the confidence intervals for overlap and
by using the Extra Sum-of-Squares F-Test function in GraphPad Prism, where parameters
are shared to determine if correlations are better with shared data or as separate functions.

40
2.4 Results
Hatched embryos exposed to crude oil exhibited exposure-dependent signs of
toxicity, including yolk sac edema, pericardial edema, spinal curvature, fin rot, and
craniofacial deformities (Figure 2-1). Mean survival of controls was: % Mortality = 3.2 ±
3.7%; % Normal = 86.3 ± 6.1%; % Hatch = 98.2 ± 2.0%; BSD Severity Index = 0.058 ±
0.049.
There was a linear relationship among measured concentrations of fluorescing
petroleum hydrocarbons and nominal loadings of oil (%v/v) for ANSC and ALC oils of
both WAF and CEWAF (Figure 2-2). All lines were parallel (F-test, P = 0.90) and
shared a slope of 0.89. Chemical dispersion of crude oil (CEWAF) caused a roughly
100-fold increase in concentration of fluorescing petroleum hydrocarbons in the water
compared to un-dispersed oil (WAF; F-test, P < 0.001). ALC had more soluble
fluorescent hydrocarbons than ANSC in both CEWAF (F-test, P < 0.001) and WAF (F-
test, P = 0.005).
Atlantic herring embryos responded to dilutions of WAF and CEWAF of ANSC
and ALC in a dose-response manner. ANSC was more toxic than ALC, as evidenced by
lower EC/LC50s (median effective/median lethal concentrations) of percent mortality
(LC50), percent normal (EC50%Normal), percent hatch (EC50%Hatch), and the BSD Severity
Index (EC50SI; Figure 2-3; Table 2-1). There were no significant differences in LC50
and EC50%Hatch values (wide 95% confidence intervals (CI)) for ANSC and ALC.
However, the EC50%Normal and EC50SI values indicated that ANSC was approximately
two times more toxic than ALC (F-test, P = 0.040 and 0.003, respectively).

41
The toxicity of CEWAF prepared from ANSC increased with exposure time
(Figure 2-4; Table 2-1). There was a significant difference among the EC50%Normal values
for Atlantic herring embryos for all exposure times (F-test, P < 0.001). LC50s were
larger than the highest concentrations tested, except for the 14 d exposure which
produced an LC50 of 1.3 mg/L (95% CI too wide to estimate). EC50%Hatch values were
also larger than the highest concentrations tested, except for the 14 d exposure which
produced an EC50%Hatch of 3.0 mg/L (95% CI = 1.5- 5.9 mg/L). EC50SI values were not
significantly different between 2.4 and 8 h (F-test, P = 0.99), between 8 and 24 h (F-test,
P = 0.57), or between 2.4 and 24 h (F-test, P =0.48), but there was a significant difference
between 24 h and 14 d (F-test, P = <0.001).
The toxicity of CEWAF prepared from ALC increased with exposure time
(Figure 2-4; Table 2-1). There were significant differences between the EC50%Normal
values for 2.4 h and 8 h (F-test, P = 0.002) and between 2.4 h and 24 h exposure times (F-
test, P = 0.003), but not between 8 h and 24 h (F-test, P = 0.94). The 14 d EC50%Normal
was significantly lower than all other exposure times tested (F-test, P = 0.008). LC50s
were larger than the highest concentrations tested, except for the 14 d exposure which
resulted in an LC50 of 2.3 mg/L (95% CI too wide to estimate). EC50%Hatch values were
also larger than the highest concentrations tested, except for the 14 d exposure which
produced an EC50%Hatch of 2.6 mg/L (95% CI too wide to estimate). EC50SI values were
not significantly different between 2.4 and 8 h (F-test, P = 0.39), between 8 and 24 h (F-

42
test, P = 0.98), or between 2.4 and 24 h (F-test, P =0.55), but there was a significant
difference between 8 h and 14 d (F-test, P = 0.001).
Hydrocarbon concentrations produced by dispersing ANSC and ALC oils in the
wave tank were too low for EC50%Hatch, EC50SI and LC50 values to be calculated (Figure
2-5). The wave tank 24 h EC50%Normal for ANSC was 27 mg/L (95% CI = 0.0004 –
1.7x10⁶ mg/L), while the EC50%Normal for ALC was larger than the highest concentration
tested (> 9.6 mg/L). The increasing trend of toxicity at the highest concentrations of
ANSC was especially evident in the samples drawn from the tank 15 minutes post-
dispersion, where the EC50%Normal was 1.0 mg/L (95% CI = 0.62 – 1.7 mg/L). Some
ANSC samples from the wave tank appeared to be more toxic than the laboratory-
prepared controls, while ALC concentrations were lower than the laboratory-prepared
EC50%Normal and did not produce a trend in toxicity. The EC50%Normal for ANSC prepared
in the laboratory with the same females as the ANSC wave tank-prepared experiment was
4.9 mg/L (95% CI = 3.5 - 6.7 mg/L). Exposure solutions sampled from the wave tank at
15 minutes post-dispersion were significantly more toxic than those produced in the lab
(F-test, P = 0.025).
An additional wave tank experiment using ANSC is shown in the supplementary
material (Appendix C). The overall EC50%Normal estimated by combining all data points
(33 mg/L; 95% CI = 10 – 1.2x10⁶ mg/L) and the EC50%Normal of the laboratory-prepared
CEWAF (4.3 mg/L; 95% CI = 0.63 – 30 mg/L) were not significantly different (95% CIs
overlap). The EC50%Normal values for exposures drawn 5 (3.4 mg/L) and 60 (3.4 mg/L)

43
minutes post-dispersion were less than the EC50%Normal for laboratory-prepared CEWAF,
but the 95% CIs were too wide to estimate and therefore we could not determine if they
were significantly different. The EC50%Normal values for 15 and 30 minutes post-
dispersion could not be estimated because no clear trend was evident.
2.5 Discussion
Hatched embryos exposed to oil exhibited signs of toxicity known to correlate
with exposure to PAH (Hodson et al. 2007). Chemical dispersion in the lab increased the
concentration of fluorescing petroleum hydrocarbons in the water by 100-fold and ALC
released significantly more fluorescing hydrocarbons into the water than ANSC.
However, ANSC was more toxic than ALC to Atlantic herring embryos, as evidenced by
significantly lower EC50s of percent normal and BSD Severity Index. This difference
was likely a result of chemical composition. Additionally, toxicity of the two oils
increased linearly with exposure time. Toxicity resulting from exposures of 24 h or less
was primarily sublethal, which was indicated largely by a reduction in percent normal
and an increase in BSD without mortality. There was no toxicity from ALC dispersed in
the wave tank and concentrations were below the EC50 for laboratory-prepared solutions.
However, some exposures of ANSC dispersed in a wave tank were more toxic than
laboratory-prepared CEWAF. Overall, laboratory prepared exposure solutions were
considered a good surrogate for solutions prepared under conditions expected at sea.
Chemical dispersion of oil increased the concentration of water-borne
hydrocarbons by 100-fold and a higher concentration of hydrocarbons partitioned into the

44
water from ALC than from ANSC in both CEWAF and WAF. Conversely, ANSC was
nearly twice as toxic as ALC when embryos were exposed from fertilization until hatch.
Oil toxicity to early life stages of fish is generally a result of PAH (Hodson et al. 2007),
implying that the greater quantity of soluble PAH (or aromatics) will result in a higher
degree of toxicity (Di Toro et al. 2007). The toxicity of ANSC was in agreement with
the chemical characteristics of the oils, which indicate that ANSC has two times more
aromatics than ALC (Appendix A; King 2011). Additionally, ANSC has two times more
phenanthrenes, which are known to be highly toxic to early life stages of fish (Barron et
al. 2004). The higher fluorescence coupled with lower toxicity may relate to the relative
composition of fluorescent compounds present in the tested oils, as many organic
molecules which are aromatic or contain conjugated double bonds will fluoresce
(Williams and Bridges 1964). Additionally, compounds can vary in their ability to
fluoresce; aniline can be 50 times more fluorescent than benzene (Bridges and Williams
1962). This introduces limitations to the methods chosen for water chemistry because
compounds present in oil other than PAH fluoresce, including high molecular weight
asphaltenes that have both aromatic and aliphatic components. ALC contains three times
more thiophenes than ANSC (Appendix A), which may account for the discrepancy
between fluorescence and toxicity. Although thiophenes have a toxic potential, they are
not considered PAH (Williams and Bridges 1964) and may contribute more to the
fluorescent properties of oil in water than to toxicity.

45
To estimate the highest potential toxicity, as indicated by McIntosh et al. (2010),
embryos were exposed immediately following fertilization for the desired exposure time.
In a similar study, Kocan et al. (1996) found that the blastula and gastrula stages of
embryonic development (within 48 h of fertilization) were the most sensitive to oil
exposure, documented by a decrease in the percent normal at hatch. They found that
exposures occurring 72 h after fertilization did not have the same lethal effects as those
occurring within 24 and 48 h following fertilization, which decreased hatching success by
40% (Kocan et al. 1996).
Toxicity estimations are often unrealistic because embryos are exposed
chronically (fertilization to hatch), while in actual fact, most oil spills would expose
embryos in an acute contact scenario of a few hours to days. Exposure time was
examined using laboratory-prepared CEWAF to reflect a pulse exposure scenario, where
embryos were exposed to a constant concentration of oil in water over a pre-determined
exposure time. In accordance with McIntosh et al. (2010), increasing exposure time
decreased the percentage of normal embryos. The exposure-toxicity relationships
indicate that even very short exposure times (2.4 h) can result in toxicity, and the longer
the embryo is exposed, the higher the risk for toxicity and for failure to recruit to future
generations. This relationship however, was not as clear for ALC CEWAF. There was
no significant difference in toxicity between 8 h and 24 h exposures. This could indicate
that the solubility of PAH in water has reached a maximum by 8 h, meaning the toxic
agents had been depleted from solution, or that uptake and excretion/metabolism have
46
reached equilibrium within the embryos, so that no increase in toxicity would be
observed. It is also possible that the threshold in toxicity is a result of experimental error
or random variability among embryos. Signs of toxicity (percent normal, percent hatch,
percent mortality, BSD Severity Index) were more pronounced in embryos exposed
chronically (14 d), which could be the effect of daily static renewal of solutions, where
soluble hydrocarbons were replenished daily.
Toxicity resulting from exposure times of 24 h or less was primarily determined
by sublethal endpoints, as LC50s could not be estimated. It was found that percent
normal and to a lesser extent, the BSD Severity Index were the most sensitive endpoints
used for determining toxicity (Appendix F). This is consistent with McIntosh et al.
(2010) and Rice et al. (1987) who found lethality to be both exposure time and
concentration dependent. On the other hand, all endpoints could be used to estimate
toxicity to Atlantic herring embryos exposed for 14 d.
Oil is a complex mixture, and the kinetics of weathering and uptake are difficult
to mimic in the laboratory. As such, CEWAF was also prepared in a wave tank to allow
for more realistic spill and dispersion conditions. Exposure solutions of ALC dispersed
in the wave tank did not show toxicity and the concentrations of hydrocarbons were less
than those observed to cause toxicity in the lab. In contrast, exposure solutions of ANSC
dispersed in the wave tank and drawn from the tank at 15 minutes post-dispersion were
over four times more toxic than laboratory-prepared CEWAF. Exposures drawn at 5, 30,
and 60 minutes post-dispersion from the tank did not show the same negative trend and

47
the concentrations were too low to determine if toxicity mimicked laboratory-prepared
CEWAF. A second wave tank experiment using ANSC is shown in the supplementary
material (Appendix C). No increase in toxicity was evident for exposure solutions drawn
at 15 and 30 minutes post-dispersion, but the 5 and 60 minute samples were slightly more
toxic than the laboratory-prepared CEWAF. The significant increase in toxicity to
embryos exposed to water sampled at 15 minutes for the first wave tank experiment
suggests that oil droplets in the wave tank had been weathered enough to release toxic
concentrations of hydrocarbons. After 15 minutes, the toxic constituents may have been
degraded or diluted beyond their toxic potential at concentrations found within the water
column. It is also possible that there is a difference between wave tank-prepared and
laboratory-prepared CEWAF in terms of the types of hydrocarbons within the water
column, the degree of weathering and dilution, and the chemical characteristics and
physical composition of the oil. Further chemical analysis would be required to support
these possibilities.
The wave tank system is merely a model for oil spills in the field. The ocean is a
dynamic system and each oil spill would occur under different conditions and regimes.
The wave tank experiments were designed to simulate specific high energy conditions in
the ocean on a windy day. It is more of a stream channel that has boundaries and a
shallow depth, which prevent the oil from spreading horizontally and vertically. As a
result, hydrocarbon concentrations and potential toxicity cannot be extrapolated directly
to conditions expected at sea.
48
Within the wave tank, hydrocarbon concentrations were highest towards the end
of the tank and at the sampling times directly following dispersion (5 minutes), and
toxicity was greatest at 15 minutes (Figure 2-5). This suggests that even though a spill
may not occur directly over a fish spawning bed, chemical dispersion, currents, and wave
action could quickly move the hydrocarbons to that area. Increasing the volume of oil
added to the wave tank for dispersion may increase the concentration of dissolved oil
generated by the tank to better pinpoint LC50s and EC50s. The volume of dispersant
could also be increased to a maximum DOR of 1:10. Additionally, maintaining the
salinity in toxicity tests at 30 ppt would double the concentration of oil in the water
samples (as opposed to diluting the sample to 15 ppt as was done in the present
experiments) and increase exposure. Preliminary experiments performed at 30 ppt
showed a higher range of toxicity, presumably because samples were undiluted, and there
was no difference in toxicity among CEWAF controls between salinities (Appendix C-4).
Unfortunately, these earlier experiments could not be linked to hydrocarbon
concentrations. It is possible however, that oil toxicity would increase with salinity
(Johnson 2011; Fingas et al. 1991).
There are many methods available for measuring the concentration of oil in water,
depending on the target compounds. Most methods can be very time consuming and
costly (eg. Gas Chromatography-Mass Spectrometry, Gas Chromatography-Flame
Ionized Detection), extending the length of a project and/or decreasing the number of
samples possible for testing. To overcome these hurdles, fluorescence was used to

49
analyze the quantity of hydrocarbons within the exposure solution by comparing total
fluorescence to a standard curve prepared from whole oil. This method was employed
for monitoring the bioassay because a large number of samples required processing, the
analysis and equipment were relatively simple, and samples were processed on-site at a
low cost. The largest proportion of oil that fluoresces is the PAH component, which is
also known to be the most toxic and the cause of dioxin-like toxicity that we observed in
fish embryos (Hodson et al. 2007). To quantify hydrocarbon concentration, a standard
curve was prepared for comparison to unknowns and the wavelengths targeted were
specific to phenanthrenes (three-ringed PAH), which are known to cause toxicity and
have a higher toxic potential than other PAH (Di Toro et al. 2007). Other experiments
that compare toxicity to total petroleum hydrocarbon concentrations would produce a
higher concentration simply because these methods also measure alkanes, which do not
fluoresce. By targeting the most toxic fraction of the oil, as is done in fluorescence, the
measured concentration is more accurately estimated by the PAH component causing
toxicity and not erroneously including other compounds (Di Toro et al. 2007).
Gas Chromatography-Flame Ionized Detection was also used to analyze the
concentration of total petroleum hydrocarbons within some of the exposure solutions.
When compared to the concentrations obtained through spectrofluorometry, a linear
relationship was observed (Figure 3-1 in Chapter 3), indicating that the methods provided
are comparable to measures of relative concentration among exposures. If need be, total
petroleum hydrocarbon concentrations can be extrapolated from spectrofluorescence
50
results. Further GC-MS analysis on the toxicity of oil fractions would enable more
precise EC50 and LC50 values based solely on PAH, the most toxic component of oil.
Obtaining high quality eggs was an issue in these experiments. Many
experiments failed because eggs were not fertilized, likely because females were not
sufficiently mature prior to harvesting eggs. There was high variability among and
within females in terms of egg quality and there was variability in terms of response to oil
exposure (personal observations). Fertilization success was observed to be much greater
during the fall spawning season compared to the spring spawning season, which
corroborates observations made by McIntosh et al. (2010). It is not uncommon that 50%
of naturally spawned herring in the wild exhibit morphological deformities (Purcell et al.
1990; Hose et al. 1996), a background response rate that would reduce reproducibility
among experiments and place the relative importance of this response in perspective. As
a result, we found it necessary to only include replicates that had a minimum of five
fertilized eggs per slide and to view toxicity data with respect to the negative control for
that experiment. Replicates that had abnormally high rates of malformed embryos (<
75% normal) in the controls were discarded. Hose et al. (1996) also found high
variability in oil sensitivity of Pacific herring among spawning sites, but nevertheless,
hydrocarbon concentrations present directly following the Exxon Valdez spill were high
enough to elicit severe physical deformities and genetic damage to embryos. Although
possibly unrealistic for time management, many experiments are needed to compile a

51
sufficient database that risk assessors can use to define the average threshold of toxicity
to Atlantic herring.
2.6 Conclusion
Atlantic herring embryos were sensitive to dispersed crude oil exposure and
exhibited signs of toxicity known to correlate with PAH exposure. Chemical dispersants
increased the concentration of petroleum hydrocarbons in the water column by 100-fold,
increasing the availability of oil to early life stages of fish. ANSC appeared to be more
toxic to Atlantic herring embryos than ALC, and exposure times to CEWAF of either oil
for periods as short as 2.4 h caused toxicity. Exposure solutions of ANSC dispersed by
the wave tank were up to four times more toxic than laboratory-prepared CEWAF, but
embryos exposed to ALC dispersed in the wave tank did not exhibit signs of toxicity and
concentrations were lower than those found in the laboratory-prepared CEWAF
exposures. The results suggest that preparation of CEWAF in the lab is a suitable
alternative to large-scale experiments for determining the toxicity of dispersed oil to
herring embryos.
2.7 Acknowledgements
This research was supported by the Prince William Sound Regional Citizens‟
Advisory Council, Anchorage, AK, and the Centre for Offshore Oil, Gas and Energy
Research (COOGER), Fisheries and Oceans Canada (DFO), Dartmouth, NS. We would
like to thank the Hodson lab; the employees of COOGER; Simon Courtenay, Sarah
Johnson, and Monica Boudreau from DFO, Moncton, NB; Claire McIntyre and Chloe

52
Ready for technical assistance; and Mark Williston, Gilbert Donaldson, and H & H
Seafoods for the acquisition of roe herring.
2.8 References
Alderdice, D.F. and F.P.J. Velsen. 1971. Some effects of salinity and temperature on
early development of Pacific herring (Clupea harengus). Journal of the Fisheries
Research Board of Canada. 28:1545-1562.
Barron, M.G., M.G. Carls, R. Heintz, and S.D. Rice. 2004. Evaluation of fish early life-
stage toxicity models of chronic embryonic exposures to complex polycyclic aromatic
hydrocarbon mixtures. Toxicological Sciences. 78:60-67.
Billiard, S.M., K. Querbach, and P.V. Hodson. 1999. Toxicity of retene to early life
stages of two freshwater fish species. Environmental Toxicology and Chemistry.
18:2070-2077.
Bragg, J.R., R.C. Prince, E.J. Harner, and R.M. Atlas. 1994. Effectiveness of
bioremediation for the Exxon Valdez oil spill. Nature. 368:413-418.
Bridges, J.W. and R.T. Williams. 1962. Fluorescence of some substituted benzenes.
Nature. 196:59-61.
Carls, M.G., S.D. Rice, and J.E. Hose. 1999. Sensitivity of fish embryos to weathered
crude oil: part I. Low-level exposure during incubation causes malformations, genetic
damage, and mortality in larval Pacific herring (Clupea pallasi). Environmental
Toxicology and Chemistry. 18:481-493.
Cohen, A.M., D. Nugegoda, and M.M. Gagnon. 2001. The effect of different oil spill
remediation techniques on petroleum hydrocarbon elimination in Australian bass
(Macquaria novemaculeata). Archives of Environmental Contamination and Toxicology.
40:264-270.
Couillard, C.M., K. Lee, B. Légaré, and T.L. King. 2005. Effect of dispersant on the
composition of the water-accomodated fraction of crude oil and its toxicity to larval
marine fish. Environmental Toxicology and Chemistry. 24:1496-1504.
Di Toro, D.M., J.A. McGrath, and W.A. Stubblefield. 2007. Prediciting the toxicity of
neat and weathered crude oil: toxic potential and the toxicity of saturated mixtures.
Environmental Toxicology and Chemistry. 26:24-36.
Dinnel, P.A., N.T. Schwark, A. Balderas, M. Cotter, and D.P. Middaugh. 2002.
Development of embryo and larval Pacific herring, Clupea pallasi, bioassay protocols: P.
herringase II. Shannon Point Marine Center. Western Washington University, Anacortes,
WA.

53
Fingas, M., I. Bier, M. Bobra, and S. Callaghan. 1991. Studies on the physical and
chemical behavior of oil and dispersant mixtures. Proceedings from the 1991
International Oil Spill Conference, San Diego, California. 25pp.
Funk, F. 1994. Preliminary summary of 1994 Alaska roe sac herring fisheries. Alaska
Department of Fish and Game, Juneau, AK.
Funke, E.R. and E.P. Mansard. 1979. SPLSH A program for the synthesis of episodic
waves. Ottawa, Canada, Hydraulics Laboratory Technical Report LTR-HY-65. National
Research Council, Ottawa, Canada.
Hay, D.E. 1985. Reproductive biology of Pacific herring (Clupea harengus pallasi).
Canadian Journal of Fisheries and Aquatic Science. 42:111-126.
Hodson, P.V., C.W. Khan, G. Saravanabhavan, L. Clarke, R.S. Brown, B. Hollebone, Z.
Wang, J. Short, K. Lee, and T. King. 2007. Alkyl PAH in crude oil cause chronic toxicity
to early life stages of fish. Proceedings of the 2007 Arctic and Marine Oil Spill
Conference, Edmonton, AB.
Hose, J.E., M.D. McGurk, G.D. Marty, D.E. Hinton, E.D. Brown, and T.T. Baker. 1996.
Sublethal effects of the Exxon Valdez oil spill on herring embryos and larvae:
morphological, cytogenetic, and histopathological assessments, 1989-1991. Canadian
Journal of Fisheries and Aquatic Sciences. 53:2355-2365.
Humphrey, E.C., J.B. Marliave, and D.I. Kent. 1995. Morphological staging of larval
Pacific herring. Report 2060. Department of Fisheries and Oceans, Nanaimo, BC,
Canada.
Johnson, S. 2011. The effect of salinity and temperature on the toxicity of chemically
dispersed oil to embryos of Atlantic and Pacific herring. MSc thesis, University of New
Brunswick, Fredricton, NB. In preparation.
Kocan, R.M., J.E. Hose, E.D. Brown, and T.T. Baker. 1996. Pacific herring (Clupea
pallasi) embryo sensitivity to Prudhoe Bay petroleum hydrocarbons: laboratory
evaluation and in situ exposure at oiled and unoiled sites in Prince William Sound.
Canadian Journal of Fisheries and Aquatic Sciences. 53:2366-2375.
King, T. 2011. Do surface films negatively bias the effect of oil spill chemical dispersants
in a wave tank test facility? MSc thesis, Saint Mary‟s University, Halifax, NS.
Lee, K., T. King, B. Robinson, Z. Li, L. Burridge, M. Lyons, D. Wong, K. MacKeigan, S.
Courtenay, S. Johnson, M. Boudreau, P. Hodson, C. Greer, and A. Venosa. 2011.
Toxicity effects of chemically-dispersed crude oil on fish. 2011. Proceedings from the
2011 International Oil Spill Conference, Portland, Oregon. 26pp.
Li, Z., K. Lee, T. King, M.C. Boufadel, and A.D. Venosa. 2009. Evaluating crude oil
chemical dispersion efficacy in a flow-through wave tank under regular non-breaking
wave and breaking wave conditions. Marine Pollution Bulletin. 58:735-744.

54
Li, Z., M.C. Boufadel, A.D. Venosa, and K. Lee. 2006. A wave tank facility to assess
chemical oil dispersant effectiveness as a function of energy dissipation rate. 2006
Interspill Conference, London, England. 12pp.
Marty, G.D., J.E. Hose, M.D. McGurk, and E.D. Brown. 1997. Histopathology and
cytogenetic evaluation of Pacific herring larvae exposed to petroleum hydrocarbons in
the laboratory or in Prince William Sound, Alaska, after the Exxon Valdez oil spill.
Canadian Journal of Fisheries and Aquatic Science. 54:1846-1857.
McIntosh, S. 2009. Toxicity of chemically dispersed crude oil to early life stages of
Atlantic herring (Clupea harengus). MSc. Thesis, Queen‟s University, Kingston, ON.
McIntosh, S., T. King, W. Dongmei, and P.V. Hodson. 2010. Toxicity of dispersed
weathered crude oil to early life stages of Atlantic herring (Clupea harengus).
Environmental Toxicology and Chemistry. 29:1160-1167.
Paine, R.T., J.L. Ruesink, A. Sun, E.L. Soulanille, M.J. Wonham, C.D.G. Harley, D.R.
Brumbaugh, and D.L. Secord. 1996. Trouble on oiled waters: lessons from the Exxon
Valdez oil spill. Annual Review of Ecology and Systematics. 27:197-235.
Pearson, W.H., R.A. Elston, R.W. Bienert, A.S. Drum, and L.D. Antrim. 1999. Why did
the Prince William Sound, Alaska, Pacific herring (Clupea pallasi) fisheries collapse in
1993 and 1994? Review of hypotheses. Canadian Journal of Fisheries and Aquatic
Sciences. 56:711-737.
Purcell, J.E., D. Grosse, and J.J. Glover. 1990. Mass abundances of abnormal Pacific
herring larvae at a spawning ground in British Columbia. Transactions of the American
Fisheries Society. 119:463-469.
Rice, S.D., M.M. Babcock, C.C. Brodersen, M.G. Carls, J.A. Gharrett, S. Korn, A.
Moles, and J.W. Short. 1987. Lethal and sublethal effects of the water-soluble fraction of
Cook Inlet crude oil on Pacific herring (Clupea harengus pallasi) reproduction. NOAA
Tech. Memo. No. NMFS F/NWC-11. U.S. Department of Commerce, National Oceanic
and Atmospheric Administration, Washington, D.C.
Singer, M.M., D. Aurand, G.E. Bragin, J.R. Clark, G.M. Coelho, M.L. Sowby, and R.S.
Tjeerdema. 2000. Standardization of the preparation and quantitation of water-
accommodated fractions of petroleum for toxicity testing. Marine Pollution Bulletin.
40:1007-1016.
Smith, R.L. and J.A. Cameron. 1979. Effect of water soluble fraction of Prudhoe Bay
crude oil on embryonic development of Pacific herring. Transactions of the American
Fisheries Society. 108:70-75.
Villalobos, S.A., D.M. Papoulias, J. Meadows, A.L. Blankenship, S.D. Pastva, K.
Kannan, D.E. Hinton, D.E. Tillitt, and J.P. Giesy. 2000. Toxic responses of medaka, d-rR
strain, to polychlorinated naphthalene mixtures after embryonic exposure by in ovo

55
nanoinjection: a partial life-cycle assessment. Environmental Toxicology and Chemistry.
19:432-440.
Williams, R.T. and J.W. Bridges. 1964. Fluorescence of solutions: a review. Journal of
Clinical Pathology. 17:371-394.
Wolfe, D.A., M.J. Hameedi, J.A. Galt, G. Watabayashi, J. Short, C. O‟Claire, S. Rice, J.
Michel, J.R. Payne, J. Braddock, S. Hanna, and D. Sale. 1994. The fate of the oil spilled
from the Exxon Valdez: the mass balance is the most complete and accurate of any major
oil spill. Environmental Science and Technology. 28:560-568.

56
2.9 Figures
Figure 2-1: Hatched Atlantic herring embryos. The top panel (A) represents a hatched embryo
showing no signs of toxicity ("normal"). The lower panel (B) depicts a hatched embryo that was
exposed to 2.7 m/L of Arabian light crude (ALC) chemically-enhanced water accommodated
fraction (CEWAF). The lower embryo has yolk sac edema (YSE), pericardial edema (PE), and a
spinal curvature (SC). Contrast and brightness have been adjusted for clarity. Panel B shows a
larger magnification than Panel A to enhance visibility of edemas. Additional photos can be
found in Appendix E.
1 mm
1 mm
1 mm
YSE
SC
PE
A
B

57
Nominal Loading (%v/v)
0.001 0.01 0.1 1 10 100
Measure
d C
oncentr
ation (
mg/L
)
0.01
0.1
1
10
100
CEWAF
WAF
ALC
ANSC
ALC
ANSC
LOD
Figure 2-2: The concentration of petroleum hydrocarbons in test solutions at different loadings of
the water accommodated fraction (WAF) and the chemically-enhanced water accommodated
fraction (CEWAF). Open triangles show the Arabian Light Crude (ALC) CEWAF (R2 = 0.99),
closed triangles represent the ALC WAF (R2 = 0.76), closed circles show the Alaska North Slope
Crude (ANSC) CEWAF (R2 = 0.99), and open circles represent the ANSC WAF (R
2 = 0.82).
The dashed lines show the extrapolated concentration of the WAF samples below the limit of
detection (LOD; calculation in section 2.3.6). Data points at or below the LOD are shown for
comparison.

58
0.1 1 10 100
% M
ort
ality
0
20
40
60
80
100
ANSC CEWAF
ANSC WAF
ALC CEWAF
ALC WAF
Negative Control
ALC
ANSC
0.1 1 10 100
% N
orm
al
0
20
40
60
80
100
Negative Control
ALCANSC
Measured Concentration (mg/L)
0.1 1 10 100
% H
atc
h
0
20
40
60
80
100
Negative Control
ALCANSC
Measured Concentration (mg/L)
0.1 1 10 100
BS
D S
everity
Index
0.0
0.2
0.4
0.6
0.8
1.0
Negative Control
ALC
ANSC
Figure 2-3: Toxicity of the water accommodated fractions (WAF) and chemically-enhanced
water accommodated fractions (CEWAF) of Alaska North Slope Crude (ANSC) and Arabian
Light Crude (ALC) oils prepared in the lab to Atlantic herring embryos expressed as (a) %
Mortality, (b) % Normal, (c) % Hatch, and (d) BSD Severity Index in relation to the measured
concentration of fluorescing compounds (mg/L). Regression lines and LC50/EC50 values were
calculated using WAF (open symbols) and CEWAF (closed symbols). Regression equations can
be found in Appendix G. Dash lines represent response from ALC exposure, and solid lines
represent response from ANSC exposure. N = 20 embryos per treatment.
A B
C D

59
Measured Concentration (mg/L)
0.1 1 10 100
0
20
40
60
80
100
2.4h8h24h
Negative Control
14d
Measured Concentration (mg/L)
0.1 1 10 100
0
20
40
60
80
100
Negative Control
2.4h8h24h
14d
Figure 2-4: The effect of exposure time and petroleum hydrocarbon concentration on the
percentage of normal embryos at hatch exposed to lab-prepared Alaska North Slope Crude
(ANSC; A) and Arabian Light Crude (ALC; B). Percent normal indicates percentage of embryos
alive and showing no signs of toxicity at hatch. Embryos were exposed immediately following
fertilization for 2.4 h, 8 h, 24 h or 14 d (static daily renewal). Percent mortality, percent hatch,
and BSD Severity Index data can be found in Appendix F. Regression equations can be found in
Appendix G. Dotted lines show estimation of median effective concentrations. N = 20 embryos
per treatment.
% N
orm
al
A
B

60
Figure 2-5: Wave tank data showing the movement of fluorescing hydrocarbons in Alaska North Slope Crude oil (ANSC) through the tank over
time (left panel), and the change in percent normal with increasing concentration of the chemically-enhanced water accommodated fraction
(CEWAF) of ANSC (A) and Arabian Light Crude oil (ALC; B) exposures drawn from the tank. Left panel: Times represent sampling time after
addition of Corexit 9500A to ANSC. The white star represents the oil spill site. Right panel: The effects on Atlantic herring of a 24 h exposure of
the corresponding laboratory-prepared CEWAF exposures have been superimposed for comparison (dash lines). The measured concentrations
were derived from samples of toxicity test solutions. N = 20 embryos for each exposure.

61
Table 2-1: The effect of exposure time on the toxicity of the chemically-enhanced water accommodated fraction (CEWAF) of Alaska North Slope
Crude (ANSC) and Arabian Light Crude (ALC) oils. Median lethal concentrations (LC50s) represent lethal toxicity, specifically an increase in the
mortality of embryos. Median effective concentrations (EC50s) represent sublethal toxicity, specifically the concentrations causing a reduction in
the percent normal and percent hatch, and an increase in the BSD Severity Index of Atlantic herring embryos. Values are based on measured
concentrations of fluorescing petroleum hydrocarbons of CEWAF in mg/L and shown with 95% confidence intervals (CI). “>” or “<” indicate
that the LC/EC50 was greater than the highest concentration tested or less than the lowest concentration tested. “NA” indicates confidence limits
were too wide to estimate.
Atlantic Herring (LC50s and EC50s in mg/L)
Oil Exposure
Time
%
Mortality CI % Normal CI % Hatch CI
BSD
Severity
Index
CI
ANSC
14 d 1.32 NA <0.25 NA 2.99 1.51-5.93 0.66 0.48-0.89
24 h >17.46 - 0.76 0.58-0.99 >17.46 - 27.13 11.89-61.89
8 h >18.77 - 3.16 2.36-4.23 >18.77 - 27.33 7.22-103.50
2.4 h >19.17 - 11.74 5.32-25.91 >19.17 - 41.37 7.48-228.80
ALC
14 d 2.29 NA <0.37 NA 2.29 NA 2.07 1.01-4.24
24 h >24.23 - 2.75 1.01-7.47 >24.23 - 55.26 2.58-1186
8 h >26.06 - 2.86 1.26-6.52 >26.06 - 53.68 13.47-
213.90
2.4 h >26.68 - 25.06 14.66-42.84 >26.68 - 215.90 0.015-
3.3x10^6
62
Chapter 3
Oil Toxicity: A Comparison Between Pacific and Atlantic Herring
3.1 Abstract
Significant declines in Pacific herring (Clupea pallasi) populations have followed
two major oil spill events in the United States, the Exxon Valdez oil spill and the Cosco
Busan oil spill. As a result of oil-related declines in Pacific herring, many studies have
documented the risk to Pacific herring of oil exposure. Tanker transportation routes
throughout the Northwestern Atlantic Ocean coincide with Atlantic herring (Clupea
harengus) spawning grounds, but little research has been done to study the risk of oil
exposure to Atlantic herring. The main objective of this research was to determine if
Atlantic herring and Pacific herring embryos respond similarly to oil exposure, so that
available knowledge on Pacific herring can be included in risk assessments for Atlantic
herring. Under the same test conditions, embryos of Atlantic herring were four times
more sensitive to chemically dispersed crude oil than Pacific herring embryos, as
determined by the percentage of normal embryos at hatch and the incidence of BSD.
Additionally, medium crude oils were two times more toxic to Atlantic herring than light
crude oils. The differences in sensitivity were sufficiently small that data on the toxicity
of chemically dispersed oil may be interchangeable between the two species.

63
3.2 Introduction
As Pacific herring (P. herring; Clupea pallasi) were returning to the spawning
shoals in Prince William Sound, Alaska in March of 1989, the T/V Exxon Valdez collided
with Bligh Reef, spilling Alaska North Slope Crude oil (ANSC; Kocan et al. 1996). Prior
to the spill, P. herring spawned along 106-273 km of shoreline in Prince William Sound.
In 1994, the spawning area decreased to 12 km, forcing the roe herring fishery to close
(Funk 1994). Although there is evidence to support a theory of over-population (Pearson
et al. 1999), most believe exposure to oil in sensitive breeding grounds was the leading
cause of the population crash. This has been supported by lab-scale tests showing the
toxicity of crude oil to P. herring embryos in Prince William Sound (Paine et al. 1996)
and correlations have been made between areas of oil contamination in the Sound and the
prevalence of deformed herring embryos (Hose et al. 1996).
Clupea sp. are very important economically and ecologically, as integral
components of commercial fisheries and local food webs. Herring stocks have declined
in many areas from natural and anthropogenic factors. The Cherry Point stock, for
example, was once the largest Pacific herring stock in Washington State (mid-1970s), but
has since declined precipitously to less than ten percent of the original spawning biomass
(Dinnel et al. 2002). To promote recovery of the population, anthropogenic influences
need to be eliminated, including sources of pollution that are a leading cause of fish stock
declines. Herring, for example, are known to be especially sensitive to oil exposure
(Carls et al. 1999).

64
Should an oil spill occur, chemical dispersants can be sprayed onto the oil slick to
decrease the negative effects of the spill more quickly. Dispersants reduce the interfacial
tension between the oil and water, allowing the oil to break into small droplets, which can
then be „dispersed‟ by mechanical and natural means. While decreasing the surface area
of the slick, dispersants increase the amount of oil in the water column, the surface-to-
volume ratio of droplets, the partitioning to water of the toxic constituents of oil, and the
bioavailability of oil to pelagic and benthic organisms. The water accommodated
fraction (WAF) is composed of the portion of petroleum hydrocarbons, including
polycyclic aromatic hydrocarbons (PAH), that partition into the water from an oil slick
that has been naturally dispersed by wave action and currents. The chemically-enhanced
water accommodated fraction (CEWAF) has a higher concentration of these constituents
as a result of the application of chemical dispersant, which decreases the size of oil
droplets and increases the partitioning of oil into water. Considering it is the dissolved
PAH fraction that is the most acutely toxic constituent of oil, an increase in solubility
would effectively increase the exposure and effects on fish (Heintz et al. 1999).
Exposure of fish embryos to PAH can induce a chronic, non-contagious syndrome
known as blue sac disease (BSD) and may be a result of oxidative damage and membrane
destabilization (Cantrell et al. 1996). Signs of BSD could include pericardial edema,
yolk sac edema, spinal curvature, fin rot, or craniofacial malformations. Edemas are the
most sensitive signs of toxicity in herring embryos and can reduce cardiac output,
impede circulation, and negatively affect swimming ability, often resulting in death

65
(Carls et al. 1999). Additionally, spinal curvatures can vary in severity, inhibiting
swimming ability, which would reduce the capacity to forage for food and to escape
predators.
Highly weathered oil can induce lethal and sublethal effects in P. herring embryos
at concentrations as low as 0.7 µg/L total PAH (tPAH; lowest observed effective
concentration; Carls et al. 1999). This is lower than concentrations observed following
the Exxon Valdez Oil Spill, where tPAH in open seawater was measured at 6.24 µg/L
directly following the spill, and persisted at 1.59 µg/L for at least five weeks thereafter
(Short and Harris 1996). Additionally, dissolved PAH were found to a depth of 25 m in
Prince William Sound and ranged from 0.9 to 6.2 µg/L near heavily oiled beaches
immediately following the spill (Short and Harris 1996).
Because of the Exxon Valdez and Cosco Busan spills, most literature has reported
studies of P. herring and few researchers have attempted to make correlations with
Atlantic herring (A. herring; Clupea harengus). On the eastern seaboard of North
America, A. herring spawn in areas frequented by tanker traffic transporting oil products
and in areas where oil exploration has become prevalent. This increases the probability
that a major spill event will occur in A. herring habitat. The abundant literature on P.
herring could strengthen assessments of the risk to A. herring of oil toxicity if the
response of the two species to oil is similar. Since a direct comparison between the
species has not been done, the purpose of this research was to compare the toxicity of
chemically dispersed crude oil to A. herring and P. herring to determine if risk

66
assessment decisions can be made on A. herring based on available literature regarding
oil toxicity to P. herring.
3.3 Methods
3.3.1 Test Species
“Ripe and running”, stage VI herring were acquired from roe herring fisheries
based in Escuminac, NB (A. herring) and in Nanaimo, BC (P. herring). Fish selection
and transportation procedures followed those outlined in Section 2.3.2, except that P.
herring were shipped to Queen‟s University for experiments.
3.3.2 Experimental Setup
Experimental setup was identical to section 2.3.3. Eggs were spread onto glass
slides and fertilized in milt solution, then transferred to glass Mason jars for exposure.
Embryos were raised at 10C (±1C) from fertilization to hatch.
3.3.3 Test Solutions
Test solutions were prepared using the CROSERF laboratory-preparation method
(Singer et al. 2000) outlined in section 2.3.4 and a dispersant to oil ratio of 1:10 was used
for preparing oil dispersed with Corexit 9500A. Crude oils tested included Alaska North
Slope (ANSC; viscosity of 17.5cP), Medium South American (MESA; viscosity of
26.1cP), and Arabian Light (ALC; viscosity of 15.5cP). Oils were weathered to achieve a
15% loss of MESA, by weight, a 10% loss of ANSC, by weight, and a 7% loss of ALC,

67
by weight (King 2011). Quality control exposures included a negative water control and
a position control made from retene, a C-4 alkyl-phenanthrene.
Water for exposure solutions was maintained at a salinity of 15 g/L and prepared
using Kent Sea Salt (Kent Marine Inc., Georgia, USA) and dechlorinated freshwater.
Freshwater used for the P. herring experiments was drawn from Lake Ontario and treated
by the city of Kingston, ON, while freshwater for the A. herring experiments was drawn
from Dartmouth, NS municipal water.
3.3.4 Design
The basic experimental design followed that outlined in section 2.3.5. Slides of
herring eggs were exposed to WAF and CEWAF from fertilization to hatch with daily
static renewal in glass Mason jars. Jars were cleaned and solutions were renewed on a
daily basis. Embryos remained attached to the glass slides until hatch (approximately 14
days for A. herring and 21 days for P. herring). At 5 days post-fertilization (dpf),
unfertilized eggs were removed from the slides and the number of fertilized eggs was
counted. Dead embryos were removed every other day and recorded until hatch.
Pathologies associated with BSD were measured at hatch and included pericardial edema,
yolk sac edema, spinal curvature, fin rot, and craniofacial deformation.
3.3.5 Water Chemistry
Water samples were drawn from exposure solutions to quantify the concentration
of hydrocarbons by fluorescence and by Gas Chromatography-Mass Spectrometry as
outlined in section 2.3.6. Two different centrifuges were used for the experiments to

68
remove salt from samples. Samples generated from the P. herring experiment were
centrifuged at 10,621 x g, while those from the A. herring experiments were centrifuged
at 9,055 x g. Water samples generated from the P. herring experiment were analyzed for
total fluorescence using a RF-5301PC scanning spectrofluorometer (Shimadzu Corp.,
Kyoto, Japan; Panorama Fluorescence 1.1 Software, LabCognition, Dortmond, Germany)
, while those from the A. herring experiments were analyzed using a Quanta-Master
Fluorescence Spectrometer and Felix Software (Photon Technology International Ltd.,
London, ON, Canada). The excitation wavelengths were 295 nm for MESA, 278/293 nm
for ANSC, and 278 nm for ALC, and the emission range was 300- 450 nm for all oils.
3.3.6 Statistics
Nonlinear regressions and median lethal (LC50) and effective (EC50)
concentrations were estimated using SigmaPlot 11.0 (Systat Software, Inc., San Jose,
CA) and GraphPad Prism 5.00 (GraphPad Software, San Diego, CA) statistical packages.
To calculate LC50s, lower constraints for percent mortality were set at the negative
control (A. herring = 7.69%; P. herring = 8.69%) for the corresponding experiments and
upper constraints were set at 100% to represent the maximum possible response. EC50s
were calculated for percent normal, percent hatch and BSD Severity Index. The upper
constraints for percent normal (A. herring = 80.77%; P. herring = 78.26%) and hatch (A.
herring = 96.15%; P. herring = 95.65%) were set at the corresponding negative controls
and the lower constraints were zero. The BSD Severity Index is a normalized value
based on the sum of the BSD scores for each fish (including mortalities) and averaged

69
within treatments. Lower constraints were set at the response level of the negative
controls (A. herring and P. herring = 0.11) and the upper constraints at the maximum
possible score of 1.0, where all embryos would be dead. Statistical comparisons were
performed as outlined in section 3.3.6.
3.4 Results
The concentration of petroleum hydrocarbons measured by fluorescence for
exposures of MESA and ANSC, WAF and CEWAF, increased linearly with the volume
of oil added (Figure 3-1). There was approximately a 100-fold increase in the
concentration of fluorescing petroleum hydrocarbons in the water as a result of chemical
dispersion (F-test, P < 0.001). The slopes of MESA and ANSC CEWAF were
statistically parallel (F-test, P = 0.25), and there was no difference in soluble fluorescent
hydrocarbon concentrations in CEWAFs of the two oils (F-test, P = 0.09). Although, the
slopes of MESA and ANSC WAF were not parallel (F-test, P = 0.02), the y-values at log
fluorescence of 1.0 were not significantly different (F-test, P = 0.45).
The hydrocarbon concentrations deduced from GC-FID and spectrofluorescence
formed a linear relationship with log-transformed data (Figure 3-1). The relationships for
MESA and ANSC formed linear functions with equations y = 1.09x – 0.61 and y = 1.29x
– 0.84, respectively. The lines were parallel (F-test, P = 0.36) and when data were
combined graphically, they shared a slope of 1.17. The lines are steeper than a 1:1 line
and would intersect the 1:1 line at about 100 mg/L. Additionally, the y-values at log
fluorescence of 1.0 were not significantly different (F-test, P = 0.22). Total petroleum

70
hydrocarbon (TPH) concentrations were estimated from the linear log-log relationship
presented in Figure 3-1 (Table 3-1). Because of the deviation from the 1:1 line,
fluorescence in relation to TPH would be increasingly inaccurate with decreasing
concentration, meaning the greatest uncertainty would be at the threshold of toxicity.
Hatched embryos of both species showed signs of BSD, including spinal
curvature, pericardial edema, yolk sac edema, fin rot, and craniofacial malformation.
Severe spinal curvatures often accompanied edema and resulted in an inability to swim in
a directed fashion. The frequency and severity of BSD observed in hatched embryos
increased with increasing concentration and exposure time. The mean response of
negative controls was: % Mortality = 8.2 ± 0.99%; % Normal = 80 ± 1.7%; % Hatch = 96
± 0.35%; BSD Severity Index = 0.11 ± 0.
Atlantic herring embryos appear to be about 4 times more sensitive to ANSC
exposure than P. herring embryos for most parameters examined (Figure 3-2). For
mortality, the confidence limits for the A. herring LC50 for ANSC were too wide to
estimate, so a test of significance between the LC50s of the two species was not possible.
Alternatively, there was a significant difference between the EC50s of percent normal
(EC50%Normal; F-test, P < 0.001) and the BSD Severity Index (EC50SI; F-test, P < 0.001)
for the two species, but the EC50s for percent hatch (EC50%Hatch) were not significantly
different (F-test, P = 0.57).
MESA exposure resulted in exposure-related toxicity to P. herring embryos
(Figure 3-3). MESA appeared to be two times more toxic than ANSC to P. herring

71
embryos; however the confidence intervals of all parameters overlapped and the
relationships were not significantly different.
3.5 Discussion
Hatched embryos exhibited signs of BSD, including yolk sac edema, pericardial
edema, spinal curvature, fin rot, and craniofacial malformations, which are known to
correlate with exposure to PAH (Hodson et al. 2007). A 100-fold increase in
concentration of fluorescing petroleum hydrocarbons resulted from chemical dispersion
of the crude oils tested, and the concentrations did not differ between MESA and ANSC
oils at equal nominal loadings. Exposures of ANSC appeared four times more toxic to A.
herring than P. herring, and P. herring responded similarly to ANSC and MESA
exposures. Alternatively, ANSC appeared two times more toxic to A. herring embryos
than ALC.
A comparison of hydrocarbon concentrations in exposure solutions deduced from
GC-FID and fluorescence demonstrated a linear relationship (Figure 3-1). Fluorescence
was chosen to monitor the bioassays because a large number of samples required
processing, the analysis and equipment are relatively simple, and samples could be
processed on-site at a lower cost. To quantify hydrocarbon concentrations, a standard
curve was prepared from whole oil for comparison to unknowns, and the wavelengths
targeted were specific to phenanthrenes (three-ringed PAH), which are abundant in oil,
toxic to early life stages of fish (Turcotte et al. 2011), and identified as one of the most
likely groups of PAH responsible for the toxicity of oil (Heintz et al. 1999; Hodson et al.

72
2007). The results indicate that while fluorescence measurements can be used to predict
total hydrocarbon concentrations that would be attained by the much more costly and
time consuming GC-FID method, there will be a bias towards over-stating toxicity at low
concentrations. The underestimate in concentration is likely due to the relative
solubilities of the components of oil because we are assuming that the compounds
targeted by fluorescence will vary in proportion to the other components of oil (high
molecular weight PAH and resins, waxes, and asphaltenes). In actual fact, the
compounds measured by fluorescence using a standard curve of whole oil may not be
representative of the soluble compounds present in CEWAF, which could explain why
the comparison between fluorescence and GC-FID does not follow the 1:1 line (Figure 3-
1b). When preparing a standard curve of whole oil, all compounds in oil are forced into
solution using hexanes, but CEWAF is only composed of the compounds that are soluble
in water.
There was no significant difference between the GC-FID – fluorescence
relationships for MESA and ANSC oils, implying that the quantity of fluorescing
petroleum hydrocarbons (e.g. phenanthrenes) within the solutions were present in similar
proportions (Appendix A). Additionally, there was no significant difference between the
two oils with regards to toxicity to P. herring embryos. One can conclude that the
potencies of compounds causing BSD in P. herring embryos were similar in ANSC and
MESA oils.

73
ANSC appeared four times more toxic to A. herring than to P. herring. It is
plausible that the difference between the two species is an artifact of variability among
females and egg quality (refer to Chapter 2). Should this be the case, the similarity
between the two species is favourable for risk assessment, as there have been abundant
data compiled on the risks of oil exposure to P. herring. If A. herring are in fact more
susceptible to oil exposure, it would be best to focus on data from A. herring to ensure
that limits on PAH exposure are set low enough to protect both species. Sweezey (2005)
found the 14 day LC50 for A. herring exposed to MESA to be 1.02 mg/L (WAF and
CEWAF) of fluorescing hydrocarbons and the 14 day EC50 (% Normal) to be 0.15 mg/L
(based solely on WAF). In comparison with our data (Table 3-1), MESA appears to be
about two times more toxic to A. herring embryos than P. herring. Lacking confidence
limits, we cannot determine if these results are significantly different. However, the
results fall just slightly outside of our confidence limits (Table 3-1), indicating that the
two species would not be statistically different.
In addition, the comparison of toxicity to A. herring embryos demonstrated that
ANSC is two times more toxic than ALC (refer to Chapter 2). Assuming the aromatic
portion of oil is primarily responsible for toxicity, the chemical characteristics of the oils
reflect the difference in toxicity, since ANSC has two times more aromatics per gram of
oil than ALC (Appendix A). Although MESA appears to be two times more toxic than
ANSC to P. herring, the relationship is not significant and the two oils have about the
same percentage of aromatics, indicating that they have similar toxicity.

74
Fish are most sensitive to oil exposure during periods of embryonic development,
particularly immediately following fertilization and hatch (Linden 1975; McIntosh et al.
2010). More specifically, herring embryos appear to be most sensitive during the blastula
and gastrula stages of development, which occur within 48 h of fertilization (Linden
1975). As a result, we exposed embryos from fertilization to estimate the maximum
potential toxicity.
Unfortunately, fertilization success and egg quality were not always ideal,
resulting in numerous failed experiments from poor or negligible fertilization of eggs.
Additionally, egg quality and exposure response among and within females were highly
variable. Experiments can be affected by the quality of gonads, including age, condition,
collection methods, transportation and storage time, and ripeness (Dinnel et al. 2002). In
fact, fertilization success among females can range from 0-100% and is significantly
different among sampling sites (Dinnel et al. 2002) and year-class (Kocan et al. 1996).
Additionally, the percentage of normal embryos in a negative control treatment can range
from 0-100% (Dinnel et al. 2002; Purcell et al. 1990). With this in mind, treatment
replicates were discarded if there were fewer than five fertilized eggs and toxicity was
normalized to the negative control. If percent normal of negative controls for a replicate
was less than 75%, the entire replicate was discarded. Despite high variability among
spawning sites, hydrocarbon concentrations present immediately following the Exxon
Valdez spill were high enough to cause toxicity (Hose et al. 1996). Because of the nature
of the experiments and the difficulty with egg fertilization, data pertaining to Atlantic
75
herring are scarce and valuable. An alternative to obtaining fish from roe herring
fisheries would be to catch live adults and ripen them in the lab, which can produce
consistent fertilization success (J. Rice, NOAA, Juneau, AK, personal communication).
Much of the toxicity to herring embryos during the Exxon Valdez Oil Spill was
likely a result of photooxidation (Carls et al. 1999). It has been well documented that UV
light increases the toxicity of PAH to herring embryos and other fish (Barron et al. 2004;
Carls et al. 1999). In this experiment, the interaction between UV light and toxicity was
avoided by raising the embryos in a dark environment with less than two hours per day
exposure to very dim light during embryo examination and maintenance. Nevertheless, a
comparison of UV-toxicity is an important research need.
Future research must include additional replicates to compile a sufficient database
for better estimates of toxicity. Additional experiments will also increase the statistical
power with which to make concrete conclusions about toxicity with regards to herring
species and oils. It is recommended that additional oils be tested. One should also
examine the differences in toxicity among exposure times (See Chapter 2). Since A.
herring may be more sensitive to oil exposure, further experiments should be done to
better understand the relationships among the Clupea species and to determine the
variability among females and egg quality.
3.6 Conclusion
Chemical dispersion of oil increases the concentration of petroleum hydrocarbons
in the water by 100-fold, which increases the risk to herring embryos should a spill be

76
dispersed over a spawning bed during spawning season. ANSC appears to be four times
more toxic to A. herring embryos than to P. herring embryos, while P. herring respond
similarly to ANSC and MESA, as indicated by the aromatic compositions of the oils and
the lack of statistical differences among LC50s and EC50s. Alternatively, ANSC has two
times more aromatics than ALC and appears to be two times more toxic to A. herring
embryos. Further testing is required to determine if Atlantic herring are indeed more
sensitive to oil exposure, but the sensitivity to oil exposures of the two species appear to
be sufficiently similar that the data available can be used for risk assessment for both
species.
3.7 Acknowledgements
This research was funded by the Prince William Sound Regional Citizens‟
Advisory Council, Anchorage, AK, and the Centre for Offshore Oil, Gas and Energy
Research (COOGER), Fisheries and Oceans Canada, Dartmouth, NS. We would like to
thank the Hodson lab; the employees of COOGER; Simon Courtenay, Sarah Johnson,
and Monica Boudreau from the Gulf Fisheries Centre, Moncton, NB; Claire McIntyre
and Chloe Ready for technical assistance; and Mark Williston, Gilbert Donaldson, and
Jaclyn Cleary for acquisition of fish.
3.8 References
Barron, M.G., M.G. Carls, R. Heintz, and S.D. Rice. 2004. Evaluation of fish early life-
stage toxicity models of chronic embryonic exposures to complex polycyclic aromatic
hydrocarbon mixtures. Toxicological Sciences. 78:60-67.

77
Cantrell, S., M. Hannick, and D. Tillitt. 1996. Semi-quantitation of programmed cell
death in TCDD-exposed medaka (Oryzias latipes) embryos. Proceedings, 17th
Annual
Meeting, Society of Environmental Toxicology and Chemistry, Washington, DC. p.204.
Carls, M.G., S.D. Rice, and J.E. Hose. 1999. Sensitivity of fish embryos to weathered
crude oil: part I. Low-level exposure during incubation causes malformations, genetic
damage, and mortality in larval Pacific herring (Clupea pallasi). Environmental
Toxicology and Chemistry. 18:481-493.
Dinnel, P.A., N.T. Schwark, A. Balderas, M. Cotter, and D.P. Middaugh. 2002.
Development of embryo and larval Pacific herring, Clupea pallasi, bioassay protocols: P.
herring II. Shannon Point Marine Center. Western Washington University, Anacortes,
WA.
Funk, F. 1994. Preliminary summary of 1994 Alaska roe sac herring fisheries. Alaska
Department of Fish and Game, Juneau, AK.
Heintz, R.A., J.W. Short, and S.D. Rice. 1999. Sensitivity of fish embryos to weathered
crude oil: part II. Increased mortality of pink salmon (Oncorhynchus gorbuscha) embryos
incubating downstream from weathered Exxon Valdez crude oil. Environmental
Toxicology and Chemistry. 18:494-503.
Hodson, P.V., C.W. Khan, G. Saravanabhavan, L. Clarke, R.S. Brown, B. Hollebone, Z.
Wang, J. Short, K. Lee, and T. King. 2007. Alkyl PAH in crude oil cause chronic toxicity
to early life stages of fish. Proceedings of the 2007 Arctic and Marine Oil Spill
Conference, Edmonton, AB.
Hose, J.E., M.D. McGurk, G.D. Marty, D.E. Hinton, E.D. Brown, and T.T. Baker. 1996.
Sublethal effects of the Exxon Valdez oil spill on herring embryos and larvae: morP.
herringological, cytogenetic, and histopathological assessments, 1989-1991. Canadian
Journal of Fisheries and Aquatic Sciences. 53:2355-2365.
King, T. 2011. Do surface films negatively bias the effect of oil spill chemical dispersants
in a wave tank test facility? MSc thesis, Saint Mary‟s University, Halifax, NS.
Kocan, R.M., J.E. Hose, E.D. Brown, and T.T. Baker. 1996. Pacific herring (Clupea
pallasi) embryo sensitivity to Prudhoe Bay petroleum hydrocarbons: laboratory
evaluation and in situ exposure at oiled and unoiled sites in Prince William Sound.
Canadian Journal of Fisheries and Aquatic Sciences. 53:2366-2375.
Linden, O. 1975. Acute effects of oil and oil/dispersant mixture on larvae of Baltic
herring. Ambio. 4:130-133.
McIntosh, S., T. King, W. Dongmei, and P.V. Hodson. 2010. Toxicity of dispersed
weathered crude oil to early life stages of Atlantic herring (Clupea harengus).
Environmental Toxicology and Chemistry. 29:1160-1167.

78
Paine, R.T., J.L. Ruesink, A. Sun, E.L. Soulanille, M.J. Wonham, C.D.G. Harley, D.R.
Brumbaugh, and D.L. Secord. 1996. Trouble on oiled waters: lessons from the Exxon
Valdez oil spill. Annual Review of Ecology and Systematics. 27:197-235.
Pearson, W.H., R.A. Elston, R.W. Bienert, A.S. Drum, and L.D. Antrim. 1999. Why did
the Prince William Sound, Alaska, Pacific herring (Clupea pallasi) fisheries collapse in
1993 and 1994? Review of hypotheses. Canadian Journal of Fisheries and Aquatic
Sciences. 56:711-737.
Purcell, J.E., D. Grosse, and J.J. Glover. 1990. Mass abundances of abnormal Pacific
herring larvae at a spawning ground in British Columbia. Transactions of the American
Fisheries Society. 119:463-469.
Short, J.W. and P.M. Harris. 1996. Chemical sampling and analysis of petroleum
hydrocarbons in near-surface seawater of Prince William Sound after the Exxon Valdez
oil spill. American Fisheries Society Symposium. 18:17-28.
Singer, M.M., D. Aurand, G.E. Bragin, J.R. Clark, G.M. Coelho, M.L. Sowby, and R.S.
Tjeerdema. 2000. Standardization of the preparation and quantitation of water-
accommodated fractions of petroleum for toxicity testing. Marine Pollution Bulletin.
40:1007-1016.
Sweezy, M. 2005. Assessing the risk of oil spills in Atlantic Canada: MESA light crude
oil toxicity to Atlantic herring (Clupea harengus) and a comparison of Orimulsion and
Type 6 Heating Fuel toxicity to rainbow trout (Oncorhynchus mykiss). Undergraduate
thesis, Queen‟s University, Kingston, ON.
Turcotte, D., P. Akhtar, M. Bowerman, Y. Kiparissis, R.S. Brown, and P.V. Hodson.
2011. Measuring the toxicity of alkyl-phenanthrenes to early life stages of medaka
(Oryzias latipes) using partition-controlled delivery. Environmental Toxicology and
Chemistry. 30:487-495.

79
3.9 Figures
Nominal Oil Loading (%v/v)
0.001 0.01 0.1 1 10 100
Flu
ore
sce
nt
Co
mp
ou
nd
s (
mg/L
)
0.001
0.01
0.1
1
10
100
ANSC WAF
MESA WAF
ANSC CEWAF
MESA CEWAF
MESA WAF:
y=0.23x0.68
ANSC WAF:
y=0.18x1.25
MESA CEWAF:
y=11.78x0.81
ANSC CEWAF:
y=22.08x0.98
LOD
Log Total Petroleum Hydrocarbons (mg/L)
-0.5 0.0 0.5 1.0 1.5 2.0
Log F
luore
scent
Com
pounds (
mg/L
)
-1.0
-0.5
0.0
0.5
1.0
1.5
2.0
2.5
ANSC
MESA
1:1 Line
ANSC:y = 1.29x - 0.84
MESA:y = 1.09x - 0.61
Figure 3-1: The concentration of petroleum hydrocarbons in test solutions at different loadings of
the water accommodated fraction (WAF) and the chemically-enhanced water accommodated
fraction (CEWAF) of Alaska North Slope Crude (ANSC; WAF R2 = 0.87; CEWAF R
2 = 0.98)
and Medium South American Crude (MESA: WAF R2 = 0.79; CEWAF R
2 = 0.95) oils (A). The
dotted line shows the extrapolated concentration from the line of best fit below the limit of
detection (LOD). The data points at Nominal Oil Loadings of 0.32 and 0.1%, which are at or
below the LOD have been shown for comparison. The lower panel (B) shows the relationship
between fluorescent hydrocarbon compounds measured by spectrofluorescence and total
petroleum hydrocarbons measured by GC-FID for CEWAF of ANSC (R2 = 0.96) and MESA (R
2
= 0.93). The dotted line is a 1:1 line added for comparison.
A
B

80
0.01 0.1 1 10 100
% M
ort
ality
0
20
40
60
80
100
Atlantic CEWAF
Atlantic WAF
Pacific CEWAF
Pacific WAF
Negative Control
Pacific Herring
Atlantic Herring
0.01 0.1 1 10 100
% N
orm
al
0
20
40
60
80
100
Negative Controls
Pacific Herring
Atlantic Herring
Measured Concentration (mg/L)
0.01 0.1 1 10 100
% H
atc
h
0
20
40
60
80
100
Negative Controls
Pacific Herring
Atlantic Herring
Measured Concentration (mg/L)
0.01 0.1 1 10 100
BS
D S
eve
rity
In
de
x
0.0
0.2
0.4
0.6
0.8
1.0
Negative Controls
Pacific Herring
Atlantic Herring
Figure 3-2: Toxicity of the water accommodated fraction (WAF) and chemically-enhanced water
accommodated fraction (CEWAF) of Alaska North Slope Crude (ANSC) to Atlantic and Pacific
herring embryos, expressed as (A) % Mortality, (B) % Normal, (C) % Hatch, and (D) BSD
Severity Index in relation to the measured concentration of fluorescing compounds (mg/L).
Regression analysis was done by grouping the WAF and CEWAF data and equations can be
found in Appendix G. The Atlantic herring data were imported from Figure 2-3. N = 20
embryos for each exposure.
A B
C D

81
0.01 0.1 1 10 100
% M
ort
ality
0
20
40
60
80
100
MESA CEWAF
MESA WAF
ANSC CEWAF
ANSC WAF
Negative Control
ANSC
MESA
0.01 0.1 1 10 100
% N
orm
al
0
20
40
60
80
100
Negative Control
ANSC
MESA
Measured Concentration (mg/L)
0.01 0.1 1 10 100
% H
atc
h
0
20
40
60
80
100
Negative Control
ANSC
MESA
Measured Concentration (mg/L)
0.01 0.1 1 10 100
BS
D S
everity
Index
0.0
0.2
0.4
0.6
0.8
1.0
Negative Control
ANSC
MESA
Figure 3-3: Toxicity of the water accommodated fraction (WAF) and chemically-enhanced water
accommodated fraction (CEWAF) of Alaska North Slope Crude (ANSC) and Medium South
American Crude (MESA) oils to Pacific herring embryos, expressed as (A) % Mortality, (B) %
Normal, (C) % Hatch, and (D) BSD Severity Index in relation to the measured concentration of
fluorescing compounds (mg/L). Regression analysis was done by grouping the WAF and
CEWAF data and equations can be found in Appendix G. The ANSC data were imported from
Figure 3-2. N = 20 embryos for each exposure.
A B
C D

82
Table 3-1: The toxicity of Medium South American Crude (MESA), Alaska North Slope Crude
(ANSC), and Arabian Light Crude (ALC) oils to Atlantic and Pacific herring embryos, expressed
as median lethal concentrations (LC50s; % Mortality) and median effective concentrations
(EC50s; % Normal, % Hatch, BSD Severity Index). Values are based on measured
concentrations of fluorescing petroleum hydrocarbons (FL) and total petroleum hydrocarbons
(TPH) estimated from Figure 1, and shown with 95% confidence intervals (CI).
Atlantic Herring (LC50s and EC50s in mg/L)
MESA ANSC ALC
FL TPH FL TPH FL TPH
%
Mortality
LC50 - - 1.32 5.50 2.29 -
CI - - Wide Wide Wide -
%
Normal
EC50 - - 0.17 1.14 0.37 -
CI - - 0.15-0.19 1.03-1.24 0.24-0.57 -
% Hatch EC50 - - 2.99 10.5 2.29 -
CI - - 1.51-5.93 5.89-17.8 Wide -
BSD EC50 - - 0.66 3.24 2.07 -
CI - - 0.48-0.89 2.51-4.08 1.01-4.24 -
Pacific Herring (LC50s and EC50s in mg/L)
MESA ANSC ALC
FL TPH FL TPH FL TPH
%
Mortality
LC50 2.53 8.51 4.32 13.8 - -
CI 1.32-4.82 4.68-15.5 3.49-5.42 11.7-16.6 - -
%
Normal
EC50 0.29 1.16 0.66 3.24 - -
CI 0.17-0.50 0.71-1.86 0.40-1.08 2.19-4.79 - -
% Hatch EC50 3.15 10.5 4.45 14.5 - -
CI 2.55-3.89 8.91-12.6 3.75-5.28 11.0-16.2 - -
BSD EC50 1.27 4.47 2.40 8.91 - -
CI 0.52-3.10 2.00-10.3 1.74-3.31 6.92-11.2 - -

83
Chapter 4
General Discussion and Summary
4.1 Overview
Significant declines in Pacific herring (Clupea pallasi) populations have followed
two major oil spill events in the United States, the Exxon Valdez oil spill and the Cosco
Busan oil spill. As a result, many studies have been performed and documented in the
literature to assess the risk to Pacific herring of oil exposure. In contrast, tanker
transportation routes throughout the Northwestern Atlantic Ocean coincide with Atlantic
herring (Clupea harengus) spawning grounds, but little research has been done to study
the risk of oil exposure to Atlantic herring.
Polycyclic aromatic hydrocarbons (PAH), as major components of oil, are toxic to
early life stages of fish and can cause blue sac disease (BSD; Billiard et al. 1999; Khan
2007). Chemical dispersion of crude oil increases the concentration of hydrocarbons,
including PAH in the water column by 100-fold, which increases their bioavailability to
early life stages of fish. Previous research on Atlantic herring embryos indicates that
chemically dispersed crude oil is indeed more toxic than un-dispersed oil (McIntosh et al.
2010; Sweezey 2005). McIntosh et al. (2010) determined that fertilization was severely
hindered when gametes were exposed to oil, and that herring were most sensitive to oil
immediately following fertilization and hatch. Additionally, effects can be seen after
exposures to chemically dispersed crude oil of only one hour (McIntosh et al. 2010), and
Sweezey (2005) observed BSD in Atlantic herring embryos at concentrations as low as
84
0.12 mg/L of fluorescing compounds (14 d exposure; measured by fluorescence). As a
result of these studies, it was determined that there is a research need for toxicity data
obtained from experiments using more realistic exposure scenarios and times, and a
comparison made between Atlantic and Pacific herring.
The main objective of this thesis was to determine if laboratory experiments are
suitable alternatives for assessing risk of oil exposure to fish compared to an in situ field
experiment at sea. This was done by dispersing oil in a model ecosystem (wave tank)
and comparing the observed toxicity to parallel laboratory experiments. Additionally,
dispersant effectiveness testing has shown that petroleum hydrocarbons are maintained in
the water column after a real spill for a few hours to a few days, but not to the extent of a
chronic laboratory toxicity test from fertilization to hatch (Li et al. 2009). As a result, we
tested the effects of exposure times of 2.4, 8, 24 h, and 14 d post-fertilization. This thesis
also measured the chronic toxicity of chemically dispersed Medium South American
(MESA), Alaska North Slope (ANSC) and Arabian Light (ALC) crude oils to Pacific and
Atlantic herring embryos to provide a greater knowledge base for risk assessment in the
event of an oil spill off Canada‟s east coast.
The toxicities of two crude oils (ANSC and ALC) chemically dispersed in a wave
tank to Atlantic herring embryos were compared to the toxicity of the chemically-
enhanced water accommodated fraction (CEWAF) generated by the standard CROSERF
lab method (Singer et al. 2000). The concentrations of petroleum hydrocarbons produced
from ALC dispersed in the wave tank were lower than those produced from the lab

85
method and as a result, toxicity was not observed. On the other hand, toxicity was
observed from ANSC dispersed in the wave tank. In fact, solutions sampled from the
wave tank 15 minutes post-dispersion caused a greater toxicity than lab-prepared
CEWAF, indicating that the oil droplets were releasing sufficient hydrocarbons to be
toxic to the herring embryos. Other exposures from the wave tank appeared to follow the
toxicity generated by the lab method. Thus, lab estimates of dispersed oil toxicity should
not differ significantly from estimates of the toxicity of dispersed oil sampled from a
model ecosystem (wave tank) or the receiving water of an oil spill.
The results of the exposure time experiments indicate that toxicity is dependent
upon both concentration and exposure time, which corresponds to results found by
McIntosh et al. (2010) and Rice et al. (1987). Toxicity of ANSC CEWAF increased
linearly with exposure time, while toxicity of ALC CEWAF appeared to reach a
maximum after 8 h. This suggests that by 8 h, the bioavailable hydrocarbons in the ALC
CEWAF exposures had been taken up by the embryos, but toxicity to ANSC CEWAF
continued beyond 8 h. Most importantly, toxicity can be observed at exposure times that
are more likely to be observed following a real oil spill.
Chronic toxicity testing showed that Atlantic herring embryos were two times
more sensitive to exposures of ANSC than ALC, and there was no difference in toxicity
to Pacific herring embryos between ANSC and MESA exposures. The observed
difference in toxicity corresponded with the chemical composition of the oils, specifically
the concentration of PAH, i.e., ANSC and MESA oils have two times more aromatics
than ALC. In addition, ANSC and MESA have two times more alkyl-phenanthrenes than

86
ALC, which are a component of PAH and known to be highly toxic to early life stages of
fish (Barron et al. 2004; Turcotte et al. 2011). These data highlight a connection between
the aromatic composition of oil and its toxicity.
To compare Atlantic and Pacific herring, embryos of both species were exposed
to ANSC. Atlantic herring appeared to be four times more sensitive to oil exposure than
Pacific herring embryos, as determined by the percentage of normal embryos at hatch and
the incidence of BSD. The sensitivity difference between the two species may be an
artifact of variability among females and egg quality, an important issue when working
with Atlantic herring taken from commercial fisheries. However, negative control data
were virtually identical between the two experiments. The results indicate that chemical
dispersion of oil increases the risk to herring embryos and exposure limits for risk
assessment need to be set conservatively to protect the two species because variability in
egg quality increases uncertainty in estimates of toxicity.
4.2 Significance of Findings and Future Work
This research was implemented in response to a need for more detailed
toxicological information on the effects of chemical dispersants on the toxicity of spilled
oil. The wave tank studies also have direct relevance to research on wave tank conditions
that affect the extent of oil dispersion. Externally, the results are linked to current
research by the US EPA on methods for generating, testing, and characterizing dispersed
oil. The next step would be to extend these tests in the wave tank and then in the field
with increasing degrees of realism of exposure conditions. For example, herring embryos

87
can be tested directly in the wave tank by suspending glass slides coated with eggs within
the tank, or suspended in cages within the trajectory of an oil spill in the field. To expand
our knowledge, different oils and species could also be tested.
A direct comparison of Atlantic and Pacific herring has not been made before, and
the difference in sensitivity is sufficiently small and variable that the two species could be
considered to have essentially the same sensitivity to oil. This significantly increases the
capacity to predict chemical effects for models of oil spread and ecological impacts, and
for ecological risk assessments where data are often sparse and not suited for specific
questions. In future, capturing live adults and holding them in seawater until they ripen
would increase the rate of successful fertilization (J. Rice, NOAA, Juneau, AK, personal
communication).
Herring are a multi-million dollar (USD) resource along the Eastern and Western
coasts of North America (Brown and Carls 1998), and are more at risk of oil exposure
than some other species because the eggs are sessile when laid and unable to avoid a spill
(Smith and Cameron 1979). Additionally, spawning often occurs in shallow areas where
oil is more likely to reach (Haegele and Schwiegert 1985; Smith and Cameron 1979).
Spawning seasons vary with latitude and species (Brown and Carls 1998), with Atlantic
herring spawning primarily in the Spring and Fall, and Pacific herring in the Winter and
Spring (Haegele and Schweigert 1985). Incubation time is dependent on temperature,
but Atlantic herring hatch approximately 14 d post-fertilization and Pacific herring
approximately 21 d, which would place herring spawning beds at risk for at least three
weeks. Additionally, the window of sensitivity is highly dependent on spill location, as

88
herring spawn could be present from February to October, and oil exposure could be very
detrimental to both the economy and the future of the species.
Most importantly, toxicity can be observed at concentrations and exposure times
relevant to real spills (Short and Harris 1996; Carls et al. 1999) and medium crude oils
have a higher potential for toxicity when compared to light oils. As found by Carls et al.
(1999), toxicity to Pacific herring embryos is evident at tPAH concentrations up to 15
times lower than those observed following the Exxon Valdez oil spill (Short and Harris
1996) and we have determined that Atlantic herring respond similarly to oil exposure.
Following the Prestige oil spill, Gonzalez et al. (2006) observed tPAH concentrations up
to 5.80 µg/L in the water column, which too is above that indicated by Carls et al. (1999)
to be toxic to Pacific herring embryos. This suggests that PAH concentrations following
real oil spills would be high enough to cause toxicity to Atlantic herring embryos in the
event of a large spill on the East Coast of Canada.
4.3 Summary
1. Chemical dispersion of oil increased the concentration of hydrocarbons in the
water column 100-fold, and ALC had more soluble fluorescent hydrocarbons than
ANSC in both CEWAF and WAF.
2. There was no difference in toxicity to Pacific herring embryos of two chemically-
dispersed medium crude oils (MESA and ANSC) and ANSC was two times more
toxic to Atlantic herring embryos than ALC, a light crude oil.

89
3. These results provide a linkage between toxicity and chemical composition of oil,
as the medium oils contain equal quantities of aromatic compounds, including
phenanthrenes, and the light oil contains two times fewer aromatics.
4. Toxicity to Atlantic herring embryos increased with exposure time to chemically-
dispersed ANSC.
5. Toxicity of chemically-dispersed ALC to Atlantic herring embryos reached a
maximum at an exposure duration of 8 h, but toxicity increased when exposure
solutions were renewed.
6. In exposure time experiments, toxicity was endpoint dependent and % Normal
was the most sensitive response to oil exposure.
7. Lab estimates of dispersed oil toxicity should not differ from estimates of the
toxicity of dispersed oil sampled from a model ecosystem (wave tank).
8. Atlantic herring appeared to be four times more sensitive to ANSC than Pacific
herring embryos.
4.4 References
Barron, M.G., M.G. Carls, R. Heintz, and S.D. Rice. 2004. Evaluation of fish early life-
stage toxicity models of chronic embryonic exposures to complex polycyclic aromatic
hydrocarbon mixtures. Toxicological Sciences. 78:60-67.
Billiard, S.M., K. Querbach, and P.V. Hodson. 1999. Toxicity of retene to early life
stages of two freshwater fish species. Environmental Toxicology and Chemistry. 18:2070-
2077.
Brown, E.D. and M.G. Carls. 1998. Restoration notebook: Pacific herring, Clupea
pallasi. Exxon Valdez Oil Spill Trustee Council, September 1998.
Carls, M.G., S.D. Rice, and J.E. Hose. 1999. Sensitivity of fish embryos to weathered
crude oil: part I. low-level exposure during incubation causes malformations, genetic

90
damage, and mortality in larval Pacific herring (Clupea pallasi). Environmental
Toxicology and Chemistry. 18:481-493.
Gonzalez, J.J., L. Vinas, M.A. Franco, J. Fumega, J.A. Soriano, G. Grueiro, S.
Muniategui, P. Lopez-Mahia, D. Prada, J.M. Bayona, R. Alzaga, and J. Albaiges. 2006.
Spatial and temporal distribution of dissolved/dispersed aromatic hydrocarbons in
seawater in the area affected by the Prestige oil spill. Marine Pollution Bulletin. 53:250-
259.
Haegele, C.W. and J.F. Schweigert. 1985. Distribution and characteristics of herring
spawning grounds and description of spawning behavior. Canadian Journal of Fisheries
and Aquatic Sciences. 42:39-55.
Khan, C.W. 2007. Identification of compounds in crude oil that are chronically toxic to
the early life stages of fish. MSc Thesis, Queen‟s University, Kingston, ON, 132pp.
Li, Z, K. Lee, T. King, M.C. Boufadel, and A.D. Venosa. 2009. Evaluating crude oil
chemical dispersion efficacy in a flow-through wave tank under regular non-breaking
wave and breaking wave conditions. Marine Pollution Bulletin. 58:735-744.
McIntosh, S., T. King, W. Dongmei, and P.V. Hodson. 2010. Toxicity of dispersed
weathered crude oil to early life stages of Atlantic herring (Clupea harengus).
Environmental Toxicology and Chemistry. 29:1160-1167.
Rice, S.D., M.M. Babcock, C.C. Brodersen, M.G. Carls, J.A. Gharrett, S. Korn, A.
Moles, and J.W. Short. 1987. Lethal and sublethal effects of the water-soluble fraction of
Cook Inlet crude oil on Pacific herring (Clupea harengus pallasi) reproduction. NOAA
Tech. Memo. No. NMFS F/NWC-11. U.S. Department of Commerce, National Oceanic
and Atmospheric Administration, Washington, D.C.
Short, J.W. and P.M. Harris. 1996. Chemical sampling and analysis of petroleum
hydrocarbons in near-surface seawater of Prince William Sound after the Exxon Valdez
oil spill. American Fisheries Society Symposium. 18:17-28.
Singer, M.M., D. Aurand, G.E. Bragin, J.R. Clark, G.M. Coelho, M.L. Sowby, and R.S.
Tjeerdema. 2000. Standardization of the preparation and quantitation of water-
accommodated fractions of petroleum for toxicity testing. Marine Pollution Bulletin.
40:1007-1016.
Smith, R.L. and J.A. Cameron. 1979. Effect of water soluble fraction of Prudhoe Bay
crude oil on embryonic development of Pacific herring. Transactions of the American
Fisheries Society. 108:70-75.
Sweezy, M. 2005. Assessing the risk of oil spills in Atlantic Canada: MESA light crude
oil toxicity to Atlantic herring (Clupea harengus) and a comparison of Orimulsion and
Type 6 Heating Fuel toxicity to rainbow trout (Oncorhynchus mykiss). Undergraduate
thesis, Queen‟s University, Kingston, ON.

91
Turcotte, D., P. Akhtar, M. Bowerman, Y. Kiparissis, R.S. Brown, and P.V. Hodson.
2011. Measuring the toxicity of alkyl-phenanthrenes to early life stages of medaka
(Oryzias latipes) using partition-controlled delivery. Environmental Toxicology and
Chemistry. 30:487-495.

92
Appendix A
Physical and Chemical Characteristics of Oils
Table A-1: Physical and chemical characterization of Medium South American Crude (MESA),
Alaska North Slope Crude (ANSC), and Arabian Light Crude (ALC) oils. Oils were weathered
by evaporation and sparging with air to simulate loss at sea. Density and viscosity were
measured after weathering. The aromatics include the polycyclic aromatic hydrocarbons (PAHs).
Adapted from King, 20111.
Oils Type
%
Weathered
by weight
Density
(g/mL)
Viscosity
(20ºC,
cStk)
%
Alkanes
%
Aromatics
%
Resins
%
Asphal-
tenes
MESA Medium 15 0.8802 26.1 34.2 36.5 20.8 8.5
ANSC Medium 10 0.8607 17.5 32.0 39.3 24.4 4.3
ALC Light 7 0.8691 15.5 32.7 18.9 46.9 1.5
1 King, T. 2011. Do surface films negatively bias the effect of oil spill chemical dispersants in a wave tank
test facility? MSc. thesis, Saint Mary‟s University, Halifax, NS.

93
Table A-2: Chemical characterization by GC-MS of Medium South American Crude (MESA),
Alaska North Slope Crude (ANSC), and Arabian Light Crude (ALC) oils. Values are percentages
of the polycyclic aromatic hydrocarbon (PAH) composition, including thiophenes. Total PAH
(tPAH) is a sum of the non-alkylated PAH, alkylated PAH, and thiophenes. Concentrations
below the method detection limits were treated as 0.
Composition of PAH Fraction (%)
Compound Group MESA ANSC ALC
Naphthalenes 54.07 44.52 25.14
Fluorenes 3.85 4.37 4.21
Anthracene 0.00 0.00 0.06
Phenanthrenes 16.42 15.99 8.48
Fluoranthene 0.00 0.06 0
Pyrenes 3.22 4.46 2.33
Chrysenes 3.30 5.32 1.46
5–ring PAH 0.62 0.84 0
Dibenzothiophenes 13.47 16.37 29.57
Naphthobenzothiophene 5.06 8.07 28.74
Σ Non-alkylated PAH 8.38 9.76 1.89
Σ Alkylated PAH 74.41 67.79 41.35
Σ Thiophenes 18.53 24.44 58.31
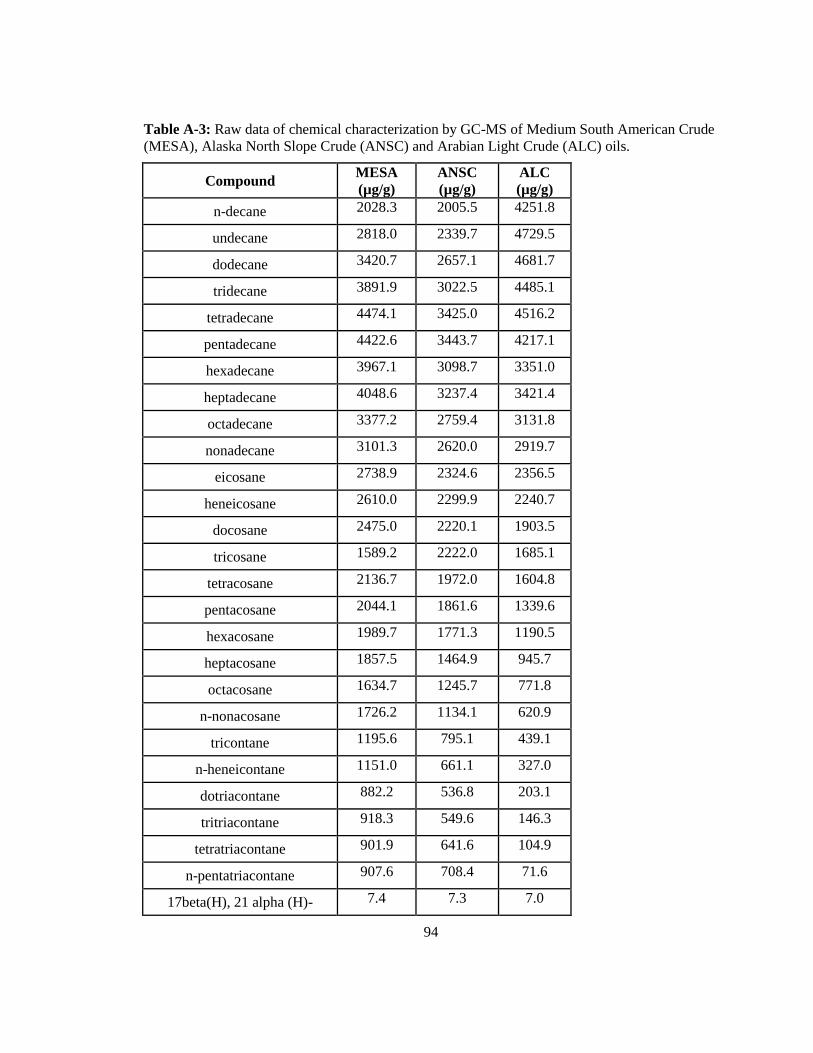
94
Table A-3: Raw data of chemical characterization by GC-MS of Medium South American Crude
(MESA), Alaska North Slope Crude (ANSC) and Arabian Light Crude (ALC) oils.
Compound MESA
(µg/g)
ANSC
(µg/g)
ALC
(µg/g)
n-decane 2028.3 2005.5 4251.8
undecane 2818.0 2339.7 4729.5
dodecane 3420.7 2657.1 4681.7
tridecane 3891.9 3022.5 4485.1
tetradecane 4474.1 3425.0 4516.2
pentadecane 4422.6 3443.7 4217.1
hexadecane 3967.1 3098.7 3351.0
heptadecane 4048.6 3237.4 3421.4
octadecane 3377.2 2759.4 3131.8
nonadecane 3101.3 2620.0 2919.7
eicosane 2738.9 2324.6 2356.5
heneicosane 2610.0 2299.9 2240.7
docosane 2475.0 2220.1 1903.5
tricosane 1589.2 2222.0 1685.1
tetracosane 2136.7 1972.0 1604.8
pentacosane 2044.1 1861.6 1339.6
hexacosane 1989.7 1771.3 1190.5
heptacosane 1857.5 1464.9 945.7
octacosane 1634.7 1245.7 771.8
n-nonacosane 1726.2 1134.1 620.9
tricontane 1195.6 795.1 439.1
n-heneicontane 1151.0 661.1 327.0
dotriacontane 882.2 536.8 203.1
tritriacontane 918.3 549.6 146.3
tetratriacontane 901.9 641.6 104.9
n-pentatriacontane 907.6 708.4 71.6
17beta(H), 21 alpha (H)- 7.4 7.3 7.0
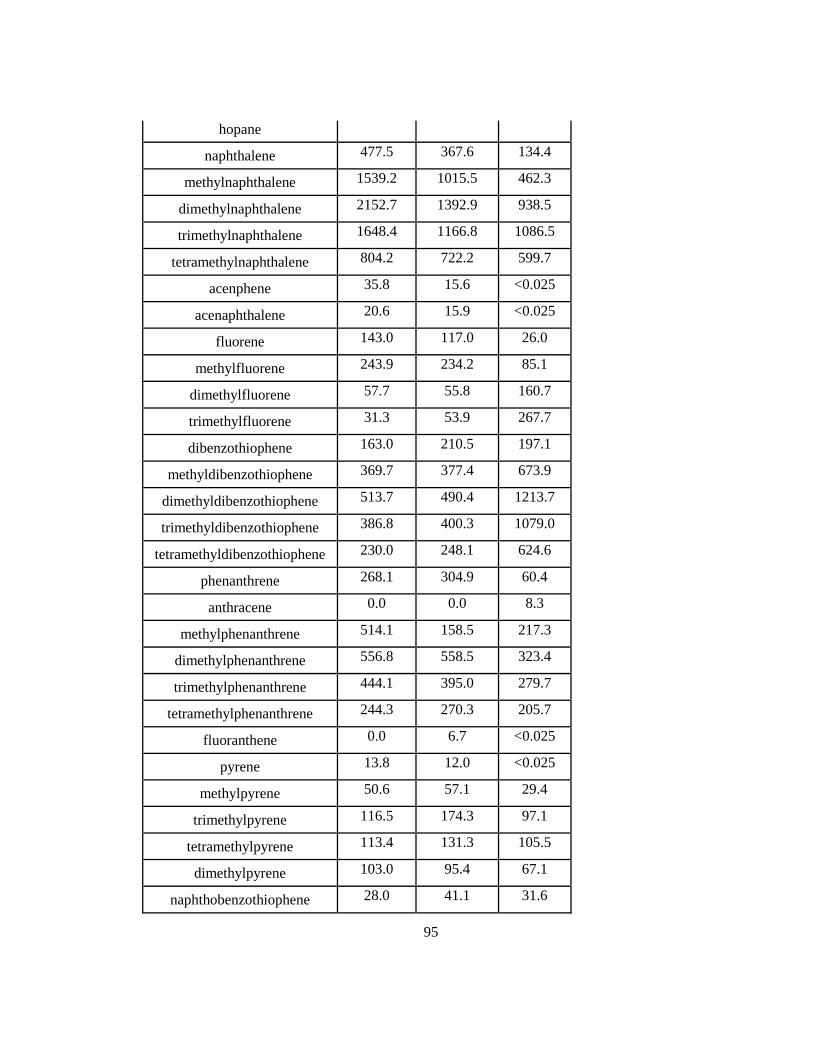
95
hopane
naphthalene 477.5 367.6 134.4
methylnaphthalene 1539.2 1015.5 462.3
dimethylnaphthalene 2152.7 1392.9 938.5
trimethylnaphthalene 1648.4 1166.8 1086.5
tetramethylnaphthalene 804.2 722.2 599.7
acenphene 35.8 15.6 <0.025
acenaphthalene 20.6 15.9 <0.025
fluorene 143.0 117.0 26.0
methylfluorene 243.9 234.2 85.1
dimethylfluorene 57.7 55.8 160.7
trimethylfluorene 31.3 53.9 267.7
dibenzothiophene 163.0 210.5 197.1
methyldibenzothiophene 369.7 377.4 673.9
dimethyldibenzothiophene 513.7 490.4 1213.7
trimethyldibenzothiophene 386.8 400.3 1079.0
tetramethyldibenzothiophene 230.0 248.1 624.6
phenanthrene 268.1 304.9 60.4
anthracene 0.0 0.0 8.3
methylphenanthrene 514.1 158.5 217.3
dimethylphenanthrene 556.8 558.5 323.4
trimethylphenanthrene 444.1 395.0 279.7
tetramethylphenanthrene 244.3 270.3 205.7
fluoranthene 0.0 6.7 <0.025
pyrene 13.8 12.0 <0.025
methylpyrene 50.6 57.1 29.4
trimethylpyrene 116.5 174.3 97.1
tetramethylpyrene 113.4 131.3 105.5
dimethylpyrene 103.0 95.4 67.1
naphthobenzothiophene 28.0 41.1 31.6

96
methylnaphthobenzothiophene 117.5 257.9 174.0
dimethylNBenzothiophene 473.0 532.5 2910.3
tetramethylNbenzothiophene 6.7 9.1 248.5
trimethylNbenzothiophene 0.0 10.7 318.1
benz[a]anthracene 47.8 52.8 <0.025
chrysene 0.0 102.0 12.6
methylchrysene 80.7 85.5 24.9
dimethylchrysene 119.8 182.4 31.5
trimethylchrysene 126.3 116.8 62.1
tetramethylchrysene 80.4 75.0 56.5
benzo[b]fluoranthene 7.3 9.7 <0.025
benzo[k]fluoranthene 0.0 0.0 <0.025
benzo[e]pyrene 10.6 13.1 <0.025
benzo[a]pyrene 3.2 3.5 <0.025
perylene 0.0 0.0 <0.025
indeno[1,2,3-cd]pyrene 0.0 0.0 <0.025
dibenz[a,h]anthracene 4.0 4.2 <0.025
benzo[ghi]perylene 3.6 5.2 <0.025

97
Appendix B
Standard Operating Procedure – Laboratory Preparation of WAF and
CEWAF
Prepared by: Colleen Greer and Peter Hodson©
1. This SOP follows the methods outlined by Singer et al. 2000
a. Singer, M.M., Aurand, D., Bragin, G.E., Clark, J.R., Coelho, G.M.,
Sowby, M.L., and Tjeerdema, R.S. 2000. Standardization of the
Preparation and Quantitation of Water-Accommodated Fractions of
Petroleum for Toxicity Testing. Mar. Pollut. Bull 40(11): 1007-1016.
2. Set-up
a. Add 90mL of exposure water to a 250 mL beaker with 1 cm stir bar
i. The same procedure can be done with a side-arm flask with
vertical sides, similar in shape (and surface area) to the beaker.
The side-arm should be positioned at the bottom of the flask, and
the tubing should NOT be silicone or rubber. A Teflon stopcock
and glass tubing are ideal.
b. Let the test oil reach room temperature then add 10mL of oil to water.
c. The water-oil mixture should be 1 part oil: 9 parts water.
3. Stirring
a. Place beaker onto a stir plate.
b. Cover with tin foil or a glass plate.
98
c. Start stirring and adjust the speed so that the vortex formed in the oil is 1/3
the height of the water.
d. Stir for 18h at this speed.
4. WAF (Water Accommodated Fraction):
a. After 18h, stop stirring and let the 2 phase system sit for 1h so that oil
droplets (if any) coalesce at the surface.
b. After 1h, carefully decant the WAF, i.e., the bottom phase of the mixture,
being careful to avoid any droplets of oil. The WAF should be virtually
clear and colorless without suspended droplets or floating oil. There will
be a significant amount of oil left floating on the surface of the 2-phase
system, about the same volume as was added.
i. WAF can be decanted with a glass syringe with polyethylene
tubing attached to the tip. Draw a small amount of air into the
syringe, insert the tubing through the oil, expel the air, and draw
the CEWAF solution into the syringe.
ii. Where a side-arm flask is used, the stopcock is opened carefully
and the WAF drained into a glass beaker.
c. Dilute the WAF solution at the desired concentration (nominal oil loading
%v/v) into test solutions as soon as possible after recovering the WAF
stock solution,
5. CEWAF (Chemically Enhanced WAF):

99
a. After 18h of stirring, add 1mL of dispersant (1 part dispersant: 10 parts
Oil; or alter for the required dispersant to oil ratio) (Another common ratio
is 1:20).
b. Continue stirring for 1h
c. After 1h, stop stirring and let sit for 1h
d. After 1h, carefully decant off the bottom phase of the mixture as described
for WAF. CEWAF is usually turbid and yellow to brown in colour with
few visible droplets of oil (most are too tiny to see) and no floating oil.
After dispersion, there will be less oil left on the surface of the stirred oil-
water 2-phase system than there was with WAF.
6. Clean-up
a. Consumables (pipette tips, syringes, tubing) should be disposed of in the
appropriate oily waste receptacle.
b. Dispose of leftover oil, WAF, and CEWAF into the appropriate liquid
waste receptacle.
c. Rinse glassware with hexane to remove remaining oil stuck to the glass
and dispose of the waste hexane in the solvent waste container
d. Clean glassware with Sparkleen (or equivalent) and rinse thoroughly with
distilled water.

100
Appendix C
Wave Tank
Figure C-1: Wave tank located at the Bedford Institute of Oceanography, Dartmouth, NS

101
Figure C-2: Wave tank schematic showing sampling locations and depths. Water flow is from
left to right.

102
Chapter 2 Wave Tank Experiments
0.1 1 10
% M
ort
alit
y
0
20
40
60
80
100
5 min
15 min
30 min
Negative Control
Sample Time Post-dispersion
0.1 1 10 100
% M
ort
alit
y
0
20
40
60
80
100
5 min
15 min
30 min
60 min
Negative Control
Sample TimePost-dispersion
0.1 1 10 100
% H
atc
h
0
20
40
60
80
100Negative Control
0.1 1 10 100
% H
atc
h
0
20
40
60
80
100Negative Control
24 h CEWAF Toxicity Curve
Negative Control
Measured Concentration (mg/L)
0.1 1 10 100
BS
D S
eve
rity
In
de
x
0.0
0.2
0.4
0.6
0.8
1.0
Negative Control
24 h CEWAFToxicity Curve
Measured Concentration (mg/L)
0.1 1 10 100
BS
D S
everity
Index
0.0
0.2
0.4
0.6
0.8
1.0
Figure C-3: Wave tank data corresponding to Chapter 2. Graphs show change in % Mortality
(a), % Hatch (b), and the BSD Severity Index (c) with increasing concentration of the chemically-
enhanced water accommodated fraction of Alaska North Slope Crude (ANSC; Panel A) and
Arabian Light Crude (ALC; Panel B) oils. The effects on Atlantic herring of a 24 h exposure of
laboratory-prepared CEWAF (dash lines) have been superimposed onto the graphs for
comparison when the response was greater than control. N = 20 for each treatment.
A: ANSC B: ALC a
b
c

103
Chapter 2 Supplementary Wave Tank Experiment
0.01 0.1 1 10 100
% N
orm
al
0
20
40
60
80
100
5 min
15 min
30 min
60 min
Negative Control
24 h CEWAF Toxicity Curve
Sample Time Post-dispersion
0.01 0.1 1 10 100
% M
ort
alit
y
0
20
40
60
80
100
Negative Control
Measured Concentration (mg/L)
0.01 0.1 1 10 100
% H
atc
h
0
20
40
60
80
100Negative Control
Measured Concentration (mg/L)
0.01 0.1 1 10 100
BS
D S
everity
Index
0.0
0.2
0.4
0.6
0.8
1.0
Negative Control
24 h CEWAFToxicity Curve
Figure C-4: Supplementary wave tank data corresponding to Chapter 2. Graphs show change in
% Normal (A), % Mortality (B), % Hatch (C), and the BSD Severity Index (D) with increasing
concentration of the chemically-enhanced water accommodated fraction (CEWAF) of Alaska
North Slope Crude (ANSC) oil. The effects on Atlantic herring of a 24 h exposure of laboratory-
prepared CEWAF (dash lines) have been superimposed onto the graphs for comparison when the
response was greater than control. N = 20 for each treatment.
A B
C D

104
Preliminary Laboratory Experiments
0.0001 0.001 0.01 0.1 1 10
% M
ort
alit
y
0
20
40
60
80
100
15 ppt
30 ppt A
30 ppt B
30 ppt C
Nominal Oil Loading (%v/v)
0.0001 0.001 0.01 0.1 1 10
% M
ort
alit
y
0
20
40
60
80
100
15 ppt A
30 ppt
15 ppt B
Figure C-5: Preliminary laboratory experiments to assess the acute toxicity of CEWAF to
herring embryos under different salinities (15 and 30 ppt) of Medium South American Crude
(MESA; A) and Alaska North Slope Crude (ANSC; B) chemically-enhanced water
accommodated fractions (CEWAF). Due to water sample contamination, measured
concentrations were unavailable. Non-linear regressions include all replicates. There did not
appear to be a difference in oil toxicity between salinities.
A
B

105
Appendix D
Standard Operating Procedure – Analysis of Saline Water Samples
Containing Oil by Fluorescence
Prepared by: Colleen Greer and Peter Hodson©
1. Draw water samples from exposure solutions and add to an equal volume of
absolute ethanol (un-denatured) in a scintillation vial. Vials with teflon-lined caps
are best for preserving sample volume, but foil-lined caps are acceptable if
samples will be stored for less than one month. Vial volume should be selected
according to sample volume to minimize headspace. A minimum of 3mL of
water sample is required for analysis. Make sure caps are tightened well on vials.
Store vials in fridge until ready to analyze.
2. Prepare and run a standard curve for the oil to be analyzed to determine the
excitation and emission wavelengths, and the concentration of PAH in the water
samples. Standards should be prepared using a serial dilution as outlined below.
Water used to prepare standards should be from the same source as the water used
for the exposure solutions. Sonicate for 3 minutes between each step.
a. 1:9 oil-hexanes (stock)
i. 100µL of oil by weight
ii. ~900µL hexanes
b. 100µL of stock + 9.9mL absolute ethanol (1000ppm)
c. 1mL of 1000ppm solution + 4.5mL ethanol + 4.5mL water (100ppm)

106
d. 1mL of 100ppm solution + 4.5mL ethanol + 4.5mL water (10ppm)
e. 1mL of 10ppm solution + 4.5mL ethanol + 4.5mL water (1ppm)
f. 0.5mL of 10ppm solution + 4.75mL ethanol + 4.75mL water (500ppb)
g. 1mL of 1ppm solution + 4.5mL ethanol + 4.5mL water (100ppb)
h. 0.5mL of 1ppm solution + 4.75mL ethanol + 4.75mL water (50ppb)
i. 1mL of 100ppb solution + 4.5mL ethanol + 4.5mL water (10ppb)
j. 1mL of 10ppb solution + 4.5mL ethanol + 4.5mL water (1ppb)
3. Sonicate standard to be run for 3 minutes.
4. If standards are prepared in salt water, after sonication step transfer sample to
microcentrifuge tubes. If using 1.5mL microcentrifuge tubes, two tubes will be
require for each sample. Spin samples at 10,000 rpm for 10 minutes. A salt pellet
will be visible at the bottom of the tube. Remove the sample from the tube while
avoiding the pellet and transfer the sample to a quartz cuvette.
5. Place cuvette into fluorometer and analyze. Start with the 1ppm sample (or the
highest concentration standard to be analyzed) and optimize the emission
spectrum using an excitation scan to determine the wavelength resulting in the
highest peak.
6. Run the rest of the standards following the optimal specifications determined in
step 5.
7. Calculate the area under the curve (either using the integrate area function specific
to the equipment or by summing the peak heights over the desired bandwidth).

107
8. Using the areas and the known concentrations, plot the values to determine a
standard curve for the oil. If the resulting regression has an R2 value above 0.95,
the standards are deemed correct. Prepare additional standards if necessary.
Using the regression equation, concentrations of unknown samples can be
determined using the area under the fluorescence curve.
9. Sonicate samples for 3 minutes.
10. If samples are in salt water, centrifuge (as outlined for standards) for 10 minutes
at 10,000 rpm.
11. Analyze samples by fluorescence.
12. Calculate concentration using prepared standard curve. To determine the actual
concentration of the samples, the value calculated from the standard curve will
have to be multiplied by two to take into account the dilution factor from the
addition of ethanol to preserve the samples.
13. Blanks should be run each day to account for any fluctuations in the bulb. The
water-ethanol blank will act as a baseline or calibration for the standard curve and
should be subtracted from the samples. The water-ethanol blank should be
prepared using 1 part ethanol to 1 part water (drawn from the same source as the
water samples). Separate water and ethanol blanks can also be run to determine if
the equipment is functioning properly.
14. Between each sample, the cuvette should be cleaned. First rinse in distilled or de-
ionized water then rinse twice using absolute ethanol.

108
Log Concentration (ppb)
0 1 2 3
Log F
luore
scence I
nte
nsity
2.5
3.0
3.5
4.0
4.5
5.0
5.5
R2 = 0.92
Figure D-1: Calibration curve of fluorescence methods using whole oil. Curve can be used to
calculate concentration of exposure solutions from fluorescence intensity.
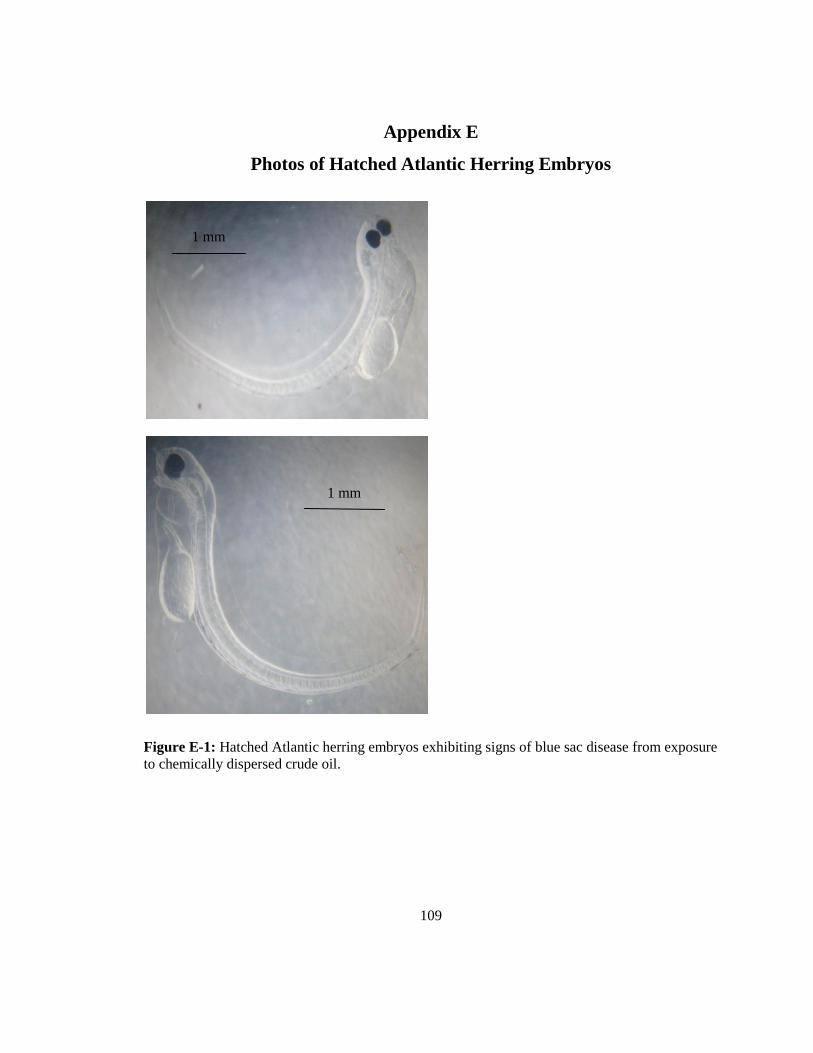
109
Appendix E
Photos of Hatched Atlantic Herring Embryos
Figure E-1: Hatched Atlantic herring embryos exhibiting signs of blue sac disease from exposure
to chemically dispersed crude oil.
1 mm
1 mm

110
Appendix F
Exposure Time
0.1 1 10 100
% M
ort
alit
y
0
20
40
60
80
100
2.4 h
8 h
24 h
14 d 14 d
Negative Control
0.1 1 10 100
% M
ort
alit
y
0
20
40
60
80
100
14 d
Negative Control
0.1 1 10 100
% H
atc
h
0
20
40
60
80
100
Negative Control
14 d
0.1 1 10 100
% H
atc
h
0
20
40
60
80
100
Negative Control
14 d
Measured Concentration (mg/L)
0.1 1 10 100
BS
D S
eve
rity
Index
0.0
0.2
0.4
0.6
0.8
1.0
Negative Control
2.4 h8 h
24 h
14 d
Measured Concentration (mg/L)
0.1 1 10 100
BS
D S
eve
rity
Index
0.0
0.2
0.4
0.6
0.8
1.0
14 d
24 h
8 h
2.4 h
Negative Control
Figure F-1: Exposure time – response experiments from Chapter 2. The percent mortality (a),
percent hatch (b), and BSD Severity Index (c) for Atlantic herring embryos exposed to Alaska
North Slope Crude (ANSC, Panel A) and Arabian Light Crude (ALC, Panel B). The x‟s
represent 2.4 h exposure, the squares represent 8 h exposure, the triangles represent 24 h
exposure, and the circles represent a 14 day exposure from fertilization to hatch with daily static
renewal of exposure solutions. Dose-response curves were included when applicable. N = 20.
A B
a
b
c
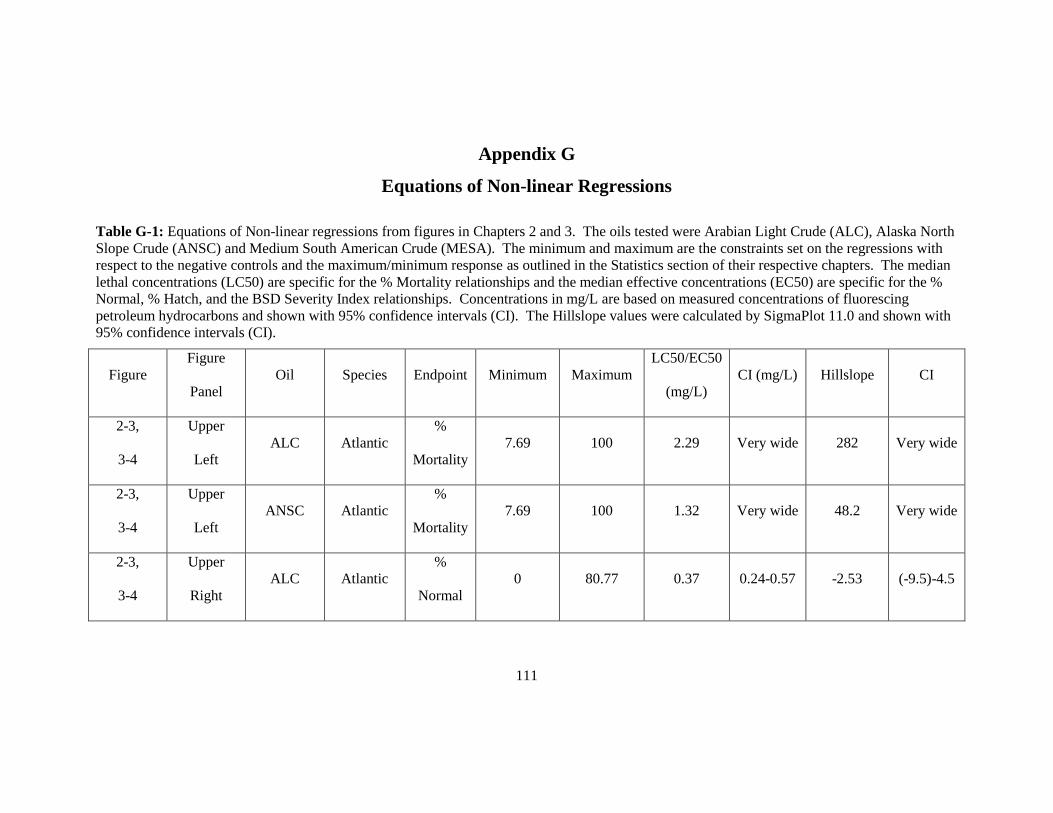
111
Appendix G
Equations of Non-linear Regressions
Table G-1: Equations of Non-linear regressions from figures in Chapters 2 and 3. The oils tested were Arabian Light Crude (ALC), Alaska North
Slope Crude (ANSC) and Medium South American Crude (MESA). The minimum and maximum are the constraints set on the regressions with
respect to the negative controls and the maximum/minimum response as outlined in the Statistics section of their respective chapters. The median
lethal concentrations (LC50) are specific for the % Mortality relationships and the median effective concentrations (EC50) are specific for the %
Normal, % Hatch, and the BSD Severity Index relationships. Concentrations in mg/L are based on measured concentrations of fluorescing
petroleum hydrocarbons and shown with 95% confidence intervals (CI). The Hillslope values were calculated by SigmaPlot 11.0 and shown with
95% confidence intervals (CI).
Figure
Figure
Panel
Oil Species Endpoint Minimum Maximum
LC50/EC50
(mg/L)
CI (mg/L) Hillslope CI
2-3,
3-4
Upper
Left
ALC Atlantic
%
Mortality
7.69 100 2.29 Very wide 282 Very wide
2-3,
3-4
Upper
Left
ANSC Atlantic
%
Mortality
7.69 100 1.32 Very wide 48.2 Very wide
2-3,
3-4
Upper
Right
ALC Atlantic
%
Normal
0 80.77 0.37 0.24-0.57 -2.53 (-9.5)-4.5

112
2-3,
3-4
Upper
Right
ANSC Atlantic
%
Normal
0 80.77 0.17 0.15-0.19 -7.35
(-13.9)-
(-0.77)
2-3,
3-4
Lower
Left
ALC Atlantic % Hatch 0 96.15 2.29 Very wide -226 Very wide
2-3,
3-4
Lower
Left
ANSC Atlantic % Hatch 0 96.15 2.99 1.51-5.93 -5.92
(-13.8)-
1.96
2-3,
3-4
Lower
Right
ALC Atlantic
BSD
Severity
Index
0.11 1.0 2.07 1.01-4.24 1.19 0.11-2.26
2-3,
3-4
Lower
Right
ANSC Atlantic
BSD
Severity
Index
0.11 1.0 0.66 0.48-0.89 1.42 0.77-2.06
2-4
Upper
2.4 h
ANSC Atlantic
%
Normal
0 80.77 11.74 5.32-25.9 -3.04
(-7.63)-
1.56

113
2-4
Upper
8 h
ANSC Atlantic
%
Normal
0 80.77 3.16 2.36-4.23 -2.08
(-3.10)-
(-1.06)
2-4
Upper
24 h
ANSC Atlantic
%
Normal
0 80.77 0.76 0.58-0.99 -1.54
(-2.08)-
(-0.99)
2-4
Lower
2.4 h
ALC Atlantic
%
Normal
0 80.77 25.1 14.7-42.8 -1.35
(-2.32)-
(-0.38)
2-4
Lower
8 h
ALC Atlantic
%
Normal
0 80.77 2.86 1.26-6.52 -2.11
(-5.43)-
1.21
2-4
Lower
24 h
ALC Atlantic
%
Normal
0 80.77 2.75 1.01-7.47 -2.17
(-6.37)-
2.04
2-5
Upper
Right
ANSC Atlantic
%
Normal
Toxicity
Curve
0 89.82 4.85 3.50-6.71 -1.43
(-2.01)-
(-0.84)

114
2-5
Lower
Right
ALC Atlantic
%
Normal
Toxicity
Curve
0 93.33 >22.63 Very wide -0.57
(-2.64)-
1.51
3-2
Upper
Left
ANSC Atlantic
%
Mortality
7.69 100 1.32 Very wide 48.2 Very wide
3-2
Upper
Left
ANSC Pacific
%
Mortality
8.69 100 4.35 3.49-5.42 2.21 1.27-3.16
3-2
Upper
Right
ANSC Atlantic
%
Normal
0 80.77 0.17 0.15-0.19 -7.35
(-13.9)-
(-0.77)
3-2
Upper
Right
ANSC Pacific
%
Normal
0 78.26 0.66 0.40-1.08 -2.61
(-5.91)-
0.69
3-2
Lower
Left
ANSC Atlantic % Hatch 0 96.15 2.99 1.51-5.93 -5.92
(-13.8)-
1.96

115
3-2
Lower
Left
ANSC Pacific % Hatch 0 95.65 4.45 3.75-5.28 -2.03
(-2.66)-
(-1.40)
3-2
Lower
Right
ANSC Atlantic
BSD
Severity
Index
0.11 1.0 0.66 0.48-0.89 1.42 0.77-2.06
3-2
Lower
Right
ANSC Pacific
BSD
Severity
Index
0.11 1.0 2.40 1.74-3.31 1.25 0.80-1.70
3-3
Upper
Left
MESA Pacific
%
Mortality
8.69 100 2.53 1.32-4.82 1.40 0.18-2.62
3-3
Upper
Left
ANSC Pacific
%
Mortality
8.69 100 4.35 3.49-5.42 2.21 1.27-3.16
3-3
Upper
Right
MESA Pacific
%
Normal
0 78.26 0.29 0.17-0.50 -2.30
(-4.58)-
(-0.01)

116
3-3
Upper
Right
ANSC Pacific
%
Normal
0 78.26 0.66 0.40-1.08 -2.61
(-5.91)-
0.69
3-3
Lower
Left
MESA Pacific % Hatch 0 95.65 3.15 2.55-3.89 -5.34
(-10.9)-
0.22
3-3
Lower
Left
ANSC Pacific % Hatch 0 95.65 4.45 3.75-5.28 -2.03
(-2.66)-
(-1.40)
3-3
Lower
Right
MESA Pacific
BSD
Severity
Index
0.11 1.0 1.27 0.52-3.10 0.97 0.16-1.78
3-3
Lower
Right
ANSC Pacific
BSD
Severity
Index
0.11 1.0 2.40 1.74-3.31 1.25 0.80-1.70