toxfx™ analysis suite user manual - thermo fisher scientific
TRANSCRIPT

ToxFX™ Analysis Suite User Manual
P/N 702389 Rev. 1
For research use only. Not for use in diagnostic procedures.
Trademarks
Affymetrix®, GeneChip®, , HuSNP®, GenFlex®, Flying Objective™, CustomExpress®, CustomSeq®, NetAffx™, Tools To Take You As Far As Your Vision®, The Way Ahead™, Powered by Affymetrix™, GeneChip-compatible™, Expression Console™, and Command Console™ are trademarks of Affymetrix, Inc.
, ToxFX™, DrugMatrix®, and Drug Signatures® are trademarks of Iconix Biosciences, Inc. All other trademarks are the property of their respective owners.
Limited License
Subject to the Affymetrix terms and conditions that govern your use of Affymetrix products, Affymetrix grants you a non-exclusive, non-transferable, non-sublicensable license to use this Affymetrix product only in accordance with the manual and written instructions provided by Affymetrix. You understand and agree that, except as expressly set forth in the Affymetrix terms and conditions, no right or license to any patent or other intellectual property owned or licensable by Affymetrix is conveyed or implied by this Affymetrix product. In particular, no right or license is conveyed or implied to use this Affymetrix product in combination with a product not provided, licensed, or specifically recommended by Affymetrix for such use.
Patents
Arrays: Products may be covered by one or more of the following patents and/or sold under license from Oxford Gene Technology: U.S. Patent Nos. 5,445,934; 5,700,637; 5,744,305; 5,945,334; 6,054,270; 6,140,044; 6,261,776; 6,291,183; 6,346,413; 6,399,365; 6,420,169; 6,551,817; 6,610,482; 6,733,977; and EP 619 321; 373 203 and other U.S. or foreign patents.
Copyright
© 2006 Affymetrix Inc. All rights reserved.

CONTENTS
Chapter 1 Introduction . . . . . . . . . . . . . . . . . . . . . . . . . . . . . . . . . . . . . . . . .1
Product Description . . . . . . . . . . . . . . . . . . . . . . . . . . . . . . . . . . . . . . . . . . 1DrugMatrix® and Drug Signatures® . . . . . . . . . . . . . . . . . . . . . . . . . . . . . . 2Using the ToxFX Analysis Suite . . . . . . . . . . . . . . . . . . . . . . . . . . . . . . . . . 2Using the ToxFX Analysis Suite User Manual . . . . . . . . . . . . . . . . . . . . . . 3Precautions . . . . . . . . . . . . . . . . . . . . . . . . . . . . . . . . . . . . . . . . . . . . . . . . 4Interfering Conditions . . . . . . . . . . . . . . . . . . . . . . . . . . . . . . . . . . . . . . . . 4
Chapter 2 In Vivo Study Design . . . . . . . . . . . . . . . . . . . . . . . . . . . . . . . . .5
Introduction . . . . . . . . . . . . . . . . . . . . . . . . . . . . . . . . . . . . . . . . . . . . . . . . 5Study Design Criteria . . . . . . . . . . . . . . . . . . . . . . . . . . . . . . . . . . . . . . . . . 5
Number of Control Animals . . . . . . . . . . . . . . . . . . . . . . . . . . . . . . . . . . 5Dose Selection . . . . . . . . . . . . . . . . . . . . . . . . . . . . . . . . . . . . . . . . . . . . 6Compound Exposure Time . . . . . . . . . . . . . . . . . . . . . . . . . . . . . . . . . . 6Vehicle Selection . . . . . . . . . . . . . . . . . . . . . . . . . . . . . . . . . . . . . . . . . . 6Recommended Study Size . . . . . . . . . . . . . . . . . . . . . . . . . . . . . . . . . . 6
Chapter 3 RNA Isolation and Labeling . . . . . . . . . . . . . . . . . . . . . . . . . . . .9
Introduction . . . . . . . . . . . . . . . . . . . . . . . . . . . . . . . . . . . . . . . . . . . . . . . . 9Required References . . . . . . . . . . . . . . . . . . . . . . . . . . . . . . . . . . . . . . . . 10Precautions . . . . . . . . . . . . . . . . . . . . . . . . . . . . . . . . . . . . . . . . . . . . . . . 10Total RNA Isolation . . . . . . . . . . . . . . . . . . . . . . . . . . . . . . . . . . . . . . . . . 10Affymetrix One-Cycle Target Labeling Protocol . . . . . . . . . . . . . . . . . . . 12
cRNA Target Preparation . . . . . . . . . . . . . . . . . . . . . . . . . . . . . . . . . . . 12cRNA Fragmentation . . . . . . . . . . . . . . . . . . . . . . . . . . . . . . . . . . . . . . . . 13GeneChip Array Hybridization . . . . . . . . . . . . . . . . . . . . . . . . . . . . . . . . . 14GeneChip Array Washing, Staining, and Scanning . . . . . . . . . . . . . . . . . 16

ii ToxFX™ Analysis Suite User Manual
Chapter 4 ToxFX Data Analysis . . . . . . . . . . . . . . . . . . . . . . . . . . . . . . . . .17
Introduction . . . . . . . . . . . . . . . . . . . . . . . . . . . . . . . . . . . . . . . . . . . . . . . 17Minimal Hardware Recommendations . . . . . . . . . . . . . . . . . . . . . . . . . . 19Software Requirements . . . . . . . . . . . . . . . . . . . . . . . . . . . . . . . . . . . . . 19Required Software . . . . . . . . . . . . . . . . . . . . . . . . . . . . . . . . . . . . . . . . . 19GeneChip Array Quality Control . . . . . . . . . . . . . . . . . . . . . . . . . . . . . . . 19CHP File Generation Using Expression Console™ Software . . . . . . . . . 20ToxFX™ Study Builder Software . . . . . . . . . . . . . . . . . . . . . . . . . . . . . . . 21
Software Installation and Removal . . . . . . . . . . . . . . . . . . . . . . . . . . . 22Starting and Logging Into ToxFX™ Study Builder . . . . . . . . . . . . . . . . 23
Building a Study in ToxFX Study Builder . . . . . . . . . . . . . . . . . . . . . . . . . 24Study Panel Tab . . . . . . . . . . . . . . . . . . . . . . . . . . . . . . . . . . . . . . . . . . 24Experiments Tab . . . . . . . . . . . . . . . . . . . . . . . . . . . . . . . . . . . . . . . . . 25Compound Chooser Tab . . . . . . . . . . . . . . . . . . . . . . . . . . . . . . . . . . . 27Quality Control Tab . . . . . . . . . . . . . . . . . . . . . . . . . . . . . . . . . . . . . . . 30Certificates Tab . . . . . . . . . . . . . . . . . . . . . . . . . . . . . . . . . . . . . . . . . . 32
Study Submission . . . . . . . . . . . . . . . . . . . . . . . . . . . . . . . . . . . . . . . . . . 32Data Output . . . . . . . . . . . . . . . . . . . . . . . . . . . . . . . . . . . . . . . . . . . . . . . 33ToxFX Data Location . . . . . . . . . . . . . . . . . . . . . . . . . . . . . . . . . . . . . . . . 33Data Archive Contents . . . . . . . . . . . . . . . . . . . . . . . . . . . . . . . . . . . . . . 34
Chapter 5 The ToxFX Report . . . . . . . . . . . . . . . . . . . . . . . . . . . . . . . . . . .37
Introduction . . . . . . . . . . . . . . . . . . . . . . . . . . . . . . . . . . . . . . . . . . . . . . . 37Using the Report . . . . . . . . . . . . . . . . . . . . . . . . . . . . . . . . . . . . . . . . . . . 37Contextual Data Interpretation . . . . . . . . . . . . . . . . . . . . . . . . . . . . . . . . 37Report Content . . . . . . . . . . . . . . . . . . . . . . . . . . . . . . . . . . . . . . . . . . . . 38
Relative Impact on Transcription . . . . . . . . . . . . . . . . . . . . . . . . . . . . . 39Transcriptional Pattern Matching with Drug Signatures . . . . . . . . . . . 39
Pathways . . . . . . . . . . . . . . . . . . . . . . . . . . . . . . . . . . . . . . . . . . . . . . . . 43Different Pathways for Different Tissues . . . . . . . . . . . . . . . . . . . . . . 44Summary - Pathway Responses Compared to DrugMatrix® . . . . . . . . 45Supplementary Information Pathway Tables and Figures . . . . . . . . . . 45
Replicate Reproducibility Check . . . . . . . . . . . . . . . . . . . . . . . . . . . . . . . 47

contents iii
Appendix A Laboratory Protocols . . . . . . . . . . . . . . . . . . . . . . . . . . . . . . . .49
Animals (Rats) . . . . . . . . . . . . . . . . . . . . . . . . . . . . . . . . . . . . . . . . . . . . . 49
Appendix B Study Design . . . . . . . . . . . . . . . . . . . . . . . . . . . . . . . . . . . . . . .51
Determining the Fully Effective Dose . . . . . . . . . . . . . . . . . . . . . . . . . . . 51Determining the Maximum Tolerated Dose . . . . . . . . . . . . . . . . . . . . . . 52
Range-Finding Study to Establish the MTD . . . . . . . . . . . . . . . . . . . . . 52Choosing a Compound Vehicle . . . . . . . . . . . . . . . . . . . . . . . . . . . . . . . . 53Time Point Selection . . . . . . . . . . . . . . . . . . . . . . . . . . . . . . . . . . . . . . . . 53
Replicates and Study Size . . . . . . . . . . . . . . . . . . . . . . . . . . . . . . . . . . 53
Appendix C ToxFX Analysis Suite Compatible Arrays . . . . . . . . . . . . . . . .55
Appendix D Analysis Certificate Purchasing and Management. . . . . . . . .57
Analysis of GeneChip® Rat ToxFX 1.0 Arrays . . . . . . . . . . . . . . . . . . . . . 57Analysis of GeneChip® Rat Genome 230 2.0 Arrays . . . . . . . . . . . . . . . . 58Management of Certificates for Control Data . . . . . . . . . . . . . . . . . . . . . 58Certificate Ordering . . . . . . . . . . . . . . . . . . . . . . . . . . . . . . . . . . . . . . . . . 58Depositing Certificates Into a User Account . . . . . . . . . . . . . . . . . . . . . . 58Checking Certificates . . . . . . . . . . . . . . . . . . . . . . . . . . . . . . . . . . . . . . . 59
Appendix E DrugMatrix® Database Version . . . . . . . . . . . . . . . . . . . . . . . .61
Appendix F References . . . . . . . . . . . . . . . . . . . . . . . . . . . . . . . . . . . . . . . . .63
References . . . . . . . . . . . . . . . . . . . . . . . . . . . . . . . . . . . . . . . . . . . . . . . 63
Appendix G Glossary . . . . . . . . . . . . . . . . . . . . . . . . . . . . . . . . . . . . . . . . . . .65
Glossary . . . . . . . . . . . . . . . . . . . . . . . . . . . . . . . . . . . . . . . . . . . . . . . . . . 65

iv ToxFX™ Analysis Suite User Manual
Chapte
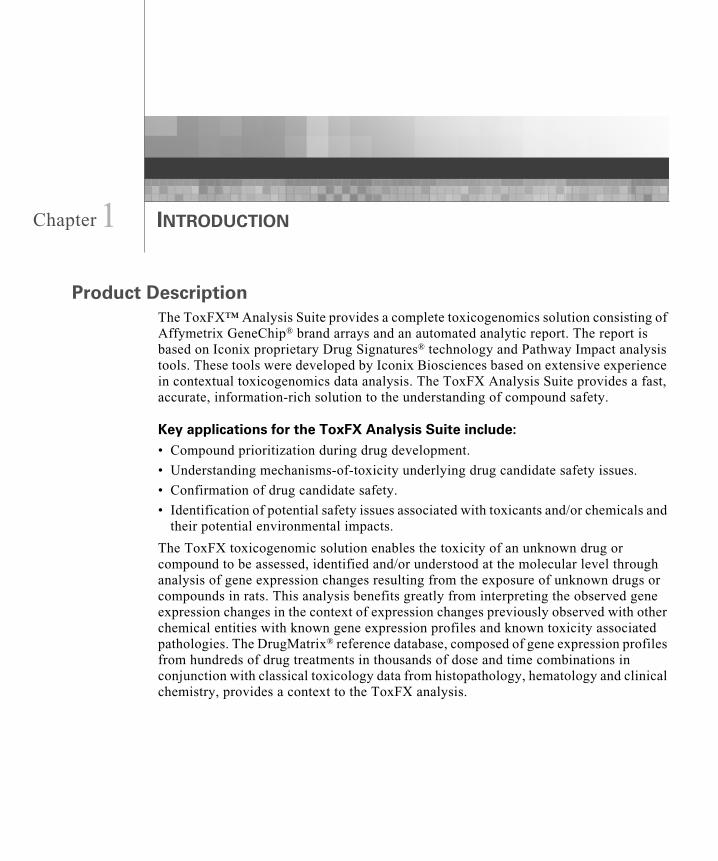
r1 INTRODUCTIONProduct DescriptionThe ToxFX™ Analysis Suite provides a complete toxicogenomics solution consisting of Affymetrix GeneChip® brand arrays and an automated analytic report. The report is based on Iconix proprietary Drug Signatures® technology and Pathway Impact analysis tools. These tools were developed by Iconix Biosciences based on extensive experience in contextual toxicogenomics data analysis. The ToxFX Analysis Suite provides a fast, accurate, information-rich solution to the understanding of compound safety.
Key applications for the ToxFX Analysis Suite include:• Compound prioritization during drug development.
• Understanding mechanisms-of-toxicity underlying drug candidate safety issues.
• Confirmation of drug candidate safety.
• Identification of potential safety issues associated with toxicants and/or chemicals and their potential environmental impacts.
The ToxFX toxicogenomic solution enables the toxicity of an unknown drug or compound to be assessed, identified and/or understood at the molecular level through analysis of gene expression changes resulting from the exposure of unknown drugs or compounds in rats. This analysis benefits greatly from interpreting the observed gene expression changes in the context of expression changes previously observed with other chemical entities with known gene expression profiles and known toxicity associated pathologies. The DrugMatrix® reference database, composed of gene expression profiles from hundreds of drug treatments in thousands of dose and time combinations in conjunction with classical toxicology data from histopathology, hematology and clinical chemistry, provides a context to the ToxFX analysis.

2 ToxFX™ Analysis Suite User Manual
DrugMatrix® and Drug Signatures®
Developed by Iconix, DrugMatrix is the world’s largest toxicogenomics reference database. The database contains results from thousands of rats which were systematically treated with hundreds of drugs and toxicants. Total RNA from liver, heart and kidney tissues from each treated rat was run on GeneChip® Rat Genome 230 2.0 Arrays. These data were combined with molecular pharmacology profiles from a panel of 130 enzyme binding, receptor, and ion channel assays as well as blood chemistry and histopathology readings. This rich dataset was additionally annotated with toxicity observations derived from multiple literature sources. The database provides an interpretive reference set for understanding the key molecular mechanisms of toxic responses.
Iconix informatics scientists have extensively mined the DrugMatrix database to define 55 highly informative ToxFX Drug Signatures. Drug Signatures are patterns of gene expression changes that can be used as biomarkers by drug-development scientists and clinical investigators to link the expression pattern of groups of genes to key biological endpoints. Signatures represent groups of genes whose expression is strongly correlated to a specific biological outcome (e.g., liver necrosis, ALP increase). As such, Drug Signatures can predict specific off-target effects and toxicological reactions in different organs and tissues as well as specific mechanisms of action.
Using the ToxFX Analysis SuiteThe ToxFX Analysis Suite supports in vivo studies performed in rats allowing toxicity to be assessed in liver, heart or kidney tissues. Following studies that may cover the time period of 1 to 14 days in rats dosed with a single compound, gene expression data is generated on one of two array choices:
• GeneChip® Rat ToxFX 1.0 Array – Based on approximately 600 in vivo compound experiments, the array content focuses specifically on unique probe sets that Iconix analysis experience indicates are most informative from a toxicology perspective. For compound screening purposes, the more focused array provides an economical solution for running large numbers of samples.
• GeneChip® Rat Genome 230 2.0 Array – In addition to the ToxFX automated analysis, the whole genome coverage provided by the Rat Genome 230 2.0 Array enables a more in-depth investigation of mechanisms of toxicity through Iconix Consulting Services or the bioinformatics analysis capabilities of the user. It should be noted that the report generated by the ToxFX automated analysis using Rat Genome 230 2.0 Arrays only focuses on the same genes that are found on the Rat ToxFX 1.0 Array. However, gene expression changes for the complete genome are recorded in the supplementary data files returned with the ToxFX Report. These files provide a useful starting point for the user to perform more in-depth analysis of the whole genome effects.
Gene expression data in the form of Affymetrix *.chp files are then combined into a toxicogenomics study using the ToxFX Study Builder software and submitted to the Iconix ToxFX server for analysis. Within minutes, data are returned in a compressed

chapter 1 | Introduction 3
archive and a fully documented report is created for the user. Each report is written using standard toxicology terminology and is designed to be stand-alone documentation for the study.
Using the ToxFX Analysis Suite User ManualThis manual provides the information needed to complete an in vivo rat compound study with the ToxFX Analysis Suite. The manual is divided into four main parts:
• Chapter 2 – Methods. This chapter provides recommendations and guidance for in vivo study experimental design.
• Chapter 3 – RNA Isolation and Labeling. This chapter describes all protocols for sample isolation, labeling, and hybridization to GeneChip arrays.
• Chapter 4 – ToxFX Study Builder Software. This chapter provides step-by-step instructions on how to submit a study for analysis using the ToxFX Study Builder software.
Figure 1.1 ToxFX Study Overview

4 ToxFX™ Analysis Suite User Manual
• Chapter 5 – ToxFX Report. This chapter provides detailed guidance on interpreting the different elements of the ToxFX report.
• Appendices
- Appendix A: Laboratory Procedures
- Appendix B: Study Design
- Appendix C: ToxFX Analysis Suite Compatible Arrays
- Appendix D: Analysis Certificate Purchasing and Management
- Appendix E: DrugMatrix Database Version
Precautions1. FOR RESEARCH USE ONLY; NOT FOR USE IN DIAGNOSTIC
PROCEDURES.
2. Avoid microbial contamination, which may cause erroneous results.
3. Exercise standard precautions when obtaining, handling, and disposing of potentially carcinogenic reagents.
4. Exercise care to avoid cross-contamination of samples during all steps of these procedures, as this may lead to erroneous results.
5. Use powder-free gloves whenever possible to minimize introduction of powder particles into sample or probe array cartridges.
All biological specimens and materials with which they come into contact should be handled as if capable of transmitting infection and disposed of with proper precautions in accordance with federal, state, and local regulations. This includes adherence to the OSHA Bloodborne Pathogens Standard (29 CFR, Part Number 1910.1030) for blood-derived and other samples governed by this act. Never pipet by mouth. Avoid specimen contact with skin and mucous membranes.
Interfering ConditionsProper storage and handling of reagents and samples is essential for robust performance. All laboratory equipment used to prepare the samples and target during the described procedures should be calibrated and carefully maintained to ensure accuracy, as incorrect measurement of reagents may affect the outcome of the procedure.

Chapte
r2 IN VIVO STUDY DESIGNIntroductionThe ToxFX study experimental design is very important to ensuring a successful outcome. However, because of the wide variety of compound properties and different experimental goals, not all in vivo ToxFX studies can be identically designed. With that in mind, this chapter describes the guidelines and recommendations for performing a successful in vivo ToxFX study in the rat. It is highly recommended that the user follow these recommendations to minimize the differences between the user data and the reference database.
The following design criteria must be met to generate a meaningful dataset:
• Sufficient animal replicates
• Appropriate compound dose selection
• Sufficient compound exposure time
• Appropriate vehicle selection
Each of these criteria will be discussed in more detail below. Additional information on this topic and laboratory protocol recommendations can be found in Appendix B, Study Design and Appendix A, Laboratory Protocols respectively.
Study Design Criteria
Number of Control AnimalsThe minimum recommended ToxFX toxicology study should contain three drug-treated animals and three vehicle-treated controls per dose-time point. Because of the increase in the statistical power of the study, the results are expected to improve as the number of replicate animals per condition increases.
IMPORTANT: The ToxFX software will reject experiments where fewerthan two drug-treated and two vehicle-treated controls per dose-time pointpass the quality control threshold.
6 ToxFX™ Analysis Suite User Manual
Dose SelectionTo ensure that a selected dose is sufficient to elicit informative gene expression changes, we recommend that each compound be tested at a minimum of two different dose levels:
• The Fully Effective Dose (FED) or therapeutic dose
• The Maximum Tolerated Dose (MTD) or high/toxic dose
Details on how to determine FED and MTD can be found in Appendix B, Study Design.
Compound Exposure TimeTo ensure that a time point is chosen that is sufficient to elicit informative gene expression changes, we recommend that animals be dosed on a daily schedule of 1 to 14 days. In general, the minimal treatment should be 3 days. However, based on the dose and potency of the test compound, a response may be seen sooner or later than 3 days.
Vehicle SelectionWe recommend that the dose vehicle used for studies be the same as the dose vehicle used in literature described studies that establish the FED.
Recommended Study SizeWe recommend that a study be composed of:
• At least two doses
• At least two time points
• At least three biological replicates per dose-time combination
• Paired controls as outlined in Table 2.1.
NOTE: Diurnal changes in gene expression can affect results, so it isrecommended to dose and sacrifice the animals at the same time of day(Boorman et al. 2005).

chapter 2 | In Vivo Study Design 7
At a minimum, the software will support a study with a single time point, a single dose level, and matched controls as outlined in Table 2.2. However, such a study is risky unless the dose and time combination selected is known to result in substantial pharmacodynamic and toxicodynamic effects. It is strongly recommended that the investigator demonstrate the validity of the selected dose and time combination by previous experimentation before considering the minimum experimental design.
Table 2.1 Recommended Study Size
Study Variable Quantity Comments
Doses 2 • FED• MTD
Time Points 2 Minimum of 3 days of dosing
Time Matched Vehicle Only Controls 2 Rats dosed with vehicle alone for the same time period as the compound dosed rats
Replicates 3
Total Animal Requirement 24
Total Array Requirement 24
Table 2.2 Minimum Supported Study Size
Study Variable Quantity
Doses 1
Time Points 1
Time Matched Vehicle Only Controls 1
Replicates 3
Total Animal Requirement 6
Total Array Requirement 6
NOTE: A ToxFX study example and the resulting report are available in theToxFX Tutorial (P/N 702390) document available from www.toxfx.com.

8 ToxFX™ Analysis Suite User Manual

Chapte
r3 RNA ISOLATION AND LABELINGIntroductionThis chapter provides the steps necessary to isolate total RNA from tissue samples, label the RNA according to the standard Affymetrix target labeling procedure, and hybridize the labeled target to GeneChip arrays. Instructions are also provided for array processing, data acquisition, and Affymetrix probe set summarization. For specific step-by-step instructions, please refer to the appropriate reference for each section.
Figure 3.1 Flow chart of steps described in this chapter.
Total RNA Isolation
Steps covered by third-party documentation
Steps covered by the GeneChip® Expression Analysis Technical Manual
Addition of Poly-A RNA Controls
One-Cycle cDNA Synthesis
IVT cRNA Labeling
cRNA Fragmentation
Array Hybridization and Processing
Array Scanning and Data Acquisition
10 ToxFX™ Analysis Suite User Manual
Required References• Please refer to the latest version of the GeneChip® Expression Analysis Technical Manual
for detailed step-by-step instructions on the One-Cycle Target Labeling Assay, handling and processing of GeneChip cartridge arrays, array scanning, and data acquisition.
- If user-prepared hybridization, wash and stain buffers will be used, please refer to the GeneChip® Expression Analysis Technical Manual (P/N 900223).
Available for download from: www.affymetrix.com/support/technical/manual/expression_manual.affx
- If the GeneChip® Hybridization, Wash, and Stain Kit (P/N 900720) will be used, please refer to the GeneChip® Expression Analysis Technical Manual, with Specific Protocols for Using the GeneChip Hybridization, Wash, and Stain Kit (P/N 702232).
Available for download from: www.affymetrix.com/support/downloads/manuals/expression_analysis_technical_manual.pdf
• Affymetrix Data Analysis Fundamentals Guide (P/N 701190)
Available for download from www.affymetrix.com/support/downloads/manuals/data_analysis_fundamentals_manual.pdf
• Affymetrix Expression Console User Guide (P/N 702387)
Available for download from:www.affymetrix.com/products/software/specific/expression_console_software.affx
• Affymetrix Expression Console Quick Start Guide – 3’ Expression Arrays (P/N 702388)
Available for download from:
www.affymetrix.com/products/software/specific/expression_console_software.affx
PrecautionsDuring all RNA manipulations, care should be taken to eliminate RNase contamination of the samples and work environment. Products such as RNaseAway™ (Invitrogen) or RNaseZap® (Ambion) can be very effective in preparing and maintaining a clean working area.
Total RNA IsolationAlthough it is expected that most standard RNA isolation procedures that yield high quality total RNA will produce acceptable results with the ToxFX analysis, the commercially available RNeasy Kit from QIAGEN has been demonstrated to provide good results and is recommended. When using the QIAGEN kit, the manufacturer’s

chapter 3 | RNA Isolation and Labeling 11
recommendations should be followed.
After RNA isolation, precipitate the RNA (if necessary) according to the procedures described in the “Total RNA and mRNA Isolation for One-Cycle Target Labeling Assay” section of the GeneChip® Expression Analysis Technical Manual. Verify the purity of the isolated total RNA by checking the A260/A280 ratio (acceptable range is between 1.9 and 2.1). RNA integrity should be verified on an Agilent Bioanalyzer or alternatively agarose gel analysis. The result should yield two distinct 18S and 28S ribosomal RNA peaks (see example in Figure 3.2) with the area under the peaks approximating 1:2 respectively.
Isolated total RNA should be stored at –80°C if necessary prior to following the Affymetrix target labeling protocol.
NOTE: The RNeasy Kit provides sufficient binding capacity for the total RNAyield from the recommended 6 mm liver biopsy punches. If a different tissuesampling approach is used, the size of the tissue samples needs to beconsidered when choosing the RNA isolation protocol as the different kitsoffered by QIAGEN have different RNA binding capacities. Binding capacitiesare 100 μg for the Mini kit, 1 mg for the Midi kit, and 6 mg for the Maxi Kit.
Figure 3.2 Agilent Bioanalyzer electropherogram of good quality total RNA. Electropherogram from the Agilent 2100 Bioanalyzer run under the manufacturer’s specified conditions. For a high-quality total RNA sample, two well-defined peaks corresponding to the 18S and 28S ribosomal RNAs should be observed with the ratio of the areas under the peaks approaching 1:2 respectively.
12 ToxFX™ Analysis Suite User Manual
Affymetrix One-Cycle Target Labeling ProtocolPlease refer to the latest version of the GeneChip® Expression Analysis Technical Manual for detailed step-by-step instructions on the One-Cycle Target Labeling Assay, handling and processing of GeneChip cartridge arrays, array scanning, and data acquisition.
• If user-prepared hybridization, wash and stain buffers will be used, please refer to the GeneChip® Expression Analysis Technical Manual (P/N 900223).
• If the GeneChip® Hybridization, Wash, and Stain Kit (P/N 900720) will be used, please refer to the GeneChip® Expression Analysis Technical Manual, with Specific Protocols for Using the GeneChip Hybridization, Wash, and Stain Kit (P/N 702232).
To highlight information specific to the GeneChip® Rat Genome 230 2.0 and GeneChip® Rat ToxFX 1.0 Arrays, an overview of each step is provided below.
The preparation of labeled cRNA target is a two-step process involving the generation of a cDNA template followed by an in vitro transcription reaction. During the in vitro transcription reaction, a biotin moiety is incorporated into the cRNA target. All reagents and consumables necessary for cRNA target preparation are provided in the GeneChip® One-Cycle Target Labeling and Control Reagents Kit (P/N 900493).
A minimal input of 1 µg of total RNA is required for One-Cycle Target Labeling. A consistent amount of input material across all samples included in a ToxFX study is recommended.
cRNA Target PreparationAll references below refer to the GeneChip® Expression Analysis Technical Manual, “Eukaryotic Sample” section.
1. Process isolated total RNA to cDNA according to the section entitled “One-Cycle cDNA synthesis”
2. Clean-up the double stranded cDNA product according to the procedures described in the section entitled “Cleanup of Double-Stranded cDNA for Both the One-Cycle and Two-Cycle Target Labeling Assays”
3. Produce biotin-labeled cRNA according to the section entitled “Synthesis of Biotin-Labeled cRNA for Both the One-Cycle and Two-Cycle Target Labeling Assays”
4. Clean-up and quantitate the biotin-labeled cRNA product according to the section entitled “Cleanup and Quantification of Biotin-Labeled cRNA”
chapter 3 | RNA Isolation and Labeling 13
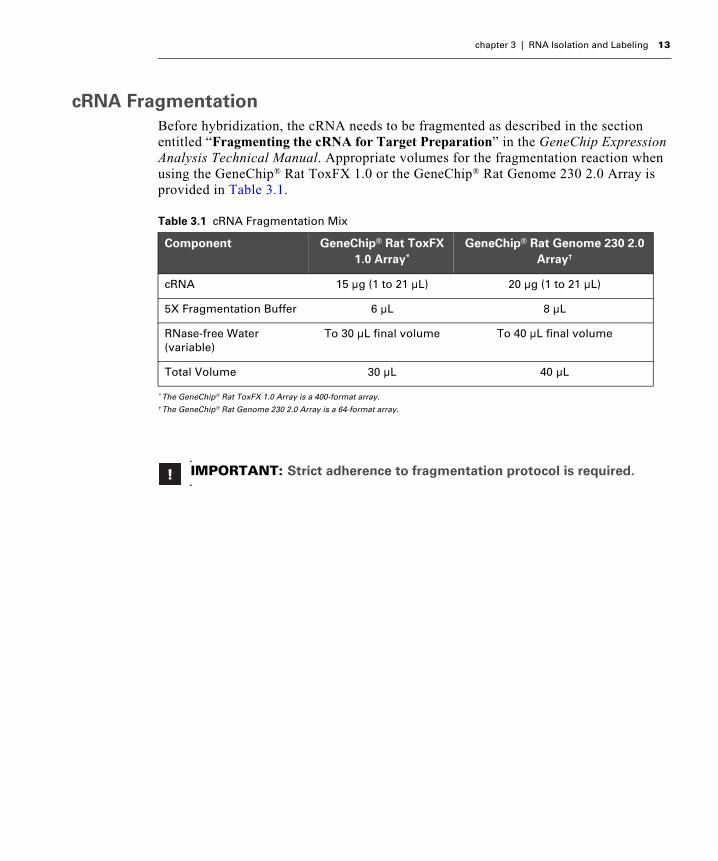
cRNA FragmentationBefore hybridization, the cRNA needs to be fragmented as described in the section entitled “Fragmenting the cRNA for Target Preparation” in the GeneChip Expression Analysis Technical Manual. Appropriate volumes for the fragmentation reaction when using the GeneChip® Rat ToxFX 1.0 or the GeneChip® Rat Genome 230 2.0 Array is provided in Table 3.1.
Table 3.1 cRNA Fragmentation Mix
Component GeneChip® Rat ToxFX 1.0 Array*
* The GeneChip® Rat ToxFX 1.0 Array is a 400-format array.
GeneChip® Rat Genome 230 2.0 Array†
† The GeneChip® Rat Genome 230 2.0 Array is a 64-format array.
cRNA 15 µg (1 to 21 µL) 20 µg (1 to 21 µL)
5X Fragmentation Buffer 6 µL 8 µL
RNase-free Water (variable)
To 30 µL final volume To 40 µL final volume
Total Volume 30 µL 40 µL
IMPORTANT: Strict adherence to fragmentation protocol is required.

14 ToxFX™ Analysis Suite User Manual
GeneChip Array HybridizationToxFX Analysis Suite supports the use of either the whole genome GeneChip® Rat Genome 230 2.0 Array or the customized GeneChip® Rat ToxFX 1.0 Array. The required hybridization cocktail volume will vary depending on the array due to differences in the size of the cartridge hybridization chamber.
Preparation of hybridization cocktail and sample hybridization procedures are described in the section entitled “Eukaryotic Target Hybridization” of the GeneChip® Expression Analysis Technical Manual.
Table 3.2 Critical parameters for the ToxFX supported GeneChip arrays
GeneChip® Rat ToxFX 1.0 Array
GeneChip® Rat Genome 230 2.0 Array
Probes/Probe Set 11 11
Feature Size 11 µm 11 µm
Array Format 400 64
Total Fill Volume 100 µL 250 µL
Hybridization Volume 80 µL 200 µL
NOTE: The GeneChip® Hybridization, Wash, and Stain Kit (P/N 900720)provides all necessary reagents required to complete the hybridization,wash, and staining processes. This convenient option eliminates thepossibility of buffer formulation errors in an easy-to-use kit.

chapter 3 | RNA Isolation and Labeling 15
Table 3.3 Hybridization Cocktail for Single Probe Array Using the GeneChip® Hybridization, Wash, and Stain Kit (P/N 900720)
Component GeneChip® Rat ToxFX 1.0 Array*
* The GeneChip® Rat ToxFX 1.0 Array is a 400-format array.
GeneChip® Rat Genome 230 2.0 Array†
† The GeneChip® Rat Genome 230 2.0 Array is a 64-format array.
Final Concentration
Fragmented cRNA 5 µg 15 µg 0.05 µg/µL
Control Oligo B2 (3nM) 1.7 µL 5 µL 50 pM
20X Eukaryotic Hybridization Controls (bioB, bioC, bioD and cre)
5 µL 15 µL 1.5, 5, 25, and 100 pM respectively
2X Hybridization Mix 50 µL 150 µL 1X
DMSO 10 µL 30 µL 10%
H2O To final volume of 100 µL To final volume of 300 µL
Table 3.4 Hybridization Cocktail for Single Probe Array Using User-Prepared Hybridization, Wash, and Stain Buffers
Component GeneChip® Rat ToxFX 1.0 Array*
* The GeneChip® Rat ToxFX 1.0 Array is a 400-format array.
GeneChip® Rat Genome 230 2.0 Array†
† The GeneChip® Rat Genome 230 2.0 Array is a 64-format array.
Final Concentration
Fragmented cRNA 5 µg 15 µg 0.05 µg/µL
Control Oligo B2 (3nM) 1.7 µL 5 µL 50 pM
20X Eukaryotic Hybridization Controls (bioB, bioC, bioD and cre)
5 µL 15 µL 1.5, 5, 25, and 100 pM respectively
Herring Sperm DNA (10 mg/mL
1 µL 3 µL 0.1 mg/mL
BSA (50 mg/mL) 1 µL 3 µL 0.5 mg/mL
2X Hybridization Buffer 50 µL 150 µL 1X
DMSO 10 µL 30 µL 10%
H2O To final volume of 100 µL To final volume of 300 µL

16 ToxFX™ Analysis Suite User Manual
GeneChip Array Washing, Staining, and ScanningAfter 16 hours of array hybridization in the GeneChip® Hybridization Oven 640, the hybridization cocktail is removed from the array chamber and saved with the residual sample. Store at –20°C. Should the need arise, this sample can be rehybridized to a new GeneChip array. Arrays are then washed and stained using a GeneChip® Fluidics Station 400, 250 or 450.
Immediately after the washing and staining protocol, scan the arrays on the GeneChip® Scanner 3000 7G according to the GeneChip® Expression Analysis Technical Manual.
For details on array washing, staining and scanning, please refer to the section entitled “Eukaryotic Arrays: Washing, Staining, and Scanning” in the GeneChip Expression Analysis Technical Manual.
NOTE: After loading the GeneChip cartridge, some hybridization cocktailwill remain in the sample tube. This residual material should be stored at –20°C during array hybridization. After hybridization, it is recommendedremoving the hybridized sample from the array and returning it to theoriginal tube with the residual sample.
Table 3.5 Fluidics Scripts for ToxFX Supported GeneChip® Arrays
User-prepared hybridization, wash, and stain buffers
GeneChip® Hybridization, Wash, and Stain Kit
GeneChip Array FS400 FS250/450 FS400 FS250/450
Rat ToxFX 1.0 Array micro_1v1 micro_1v1_450 micro_1v1 FS450_0003
Rat Genome 230 2.0 Array EukGE-WS2v5 EukGE-WS2v5_450 EukGE-WS2v5 FS450_0001
NOTE: Additional information on fluidics scripts is available atwww.affymetrix.com/support/technical/fluidics_scripts.affx.
NOTE: We recommend scanning arrays within 8 hours. Batch processingsize may need to be adjusted to conform to this recommendation.

Chapte
r4 TOXFX DATA ANALYSISIntroductionAll data submitted for ToxFX™ analysis should meet the minimal Affymetrix recommended quality parameters as described in the Affymetrix® Data Analysis Fundamentals Guide (P/N 701190). The appropriate QC values are generated using the MAS5 summarization workflow (steps 1 and 2 in Figure 4.1) provided in either GCOS or the Expression Console software. Once data quality has been confirmed, preparation of the GeneChip data for ToxFX analysis (steps 3, 4, and 5 in Figure 4.1) is a two-part process and begins with the CEL files:
• The first part uses the Affymetrix® Expression Console™ Software to create summarized expression values (CHP files) from 3’ expression array feature intensity (CEL) files. The probe set Signal values represent relative gene level expression estimates.
• The second part uses the ToxFX™ Study Builder software to submit CHP files to the ToxFX analysis server, which generates the report.

18 ToxFX™ Analysis Suite User Manual
Figure 4.1 Data Analysis Workflow for the ToxFX™ Analysis
NOTE: Two QC steps are required for submitting a ToxFX study. The firststep requires CHP files generated using the MAS5 summarization algorithm.Users should follow the standard Affymetrix array QC guidelines describedin the Affymetrix Data Analysis Fundamentals Guide.
The second QC step requires CHP files generated using the PLIERsummarization algorithm in Expression Console software. This step isperformed in the ToxFX Study Builder Software immediately prior tosubmitting a study for analysis.
NOTE: The screen captures depicted in this chapter may not exactly matchthe windows displayed on your screen.
GCOS CEL File
Report File
ToxFX Report
ToxFX StudyToxFX Study Builder™
MAS5Summarization
Data QC
Prepare, QC, and Submit Study
Automated Report Generation
CHP File
Step 1
Step 2
Step 3
Step 5
ExpressionConsole™
PLIERSummarization CHP File
Step 4
chapter 4 | ToxFX Data Analysis 19
Minimal Hardware RecommendationsThe minimum hardware recommendations are:
• Processor: Single 1.5 GHz Intel® Pentium® processor or higher
• Memory (RAM): 1 GB or higher
• Hard Drive: 20 GB or larger (The program occupies 20 MB of disk space. Additional space will be required for users data requirements)
Software RequirementsThe ToxFX™ Study Builder software has specific requirements. These requirements include:
• Internet access to www.toxfx.com with the appropriate security settings to run the Java Web Start application and download the software.
• Windows 2000 service pack 4.0 or higher or Windows XP service pack 2.0 or higher.
• Microsoft Internet Explorer 6.0 service pack 1.0 or higher.
• Adobe Acrobat 6.0 or higher.
Required Software1. Affymetrix® Data Transfer Tool v1.1 or higher (required only for GCOS users)
2. Affymetrix® Expression Console™ software v1.0 or higher
3. ToxFX™ Study Builder software v1.0 or higher
GeneChip Array Quality ControlIt is recommended that all CHP files considered for submission meet the Affymetrix recommended quality parameters. For detailed discussion of QC best-practices, please refer to the Affymetrix® Data Analysis Fundamentals Guide (P/N 701190). This guide is available for download from www.affymetrix.com/support/downloads/manuals/data_analysis_fundamentals_manual.pdf.
IMPORTANT: The software uses https protocol via port 443. You mayneed to contact your system administrator to provide the requiredaccess.

20 ToxFX™ Analysis Suite User Manual
CHP File Generation Using Expression Console™ SoftwareThe Affymetrix Expression Console software takes CEL files produced in GCOS as inputs and creates CHP files as outputs. CEL files contain one intensity value per probe feature, while CHP files contain signal values that are summarizations of multiple features that measure the same transcript or pool of transcripts.
A detailed description on the Expression Console software, how to download the current version, and how to use it for data analysis, can be obtained at the following URL: www.affymetrix.com/products/software/specific/expression_console_software.affx. Please refer to the Expression Console Quick Start Guide for 3’ Expression Arrays for step-by-step directions on how to create CHP files.
IMPORTANT: For users using GCOS for instrument control and datacollection, CEL files must be copied to a location outside of the GCOSdatabase folder prior to creating CHP files using the Expression Consolesoftware. It is highly recommended that Data Transfer Tool (DTT) v1.1 beused to accomplish this task. For details on this process, please refer to theAffymetrix® GeneChip® Operating Software User’s Guide (P/N 701439).
Table 4.1 Analysis Configuration Settings in Expression Console
Select from the drop-down menu:Analysis → 3’ Expression → PLIER
Effective Settings
Background correction PM-MM
Normalization Quantile
Probe set summarization PLIER
NOTE: All CHP files that will be submitted together in the Study Buildershould be analyzed together in the Expression Console software. Thissimultaneous analysis ensures that a consistent probe affinity model andappropriate normalization are applied across the entire study.

chapter 4 | ToxFX Data Analysis 21
ToxFX™ Study Builder SoftwareThe ToxFX Study Builder software is a web-based application for defining a ToxFX study, submitting the gene expression data for analysis to the Iconix ToxFX server, and generating a ToxFX report. The primary goal of the user interface is to capture all the experimental parameters needed to configure the analysis and generate the report. All the experimental parameters captured during submission are displayed in the report to provide a detailed record of the study design.
The ToxFX Study Builder software has five major functionalities which are organized across a series of tabs (Figure 4.2):
• Study Panel – A study is composed of one or more experiments performed with a single compound on a single tissue. The Study Panel tab is intended to capture experimental parameters concerning the study design.
• Experiments – An experiment is defined as a single compound dose at a single exposure time. Thus, a study will typically be composed of multiple experiments each representing a single dose and time point. The Experiment tab allows an experiment to be created for each dose-time combination and the appropriate treatment and control CHP files to be associated with that experiment.
• Compound Chooser – The available compounds are found in the DrugMatrix database and provide additional context to the analysis. Up to three reference compounds can be selected.
• Quality Control – To determine the correlation between replicate arrays in the defined experiments, a data QC check must be performed prior to submitting a study for analysis. Outlier data files are highlighted in red. These files are excluded from the data analysis.
• Certificates – Each CHP file submitted as part of a study must be accompanied by a valid “Analysis Certificate”. For example, a study composed of 24 new arrays will require 24 certificates of analysis for submission.
This tab provides information on the number of Analysis Certificates available to the user and the number required for the submission of the current study. See Appendix D, Analysis Certificate Purchasing and Management for more detail on certificate purchasing and management. Additional analysis certificates can be purchased directly from Iconix Biosciences.
All the above described sections should be filled in before submitting a study for analysis. When filling in the study design information, it is intended that the user proceed through the tabs from left to right. A study can be saved at any time by clicking the Save Study button. Saved studies and other relevant files can be found in the Studies Library. Once all the sections necessary to define the study have been completed and the study
22 ToxFX™ Analysis Suite User Manual
data has passed QC, submit the data to the server by clicking the Submit Study button.
Software Installation and Removal
To Install the ToxFX Study Builder Software:
1. Go to www.toxfx.com using the Windows® Internet Explorer browser.
2. Register to become a ToxFX member.
An e-mail confirmation of registration will be sent.
3. Inside the e-mail click the link to verify your membership. You will then be automatically logged in and taken to the ToxFX software download page.
4. A window appears indicating that the application is downloading. The first time you use the application, it will take a few minutes to install.
5. The software will be deployed via Java Web Start as included in J2SE 5.0.
6. A ToxFX Study Builder shortcut icon will be added to your desktop if you accept the option.
To Uninstall the Software:
1. Copy or move the folder C:\Documents and Settings\username\ToxFx\packages to another location. This folder contains the results, including reports and data archives, from all previous ToxFX Study Builder submissions.
2. Delete the folder C:\Documents and Settings\username\ToxFx.
3. Delete the ToxFX shortcut icon on the desktop if present.
NOTE: The Study Builder accepts CHP files produced by the ExpressionConsole software. Although the Study Builder will accept CHP filesgenerated by other software using the PLIER algorithm, the ToxFX analysishas only been validated with CHP files produced by Expression Consolesoftware.
NOTE: Local Windows administrative privileges are required for initialsoftware installation.
chapter 4 | ToxFX Data Analysis 23
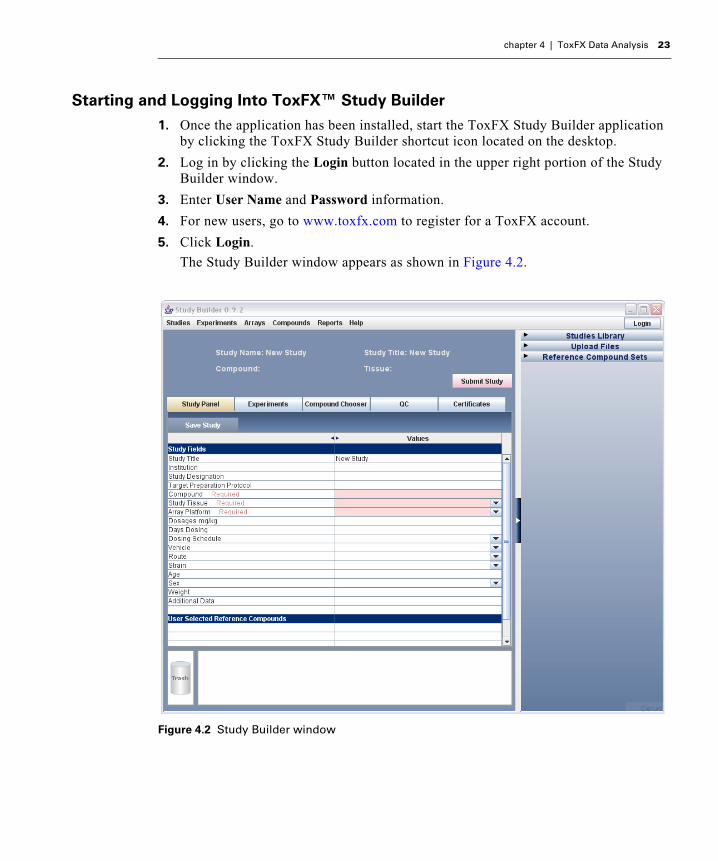
Starting and Logging Into ToxFX™ Study Builder
1. Once the application has been installed, start the ToxFX Study Builder application by clicking the ToxFX Study Builder shortcut icon located on the desktop.
2. Log in by clicking the Login button located in the upper right portion of the Study Builder window.
3. Enter User Name and Password information.
4. For new users, go to www.toxfx.com to register for a ToxFX account.
5. Click Login.
The Study Builder window appears as shown in Figure 4.2.
Figure 4.2 Study Builder window
24 ToxFX™ Analysis Suite User Manual
Building a Study in ToxFX Study Builder
Study Panel TabA study comprises all the arrays, annotations and reference data associated with a single compound in vivo study. The Study Panel is the page where all the experimental information surrounding the study design is captured.
1. Enter information in the fields either by typing in the text or using the provided drop-down menus. Note that some fields that provide drop-down choices can be over-written by typing the desired information directly into the field.
2. Information entered in the red fields (Compound, Study Tissue, and Array Platform) is required to determine which signatures and pathways will appear in the Report. The remaining fields are not used for any calculations but are an aid for record keeping.
3. The information entered appears in the Study Summary and Executive Summary sections of the Report.
4. Accurate record keeping of all the experimental conditions adds significantly to the value of a study, so users are encouraged to fill in the fields as completely as possible.
NOTE: Only the fields in red are required to be filled in. All other fieldsare optional. We recommend that as many fields as possible be filled into track the experimental variables.
NOTE: Dose and Time information cannot be entered into the fields onthe Study tab. This information is automatically populated when data iscollected on the Experiment tab.
NOTE: A Study can be saved at any stage by clicking the Save Studybutton. In future sessions, the study icon can be dragged from theStudies Library bar and dropped into the Study Panel to populate thefields.
A study can be deleted by dragging it into the Trash .
The progress box at the bottom of the window will show the programstatus and messages.

chapter 4 | ToxFX Data Analysis 25
Experiments TabA study consists of a number of experiments, where each experiment represents a single time and dose. Each experiment must contain a minimum of two control and treatment replicates; if this replicate minimum requirement is not met, the study will be rejected. However, three or more control and treatment replicates in a study is highly recommended.
Create a New Experiment:
1. Click the New Experiment button.
2. A new window opens.
3. Fill in the Dose and the Time for the experiment and click Save.
4. To load the CHP files, click the Upload Files bar (top right of the window) in the Data File Tree. Only CHP files will be displayed in this panel of the Data File Tree.
5. The file browser opens.
6. Browse to the location of the files.
7. Once the CHP files are located, they can be dragged and dropped into the experiment table. Care must be taken to ensure that the control and treatment files are dropped into the Controls and Treatments sub-panels of the Experiments panel respectively.
8. Files can be removed from either the Treatments or Controls sub-panels by selecting the file and dragging it to the Trash located in the lower left corner of the window.
NOTE: Up to 15 experiments can be created for different time points anddoses of the same compound.
NOTE: CHP files must be created using Affymetrix Expression ConsoleSoftware using the PLIER summarization algorithm. CHP files generatedusing MAS 5.0 or any other third party software are not validated for usewith the ToxFX Study Builder software.
NOTE: When a folder (directory) is opened for the first time in a session,the program reads the header information of all the CHP files. If a foldercontains a large number of CHP files it may take a few minutes for thefolder to open.
NOTE: When dragging and dropping, the color of the window willmomentarily change to green if the action is allowed. If the window turnsred, the operation is not allowed and an explanation will appear in theStatus Box at the bottom of the window.

26 ToxFX™ Analysis Suite User Manual
9. The different experiments that exist within the study can be reviewed by clicking the Experiments List button.
The Study Builder window now appears as shown in Figure 4.3.
IMPORTANT: Do not rename CHP files. Renamed files will not appear inthe browser. To rename files, rename the CEL files and re-run the analysisfor all files in the study in the Expression Console software. ExpressionConsole analysis requires simultaneous analysis of all arrays in the studyto ensure consistent probe affinity models and normalization.
NOTE: Once the study has been submitted the data file tree pathassociated with the CHP files is stored in the client machine. If these CHPfiles are moved or renamed, the files may not appear in the directory orthe Quality Control operation will produce an error.
Figure 4.3 Study Builder window

chapter 4 | ToxFX Data Analysis 27
Compound Chooser TabThe Compound Chooser panel allows the user to search for specific compounds that can be used as a reference for comparison to the test compound using a variety of filters. The user is able to select up to 3 compounds from the reference database of 316 compounds. The user can select the compounds based upon their classification. The classifications are based upon classical toxicological observations such as histopathology or clinical chemistry. Alternatively, a text search can be used.
Selecting Compounds by Classification Type Using the Compound Chooser
1. Select the appropriate tissue choice from the tissue drop-down menu located at the upper right of the Compound Chooser panel. The default is liver.
2. Select the classification type of interest in the left-most column. The following classifications are available:
• Activity Class
• Blood Chemistry and Hematology
• Histopathology
• Literature Annotation
• Molecular Pharmacology
• Organ Weight
• Structure Activity Class
3. Compound sub-classes are displayed in the center column.
4. Select the sub-classification type of interest.
5. The list of compounds associated with that classification appears in the right-most column (Figure 4.4).
NOTE: Since compound effects are tissue-specific, the list of referencecompounds available for inclusion in a study depends on the tissue selectedin the drop-down box in the upper-left-hand corner of the CompoundChooser panel.

28 ToxFX™ Analysis Suite User Manual
6. To use one of the compounds as a reference, drag and drop the compound name of interest into the box directly above the right-most column of the Compound Chooser.
7. To remove unwanted compounds, select the compound and click the Clear Selected button.
8. When the final compound selection is complete, click the Use In Study button.
9. Up to 3 reference compounds are allowed. Selected compounds will be displayed at the bottom of the Study Panel tab.
Filters
To find compounds matching two or more classification categories, the filter functionality can be used. Follow the steps below to find compounds of interest that are found in the intersection of two different classes or sub-classes.
1. Select the first classification type of interest in the left-most column.
2. If a subclass is of interest, select that from the middle column.
3. Click the Add Filter button found directly above the Compound Chooser.
4. In an identical manner, use the Compound Chooser to find the second classification type of interest.
Figure 4.4 Compound List
Figure 4.5 Add Filter button

chapter 4 | ToxFX Data Analysis 29
5. Only compounds that meet the criteria of both the first category and the second category will now be displayed in the right-most column. The parameters of the current filter are displayed in the Status Box at the bottom of the window.
6. The filter can be removed by clicking Reset Filter.
7. The previously used filter can be used by clicking Previous Filter.
Selecting Compounds Using the Text Search Option in the Compound Chooser
1. Select the appropriate tissue choice from the tissue drop-down menu located at the upper right of the Compound Chooser panel. The default is liver.
2. Select the Text Search option at the top of the left-most column.
3. Type the search string of interest into the text search box that appears in the middle column. Wild-card characters are supported.
• For example, to find the complete list of statin family members, “*stat” could be entered in the text search window.
4. The results are dynamically filtered as the text is typed in.
5. To use one of the compounds as a reference, drag and drop the compound name of interest into the box directly above the right-most column of the Compound Chooser
6. To remove unwanted compounds, select the compound and click the Clear Selected button.
7. When the final compound selection is complete, click the Use In Study button
8. Up to 3 reference compounds will be allowed. Selected compounds will be displayed at the bottom of the Study Panel tab.
Figure 4.6

30 ToxFX™ Analysis Suite User Manual
Saving Reference Compound Sets
Once a set of reference compounds has been selected, the set can be saved for future use.
1. Click the Save Set button.
2. A pop-up window will appear requesting a name for the Compound Set.
3. Enter a name and click Save.
4. The Compound Set appears in the window on the right.
5. Compound Sets that are no longer needed can be dragged and dropped into the trash bin at the bottom left of the page.
Quality Control TabA quality control step is required before any data can be submitted for ToxFX analysis. This step focuses only on the reproducibility of the biological replicates and is in addition to the recommended GeneChip® quality control parameters. During the QC step, the concordance between experimental replicates is assessed using a Pearson’s correlation test. A CHP file whose correlation to other experimental replicates falls below a threshold of r2 = 0.8 is considered to be an outlier.
The QC process
1. Click the Quality Control tab.
2. Confirm that the study organization is correct. If a CHP file has been mislabeled as a control or treatment, return to the Experiment tab to correct the problem.
3. Click the Run QC button.
4. Failed treatments and controls will be highlighted with a red background behind the experiment row.
Figure 4.7
chapter 4 | ToxFX Data Analysis 31
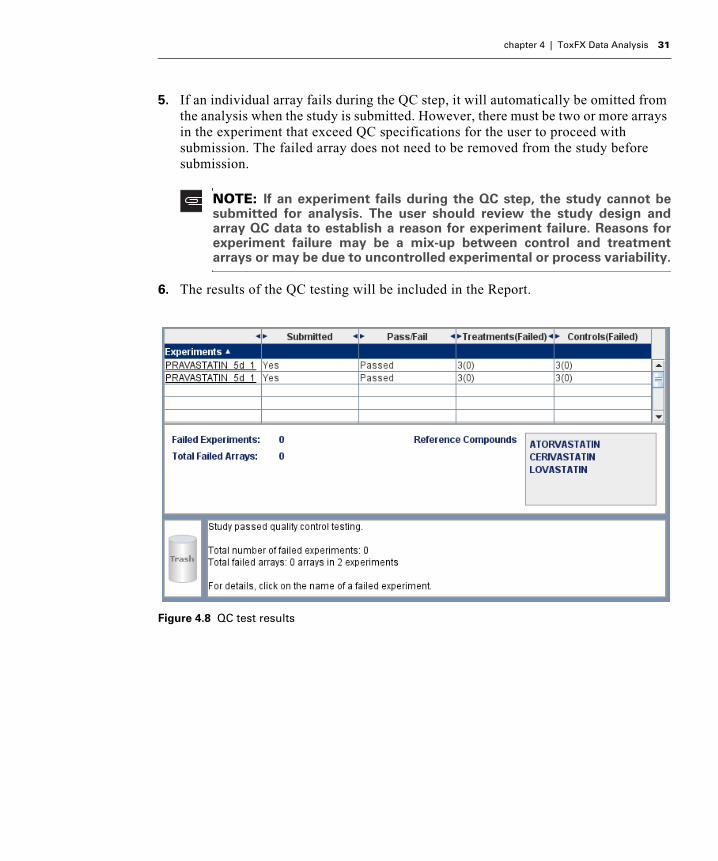
5. If an individual array fails during the QC step, it will automatically be omitted from the analysis when the study is submitted. However, there must be two or more arrays in the experiment that exceed QC specifications for the user to proceed with submission. The failed array does not need to be removed from the study before submission.
6. The results of the QC testing will be included in the Report.
NOTE: If an experiment fails during the QC step, the study cannot besubmitted for analysis. The user should review the study design andarray QC data to establish a reason for experiment failure. Reasons forexperiment failure may be a mix-up between control and treatmentarrays or may be due to uncontrolled experimental or process variability.
Figure 4.8 QC test results

32 ToxFX™ Analysis Suite User Manual
Certificates TabThe Certificates tab will display the number of certificates required for submission of the currently defined study. It also provides a record of the number of available certificates in the users account. Login is required to access the certificate balance information. The Login button is located in the upper right corner.
1. Click the Certificates tab.
2. Click the Check button found in the left to verify the number of certificates available.
3. The required number of certificates for the currently defined study and the number of available certificates is displayed at the bottom of the Certificates panel.
4. Additional certificates may be purchased if there are not enough available. Refer to Appendix D, Analysis Certificate Purchasing and Management for more information on purchasing and managing certificates.
Study Submission1. Verify that all the entered data are correct.
2. Click the Submit Study button.
3. If not already logged into the ToxFX server, the user will be prompted to do so at this time.
4. Enter the Username and Password information.
5. Click Login.
6. The study is submitted and the necessary certificates are debited from the user's account.
7. Within several minutes the report is generated and displayed using Adobe Acrobat Viewer.
8. The report is saved on the local computer in the file path C:\Documents and Settings\username\ToxFX\packages.
9. The reports folder can be accessed by going to the Reports pull-down menu and selecting Reports Directory.
NOTE: When a study is submitted, the data is sent over the internet tothe Iconix analysis server. An active internet connection is required tocomplete this step.

chapter 4 | ToxFX Data Analysis 33
Data OutputThe ToxFX analysis is intended to generate and present data in a consistent manner. As a result, data generated from different compounds and/or from different studies can be directly compared. This key feature is extremely valuable; for example, one or more compounds from a series may be prioritized for advancement during lead optimization based on the comparison of their safety profiles in addition to their pharmacological properties.
The ToxFX analysis data is returned to the user in two forms:
• ToxFX Report – A major benefit to the ToxFX analysis is the synthesis of a final comprehensive report that is ready to be shared with members of the project team. No additional time is required for summarization of the analysis results.
• ToxFX Data Archive – All data underlying the tables and figures of the ToxFX Report are returned in a compressed archive. This allows access to the data from multiple reports either by directly parsing or otherwise combining multiple datasets using a variety of commonly available tools.
ToxFX Data Location Following successful analysis of a ToxFX study, the report and data archive are automatically saved to the following folder:C:\Documents and Settings\username\ToxFx\packages\
Figure 4.9 Accessing reports
NOTE: A study can only be submitted if there are sufficient numbers ofcertificates available for the entire study.
34 ToxFX™ Analysis Suite User Manual
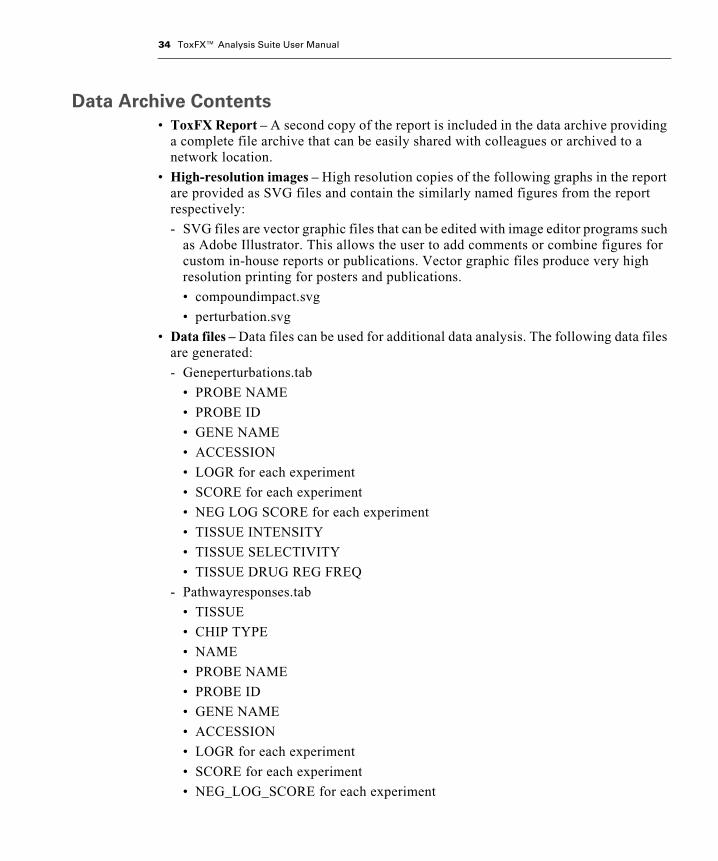
Data Archive Contents• ToxFX Report – A second copy of the report is included in the data archive providing
a complete file archive that can be easily shared with colleagues or archived to a network location.
• High-resolution images – High resolution copies of the following graphs in the report are provided as SVG files and contain the similarly named figures from the report respectively:
- SVG files are vector graphic files that can be edited with image editor programs such as Adobe Illustrator. This allows the user to add comments or combine figures for custom in-house reports or publications. Vector graphic files produce very high resolution printing for posters and publications.
• compoundimpact.svg
• perturbation.svg
• Data files – Data files can be used for additional data analysis. The following data files are generated:
- Geneperturbations.tab
• PROBE NAME
• PROBE ID
• GENE NAME
• ACCESSION
• LOGR for each experiment
• SCORE for each experiment
• NEG LOG SCORE for each experiment
• TISSUE INTENSITY
• TISSUE SELECTIVITY
• TISSUE DRUG REG FREQ
- Pathwayresponses.tab
• TISSUE
• CHIP TYPE
• NAME
• PROBE NAME
• PROBE ID
• GENE NAME
• ACCESSION
• LOGR for each experiment
• SCORE for each experiment
• NEG_LOG_SCORE for each experiment

chapter 4 | ToxFX Data Analysis 35
• TSCORE
• ABS TSCORE
• INTENSITY
• SELECTIVITY
• SELECTIVITY
• DRUG REG FREQ
• DESCRIPTION
- Signatureresponses.tab
• SIGNATURE_NAME
• SIGNATURE_ID
• MAX_PROBABILITY
• PROBABILITY for each experiment
• PROBABILITY for each reference compound

36 ToxFX™ Analysis Suite User Manual

Chapte
r5 THE TOXFX REPORTIntroductionThe ToxFX Report formats the expression data provided by the user and represents it in context with the data in the DrugMatrix® database. This section describes the report content and how it can be applied.
An example of a report is available at www.toxfx.com.
Using the ReportThe Report is organized to reflect the natural progression of a scientific analysis: from a global overview to increasingly detailed, and ultimately gene-level, information. The high-level overview will be useful to an executive, the signatures and the pathways are intended for toxicologists, while the supplementary data can be used as a starting point for additional detailed analysis. Every figure features a text box with a guide to interpretation. In the guide, the user is first directed to the most pertinent information, then to additional information for a more detailed interpretation and follow-up investigation.
Contextual Data InterpretationThe underlying philosophy throughout the Report is to represent data relative to the biological responses of the 316 well-characterized drugs in the DrugMatrix reference database. This represents a distinct advantage over a typical statistical analysis where the importance of a significant gene expression change is unknown. For example an observed, statistically significant, change may be elicited by a broad assortment of drug treatments and may not be indicative of a specific response. The reference database enables such common changes to be distinguished from responses specific to toxicology or pathology of the compound of interest. This knowledge substantially increases and improves the information derived from a single study.

38 ToxFX™ Analysis Suite User Manual
Aside from defining the structure of the study, the ToxFX analysis does not require decisions to be made with regards to the analysis parameters, such as selecting statistical thresholds. This provides a number of benefits:
• Data input is simplified
• The data in different ToxFX Reports can always be directly compared
• Analysis is always unbiased
Report ContentThe Report is divided into the following discrete sections: • Executive summary – The executive summary is an abstract summarizing the most
important findings of the study. It is restricted to a single page allowing the reader to very quickly formulate an understanding of the main findings of the study.
• Table of Contents – All sections of the report are indexed with page numbers.
• Study Description and Study Summary – The Study Description and Study Summary pages present an overview of the experimental parameters provided by the user. This information provides a record of how the study was conducted and simplifies the comparison of different Reports.
• Relative Impact on Transcription – Achieving an appropriate dose capable of eliciting a robust gene expression response is critical to the success of a toxicogenomic study. By comparing the number of observed gene expression perturbations to the distribution of gene expression perturbations measured for all drugs represented in the DrugMatrix reference database, the user very quickly gains an understanding of the validity of the chosen dosing regimen.
• Drug Signatures – These biomarkers provide rapid predictions of key toxicological endpoints usually measured by a variety of classical toxicology assays such as histopathology and blood chemistry.
• Pathways – Mechanistic information on compound action and off-target effects is available in custom-annotated pathways.
• Cytochrome P450 Families – Given the importance of the P450 genes to toxic response, 62 members of the P450 family are presented in a single table for easy access to this critical information.
• Most Consistent Gene Expression Changes – A variety of tables providing the most consistently up- and down-regulated genes provide a starting point for additional in-depth analysis.
NOTE: Throughout the Report, words such as treatment (a single samplefrom a single animal), experiment (a single-tissue-dose-time set of biologicalreplicate samples and their associated vehicle controls) and study (a groupof experiments) have specific usage. Definitions are provided in the Glossaryof the Report Appendix and in the online Help.

chapter 5 | The ToxFX Report 39
• Supplementary Information –
- Signatures – Detailed background information on each Drug Signature is provided including an estimate of the sensitivity and specificity of the signature, how the signature was derived and what drugs within the database exhibit strong matches to the signature.
- Pathways – Detailed information on changes detected in pathways of key toxicological interest is provided. Extensively annotated pathway maps are provided for each pathway to aid data interpretation.
- Replicate Reproducibility Check – The results of the concordance QC step are documented for easy review.
- Appendix – Details on ToxFX study design, analysis methodologies and data interpretation are provided.
More details on these sections are provided below and in the on-line help. To access the on-line help, click on the Information icon on the bottom right of any page in the section. If you only have access to a printed copy of the Report, the online help is available at www.toxfx.com.
Relative Impact on Transcription An important part of the experimental design is to verify if the dosing of the test compound was appropriate. The number of genes perturbed is a gross level measure of the impact of the test compound on the gene transcription. The figure titled Relative Impact on Transcription displays the number of genes whose transcription levels are perturbed by the test compound in comparison to the reference compounds in the DrugMatrix database. Ideally the test compound at the MTD should perturb the expression levels of greater than 25% of genes so that a robust interpretation can be made. If significantly fewer gene expression changes are observed, the compound was most likely under-dosed. In this situation we would recommend a review of the dose selection data to verify that the compound achieved MTD levels. Should your data show that MTD was achieved, and the number of gene expression changes is small, then compound safety may already be indicated and you should expect to see very few transcriptional signs of pathological/toxicological events.
Transcriptional Pattern Matching with Drug Signatures The classification method used within DrugMatrix is based on a linear classification algorithm (Natsoulis et al. 2005) termed SPLP (SParse Linear Programming) (El Ghaoui et al. 2003). This classifier is able to rapidly interpret the data from up to 30,000 genes because it looks for specific patterns or signatures in the data. A Drug Signature classifier consists of a list of weighted genes that can contribute to the understanding of the biology associated with the classification phenotype (Natsoulis et al. 2005). The classification phenotypes for which the Drug Signatures are derived are traditional parameters such as histopathology, clinical chemistry, and organ and body weights.

40 ToxFX™ Analysis Suite User Manual
These traditional toxicology measurements were collected from compound treated rats in parallel to expression profiling at the time that the DrugMatrix reference database was generated (Ganter, 2005).
These measurements identify drugs and treatment conditions which cause specific kinds of toxicity and, thus, serve to identify treatments that are positive for a particular phenotype. This is considered to be the positive class. Other treatments that do not exhibit any indication of this particular phenotype, and are therefore considered negative treatments, are assigned to the negative class. Together, the gene expression patterns in the positive and negative classes constitute the training set. The classification algorithm identifies gene expression changes that are strongly associated with the phenotype of interest; that is, distinguishes the positive sample set from the negative sample set. These genes with their associated expression levels constitute a Drug Signature®. Once identified, the Drug Signatures can be applied to predict, from the expression pattern, the likelihood that a traditional toxicological endpoint would occur in rats dosed with a new compound not contained in the training set. Since many of these gene expression patterns are evident earlier than the endpoint phenotype, the likelihood for a particular toxic response can be predicted earlier than when using traditional toxicology assays.
The degree to which the gene expression profile of a given drug dose-time treatment matches a Drug Signature is reported using the posterior probability score (PPS). The PPS is derived from the distribution patterns in the positive and negative training sets. If the value of the PPS for the compound under study is near 1, there is high confidence that the compound treatment matches the expression pattern of the phenotype described by the signature. Conversely, if the probability is near 0, a match is very unlikely. Values near 0.5 indicate that there is an equal probability that the treatment does or does not match the expression pattern of the reference treatments.
Two thresholds are recommended when interpreting the Drug Signature output. Values of 0.75 and above are considered likely matches because the pattern is three-fold more likely to match the pattern than not match the pattern. Likewise, values of 0.9 indicate that it is 9-times more likely to match the pattern, and thus would be considered a very strong match.

chapter 5 | The ToxFX Report 41
Table 5.1 Drug Signatures covered in the ToxFX Report
Tissue: Liver Kidney Heart
Signatures by Tissue 29 15 11
Adrenergic agonist ♦
Bile Duct Hyperplasia ♦
Cholesterol biosynthesis inhibitor ♦ ♦
Cardiac cellular infiltration ♦
Cardiac myocyte degeneration ♦
DNA damager ♦
DNA intercalator, anthracycline-like ♦
Erythrocyte count increase ♦
Estrogen receptor agonist ♦
Estrogen receptor alpha binding ♦
Glucocorticoid and mineralocorticoid receptor agonist ♦ ♦ ♦
Heart weight increase ♦
Hepatic eosinophilia, centrilobular ♦
Hepatic eosinophilia, early gene expression ♦
Hepatic fibrosis ♦
Hepatic hypertrophy, centrilobular ♦
Hepatic inflammatory infiltrate, centrilobular ♦
Hepatic inflammatory infiltrate, early gene expression ♦
Hepatic lipid accumulation, centrilobular ♦
Hepatic lipid accumulation, macrovesicular ♦
Hepatic lipid accumulation, microvesicular, centrilobular ♦
Hepatic lipid accumulation, periportal ♦
Hepatic necrosis ♦
Hepatocellular hypertrophy, diffuse ♦
Hepatomegaly ♦

42 ToxFX™ Analysis Suite User Manual
Hypoalbuminemia ♦ ♦
Leukocytosis, early gene expression ♦
Leukopenia ♦
Lymphocytosis ♦
Lymphopenia ♦ ♦ ♦
Nephromegaly ♦
Neutrophilia ♦ ♦
Non-DNA reactive antiproliferative agent ♦
Peroxisome proliferator ♦ ♦ ♦
Pregnane X receptor activation ♦
Renal tubular necrosis ♦
Renal tubular nephrosis ♦
Renal tubular proteinaceous cast ♦
Renal tubular regeneration ♦
Renin-angiotensin-aldosterone inhibitor ♦
Serum alanine aminotransferase increase ♦
Serum bilirubin and alkaline phosphatase increase ♦
Thyroperoxidase inhibitor ♦
Toxicant, DNA alkylator ♦ ♦
Toxicant, heavy metal-like ♦
Table 5.1 Drug Signatures covered in the ToxFX Report (Continued)
Tissue: Liver Kidney Heart
Signatures by Tissue 29 15 11
chapter 5 | The ToxFX Report 43
Pathways There are 22 pathways analyzed in detail as part of the ToxFX analysis. These pathways are specifically designed to help users better understand, at the molecular level, the mechanism of pharmacologic action and toxicity, connecting regulatory and metabolic processes with physiological or toxicological responses. The curation of the provided pathway maps includes information ascertained from both Iconix experimentation as well as in-depth literature review of the subject area. Peer-reviewed articles from Science, Nature, Nature Review Drug Discovery, Nature Medicine, Cell, and Cell Metabolism provide the basis for the background information provided in the text summaries.
To provide important context and perspective to the pathways from a toxicological perspective, the ToxFX Analysis Suite pathway analysis highlights:
• Known targets for drug interaction within each pathway
• General background information and guidance to key elements

44 ToxFX™ Analysis Suite User Manual
Different Pathways for Different Tissues Table 5.2 summarizes the pathways that are displayed for each of the tissues.
Table 5.2 Pathways for Each Tissue Type in the ToxFX Report
Tissue: Liver Heart Kidney
Pathways by Tissue 21 17 15
• Xenobiotic Metabolism ♦ ♦ ♦
• Aryl Hydrocarbon Receptor Signaling ♦ ♦ ♦
• Apoptosis ♦ ♦ ♦
• Hepatic Stellate Cell Activation & Fibrosis ♦
• Angiotensin II & Cardiac Hypertrophy ♦
• Hepatic Steatosis ♦
• Hepatic Cholestasis ♦
• Cholesterol Biosynthesis ♦
• Beta-Oxidation of Fatty Acid ♦ ♦ ♦
• Fatty Acid Biosynthesis & its Regulation ♦ ♦ ♦
• Acute Phase Response ♦ ♦ ♦
• LPS & IL-1 Mediated Inhibition of RXR Function ♦
• NF-kappa B Signaling ♦ ♦ ♦
• TGF-beta Signaling ♦ ♦ ♦
• Nrf2 Mediated Oxidative Stress Response ♦ ♦ ♦
• Hypoxia and HIF Signaling ♦ ♦ ♦
• ELF2 Kinase Mediated Stress Response ♦ ♦ ♦
• p53 Signaling ♦ ♦ ♦
• Cell Cycle G1/S Transition ♦ ♦ ♦
• Cell Cycle G2/M Transition ♦ ♦ ♦
• Mitochondrial Oxidative Phosphorylation ♦ ♦ ♦
• Thyroid Hormone Synthesis, Regulation & Release ♦ ♦

chapter 5 | The ToxFX Report 45
Summary - Pathway Responses Compared to DrugMatrix®
For easy interpretation, the overall impact of the compound treatment under investigation for all toxicological pathways relevant to the tissue is provided in a single figure. The figure includes a variety of information that together enables the user to quickly elucidate potential mechanisms-of-action and identify pathways of key interest for further follow-up.
The effect of the compound on each pathway is assessed based on two different metrics:
• Maximum Pathway Impact (using Fisher’s Exact test): The number of up and down regulated genes in the pathway and the total number of genes in the pathway are displayed in the first three columns. This data is used to compute the Fishers exact statistic. This statistic, indicates whether the number of regulated genes is more than the number that would be expected by chance given the p-value for change, p < 0.01 in this case.
• Relative Pathway Response: The magnitude of overall gene expression changes detected in a given pathway is estimated by taking the sum of the absolute fold-change values for all genes in the pathway. To provide context to the measured response, it is compared to all tissue-matched drug treatments in DrugMatrix. A value within the 90th percentile would indicate that the magnitude of the gene changes for any particular pathway induced by the query treatment is greater than 90% of all the drug-dose-time treatments in DrugMatrix. This is considered a significant change. Conversely, a value of less than the 90th percentile would not be considered to be a major event as this is frequently seen in DrugMatrix. The bar chart inset shows the maximum impact among the various dose-time combinations submitted by the user
Greater than two stars in the Fisher’s exact column (p < 0.01) AND an impact factor above the 90th percentile warrants consideration as a significant finding. Other findings may be significant but occur too often to warrant detailed follow-up, unless some other evidence, from this report or through prior knowledge from the investigator, suggests that the finding is significant.
Supplementary Information Pathway Tables and FiguresThe Pathway Tables and Figures displayed in the Supplementary Information section of the ToxFX Report enable the user to further investigate and understand at the molecular level the pathway response across all genes related to a given pathway (e.g., Fatty Acid Biosynthesis and its Regulation). For each treatment condition defined in the study, the table displays the expression level changes detected for all genes in the pathway and highlights those changes that meet a pre-chosen statistically significance threshold (p < 0.01 when comparing the treatment and control groups).
NOTE: Our experience suggests that the maximum impact is more revealingabout the probable mechanism of toxicity than the individual impact factors.
46 ToxFX™ Analysis Suite User Manual
To aid in interpreting the impact of the detected gene level changes, additional information describing how frequently these genes are transcriptionally perturbed by the reference compounds contained in the DrugMatrix database is provided. These additional data are critical in distinguishing between common, generic changes and rare, specific changes.
• Tissue Intensity – The Tissue Intensity value is derived from the ranking of probe intensities within the tissue under investigation. The metric displays the log10 normalized signal intensity values for each probe set on the GeneChip® Rat ToxFX 1.0 or GeneChip® Rat Genome 230 2.0 Arrays, sorted in ascending order. Probes are grouped by quartile, with High (H) being the top quartile of intensity values, Medium (M) being the median two quartiles of intensity values, and Low (L) the bottom quartile of intensity values.
• Tissue Selectivity – A probe set is labeled as selective for the tissue that has the highest signal intensity among the 8 tissues used to create this body map. The difference between the intensity in that tissue and the next highest tissue must also exceed a pre-defined threshold. A more detailed description of this index is provided in the on-line help. If a transcript does not get annotated with a tissue label or the tissue intensity is low (L) in all tissues the annotation will be Ubiquitous (U).
• Drug Regulation Frequency – The Drug Regulation Frequency (DRF) is the percent of DrugMatrix experiments in which the gene was either up- or down-regulated by a statistically significant amount within a given tissue. It is calculated by counting all dose-time-tissue combinations where the average log10 normalized Signal of the treated group is significantly different (p < 0.05) from the vehicle controls. The 10th and 90th percentiles are annotated as H (high) and L (low) respectively. Frequencies falling between these extremes are annotated as M (medium).
• DRF Interpretation – A high drug regulation frequency (DRF) indicates that the gene in question is commonly perturbed by compound treatments. Perturbation of a gene with a high DRF is generally not considered significant unless the magnitude of the response is extreme or this gene is co-regulated with other genes in a pathway (i.e., a single gene regulation is not as significant as the regulation of several pathway genes). A low DRF indicates that the gene might be uniquely or unusually perturbed by an experimental treatment. These “rarely regulated genes” may therefore be useful biomarkers of compound exposure.

chapter 5 | The ToxFX Report 47
Replicate Reproducibility CheckThe Replicate reproducibility check represents Pearson’s correlation coefficients between all the arrays in the study. Iconix’ experience has shown that including poorly correlating arrays in a replicate set may lead to erroneous conclusions. A Pearson's correlation of less than 0.8 usually indicates a technical problem. Examples of technical problems include:
• poorly processed samples (RNA isolation or cRNA preparation)
• mislabeled samples or files
• array hybridization or scanning problems
Poor correlations may potentially occur due to a very high level of biological variability from heterogeneous responses to compound exposure, but our experience indicates that this is very unusual.

48 ToxFX™ Analysis Suite User Manual
Appendix
A LABORATORY PROTOCOLSAnimals (Rats)• Crl:CD®(SD)|GS BR (Charles River Laboratories, Wilmington, MA)
• Age 6 to 8 weeks
• Weight 200 to 260 g
Animal Housing Conditions
Animals should be acclimatized for 5 to 7 days and found to be healthy prior to the start of dosing. Standard animal laboratory guidelines should be adhered to regarding environmental conditions. We have had good success with Certified Rodent Diet #5002 food; (PMI Feeds Inc.), distilled water, standard bedding quality, day-night cycle with 12 hours of light starts at 6:00 AM and ends at 6:00 PM, temperature maintained at 22 ± 3 °C, and humidity maintained between 30 and 70%.
Animal Sacrifice and Necroscopy
Animals are sacrificed after 1 day, 3 days, and 5 days of treatment or longer if desired. All animals are sacrificed 24 hours after the administration of the last dose between the hours of 7:00 AM and 12:00 PM. Animals are euthanized at sacrifice by exsanguination under CO2/O2 anesthesia.
Necropsy of each rat in the study should be completed within 30 minutes of sacrifice. To obtain sufficient total RNA for analysis, it is recommended that 100 mg samples of the following tissues be collected with a sterile 6mm biopsy punch and frozen in 4 mL cryovials.
• Liver (medial lobe)
• Kidney
• Heart (left side)
Collected samples are flash frozen in liquid nitrogen and stored at –80°C.

50 ToxFX™ Analysis Suite User Manual

Appendix
B STUDY DESIGNAppropriate dose selection is critical for the success of the experimental study. High dose experiments usually result in large numbers of gene expression changes. These changes are potentially associated with pathological effects and are typically most informative of a compound’s potential toxic off-target effects. This can be significantly different from low dose experiments that usually result in sub-pathological exposures and may reveal more information on compound-specific mechanism-of-action and pharmacology. In Iconix’ experience, these low doses are less informative about toxicology but can provide useful insights if pharmacological questions are of interest. As a result, it is recommended that a ToxFX study design incorporates the following two doses:
• The Fully Effective Dose (FED) or therapeutic dose
• The Maximum Tolerated Dose (MTD) or high/toxic dose
Determining the Fully Effective DoseThe fully effective dose (FED) is defined as the dose that is found to yield the maximum response in an animal model of the disease for which the drug is targeted. This is usually determined by a thorough review of available literature. In the absence of published data from Sprague-Dawley rat studies, body-weight scaled data from studies in other animals are considered in this order:
1. Other rat strains
2. Other rodent species
3. Other mammals
4. Humans
In the absence of any data on biological effect or for compounds that are classified as toxicants or chemicals, the low dose is set at 1/10th of the MTD.
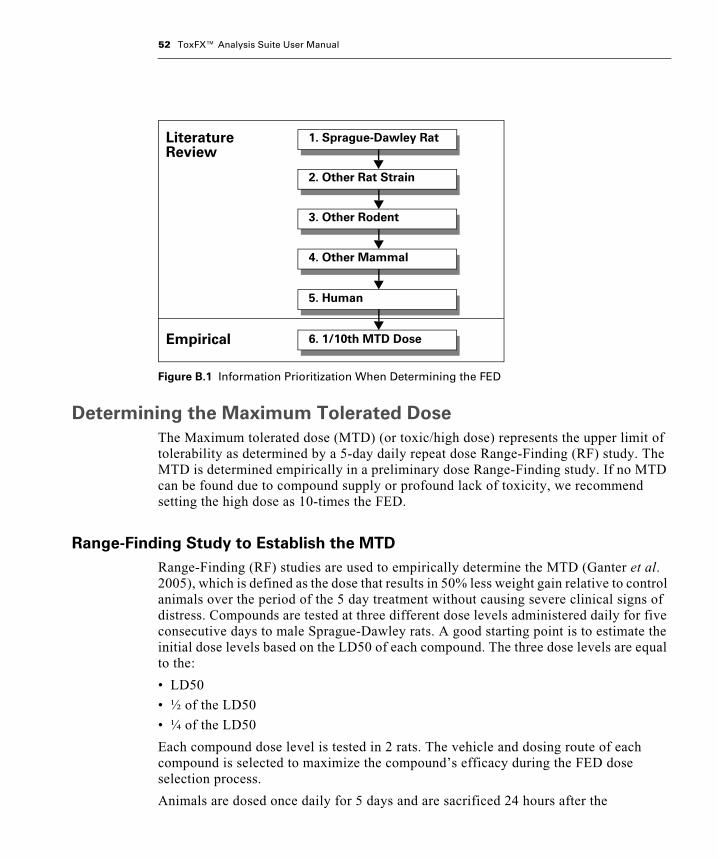
52 ToxFX™ Analysis Suite User Manual
Determining the Maximum Tolerated DoseThe Maximum tolerated dose (MTD) (or toxic/high dose) represents the upper limit of tolerability as determined by a 5-day daily repeat dose Range-Finding (RF) study. The MTD is determined empirically in a preliminary dose Range-Finding study. If no MTD can be found due to compound supply or profound lack of toxicity, we recommend setting the high dose as 10-times the FED.
Range-Finding Study to Establish the MTDRange-Finding (RF) studies are used to empirically determine the MTD (Ganter et al. 2005), which is defined as the dose that results in 50% less weight gain relative to control animals over the period of the 5 day treatment without causing severe clinical signs of distress. Compounds are tested at three different dose levels administered daily for five consecutive days to male Sprague-Dawley rats. A good starting point is to estimate the initial dose levels based on the LD50 of each compound. The three dose levels are equal to the:
• LD50
• ½ of the LD50
• ¼ of the LD50
Each compound dose level is tested in 2 rats. The vehicle and dosing route of each compound is selected to maximize the compound’s efficacy during the FED dose selection process.
Animals are dosed once daily for 5 days and are sacrificed 24 hours after the
Figure B.1 Information Prioritization When Determining the FED
1. Sprague-Dawley Rat
2. Other Rat Strain
3. Other Rodent
4. Other Mammal
5. Human
6. 1/10th MTD Dose
LiteratureReview
Empirical
appendix B | Study Design 53
administration of the last dose. If the MTD is not found due to excessive toxicity (e.g., mortality or severe suppression of weight gain in the low dose group), the RF study should be repeated at lower dose levels. If the MTD is not found due to an absence of toxicity (e.g., no suppression of weight gain even in the high dose group), the RF study should be repeated at higher dose levels.
Choosing a Compound VehicleWe recommend that the vehicle used for studies be the same as the dose vehicle used in literature described studies that establish the FED. However, your experience with the compound(s) under investigation may be used. High exposure, bioavailability, and minimal animal-to-animal variation are clearly main goals of the vehicle selection criteria.
Time Point SelectionThe selection of appropriate time points is an equally critical parameter. Varied time points are required in order to ensure that gene expression changes are evident. The more time points that are included in the study, the higher the likelihood that informative gene expression changes will be captured and identified by the ToxFX analysis.
For a study intended to use limited amounts of compound but still provide useful toxicological data, we recommend a minimum of 3 days of dosing. In our experience, dosing regimes under one day rarely yield reliable data regarding toxicological liabilities.
Replicates and Study SizeOur standard study protocol recommends a minimum study size of 2 doses, the MTD and the FED, and two time points, 3 and 5 days along with time and vehicle paired dose controls (24 arrays total: 2 doses, 2 time points each with matched controls, and all in biological triplicate). Although, the ToxFX Study Builder software will minimally accept 2 doses and 2 controls, we do not recommend this configuration.

54 ToxFX™ Analysis Suite User Manual

Appendix
C TOXFX ANALYSIS SUITE COMPATIBLE ARRAYSThe following Affymetrix GeneChip® Arrays are compatible with ToxFX Analysis Suite:
• GeneChip® Rat ToxFX 1.0 Array
• GeneChip® Rat Genome 230 2.0 Array
NOTE: The content of the GeneChip® Rat ToxFX 1.0 Array is a sub-set of theGeneChip® Rat Genome 230 2.0 Array. The features and specifications closelymatch the GeneChip® Rat Genome 230 2.0 Array.
Table C.1 Critical Specifications for ToxFX Compatible Arrays
Rat ToxFX 1.0 Rat 230 2.0
Number of probe sets 2,073*
* Identical subset of probe sets as found on the Rat Genome 230 2.0 Array.
31,042
Feature size 11 µm 11 µm
Oligo probe length 25mer 25mer
Probe pairs/sequence 11 11
Control sequences included:Hybridization controlsPoly-A controlsNormalization controlsHousekeeping controls
bioB, bioC, bioD and credap, lys, phe, thr
N/AGAPDH, beta-Actin, Hexokinase 1
bioB, bioC, bioD and credap, lys, phe, thr100 probes sets
GAPDH, beta-Actin, Hexokinase 1
Detection sensitivity 1:100,000†
† As measured by detection of pre-labeled transcripts from mouse cDNA clones in a complex rat background.
1:100,000†

56 ToxFX™ Analysis Suite User Manual

Appendix
D ANALYSIS CERTIFICATE PURCHASING AND MANAGEMENTSubmission of data to the DrugMatrix database and the ToxFX analysis server is managed through the use of Analysis Certificates. An Analysis Certificate allows a single array to be submitted as part of a study. Generally 6 or more certificates will be needed in order to generate the ToxFX Report, the final number required being dependent on the size of the study. The ToxFX analysis is included in the purchase of the GeneChip® Rat ToxFX 1.0 Array. The analysis software will recognize this array type and allow the appropriate analysis.
The general characteristics of the Analysis Certificates are as follows:
• One Analysis Certificate per new array is required to generate a report.
• Certificates are only consumed when the data are submitted and a successful report is created.
• Each certificate allows data from a Treatment array to be submitted twice in any experimental combination of treatment or control designation.
• Arrays designated as controls can be submitted an unlimited number of times with a single certificate. (See Management of Certificates for Control Data for more information.)
• Purchased certificates expire one year after issue.
• Certificates are stored in the user’s account. The number of certificates required for the analysis and the number available are displayed in the ToxFX Study Builder software.
Analysis of GeneChip® Rat ToxFX 1.0 ArraysEach GeneChip® Rat ToxFX 1.0 Array sold by Affymetrix includes the ToxFX analysis; the data generated on the array can be submitted twice in any experimental combination. The ToxFX Study Builder software automatically recognizes and registers the array when the data is submitted. As a result, Analysis Certificates are not debited from the user’s account for the first two submissions of Rat ToxFX 1.0 Array data.
If the array CHP file data requires more than two submissions, the appropriate number of Analysis Certificates must be available in the user’s account. An exception is for array

58 ToxFX™ Analysis Suite User Manual
data that was designated as a control; these arrays may be included as a part of many studies so long as the control designation is maintained.
Analysis of GeneChip® Rat Genome 230 2.0 ArraysEach GeneChip® Rat Genome 230 2.0 Array contained in a study requires an Analysis Certificate to generate a report; unlike the Rat ToxFX 1.0 Array, the analysis is not included with the purchase of the Rat Genome 230 2.0 Array. An analysis certificate used to submit Rat 230 2.0 data allows the data to be submitted twice in any experimental combination. An exception is for array data that was designated as a control; following the initial submission which requires an Analysis Certificate, these arrays may be included repeatedly as a part of many studies without additional Analysis Certificate requirements so long as the control designation is maintained.
Management of Certificates for Control DataIt is a common practice to use the same vehicle controls for different treatment doses. Care should be taken to reduce experimental variability between the control group and different treatment groups as much as possible. To facilitate this type of design, CHP files designated as controls can be resubmitted an unlimited number of times.
Certificate OrderingContact Iconix Sales at (650-567-5500) to speak with a sales representative. First-time customers are required to set up a customer account. Depending on the order and institution, Iconix may need to establish credit terms with your institution to complete the purchase.
A purchase order number from your corporate purchasing department is required to complete the order. Upon completion of the order, Iconix Sales will provide a Certificate Access Code by e-mail within one business day.
Depositing Certificates Into a User AccountEach user of the certificates must register at the ToxFX web site (www.toxfx.com) and enter the Certificate Access Code into their user profile. This will activate the certificates for use with the ToxFX analysis. An e-mail confirmation will be sent to the user reporting that the certificates have been successfully deposited.
NOTE: A Certificate Access Code represents a pool of certificates and can beshared among several individuals. Please specify if you would like yourcertificates to be divided into several pools for different individuals ordepartments.
appendix D | Analysis Certificate Purchasing and Management 59
Checking CertificatesCertificates can be checked by logging into the ToxFX Study Builder software using your web site login name and password. The certificate account balance will be displayed after the Check button is clicked under the Certificates tab of the user interface.

60 ToxFX™ Analysis Suite User Manual
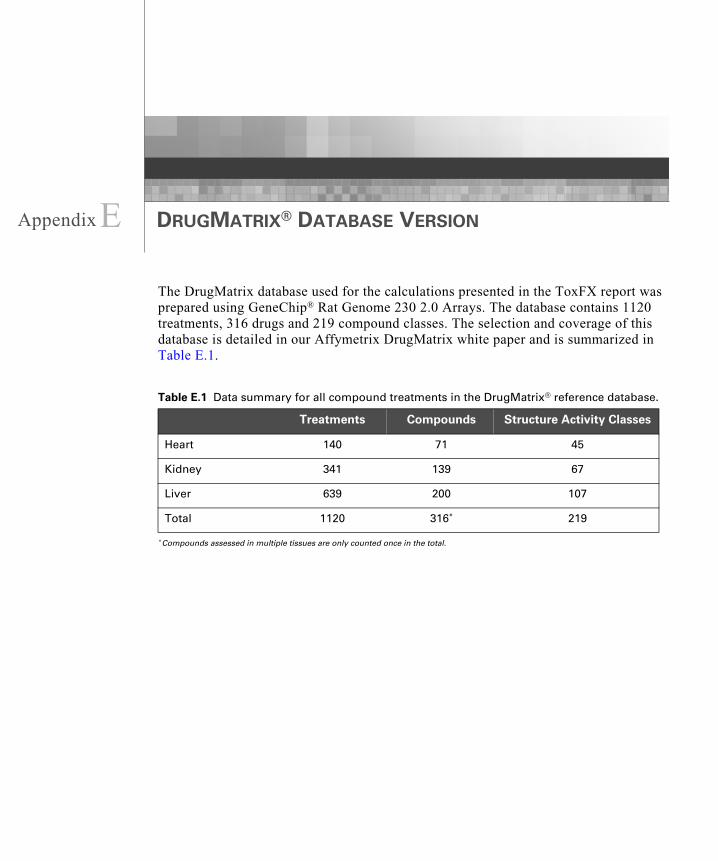
Appendix
E DRUGMATRIX® DATABASE VERSIONThe DrugMatrix database used for the calculations presented in the ToxFX report was prepared using GeneChip® Rat Genome 230 2.0 Arrays. The database contains 1120 treatments, 316 drugs and 219 compound classes. The selection and coverage of this database is detailed in our Affymetrix DrugMatrix white paper and is summarized in Table E.1.
Table E.1 Data summary for all compound treatments in the DrugMatrix® reference database.
Treatments Compounds Structure Activity Classes
Heart 140 71 45
Kidney 341 139 67
Liver 639 200 107
Total 1120 316*
* Compounds assessed in multiple tissues are only counted once in the total.
219

62 ToxFX™ Analysis Suite User Manual

Appendix
F REFERENCESReferencesAlizadeh, A.A., D.T. Ross, C.M. Perou, and M. van de Rijn. 2001. Towards a novel classification of human malignancies based on gene expression patterns. J Pathol 195: 41-52.
Boorman, G.A., P.E. Blackshear, J.S. Parker, E.K. Lobenhofer, D.E. Malarkey, M.K. Vallant, D.K. Gerken, and R.D. Irwin. 2005. Hepatic gene expression changes throughout the day in the Fischer rat: implications for toxicogenomic experiments. Toxicol Sci 86: 185-193.
Brown, M.P., W.N. Grundy, D. Lin, N. Cristianini, C.W. Sugnet, T.S. Furey, M. Ares, Jr., and D. Haussler. 2000. Knowledge-based analysis of microarray gene expression data by using support vector machines. Proc Natl Acad Sci U S A 97: 262-267.
Califano, A., G. Stolovitzky, and Y. Tu. 2000. Analysis of gene expression microarrays for phenotype classification. Proc Int Conf Intell Syst Mol Biol 8: 75-85.
El Ghaoui, L., G.R.G. Lanckriet, and G. Natsoulis. 2003. Robust classifiers with interval data. Report # UCB/CSD-03-1279.
Furey, T.S., N. Cristianini, N. Duffy, D.W. Bednarski, M. Schummer, and D. Haussler. 2000. Support vector machine classification and validation of cancer tissue samples using microarray expression data. Bioinformatics 16: 906-914.
Ganter, B., R.D. Snyder, and M.D. Lee. submitted. Toxicogenomics in drug discovery and development - early assessment of drug safety and efficacy - Mechanistic analysis of compound (or class) dependent effects. Pharmacogenomics.
Ganter, B., S. Tugendreich, C.I. Pearson, E. Ayanoglu, S. Baumhueter, K.A. Bostian, L. Brady, L.J. Browne, J.T. Calvin, G.J. Day, N. Breckenridge, S. Dunlea, B.P. Eynon, L.M. Furness, J. Ferng, M.R. Fielden, S.Y. Fujimoto, L. Gong, C. Hu, R. Idury, M.S. Judo, K.L. Kolaja, M.D. Lee, C. McSorley, J.M. Minor, R.V. Nair, G. Natsoulis, P. Nguyen, S.M. Nicholson, H. Pham, A.H. Roter, D. Sun, S. Tan, S. Thode, A.M. Tolley, A. Vladimirova, J. Yang, Z. Zhou, and K. Jarnagin. 2005. Development of a large-scale chemogenomics database to improve drug candidate selection and to understand mechanisms of chemical toxicity and action. J Biotechnol 119: 219-244.

64 ToxFX™ Analysis Suite User Manual
Golub, T.R., D.K. Slonim, P. Tamayo, C. Huard, M. Gaasenbeek, J.P. Mesirov, H. Coller, M.L. Loh, J.R. Downing, M.A. Caligiuri, C.D. Bloomfield, and E.S. Lander. 1999. Molecular classification of cancer: class discovery and class prediction by gene expression monitoring. Science 286: 531-537.
Natsoulis, G., L. El Ghaoui, G.R. Lanckriet, A.M. Tolley, F. Leroy, S. Dunlea, B.P. Eynon, C.I. Pearson, S. Tugendreich, and K. Jarnagin. 2005. Classification of a large microarray data set: algorithm comparison and analysis of drug signatures. Genome Res 15: 724-736.
Raychaudhuri, S., J.M. Stuart, and R.B. Altman. 2000. Principal components analysis to summarize microarray experiments: application to sporulation time series. Pac Symp Biocomput. 455-466.

Appendix
G GLOSSARYGlossary
Accession Accession numbers from the GenBank® database (NIH database of all publicly available DNA sequences) for query gene. (www.ncbi.nlm.nih.gov/Genbank/GenbankOverview.html)
Analysis Certificate Permits submission of data from a single array for analysis. Analysis Certificates are “virtual”; no physical certificate is provided. These certificates can be purchased and tracked at www.toxfx.com.
Ave Signal Intensity The average normalized signal intensity of a probe set when measured across all of the arrays in a control or treatment group.
C prefix Prefix appended to the CHP file name, providing a control array designation.
Certificate See Analysis Certificate.
Confidence Interval The range of values for the log10 expression ratio that lay within a number of standard errors (e.g., 99.5% probability for 2.8 standard errors).
Drug Regulation Frequency (DRF)
This metric provides a high-level representation of a gene’s frequency of regulation by all DrugMatrix Extension treatments profiled in a given tissue. The DRF indicates whether the gene of interest is frequently perturbed, or whether it is generally not perturbed in response to compound exposure. Details of the DRF calculation are given in the ToxFX Manual and online help www.toxfx.com.
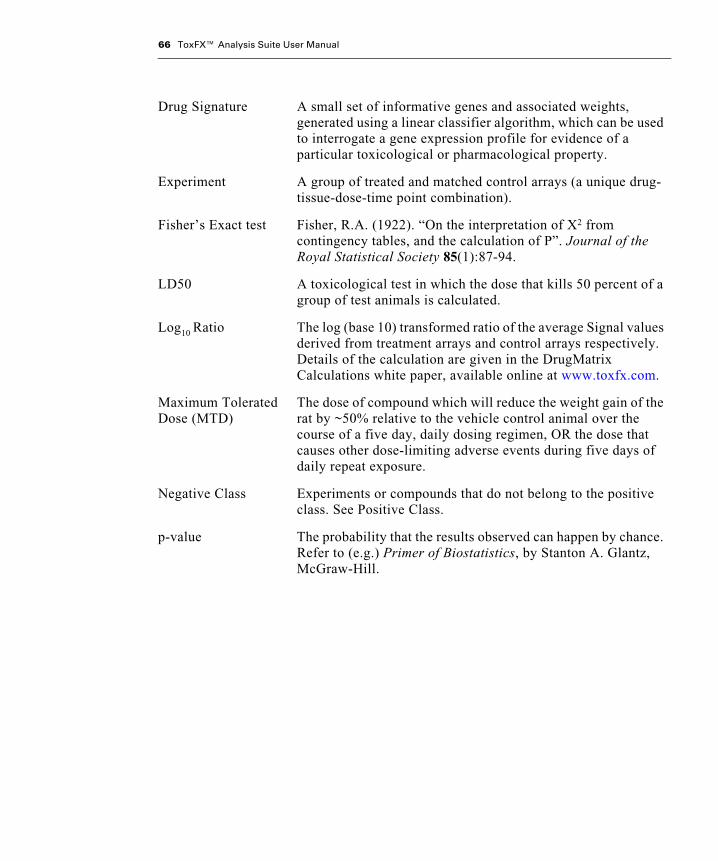
66 ToxFX™ Analysis Suite User Manual
Drug Signature A small set of informative genes and associated weights, generated using a linear classifier algorithm, which can be used to interrogate a gene expression profile for evidence of a particular toxicological or pharmacological property.
Experiment A group of treated and matched control arrays (a unique drug-tissue-dose-time point combination).
Fisher’s Exact test Fisher, R.A. (1922). “On the interpretation of X2 from contingency tables, and the calculation of P”. Journal of the Royal Statistical Society 85(1):87-94.
LD50 A toxicological test in which the dose that kills 50 percent of a group of test animals is calculated.
Log10 Ratio The log (base 10) transformed ratio of the average Signal values derived from treatment arrays and control arrays respectively. Details of the calculation are given in the DrugMatrix Calculations white paper, available online at www.toxfx.com.
Maximum Tolerated Dose (MTD)
The dose of compound which will reduce the weight gain of the rat by ~50% relative to the vehicle control animal over the course of a five day, daily dosing regimen, OR the dose that causes other dose-limiting adverse events during five days of daily repeat exposure.
Negative Class Experiments or compounds that do not belong to the positive class. See Positive Class.
p-value The probability that the results observed can happen by chance. Refer to (e.g.) Primer of Biostatistics, by Stanton A. Glantz, McGraw-Hill.
appendix G | Glossary 67
Pathway DrugMatrix Pathways are curated by Iconix scientists to reflect current scientific understanding of key biological processes and their regulation. Pathways curated and selected for DrugMatrix and ToxFX are relevant to the drug discovery process. They are helpful in deciphering mechanistic information to understand the development of pathological endpoints. Relevant metabolic, signal transduction, and regulatory pathways are included. In addition to illustrating the genes and proteins involved in a specific process, DrugMatrix pathways illustrate the complex relationships between the genes/proteins in a cellular and/or physiological context and the biological outcomes from such relationships. Genes on each pathway are mapped, where possible, to probes on the microarray platforms supported by DrugMatrix.
Pearson’s Correlation Coefficient
Pearson’s correlation measures the degree of linear relationship between two variables. Ranges are from +1 to -1. A correlation of +1 indicates a perfect linear relationship with a slope of +1. A correlation of -1 indicates a perfect linear relationship with a slope of -1. A value of 0 is random and indicates poor linear correlation
Positive Class The Drug Signature training class that contains the experiments that define the characteristic of interest. The characteristic may be a phenotype (e.g., necrosis), chemical class (e.g., NSAID) or pharmacological similarity (e.g., binding to a particular receptor).
Probe set A collection of oligonucleotides attached to the surface of an Affymetrix GeneChip array which together are used to measure transcript abundance.(www.affymetrix.com/support/help/glossary/probe_set.jsp).
Replicate set A replicate set is a group of different animals treated under identical dose-time-compound conditions. Replicate set is not a synonym for “experiment” which refers to a set of treatment replicates ratioed against control replicates.
Scalar Product (SP) The sum of the weighted expression values for a query treatment across the genes comprising a Drug Signature, plus the bias term. For details, refer to the Drug Signature White paper, available online to ToxFX users at www.toxfx.com.

68 ToxFX™ Analysis Suite User Manual
Score A valuation measure specific to the measurement in question. For expression it is the p-value of the measurements (i.e., the log10 ratio and its standard error). For signature matches it is posterior probability measurement of match strength.
Sequence The nucleotide sequence of the gene or the amino acid sequence of the gene product.
Signature See Drug Signature.
Significantly perturbed genes
Genes whose expression levels are increased or decreased with a p-value < 0.05 among the biological replicates within a treatment group.
SPLP The SParse Linear Programming classification algorithm used to derive Drug Signatures. The SPLP algorithm limits the number of probes that comprise the derived Drug Signature (El Ghaoui et al., 2003).
Standard Error The standard deviation divided by the square root of the number of observations. (Primer of Biostatistics, by Stanton A. Glantz, McGraw-Hill)
Study Group of experiments performed with a given compound.
T prefix Prefix appended to the CHP file name providing a Treatment array designation.
Tissue Intensity The Tissue Intensity is derived from the ranking of probe intensity within each tissue. For each tissue, log10 normalized signal intensity values for each probe is sorted in ascending order. Probes are grouped by quartile with High (H) being the top 25% of intensity values, Medium (M) being the middle two quartiles of intensity values, and Low (L) being the bottom quartile of intensity values.
Tissue Selectivity Tissue Selectivity is derived from the tissue selectivity index (TSI), and indicates whether a given gene is preferentially expressed in a particular tissue. Please refer to the DrugMatrix Calculations white paper, available to ToxFX users online at www.toxfx.com, for more details on this calculation.
Treated arrays Arrays hybridized to target derived from tissue from animals dosed with a test compound
Treatment Treatment condition = drug-tissue-dose-time